Article

Quantification of Expected Return of Investment in Wood Processing Sectors in Slovakia

1
Department of Economics, Management and Business and Technology, Faculty of Wood Sciences, Technical University in Zvolen, T.G. Masaryka 24, SK-960 01 Zvolen, Slovakia
2
Faculty of Forestry and Wood Technology, University of Zagreb, Svetošimunska Cesta 23, 10000 Zagreb, Croatia
*
Author to whom correspondence should be addressed.
Forests 2024, 15(1), 75; https://doi.org/10.3390/f15010075
Submission received: 10 November 2023 / Revised: 12 December 2023 / Accepted: 28 December 2023 / Published: 29 December 2023
(This article belongs to the Special Issue Ecosystem Services and the Forest Economy)

Abstract

:
The study focuses on the selected aspects of investment measurement and management for the support of financial and economic decision-making of investors in wood-processing sectors. The aim of the study was to analyze the indicators for the structure and cost of capital of furniture and paper/forest branches in Slovakia, quantify the actual expected return on investment based on the selected methodology, and consequently find out the fundamental differences resulting from the specific conditions of given sectors. Methodologically, the study uses procedures for the weighted average cost of capital (WACC), capital asset pricing model (CAPM) for determining the cost of equity, and calculation of the beta coefficient considering the risk premium. The results of the study demonstrated a similar levered beta in both analyzed sectors (1.17 in furniture, 1.20 in paper/forest), but in each sector for a different reason. The expected rate of return is higher in furniture (7.84%) compared to paper/forest products at the level of 6.04%. The findings provide the possibility of comparing the required and expected rate of return on invested capital and making the appropriate long-term investment decisions.

1. Introduction

Investment performance measurement is the quantification of the results achieved by an investment activity. It starts with the calculation of return, and the particular return calculation techniques are required to recognize and isolate the effects of investor and manager decisions on performance [1]. Investment decision-making is one of the fundamental parts of business management, and a company needs to apply appropriate methods for measuring and managing business performance. Theoretical fundamentals for the valuation of investment effectiveness are well described according to Levy and Sarnat, 1986; Ward et al., 1996; Renkema and Berghout, 1997; Brealey and Myers, 2003; Baum and Hartzell, 2012 [2,3,4,5,6]. While discounted cash flow valuation is only one of the three ways of approaching the valuation of an investment, it is the foundation on which all other valuation approaches are built [7]. One of the key inputs in discounted cash flow analysis, based on the conversion of future values to the present value, is the discount rate.
In corporate finance, the discount rate is the minimum rate of return necessary to invest in a particular project or investment opportunity. The discount rate reflects the necessary return on the investment, given the riskiness of its future cash flows. The discount rate is often called the opportunity cost of capital [8,9,10], i.e., the hurdle rate used to guide decision-making around capital allocation and selecting worthwhile investments. The discount rate estimates an investment’s risk and potential returns—so a higher rate implies greater risk and more upside potential.
The forest land and forest stands in Slovakia have been increasing for a long time. According to Forest Europe (2020) [10], Slovakia is the 13th most forested among 43 European states and has a higher forest cover than the average of Europe (34.8%), EU-28 (38.3%), and all regions, except for Northern Europe. Currently, the forests of Slovakia have historically the highest wood stocks, at least for the last hundred years. The highest hectare wood supply, at 254.6 m3, is located in Central-Eastern Europe. According to the Green Report (2021) [11], Slovakia, with a value of 279.2 m3, exceeds the average hectare of wood stocks of all European regions. As stated in the Green Report (2020) [12], up to 17.1% more carbon is stored in them than in 1990. This ranks Slovakia among the best-rated countries in Europe in terms of carbon storage per 1 hectare of forest. According to data from Green Report (2021) [11], the contribution of the forestry and wood-processing sector to the Slovak GDP of 2.61% far exceeds the average contribution of all European regions, and in the ranking of individual countries, it is the fourth highest after Latvia (4.5%), Estonia (4.26%), and Finland (4.22%). The wood-processing industry in Slovakia is currently in a difficult situation, but there are still possibilities for better investment management and the potential for a positive impact on the performance of companies [13]. Quantitative analysis at the level of the wood-processing industry confirmed the significant impact of investment on the growth of sales and productivity; the subsequent analysis of the structure of value added showed a strong correlation between wages and value-added growth [14]. Also, according to several economic indicators, productivity growth and wages, the paper sector appears to be a sector with potential for the Slovak economy. For the stated reasons, we considered it relevant and important to set Slovakia as the focus of the research.
Despite the industry’s strengths in terms of forest cover, wood stocks, carbon stocks, and contribution to Slovakia’s GDP, the industry is undercapitalized and has created high investment debt over many years. The measurement and management of public or corporate investments in these sectors are not given sufficient attention for various reasons. Academic research on investment measurement and management in forest-based sectors in Slovakia is very limited. The mentioned facts—the importance and significance of the industry, and in contrast, the long-term investment debt and the lack of research studies that would provide relevant information on the given topic—were the main motivations for our research. The aim of the study was to analyze the selected indicators for the structure and cost of capital of wood-processing branches in Slovakia, quantify the actual expected return on investment based on the selected methodology, and consequently find out the fundamental differences resulting from the specific conditions of given sectors. The findings should serve as the starting point for the long-term financial and economic decisions of potential investors in wood-processing enterprises in Slovakia.
Based on the set objective, we formulated the following research questions (RQs):
  • RQ 1: What are the values of the expected return on investment in the investigated sectors?
  • RQ 2: Are there significant differences in the expected return on investment in the studied industries?
  • RQ 3: What are the fundamental causes of the differences in the expected return on investment?
Despite the growing number of investment measurement and decision-making studies in other countries or industries, there are still research gaps for Slovakia, especially in forest-based industries. Answering the research questions RQ1–QR3 will effectively fill the defined research gap and provide the necessary data, information, and knowledge that prevent adequate managerial decision-making on investments in the investigated sectors.
This study is organized as follows. Section 2 presents a brief literature review; Section 3 exposes the material and methodology; Section 4 is dedicated to the results and discussion; and Section 5 formulates the conclusions, recommendations, and policy implications.

2. Literature Review

When considering an investment, the rate of return an investor should reasonably expect to earn depends on the returns on comparable investments with similar risk profiles. In financial markets with high uncertainties, the trade-off between maximizing expected return and minimizing the risk is one of the main challenges in modeling and decision-making [15]. The first quantitative study of the impact of company capital structure on its financial indicators was performed by Modigliani and Miller (1958) [16]. Before 1958, the traditional approach, based on empirical data analysis, was used. Robust optimization has reached great importance as a modeling framework for immunizing against parametric uncertainties, and the integration of uncertain data is of considerable importance for the model’s reliability of a highly interconnected system [17]. Savku and Weber (2018) [18] studied a stochastic optimal control problem and illustrated their results with a problem of optimal consumption from a cash flow with delay and regimes. Özmen, Kropat, and Weber (2017) [17] presented a numerical example to demonstrate the efficiency of robust regression methods for regulatory networks. The approach in the model of robust optimization problem includes the use of conditional value-at-risk under uncertainty, based on parameters of uncertainty in the prices and a risk-return analysis, while the numerical experiment and a comparison application contained real-world data from stock markets [15]. There are several approaches to determining the discount rate for investment decisions (described in, e.g., [8,19]) based either on the capital market or on the capital structure of the company. The average cost of capital can be the basis for determining the discount rate. The model of the weighted average capital cost (WACC) is used to determine the discount rate based on the calculation of the cost of capital obtained from various sources. The use of the WACC model requires determining the cost of debt as well as the cost of equity. To calculate the cost of equity, it is possible to use the risk premium model derived from the capital asset pricing model (CAPM), which considers not only the variability of the company’s own profits but also the profitability of other companies, including the beta coefficient. The CAPM model, built on the work of Markowitz (1952, 1959) [20,21], was introduced independently by Jack Treynor (1961, 1962), William F. Sharpe (1964), John Lintner (1965), and Jan Mossin (1966) [22,23,24,25,26] referred to as the beginning of the asset pricing theory, resulted in the Nobel Prize for Sharpe, Markowitz, and Merton Miller in 1990. Several decades later, the CAPM is still widely used in applications, such as estimating the cost of equity capital for firms and evaluating the performance of investment, often the only asset pricing model taught in MBA-level investment courses [27]. The model explains the linear relationship between the systematic risk coefficient, beta, and expected stock returns (Wang et al., 2017; Anjum and Rajput, 2021; and Taussig, 2022) [28,29,30]. The basic concept of the CAPM is a metric that explains expected excess return, beta risk, and the market risk premium by calculating the difference between an asset’s return and the risk-free rate (Anuno, Madaleno, and Vieira, 2023) [31]. Therefore, beta risk is generally estimated using a linear regression model (Yamaka and Phadkantha, 2021) [32]. Theoretical fundamentals for determining parameters in CAPM and current values for countries and regions describe Damodaran (2012) [7], Fama and French (2006) [33], Scholleová (2009) [9], and Klieštik (2008) [34]. Fama and French (2015) [35] proposed a five-factor model, which has been internationally tested (Fama and French, 2017) [36], and their studies were an important contribution to the development of a multifactor model for asset valuation. The inclusion of a momentum factor was proposed by Fama and French (2018) [37] as an extension of a six-factor model used to assess investment risk. In addition, after more than two decades, the Fama–MacBeth cross-sectional factor was used, originally introduced by Fama and MacBeth (1973) [38] in the context of a time series model developed in the field of asset price research (Fama and French, 2020) [39]. Wang and Chen (2023) [40], in contrast to previous studies primarily relied on linear regression methods, which analyze a limited number of factors, proposed a novel dynamic CAPM that leverages mainstream machine learning algorithms. This innovation is among the first applications of machine learning techniques to asset pricing research. From the perspective of investors, the beta coefficient is the exposure of an asset (or security) to systematic risk and determines whether it is more or less volatile than the market as a whole. The most frequent use-case of beta coefficient in corporate finance is the CAPM, in which beta is a critical component of calculating the cost of equity—i.e., the required rate of return for equity investors. Investment decision-making should be regarded in each business entity as crucial for long-term prosperity. An acquired decision affects the company’s performance and its competitiveness for a long time. If a competent investor is interested in making a qualified investment decision, he must primarily determine the time and risk factors [41]. The beta coefficient is an integral component of the CAPM model that quantifies the relationship between systematic risk and the expected return. Systematic risk is inherent to public equities rather than impacting just one specific company (e.g., global pandemics and recessions). Systematic risk is often called market risk; these risks cannot be mitigated through portfolio diversification, unlike unsystematic risk. However, systematic risk is the market risk that cannot be diversified away. As a result, the market will require higher potential returns and more compensation for assuming systematic risk (which increases the cost of equity). Unsystematic risk is also called company-specific risk (or industry-specific risk) since the risk can be reduced with effective portfolio diversification. Examples of unsystematic risks are supply chain issues and legal settlements that impact a single company. Since unsystematic risk is company-specific and can be diversified away, especially if the portfolio contains investments in a wide range of industries with different traits, unsystematic risk is ignored in the CAPM model.
Investors should have precisely determined their expectations regarding the return on capital invested. The models of WACC and CAPM allow investors to quantify the expected rate of return, considering the specifics of a particular industry, compare it with the required return on investment, and make the right investment decisions. The methods we have chosen for our work are relevant and commonly used in studies in this research area. The WACC model assumed constant for the project’s life, is usually based on target weights for debt and equity; it is widely used, while other asset pricing models are not, and the discount rate is reviewed regularly and updated as conditions change [42]. Babusiaux and Pierru (2001) [43] describe the methodological basis for the use of WACC in their work. The investment CAPM emerges as a leading asset pricing paradigm [44]. The standard capital asset pricing model (CAPM) is simple, intuitive, and grounded in sound economic theory [45]. Survey evidence suggests that many investors form beliefs about future stock market returns by extrapolating past returns. Barberis et al. (2015) [46] found that the extrapolative CAPM captures many features of actual prices and returns; importantly, it is also consistent with the survey evidence on investor expectations. The paper of Hung (2008) [47] examines the relative performance of the higher-moment CAPM market models and the CAPM in explaining realized returns and predicting one-period-ahead returns on individual stocks and portfolios of momentum, size, and country sorts. Vendrame, Guermat, and Tucker (2018) [45] describe a conditional model that is compatible with the standard CAPM while remaining simple and accessible to both researchers and practitioners. The study of Da, Guom, and Jagannathan (2012) [48] justifies the continued use of the CAPM by firms despite the mounting evidence against it based on the cross-section of stock returns with empirical support. Authors argue that the empirical evidence against the CAPM based on stock returns does not invalidate its use for estimating the cost of capital for projects in making capital budgeting decisions. According to Chen (2021) [49], CAPM is an influential paradigm in financial risk management. It formalizes mean-variance optimization of a risky portfolio given the presence of a risk-free investment such as government bonds, and it defines the price of financial assets according to the premium that the investors demand for bearing the risk. CAPM is perhaps the most renowned example of asset pricing models, owing to its theoretical simplicity and ease of interpretation (de Andrade and Laurini, 2023) [50].

3. Materials and Methods

The chapter describes the regional breakdown, industrial groups, data sources, used databases, methods, and procedures applied in the results. The regional breakdown of countries is presented in Table 1. It is important to emphasize that Slovakia, which is the focus of the study, is not included by default in the European group but is among the emerging markets. This different inclusion, e.g., compared to the Czech Republic, affects the value of the risk-taking beta coefficient.
Industrial sectors categorized according to methodology Damodaran (2022c) [51] were the following in the study: Furniture/Home Furnishings, Paper/Forest Products, Total Market, and Total Market (without financials).
Data on the yield of 10-year government bonds, as well as average interest rates of commercial banks from loans for business (non-financial) units, were drawn from the database of the National Bank of Slovakia [52,53].
Methodologically, the study uses procedures for the weighted average cost of capital (WACC) and capital asset pricing model (CAPM) to determine the cost of equity and calculate the beta coefficient considering the risk premium. The weighted average cost of the capital (WACC) calculation was determined using the formula (Modigliani and Miller, 1958) [16]:
W A C C = r d × 1 t × D C + r e × E C
where rd is the cost rate of debt, re is the cost rate of equity, t is the income tax rate, D is the debt capital, E is equity, and C is capital (C = E + D).
In calculating the WACC, it should be observed as follows:
  • The cost of debt capital rd means the interest rate that can be determined as a weighted average of the concluded loan and debt agreements;
  • The cost of equity re was also determined based on the Modigliani–Miller theory (1958) [16], which is given by the formula:
r e = r f + β × ( r m r f )
where rf is a risk-free premium, β is the systematic market risk (beta coefficient), and (rmrf) is the risk premium. To determine re, it is necessary to meet the following:
  • For the risk-free premium rf is usually used as the risk-free interest rate, which is determined, for example, from the US 10-year government bonds;
  • Beta coefficient β determination is based on the fact that the debt of the company operates in the value of β;
  • Risk premium (rmrf) is determined for the concrete country of the region according to the rating credit of the rating agency (Standard and Poors’s or Moodys).
Damodaran (2012), Scholleová (2009), and Klieštik (2008) [7,9,34] describe theoretical fundamentals for determining parameters in CAPM and current values for countries and regions. The beta coefficient provides a method to estimate the degree of an asset’s systematic (non-diversifiable) risk. There are two distinct types of beta measured in corporate finance:
  • Levered Beta → Inclusive of Capital Structure Effects (D/E Ratio);
  • Unlevered Beta → Removed Capital Structure Effects (D/E Ratio).
As a basis in the study, unleveled beta was used. Levered beta was calculated after considering the capital structure (debt) in the particular industry. The value of the β coefficient was calculated using the formula (Hamada (1972) [54]; Damodaran (1994) [55]:
β l e v e r e d = β u n l e v e r e d × 1 + 1 t × D E
where t is the income tax rate, D is debt, and E is equity.
The CAPM assumes the canonical form of a linear equation, y = b + mx. Plotting return against beta reveals the security market line (Dybvig and Ross, 1985) [56]. Figure 1 presents the security market line when its slope indicates the risk premium, and its intercept is the risk-free return (Chen, 2021) [49]. Higher degrees of leverage commensurately lead to higher levered betas and, thus, a higher cost of equity.
The general rules for interpreting beta coefficient results for industrial sectors are:
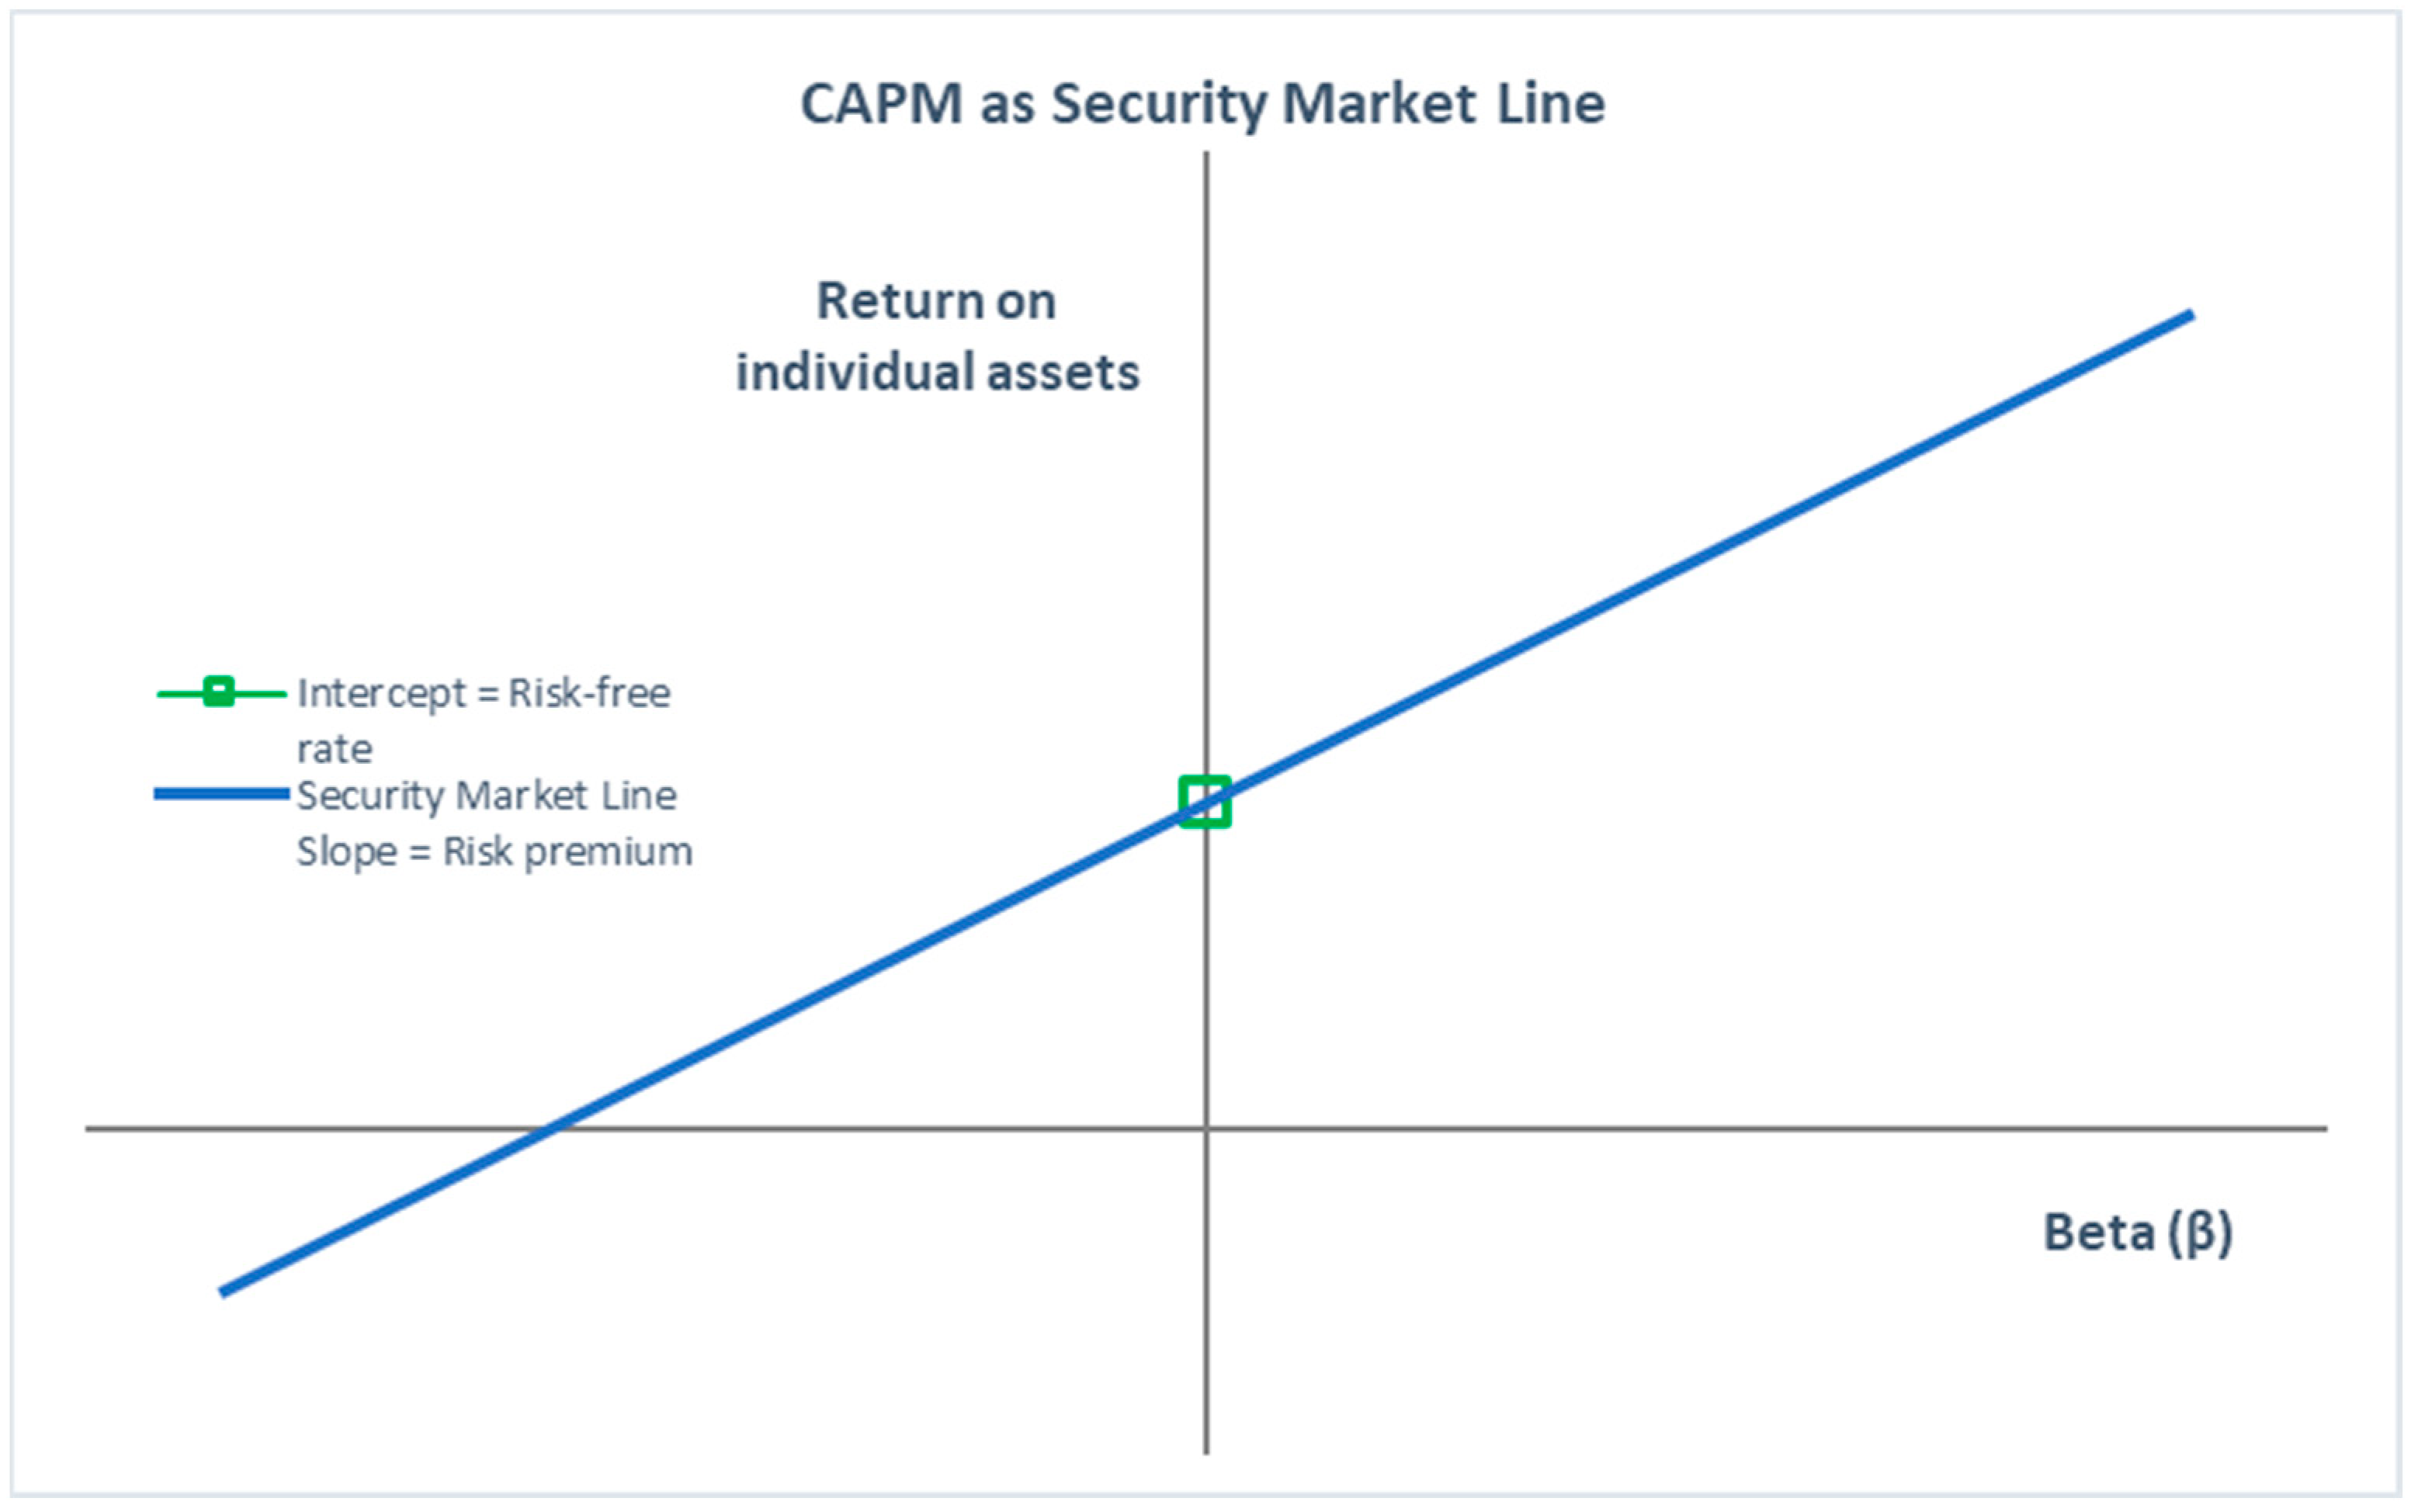
  • Beta = 1: Shares are just as risky as the market (no market sensitivity);
  • Beta > 1: Shares are riskier than the market (high market sensitivity);
  • Beta < 1: Shares are less risky than the market (low market sensitivity);
  • Beta = 0: Shares have no correlation to the market (no market sensitivity).
Data were processed using statistical and analytical methods–synthetic methods, inductive and descriptive statistics- through Microsoft Excel 2016 (Microsoft Corp., Redmond, WA, USA) and the software Statistica 12 (StatSoft, Inc., Tulsa, OK, USA).

4. Results and Discussion

The results contain quantification of the expected rate of return on comparable investments based on current market conditions and business environment, describe the relevant conclusions of the analysis, and point out the common and different features, trends, challenges, and opportunities of the wood-processing industries in Slovakia.
Table 2 presents a strong difference between the furniture and paper industries in the unlevered beta coefficient, which is an integral component of the CAPM model, and it quantifies higher systematic risk and, thus, higher expected return in furniture. The paper sector has a beta < 1 with low market sensitivity.
As Table 3 presents, we used the long-term, geometric average historical return of 10-year US Bond Yield from the S&P 500 for the calculation of country risk premium. The rating of the Slovak Republic is stable; according to Standard & Poor’s, it has been A+ since July 2015, and according to Moody’s A2, the default spread for this rating is 1.03% [57]. Adding that spread to a risk-free rate should yield the pre-tax debt cost for a company.
The beta coefficient for furniture and paper/forest products is calculated in Table 4. The starting point is different between given sectors, in favor of lower unlevered beta and risk in paper/forest. However, a significantly higher D/E ratio in paper/forest increases the levered beta in this sector to a value of 1.20. Both sectors have similar levered beta, but each for a different reason.
Consequently, beta coefficients were applied to the calculation of the rate of equity in Table 5. Risk-free interest rate, as the component in the formula, means the return that risk-free assets bring to the owner. Government bond yields are most often used. Yields of 10-year government bonds oscillated around zero for several years until the end of 2021, but since the beginning of 2022, they have seen a significant upward trend. In March 2022, the yield was 0.993%. In April 2022, the average nominal yield to maturity was 1.529% [52]. Currently, the rising risk-free rate in Slovakia and the US risk premium mean a higher rate of equity calculated based on the CAPM model, but it does not cause differences between furniture and paper sectors.
Table 6 summarizes the calculation and results of WACC. Debt costs were determined based on the current interest rates of commercial banks in Slovakia on loans to business (non-financial) units. These represented an interest rate of 2.07% for 1Q 2022 for new business [58].
The calculation of the WACC showed differences in the sectors, which were caused by the different capital structures. The expected rate of return is higher in furniture (7.84%) compared to paper/forest products, with the result of WACC at the actual level of 6.04%.
Differences in the average cost of capital in this study result mainly from different beta coefficients for individual industries. This is exactly what the article was aimed at, to point out the differences in the price of capital that result from the use of the CAPM model while maintaining the same or similar starting data—one country but a different capital structure, different industries, and their associated risk premium and appropriate expected investment returns. The local risk premium for emerging markets represents the most important component, contrary to the total risk premium for developed countries, which is largely driven by global factors [59].
It is also reasonable to mention the past of the region, where Czechoslovakia, originally a single economy, the originally united Czechoslovakia has been divided into two countries since 1993. According to the regional breakdown of the methodology used in the study, while the Czech Republic is included among developed countries in Western Europe, Slovakia is in the group of Emerging markets. Countries with a common history and similar economic development in the past currently have different input data for the CAPM model in the value of the beta coefficient and, therefore, also in the results in rate of equity due to diverse regional integration (and, therefore, equal risk premium for the region). As stated by Damodaran (2022c) [51], the created regional breakdowns of the data reflect partly conventional practice and partly biases. However, certain differences in the country’s risk are also confirmed by the different evaluations of ranking agencies, with a worse evaluation for Slovakia and, thus, a higher expected interest rate of return. On the other hand, the CAPM predicts a positive relation between risk and return, but empirical studies find that the actual relation is flat or even negative [60].
Limitations of the study follow the fact that the average cost of capital is also influenced by debt interest rates, which we did not deal with in detail in this study. Debt rates were set according to the average current interest rates of commercial banks in Slovakia on loans to business (non-financial) units, not specifically for the analyzed industries. The interest rate of debt is influenced by the original parameters of the company, such as the creditworthiness of the client, economic results in the past, already existing debt, the size of the company, etc. The CAPM states that assets are priced commensurate with a trade-off between undiversifiable risk and expectations of return [61]. Chatterjee et al. (1999) [62] assume that investors bear firm-specific risk, and investors require lower risk premiums from firms that are able to reduce firm-specific risk. The debt capital cost would differ in each company due to the above factors and the bank’s assessment. This means that if we were to compare specific companies in the same industry and country by applying the CAPM model, we would obtain the same results for the cost of equity. However, due to the different debt costs determined by banks, the average cost of capital in individual companies would be different.
Kumar et al. (2023) [63], in the study based on the utilization and importance of the CAPM in the finance literature, demonstrate the relevance of the concept in research, mainly in the fields of investment management, portfolio management, return, and risk aspects. Scholars of different institutions and countries increasingly recognize the CAPM; the trend analysis results in favor of the CAPM and its acceptability in the research domain, even in the future. We used a model based on relatively simple numerical techniques. The spreadsheets can be used in the study to introduce the students, researchers, or managers to the calculation of WACC using a CAPM model and to help them better understand how changes in the mix of debt and equity affect the cost of capital and overall return on investment. Interested people generally find this analysis both challenging and easy to understand—it stimulates analytical thinking and facilitates the consideration of multiple interacting variables in an easy and accessible format. The model promotes critical thinking and questioning about firm capital structure. This approach is a powerful individual tool for improved financial modeling and risk assessment. Together, they provide a potential mechanism to better understand the capital structure decision-making process.
The results presented in the article have the potential to be compared with other industries as well as with other countries with a different market risk premium or income tax rate, with a consequent impact on differences in the entire CAPM model and with the cost of equity.
The findings in the study are up to date; the quantification of expected return on investment considers both the long-term average yield of shares and the current values of the risk-free rate, risk premium, and interest rates.

5. Conclusions

The main findings emerge from the previous research experience (OECD, 2015) [64], (IMF, 2016) [65], (Merková, Drábek and Jelačić, 2015) [13]; and (Merková, Rajnoha and Novák, 2012) [14]:
  • Lack of knowledge about methods of determining the required/expected rate of return on investments in wood-processing sectors in Slovakia;
  • Absence/insufficient visibility of data on the necessary values for determining the required/expected rate of return on investments in forest-based sectors in Slovakia (value of risk premium, unlevered and levered beta, and the debt level of the sector).
We consider these facts to be important information and knowledge gaps. By answering the research questions RQ1–QR3, we tried to fill the identified research gap and provide the necessary data, information, and knowledge that prevent adequate managerial investment decision-making in the studied sectors.
Financial and economic decisions of investors require the quantified estimates of investment risk calculated in the expected rate of return on invested capital, and the study quantified it in Slovakia’s furniture and paper industries. These industries should consider a higher discount rate when investing than the total market, which indicates a higher unlevered beta coefficient for the furniture sector and a higher debt ratio for the paper/forest industry. The calculated expected rate of return demonstrates that the paper/forest sector, despite a higher debt, appears to be more stable and less risky.
Quantification of the target values and justification of the results with the indication of significant causes can serve several purposes. The presented calculation can be compared with values in other industries or countries, considering different market risk premiums, income tax rates, and other important parameters. The comparison provides an opportunity to decide on a more profitable investment or to plan investments with the correct values of the expected discounted cash flow rate of return for the given segment. The calculated values of the expected rate of return can be compared with the real achieved investment profitability as a basis for business performance reporting. Similarly, the values from our research can be compared with the averages of an economy and find out whether the given sector brings to the investor more than the average of the total market in the given country or region.
Our approach offers investors decision-making based on real data from global stock markets. Decision-making using calculations in our study increases the correctness of the investor’s decision on portfolio allocation. We consider our calculations and results to be correct due to the use of appropriate and commonly used methods in the given field of research.
The study provides an original analysis of the selected country and industries. It presents by now missing and required elements of investment measurement and management in given sectors, and the results can be used in the ways described above. The results of the study are relevant for business entities, research units, and state economic institutions.

Author Contributions

Conceptualization, M.K., J.D. and A.P.B.; methodology, M.K. and A.P.B.; software, M.K.; validation, M.K., J.D. and A.P.B.; formal analysis, M.K. and P.Ć.; investigation, M.K., J.D., A.P.B. and P.Ć.; resources, M.K. and J.D.; data curation, M.K.; writing—original draft preparation, M.K., J.D., A.P.B. and P.Ć.; writing—review and editing, J.D. and A.P.B.; visualization, M.K. and P.Ć.; supervision, J.D. and A.P.B.; project administration, M.K. and A.P.B.; funding acquisition, M.K., J.D., A.P.B. and P.Ć. All authors have read and agreed to the published version of the manuscript.

Funding

Martina Kánová and Josef Drábek note that this research has been supported by the Slovak Research and Development Agency of the Ministry of Education, Science, Research and Sport of the Slovak Republic, grant number H2020-LC-GD-2020-3, APVV-19-0612, APVV-21-0049, and VEGA 1/0333/22. Andreja Pirc Barčić and Petar Ćurić wish to thank the University of Zagreb Faculty of Forestry and Wood Technology Fund for scientific and professional work and financial support.

Data Availability Statement

The data presented in this article are available upon request from the corresponding author.

Conflicts of Interest

The authors declare no conflicts of interest. The funders had no role in the design of the study, in the collection, analyses, or interpretation of data, in the writing of the manuscript, or in the decision to publish the results.

References

  1. Feibel, B.J. Calculating investment returns. In Handbook of Finance; Wiley Online Library: New York, NY, USA, 2008. [Google Scholar] [CrossRef]
  2. Levy, H.; Sarnat, M. Capital Investment and Financial Decisions; Prentice-Hall: Hoboken, NJ, USA, 1986. [Google Scholar]
  3. Ward, J.; Taylor, P.; Bond, P. Evaluation and realisation of IS/IT benefits: An empirical study of current practice. Eur. J. Inf. Syst. 1996, 4, 214–225. [Google Scholar] [CrossRef]
  4. Renkema, T.J.; Berghout, E.W. Methodologies for information systems investment evaluation at the proposal stage: A comparative review. Inf. Softw. Technol. 1997, 39, 1–13. [Google Scholar] [CrossRef]
  5. Brealey, M.A.; Myers, S.C. Principles of Corporate Finance; Mc Braw Hill: New York, NY, USA, 2003. [Google Scholar]
  6. Baum, A.E.; Hartzell, D. Global Property Investment: Strategies, Structures, Decisions; Wiley-Blackwell, Ltd.: West Sussex, UK, 2012. [Google Scholar]
  7. Damodaran, A. Investment Valuation, Tools and Techniques for Determining the Value of Any Asset, 3rd ed.; John Wiley and Sons: Hoboken, NJ, USA, 2012. [Google Scholar]
  8. Brealey, R.A.; Myers, S.C.; Allen, F. Principles of Corporate Finance, 2nd ed.; BizBooks: Brno, Czech Republic, 2014; ISBN 978-80-265-0028-5. [Google Scholar]
  9. Scholleová, H. Investiční Controlling; Grada: Praha, Czech Republic, 2009; ISBN 978-80-247-2952-7. [Google Scholar]
  10. Forest Europe. State of Europe’s Forests 2020. In Proceedings of the 8th Ministerial Conference on the Protection of Forests in Europe, Bratislava, Slovakia, 14–15 April 2021. [Google Scholar]
  11. Report on Forestry in the Slovak Republic for 2020—Green Report (2020); National Forestry Center; Ministry of Agriculture and Rural Development of the Slovak Republic: Bratislava, Slovak Republic, 2020.
  12. Report on Forestry in the Slovak Republic for 2021—Green Report (2021); National Forestry Center; Ministry of Agriculture and Rural Development of the Slovak Republic: Bratislava, Slovak Republic, 2021.
  13. Merková, M.; Drábek, J.; Jelačić, D. Evaluation of investment management and business performance in wood processing industry in Slovakia. Drv. Ind. 2015, 66, 241–249. [Google Scholar] [CrossRef]
  14. Merková, M.; Rajnoha, R.; Novák, P. Quantitative and qualitative diagnostic methods for measuring the effects of foreign direct investment in terms of the wood-processing industry in the Slovak Republic. Drewno 2012, 55, 187. [Google Scholar]
  15. Kara, G.; Özmen, A.; Weber, G.W. Stability advances in robust portfolio optimization under parallelepiped uncertainty. Cent. Eur. J. Oper. Res. 2019, 27, 241–261. [Google Scholar] [CrossRef]
  16. Modigliani, F.; Miller, M.H. The cost of capital, corporation finance and the theory of investment. Am. Econ. Rev. 1958, 48, 261–297. [Google Scholar]
  17. Özmen, A.; Kropat, E.; Weber, G.W. Robust optimization in spline regression models for multi-model regulatory networks under polyhedral uncertainty. Optimization 2017, 66, 2135–2155. [Google Scholar] [CrossRef]
  18. Savku, E.; Weber, G.W. A stochastic maximum principle for a markov regime-switching jump-diffusion model with delay and an application to finance. J. Optim. Theory Appl. 2018, 179, 696–721. [Google Scholar] [CrossRef]
  19. Fotr, J.; Souček, I. Investiční Rozhodování a Řízení Projektů: Jak Připravovat, Financovat a Hodnotiť Projekty, Řídit Jejich Riziko a Vytvářet Portfolio Projektů [Investment Decision-Making and Project Management: How to Prepare, Finance and Evaluate Projects, Manage Their Risk and Create a Portfolio of Projects]; Praha Grada Publishing: Prague, Czech Republic, 2011; ISBN 978-80-247-3293-0. [Google Scholar]
  20. Markowitz, H. Portfolio Selection. J. Financ. 1952, 7, 77–99. [Google Scholar]
  21. Markowitz, H. Portfolio Selection: Efficient Diversification of Investments. Cowles Foundation Monograph No. 16; John Wiley and Sons, Inc.: New York, NY, USA, 1959; pp. 1541–1578. [Google Scholar]
  22. Treynor, J.L. Market Value, Time, and Risk. Financ. Educ. Courses 1961, 95–209. [Google Scholar] [CrossRef]
  23. Treynor, J.L. Toward a Theory of Market Value of Risky Assets; Wiley Online Library: New York, NY, USA, 1962. [Google Scholar]
  24. Sharpe, W.F. Capital asset prices: A theory of market equilibrium under conditions of risk. J. Financ. 1964, 19, 425–442. [Google Scholar]
  25. Lintner, J. The valuation of risk assets and the selection of risky investments in stock portfolios and capital budgets. Rev. Econ. Stat. 1965, 47, 13–37. [Google Scholar] [CrossRef]
  26. Mossin, J. Equilibrium in a Capital Asset Market. Econometrica 1966, 34, 768–783. [Google Scholar] [CrossRef]
  27. Fama, E.F.; French, K.R. The capital asset pricing model: Theory and evidence. J. Econ. Perspect. 2004, 18, 25–46. [Google Scholar] [CrossRef]
  28. Wang, C.P.; Huang, H.H.; Hu, J.S. Reverse-Engineering and Real Options–Adjusted CAPM in the Taiwan Stock Market. Emerg. Mark. Financ. Trade 2017, 53, 670–687. [Google Scholar] [CrossRef]
  29. Anjum, N.; Rajput, S.K.O. Forecasting Islamic equity indices alpha. Int. J. Islam. Middle East. Financ. Manag. 2021, 14, 183–203. [Google Scholar] [CrossRef]
  30. Taussig, R.D. New evidence on practical implications of the CAPM: In memory of Simon Benninga. J. Corp. Account. Financ. 2022, 33, 72–77. [Google Scholar] [CrossRef]
  31. Anuno, F.; Madaleno, M.; Vieira, E. Using the Capital Asset Pricing Model and the Fama–French Three-Factor and Five-Factor Models to Manage Stock and Bond Portfolios: Evidence from Timor-Leste. J. Risk Financ. Manag. 2023, 16, 480. [Google Scholar] [CrossRef]
  32. Yamaka, W.; Phadkantha, R. A convex combination approach for Markov switching CAPM of interval data. Soft Comput. 2021, 25, 7839–7851. [Google Scholar] [CrossRef]
  33. Fama, E.F.; French, K.R. The value premium and the CAPM. J. Finance 2006, 61, 2163–2185. [Google Scholar] [CrossRef]
  34. Klieštik, T. Investment Management—Financial Investments; University of Žilina: Žilina, Slovakia, 2008; 138p. [Google Scholar]
  35. Fama, E.F.; French, K.R. A five-factor asset pricing model. J. Financ. Econ. 2015, 116, 1–22. [Google Scholar] [CrossRef]
  36. Fama, E.F.; French, K.R. International tests of a five-factor asset pricing model. J. Financ. Econ. 2017, 123, 441–463. [Google Scholar] [CrossRef]
  37. Fama, E.F.; French, K.R. Choosing factors. J. Financ. Econ. 2018, 128, 234–252. [Google Scholar] [CrossRef]
  38. Fama, E.F.; Macbeth, J.D. Risk, Return, and Equilibrium: Empirical Tests. J. Polit. Econ. 1973, 81, 607–636. [Google Scholar] [CrossRef]
  39. Fama, E.F.; French, K.R. Comparing Cross-Section and Time-Series Factor Models. Rev. Financial Stud. 2020, 33, 1891–1926. [Google Scholar] [CrossRef]
  40. Wang, J.; Chen, Z. Exploring Low-Risk Anomalies: A Dynamic CAPM Utilizing a Machine Learning Approach. Mathematics 2023, 11, 3220. [Google Scholar] [CrossRef]
  41. Merková, M.; Drábek, J.; Jelačić, D. Application of Risk Analysis in Business Investment Decision-Making. Drv. Ind. 2013, 64, 313–322. [Google Scholar] [CrossRef]
  42. Truong, G.; Partington, G.; Peat, M. Cost-of-Capital Estimation and Capital-Budgeting Practice in Australia. Aust. J. Manag. 2008, 33, 95–121. [Google Scholar] [CrossRef]
  43. Babusiaux, D.; Pierru, A. Capital budgeting, investment project valuation and financing mix: Methodological proposals. Eur. J. Oper. Res. 2001, 135, 326–337. [Google Scholar] [CrossRef]
  44. Zhang, L. The investment CAPM. Eur. Financ. Manag. 2017, 23, 545–603. [Google Scholar] [CrossRef]
  45. Vendrame, V.; Guermat, C.; Tucker, J. A conditional regime switching CAPM. Int. Rev. Financ. Anal. 2018, 56, 1–11. [Google Scholar] [CrossRef]
  46. Barberis, N.; Greenwood, R.; Jin, L.; Shleifer, A. X-CAPM: An extrapolative capital asset pricing model. J. Financ. Econ. 2015, 115, 1–24. [Google Scholar] [CrossRef]
  47. Hung, C. Return Predictability of Higher-Moment CAPM Market Models. J. Bus. Finance Account. 2008, 35, 998–1022. [Google Scholar] [CrossRef]
  48. Da, Z.; Guo, R.-J.; Jagannathan, R. CAPM for estimating the cost of equity capital: Interpreting the empirical evidence. J. Financ. Econ. 2012, 103, 204–220. [Google Scholar] [CrossRef]
  49. Chen, J.M. The capital asset pricing model. Encyclopedia 2021, 1, 915–933. [Google Scholar] [CrossRef]
  50. de Andrade Alves, C.R.; Laurini, M. Estimating the Capital Asset Pricing Model with Many Instruments: A Bayesian Shrinkage Approach. Mathematics 2023, 11, 3776. [Google Scholar] [CrossRef]
  51. Damodaran, A. Regional Breakdown. Last Update: 5 January 2022. 2022. Available online: http://people.stern.nyu.edu/adamodar/New_Home_Page/databreakdown.html#region (accessed on 11 April 2022).
  52. National Bank of Slovakia. Long-Term Interest Rates Statistics. Monthly Survey on Yield to Maturity of the 10 Years Government Bond—Benchmark. 2022. Available online: https://nbs.sk/statisticke-udaje/financne-trhy/urokove-sadzby/dlhodobe-urokove-sadzby/ (accessed on 24 May 2022).
  53. National Bank of Slovakia. Estimated Yield Curve. 2022. Available online: https://nbs.sk/en/statistics/financial-markets/interest-rates/estimated-yield-curve/ (accessed on 24 May 2022).
  54. Hamada, R.S. The effect of the firm’s capital structure on the systematic risk of common stocks. J. Financ. 1972, 27, 435–452. [Google Scholar] [CrossRef]
  55. Damodaran, A. Damodaran on Valuation; John Wiley and Sons: New York, NY, USA, 1994. [Google Scholar]
  56. Dybvig, P.H.; Ross, S.A. Differential information and performance measurement using a security market line. J. Financ. 1985, 40, 383–399. [Google Scholar] [CrossRef]
  57. Damodaran, A. Beta, Unlevered Beta and Other Risk Measures. Last Update: 5 January 2022. 2022. Available online: https://pages.stern.nyu.edu/~adamodar/pc/datasets/betaemerg.xls (accessed on 11 April 2022).
  58. National Bank of Slovakia. Average Lending Rates of Commercial Banks. 2022. Available online: https://nbs.sk/en/statistics/financial-markets/interest-rates/average-lending-rates-of-commercial-banks/ (accessed on 17 October 2022).
  59. Arouri, M.E.H.; Nguyen, D.K.; Pukthuanthong, K. An international CAPM for partially integrated markets: Theory and empirical evidence. J. Bank. Financ. 2012, 36, 2473–2493. [Google Scholar] [CrossRef]
  60. Blitz, D.; Falkenstein, E.; Van Vliet, P. Explanations for the volatility effect: An overview based on the CAPM assumptions. J. Portf. Manag. 2014, 40, 61–76. [Google Scholar] [CrossRef]
  61. Dempsey, M. The capital asset pricing model (CAPM): The history of a failed revolutionary idea in finance? Abacus 2013, 49, 7–23. [Google Scholar] [CrossRef]
  62. Chatterjee, S.; Lubatkin, M.H.; Lyon, E.M.; Schulze, W.S. Toward a Strategic Theory of Risk Premium: Moving beyond Capm. Acad. Manag. Rev. 1999, 24, 556. [Google Scholar] [CrossRef]
  63. Kumar, S.; Kumar, A.; Singh, K.U.; Patra, S.K. The Six Decades of the Capital Asset Pricing Model: A Research Agenda. J. Risk Financial Manag. 2023, 16, 356. [Google Scholar] [CrossRef]
  64. OECD. Addressing Data Gaps in Long-Term Investment: An Agenda for Research. 2015. Available online: https://www.oecd.org/finance/private-pensions/Addressing-Data-Gaps-in-Long-Term-Investment-Research-Agenda.pdf (accessed on 20 September 2023).
  65. IMF. G-20 Data Gaps Initiative II: Meeting the Policy Challenge. 2016. Available online: https://www.imf.org/external/pubs/ft/wp/2016/wp1643.pdf (accessed on 14 August 2023).
Figure 1. CAPM model presented as a security market line.
Forests 15 00075 g001
Table 1. Data for beta coefficient by Industry Sector: Emerging Markets, Slovakia included.
RegionIncludesIncluded Countries
United StatesJust US
EuropeWestern Europe and the UK
(EU, UK, Switzerland, and Scandinavia)
Czech Republic, Croatia
JapanJust Japan
Emerging MarketsAll of Asia, other than Japan, Latin America, Africa,
the Middle East, Eastern Europe, and Russia, with a further breakdown for India and China
Slovakia, Slovenia
Australia, New Zealand, and CanadaAustralia, New Zealand, and Canada
GlobalAll firms
Source: Damodaran, 2022c [51].
Table 2. Data for beta coefficient by industry sector: emerging markets, Slovakia included.
Industry SectorNumber of FirmsLevered BetaD/E RatioTax RateUnlevered Beta
Furn/Home Furnishings2501.1615.23%15.23%1.05
Paper/Forest Products1871.1765.83%12.93%0.79
Total Market24,4351.1155.19%13.47%0.79
Total Market
(without financials)
21,9771.1333.31%13.33%0.91
Source: Damodaran, 2022a [57].
Table 3. Calculation of risk premium for Slovakia.
Geometric Average Historical ReturnS&P 50010-Year US T. BondRisk Premium (US)CDS (SVK)Risk Premium (SVK)
(rm)(rf)(rmrf) (rmrf)
1928–20219.98%4.84%5.13%1.03%6.16%
Source: authors.
Table 4. Beta coefficient for selected industry.
Indicator/SectorFurniture/Home FurnishingsPaper/
Forest Products
βuUnlevered beta1.050.79
D/ED/E Ratio15%65%
tCorporate tax rate21%21%
βlLevered beta1.171.20
Source: authors.
Table 5. Rate of equity for selected industry.
Indicator/SectorFurniture/Home FurnishingsPaper/
Forest Products
rf (SVK)Risk-free rate (SVK)1.529%1.529%
βlBeta coefficient1.171.20
(rmrf) SVKRisk premium (SVK)6.16%6.16%
reRate of Equity8.76%8.91%
Source: authors.
Table 6. Calculation of WACC for selected industry.
Indicator/SectorFurniture/Home FurnishingsPaper/
Forest Products
rdRate of dept2.07%2.07%
tCorporate tax rate21%21%
rd × (1 − t)Rate of dept after tax1.64%1.64%
D/CDept share0.130.395
reRate of equity8.76%8.91%
E/CEquity share0.870.605
WACCExpected rate of return7.84%6.04%
Source: authors.
Disclaimer/Publisher’s Note: The statements, opinions and data contained in all publications are solely those of the individual author(s) and contributor(s) and not of MDPI and/or the editor(s). MDPI and/or the editor(s) disclaim responsibility for any injury to people or property resulting from any ideas, methods, instructions or products referred to in the content.

