Abstract
In the subtropical mountainous area of Huangshan, China, 81 Torreya grandis were selected for research on growth and element distribution, with the aim of providing empirical and theoretical support for the promotion and management of T. grandis. Seven growth equations were constructed for tree height (H) and diameter at breast height (DBH) in age levels 40–2000. The most suitable Korf equation was selected by comparing the R-squared values. With R-squared values of 0.93 and 0.80, the equations H = 33.98 × Exp(−53.56/age0.84) and DBH = 158.48 × Exp(−21.41/age0.55) fit T. grandis growth best, respectively. The results show that T. grandis growth was relatively rapid before the age of 45 and then slowed. Among the carbon (C), nitrogen (N), and phosphorus (P) elements found in different T. grandis organs of the same age, the roots had the lowest C content, the leaves had the highest N content, and the branches had the lowest P content. The roots had the highest C:N and C:P, and the leaves had the highest N:P. The amount of N in the leaves and P in the branches both increased significantly with age, and the N:P ratio indicates that considering only one organ may not accurately indicate T. grandis nutrient limitations.
1. Introduction
Torreya grandis is an exclusive, coniferous, evergreen tree species indigenous to China [1]. The species is found in the subtropical mountainous regions of China and possesses significant value in terms of timber production, ornamental use, economic benefits, medicinal properties, and ecological contributions [2,3]. Nevertheless, the existing body of research on torreya trees is relatively limited. Studying the growth and initial dispersion patterns of torreya trees is of utmost importance for the sustainable management and conservation of this species.
The establishment of growth equations is a solid research methodology utilized to characterize the biological growth process using two-dimensional mathematical approaches [4]. The utilization of forest trees as a means of emulating and predicting growth has been shown to be a highly effective strategy [5,6] that provides information on potential outcomes of present and future forest conditions on forest productivity, felling intensity, and inventory [7]. As an illustration, the growth function of DBH is a crucial component of the single tree model, which simulates production and growth of individual trees within a forest stand [8]. Additionally, it can predict the future growth of tree diameter, which holds significant importance in forest management [9]. For growing trees, the integration of time series data has facilitated the analysis and prediction of growth trends in trees, resulting in significant contributions to the fields of ecology [10], cultivar improvement [11], and forest management [12]. The investigation of models for forest development curves commenced throughout the early 20th century, mostly relying on empirical formulas and statistical methodologies [13]. The initial models placed significant emphasis on the expansion of select tree species, but they were deficient in terms of their ecological foundation. With the passage of time and the continuous advancement of computer technology, the practice of constructing many models and subsequently comparing them has gained popularity and proven to be an effective approach [14,15,16]. When using the relationship between tree age and DBH to model the future growth of trees in different cities, significant differences were observed in urban tree growth models between Cincinnati and Indianapolis, Ohio, and understanding how large a tree could grow over time can help managers avoid conflicts between paved surfaces and trees that are too big for their planting sites [17]. Therefore, constructing additional tree growth models will enable more accurate predictions of future tree growth and the associated benefits, thereby promoting ecosystem services.
In addition, the growth of trees is closely linked to the participation of chemical elements. C, N, and P are essential components required for the growth and development of plants [18]. C has a crucial role in the structural integrity and energy acquisition of trees [19]. It serves as the basic structure of cells, constitutes the primary constituent of tree trunks, and is vital for the absorption of light energy [20,21]. N serves as a constituent of protein and chlorophyll, playing a crucial role as a metabolic component [22,23]. P plays a crucial role in various biological processes, including energy transduction and storage, cellular proliferation, root development, and water uptake [24,25]. The aforementioned components are of crucial significance in the processes of tree growth and metabolism. Furthermore, the analysis of element ratios within organs can provide insights into the physiological growth state of plants to a certain degree [26]. Previous research has demonstrated that ecological stoichiometry connects different levels of biology, from the gene to the globe, by scaling up elemental ratios (e.g., C:N, C:P, and N:P) [27]. The C:N:P ratio can be utilized to estimate the growth rate of some organisms [28]. Therefore, determining the distribution strategies and ratios of element in plant organs is of significant importance in various fields, such as ecology [29], forestry [30], soil biology [31], and climate change research [32,33]. This information is crucial for providing valuable data to improve the parameterization of future plant ecological models.
Currently, there is a small amount of research pertaining to the development of growth models for Torreya grandis height and diameter at breast height, as well as the quantification of chemical constituents within each organ. The objective of this study is to elucidate the patterns of growth and content of elements in T. grandis. By thoroughly analyzing the mentioned features of T. grandis, greater understanding of the distinct traits displayed by this species during different stages of growth could be obtained. This knowledge will subsequently contribute to the refinement of cultivation techniques, management strategies, and protective measures employed in the context of T. grandis conservation. Additionally, our aim is to offer a scientific foundation and theoretical underpinning for forthcoming investigations on T. grandis, while also serving as a point of reference for the study of growth laws pertaining to other conifer species found in subtropical regions.
2. Materials and Methods
2.1. Study Sites and of Plant Data Sources
The experimental site is located in Huangshan Region, Huangshan City, Anhui Province, China. It has a mid-subtropical humid monsoon climate with an average annual temperature of 15.5–16.4 °C. The soil type is red loam. The meteorological data are shown in Table 1 [34]. The experimental trees of T. grandis were old trees in mountainous areas, and their age level was measured by the local government in 2019. We surveyed the H and DBH in 2020 for the current year. In mid-July 2020, the statistical analysis was conducted on T. grandis in the Huangshan region of China. Only trees that were growing robustly and free of diseases and insect pests were included in this study. After removing broken branches, diseased trees, lodging, and trees with a DBH less than 20 cm or a tree H less than 5 m, a total of 81 experimental plants were obtained. Individual tree surveys were then conducted on these 81 plants by measuring the H and DBH using tape measures (TaJIma L16-30, Tokyo, Japan) and handheld height meters (HAGUANG CGQ-1, Harbin, China). Additionally, the actual age of each tree was obtained from the local government’s 2019 forest inventory data.

Table 1.
Site environment.
2.2. Soil Sample Collection and Indices
According to the survey, five T. grandis trees with typical characteristics (i.e., straight trunk and uniform growth) and excellent growth (i.e., strong growth and lush branches and leaves) were selected as test sample trees on 17 July 2020. At a distance of 10, 20, and 30 cm from the base of the sample tree along the four directions of east, south, west, and north, a ring cutter with a volume of 100 cm3 was used to cut the soil inside the soil. The pH value, water content, bulk density, and porosity of the soil samples were 5.7 ± 0.25, (18.25 ± 2.93)%, (1.43 ± 0.03) g·cm−3, and (47.35 ± 2.79)%, respectively. After mixing the soil sample, the content of organic matter, total N, and total P were determined [35], and the elemental data are shown in Table 1.
2.3. Plant Sampling
Root samples were collected at depths of 10 cm, 20 cm, and 30 cm from the east, west, north, and south directions. These samples were thoroughly mixed and ground. From June to November 2019, in the middle of each month, perennial twigs with consistent sizes and growth were randomly selected from the upper, middle, and lower parts of the canopy in all four directions. All of the needles were removed from these twigs, including perennial needles. The branches were distributed and the leaves were thoroughly mixed after being killed. Subsequently, the samples of roots, branches, and leaves were placed in an oven (DZK-6020, Dute Scientific Instrument Co., Ltd., Shanghai, China) and degreened at 105 °C for 30 min. They were then dried at 60 °C until they reached a constant weight. Next, the samples were crushed with an automatic ball mill (NM200, Retsch, Haan, Germany) and sifted through a 100-mesh sieve. Finally, we weighed 100 g of samples of roots, branches, and leaves for testing, respectively.
2.4. Element Determination of Plant Samples
The content of elements C and N was measured using the automatic C and N analyzer (Elementar Vario Max, Frankfurt, Germany). The content of P was measured using the nitric acid–perchloric acid digestion–molybdenum antimony spectrophotometric method. The measurement of each needle sample was repeated three times. The above element determination method refers to the method of Meng et al. [35], and the stoichiometric characteristics of C, N, and P are expressed as mass ratios.
2.5. Growth Curve and Data Analysis
Commonly used growth models include quasi-linear, quasi-power, quasi-exponential function, and quasi-hyperbolic models [36,37,38,39]. We used 6 classic and commonly used tree growth curves (Table 2) to fit the growth data, and we selected the optimal equation by comparing R-squares. y-axis in the model represents the H or DBH, and x-axis is the age level of the Torreya grandis. a, b, c are all parameters to be estimated (Table 2). The preliminary data analysis and table making were completed in Excel, and descriptive statistics, one-way ANOVA with Duncan’s post hoc multiple comparisons, and element plots were made in SPSS (version 21.0) statistic software or R (3.1.2) software; growth curves were fitted in Forstat (2.2) software [36]. The significance level for all tests was p = 0.05.
Table 2.
The growth model to be used.
After the model was built, hypothesis testing was performed. As α1 approaches 0 and α2 approaches 1, the hypothesis becomes increasingly valid. Pt represents the predicted value of the trait, Ot represents the observed value of the trait, α1 = 0, α2 = 1, and the formula is:
Pt = α1 + α2 × Ot.
3. Results
3.1. Construction of T. grnadis Growth Model
Table 3 shows the surveyed T. grandis information. A total of 81 trees were measured, with age levels ranging from 40 to 2000, H ranging from 7.00 m to 25.00 m, and DBH ranging from 19.00 cm to 156.00 cm.
Table 3.
Descriptive statistics. The data format is “mean ± standard deviation”.
Table 4 shows the building outcomes of the growth curve. In the development of the tree height model, it was observed that the coefficient of determination (R-squared) exceeded 0.80 with the Korf and Gompertz models, thus achieving a maximum R-squared value of 0.93. In the results of the DBH growth curve model, it was observed that the Hossfeld model exhibited a minimum R-square value of 0.45, while the Korf model showed a maximum R-square value of 0.80. The results of the hypothesis test indicate that the fitting effects of Allometric and Hossfeld are insufficient, while the Korf curve demonstrates better results. Generally, in the context of age, the growth curve of tree height tends to be superior to that of DBH.
Table 4.
Growth function comparison.
The best growth curves are from Korf (Figure 1), which give: H = 33.98 × Exp(−53.56/age0.84), R-square value is 0.93; DBH = 158.48 × Exp(−21.41/age0.55), R-square value is 0.80. The parameter “a” in the Korf equation is the final expectation of tree height or diameter at breast height, “b” is the growth rate parameter, and “c” is the shape parameter of the function and determines the location of the inflection point.
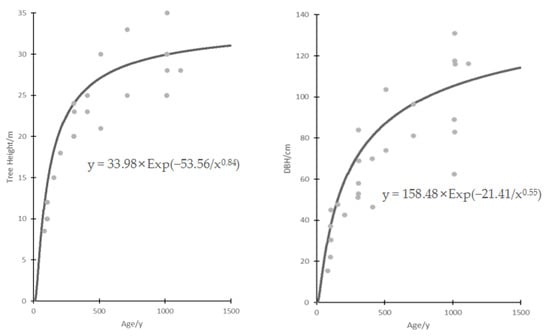
Figure 1.
Korf curve of tree height and DBH.
The inflection point of the Korf function is {[(c + 1)/b c] − 1/c,aexp[(−c − 1)/c]}. It was calculated as [44.95, 3.80] and [39.91, 9.46], which means that the expected rapid growth period of the torreya tree was 0–45 years and then slows down. The expected tree height and DBH at the inflection point were 3.80 m and 9.46 cm. Furthermore, “b” was the growth rate parameter, the parameter of tree height was 53.56, and the parameter of DBH was 21.41. Tree height grows faster than DBH.
3.2. Element Allocation
The soil’s element content is presented in Table 1, with the following values: C 40.5 mg·g−1, N 5.3 mg·g−1, and P 0.9 mg·g−1. The ratios of C:N, C:P, and N:P were 7.64, 45.00, and 5.89, respectively. An elemental analysis was conducted on T. grandis of different ages (100, 200, 300, 400, and 500 years old). The findings are presented in Figure 2.
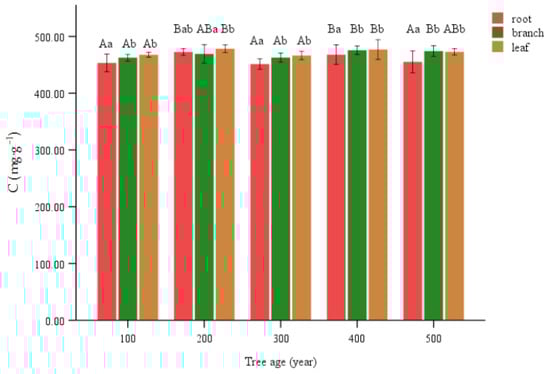
Figure 2.
C content of various organs of T. grandis. Lowercase letters represent significant differences of 0.05 between parts of the same age, and capital letters represent significant differences of 0.05 between the same parts of different ages.
Significant variations in C concentration were seen among different age levels within the same organ. The C at 200 and 400 age levels exhibited a statistically significant elevation compared to the remaining values. Among the observed branches, it was found that the values of 400 and 500 age levels exhibited a statistically significant increase compared to 100 and 300 age levels. However, no statistically significant difference was observed between the 200 age level and any others. The levels of 200 and 400 in the leaves exhibited a statistically significant increase compared to levels of 100 and 300. However, there was no statistically significant difference observed between the levels of 500 and any other levels (Figure 2).
Leaves had a significantly greater N compared to other plant structures within the same age level. At the 400 age level, the branches exhibited significant elevation compared to the roots. There was no significant distinction between the root and branch structures in other levels. The 200 and 400 age levels exhibited a notable decrease in magnification within the root context. In the branch, the 100 age level exhibited a notably higher frequency compared to other age levels. The 500 age level had a significantly larger value in leaves compared to the other levels, whereas no significant differences were observed among the remaining levels (Figure 3).
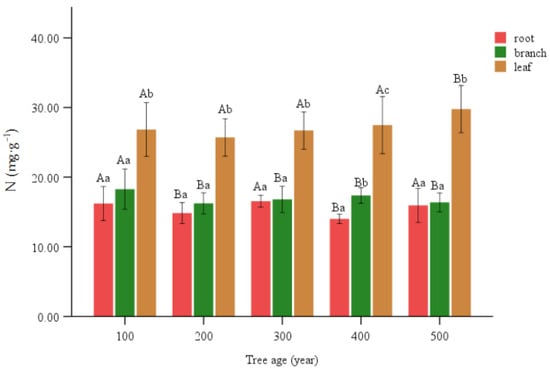
Figure 3.
N content of various organs of T. grandis. Lowercase letters represent significant differences of 0.05 between parts of the same age, and capital letters represent significant differences of 0.05 between the same parts of different ages.
The branches in each part of the same age level were significantly higher than other organs, and the P contents of the branches were all above 1.5 mg·g−1. At the 200 level, the leaf count was notably less than 1, while at the 300 level, the leaf count was significantly greater than that of the roots. The root exhibited a notable decrease at the 200 and 300 levels, with the latter being the lowest and significantly lower than the former. Within the hierarchical structure, it was observed that the 100 and 300 levels exhibited a notable decrease in magnification compared to the 200 and 400 levels. The values of 200 and 400 in the dataset of leaves exhibited a significant decrease, with the 200 level being the minimum value and significantly lower than the 400 age level (Figure 4).
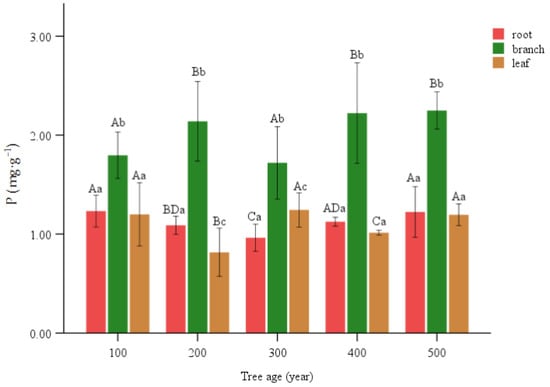
Figure 4.
P content of various organs of T. grandis. Lowercase letters represent significant differences of 0.05 between parts of the same age, and capital letters represent significant differences of 0.05 between the same parts of different ages.
In leaves, C:N dropped to 15.90 at the 500 age level, and it was above 17 before the 500 age level. C:P was the highest at the 200 age level, nearly reaching 600, and the rest of the levels were around 400. N:P was highest at the 200 age level, and it was around 20–30 most of the time. Among the branches, C:N was the lowest at the 100 age level, reaching 25.39, and the rest were all above 27. C:P was higher at the 100 and 300 age levels, above 250, and the rest was around 220. N:P was relatively high at the 100 and 300 age levels, and the rest were all between 7 and 9. In the root, C:N was high at the 200 and 400 age levels, above 31, and the rest were less than 29. C:P was lower than 380 at the 100 and 500 age levels, and the rest were above 410. N:P was high at the 300 age level, reaching 17.20, and the rest were below 14 (Table 5).
Table 5.
The element ratio of different organs in T. grandis. The data format is “mean ± standard deviation”.
4. Discussion
The construction of a tree growth model is of great significance in forestry production and management, and it also serves as an important indicator of the health of forest trees [40]. Generally, when considering the age of a tree, the growth curve of tree height tends to be superior to that of DBH [41]. Despite the extensive research on tree growth models, limited attention has been given to slow-growing tree species, such as torreya. In particular, there is a scarcity of studies focusing on ancient trees that have a growth history spanning hundreds, or even thousands, of years. Therefore, in the present study, extensive research has been conducted to examine the growth patterns of T. grandis tree height and DBH across different age categories using data-fitting techniques. In our research, we discovered that the Korf equation [42] is deemed the most appropriate for this research endeavor. The equations for H and DBH are as follows: H = 33.98 × Exp(−53.56/age0.84) and DBH = 158.48 × Exp(−21.41/age0.55). The corresponding R-squared values for these equations are 0.93 and 0.80, respectively, indicating their reliability. Computational analysis indicates that T. grandis experiences a period of rapid growth prior to reaching its 45th year. The estimated height was 3.8 m, while the DBH was 9.46 cm. Subsequently, the T. grandis experiences a deceleration in its growth rate as it ages, ultimately reaching a state of stability. Additionally, it has been observed that the rate of growth of tree height surpasses that of DBH, which aligns with previous research conducted on various coniferous species [43].
It is well-established that chemical elements are indispensable for plant growth and development. Among these elements, N and P are the most limiting and essential nutrients for plants [44,45], while C is a key structural component [19,46]. The interplay between these elements is crucial for promoting robust plant growth and the continuation of life processes [47,48]. Previous studies have demonstrated that the function of various organs in trees are closely related to their elements content [49,50], and the performance of these functions (including the production, utilization, and storage of elements) is largely affected by the plant’s growth and development stage and age [51,52]. Based on these phenomena, this study focused on the allocation of three essential elements (namely, C, N, and P) among the various organs of the T. grandis. The findings indicated that among individuals of the same age group, the C content of the roots was significantly lower, suggesting that leaves and branches of T. grandis play a major role in synthesizing and storing carbohydrates [53,54]. Consequently, the C accumulation per unit nutrient level was higher in leaves and branches compared to fine roots. The leaf N content increased, which can be explained by the fact that leaves are the primary photosynthetic organs, thus requiring a higher concentration of N to enhance their photosynthetic metabolic capacity in response to ontogenesis, so N absorbed by the roots was preferentially allocated to leaves [52,55]. The branches had a significantly higher P content. This observation suggests that the growth and nutrient storage of subterranean components in T. grandis constitute a correlation, and branch elongation, fine root formation, and bud differentiation necessitate the participation of P elements [56].
The stoichiometric characteristics of nutrients in different plant organs can indicate the trade-off and growth strategy of plants in obtaining resources [27,57,58]. The stoichiometric ratio of C:N:P in plant organs is influenced by their functions, such as photosynthesis, support, storage, and reproduction [59], as well as the age at which they are growing [51]. As a result, plants adjust the allocation among their organs based on nutrient acquisition to ensure their survival and reproduction [60,61]. This study found significant variations in the C:N, C:P, and N:P ratios among different organs of T. grandis. These differences may be attributed to variations in N and P distribution patterns and the efficiency of N and P utilization at different growth stages [62]. Observations revealed that the C:N ratio in the roots and branches of T. grandis was higher than that in the leaves. This suggests that the absorptive organs (roots) and transfer organs (branches) of the plant had higher C:N ratios compared to the metabolic organs (leaves) at all stages of growth. This difference may be related to the carbohydrate photosynthesis and its transfer effects to structural organs [63], reflecting variations in C and N status and N fixation assimilation rates among different organs [26]. In contrast, leaves, being vegetative organs, exhibited robust physiological and biochemical activities and required a higher amount of N. The C:P and N:P ratios of leaves and roots were higher than those of branches, suggesting that the metabolic and absorptive organs had higher C:P and N:P ratios than the transfer organs. This could be due to the requirement of P-rich ribosomal RNA for initiating growth and metabolic activities in the metabolically active organs, such as fine roots and shoots [64], but this finding contradicted the observations in Larix principis-rupprechti [52]. This could be mainly attributed to the different life history strategies of various tree species [65,66]. Furthermore, this study also revealed significant fluctuations in the C:N:P ratio of various organs with age, which could be linked to the N and P activity within the plant. Apart from plant age, other environmental factors, such as growing season [51,52], organ size [67], and soil nutrient availability [68], could also influence the N and P activity.
Numerous previous studies have shown that the leaf N:P ratio can be utilized to indicate potential N or P limitations in plants [26,69,70]. When the N:P ratio is less than 14, it indicates that plant growth is restricted by N. Conversely, when the N:P ratio exceeds 16, it suggests that plant growth is limited by P [71]. In this study, the N:P ratio of leaves was consistently above 21, which indicates that the studied T. grandis were severely limited by P. Additionally, in terrestrial ecosystems, the concentrations of N and P in plant organs depend on the concentrations of N and P in the soil [72]. The C, N, and P in the soil mainly originate from the chemical decomposition and release of above-ground litter, such as roots, branches, and leaves [73]. Therefore, changes in soil N and P concentrations can lead to variations in the C:N:P stoichiometry of plant organs [57,74]. Research has shown that a C:N ratio exceeding 25 significantly impedes the decomposition of litter by soil microorganisms [51,52,75]. In this study, the branches’ C:N ratio exceeded 25, thus hindering the cycling of C, N, and P in the T. grandis forest land. In addition, the N:P ratio was consistently below 14, except for in the roots at the age of 200 years. This indicates that growth may also be constrained by N availability. Furthermore, for mineral soil, the primary source of accumulated C and N is the input of root litter. Interestingly, similar patterns of C:N and N:P changes were observed in both roots and shoots in our study. These findings indicate that solely relying on the leaf N:P ratio as an indicator of potential N or P limitation in plants may yield uncertainty.
While this study offers valuable insights into the growth patterns and element allocation of T. grandis, it is crucial to acknowledge certain limitations. The investigation, confined to a single locality, overlooked potential geographical variations. To address this, future research could broaden this scope by encompassing a wider geographical range and employing techniques to validate data across multiple samples. This expansion would facilitate a more comprehensive exploration of the dynamic fluctuations exhibited by T. grandis, thereby enhancing the overall quality and reliability of research results. Furthermore, a more nuanced understanding of the T. grandis ecosystem could be achieved by analyzing supplementary components and considering environmental factors. In conclusion, this study adds important information about T. grandis growth patterns and the distribution of elements. This information can be used to better manage and protect this valuable tree species. Additionally, it serves as a valuable reference for future studies on conifer species in subtropical regions with similar traits.
5. Conclusions
The equations H = 33.98 × Exp(−53.56/age0.84) and DBH = 158.48 × Exp(−21.41/age0.55) best fit T. grandis growth in this study, with R-squared values of 0.93 and 0.80. T. grandis grows rapidly from 0 to 45 years old, and then slowly. T. grandis had lower C content in their roots, higher N content in leaves, and higher P content in branches. N in leaves and P in branches increased significantly with age. In addition, the C:N in roots and branches was higher than that in leaves, and the C:P and N:P ratios in leaves and roots were higher than those in branches. The C:N:P ratio of T. grandis varied greatly among different tree ages. The N:P ratios in the roots, branches, and leaves showed that it was insufficient to determine whether N or P was restricting T. grandis growth process based solely on the N:P ratio of one organ.
Author Contributions
L.C. (Li Chen) and N.L. contributed equally to this work. Conceptualization, L.C. (Li Chen) and N.L.; methodology, L.C. (Li Chen), Z.W. and C.L.; software, N.L. and C.L.; validation, L.C. (Lei Cao), F.L. and C.G.; formal analysis, Z.W. and N.L.; investigation, L.C. (Lei Cao), F.L., C.G. and N.S.; resources, L.C. (Li Chen); data curation, C.L.; writing—original draft preparation, L.C. (Li Chen) and N.L.; writing—review and editing, Z.W. and C.L.; visualization, L.C. (Li Chen) and N.L.; supervision, C.L.; project administration, L.C. (Li Chen) and C.L.; funding acquisition, L.C. (Li Chen). All authors have read and agreed to the published version of the manuscript.
Funding
This study was supported by the Natural Science Research Key Project of the Education Department for Anhui Province (Grant No. KJ2020A0691).
Institutional Review Board Statement
Not applicable.
Informed Consent Statement
Not applicable.
Data Availability Statement
The data presented in this study are available upon request from the corresponding author. The data are not publicly available due to ethical reasons.
Conflicts of Interest
The authors declare no conflicts of interest.
References
- He, Z.; Zhu, H.; Li, W.; Zeng, M.; Wu, S.; Chen, S.; Fang, Q.; Chen, J. Chemical components of cold pressed kernel oils from different Torreya grandis cultivars. Food Chem. 2016, 209, 196–202. [Google Scholar] [CrossRef] [PubMed]
- Shi, L.K.; Mao, J.H.; Zheng, L.; Zhao, C.W.; Jin, Q.Z.; Wang, X.G. Chemical characterization and free radical scavenging capacity of oils obtained from Torreya grandis Fort. ex. Lindl. and Torreya grandis Fort. var. Merrillii: A comparative study using chemometrics. Ind. Crop. Prod. 2018, 115, 250–260. [Google Scholar] [CrossRef]
- Yu, Y.J.; Ni, S.; Wu, F.; Sang, W.G. Chemical composition and antioxidant activity of essential oil from Torreya grandis cv. merrillii Arils. J. Essent. Oil Bear. Pl. 2016, 19, 1170–1180. [Google Scholar] [CrossRef]
- Zeide, B. Analysis of growth equations. For. Sci. 1993, 39, 594–616. [Google Scholar] [CrossRef]
- Yi, L.; Li, H.; Guo, J.; Deussen, O.; Zhang, X. Tree growth modelling constrained by growth equations. Comput. Graph. Forum 2018, 37, 239–253. [Google Scholar] [CrossRef]
- Özçelik, R.; Cao, Q.V.; Trincado, G.; Gocer, N. Predicting tree height from tree diameter and dominant height using mixed-effects and quantile regression models for two species in Turkey. For. Ecol. Manag. 2018, 419–420, 240–248. [Google Scholar] [CrossRef]
- Oboite, F.O.; Comeau, P.G. Climate sensitive growth models for predicting diameter growth of western Canadian boreal tree species. For. An. Int. J. For. Res. 2021, 94, 363–373. [Google Scholar] [CrossRef]
- Adame, P.; Hynynen, J.; Cañellas, I.; del-Río, M. Individual-tree diameter growth model for rebollo oak (Quercus pyrenaica Willd.) coppices. For. Ecol. Manag. 2008, 255, 1011–1022. [Google Scholar] [CrossRef]
- Bohora, S.B.; Cao, Q.V. Prediction of tree diameter growth using quantile regression and mixed-effects models. For. Ecol. Manag. 2014, 319, 62–66. [Google Scholar] [CrossRef]
- Coomes, D.A.; Allen, R.B. Effects of size, competition and altitude on tree growth. J. Ecol. 2007, 95, 1084–1097. [Google Scholar] [CrossRef]
- White, T.L.; Hodge, G.R. Predicting Breeding Values with Applications in Forest Tree Improvement; Kluwer Academic Publisher: London, UK, 1989; p. 33. [Google Scholar]
- Dale, V.H.; Doyle, T.W.; Shugart, H.H. A comparison of tree growth models. Ecol. Model. 1985, 29, 145–169. [Google Scholar] [CrossRef]
- Zhang, L. Cross-validation of non-linear growth functions for modelling tree height–diameter relationships. Ann. Bot. 1997, 79, 251–257. [Google Scholar] [CrossRef]
- Sharma, M.; Parton, J. Height-diameter equations for boreal tree species in Ontario using a mixed-effects modeling approach. For. Ecol. Manag. 2007, 249, 187–198. [Google Scholar] [CrossRef]
- Fang, Z.X.; Bailey, R.L. Height diameter models for tropical forests on Hainan Island in southern China. For. Ecol. Manag. 1998, 110, 315–327. [Google Scholar] [CrossRef]
- Cosenza, D.N.; Korhonen, L.; Maltam, M.; Packalen, P.; Strunk, J.L.; Næsset, E.; Gobakken, T.; Soares, P.; Tomé, M. Comparison of linear regression, k-nearest neighbour and random forest methods in airborne laser-scanning-based prediction of growing stock. For. An. Int. J. For. Res. 2021, 94, 311–323. [Google Scholar] [CrossRef]
- Berland, A. Urban tree growth models for two nearby cities show notable differences. Urban Ecosyst. 2020, 23, 1253–1261. [Google Scholar] [CrossRef]
- Lu, J.; Zhao, X.; Wang, S.; Feng, S.; Ning, Z.; Wang, R.; Chen, X.; Zhao, H.; Chen, M. Untangling the influence of abiotic and biotic factors on leaf C, N, and P stoichiometry along a desert-grassland transition zone in northern China. Sci. Total Environ. 2003, 884, 163902. [Google Scholar] [CrossRef]
- Hartmann, H.; Trumbore, S. Understanding the roles of nonstructuracarbohydrates in forest trees-from what wecan measure to what we want to know. New Phytol. 2016, 211, 386–403. [Google Scholar] [CrossRef]
- Smith, A.M.; Stitt, M. Coordination of carbon supply and plant growth. Plant Cell Environ. 2007, 30, 1126–1149. [Google Scholar] [CrossRef]
- Li, Y.; Pan, X.; Xu, X.; Wu, Y.; Zhuang, J.; Zhang, X.; Zhang, H.; Lei, B.; Hu, C.; Liu, Y. Carbon dots as light converter for plant photosynthesis: Augmenting light coverage and quantum yield effect. J. Hazard. Mater. 2021, 410, 124534. [Google Scholar] [CrossRef]
- Ohyama, T. Nitrogen as a major essential element of plants. Nitro. Assim. Plants 2010, 37, 1–17. [Google Scholar]
- Liu, C.; Duan, N.; Chen, X.; Li, X.; Zhao, N.; Cao, W.; Li, H.; Liu, B.; Tan, F.; Zhao, X.; et al. Transcriptome profiling and chlorophyll metabolic pathway analysis reveal the response of Nitraria tangutorum to increased nitrogen. Plants 2023, 12, 895. [Google Scholar] [CrossRef] [PubMed]
- Malhotra, H.; Sharma, V.S.; Pandey, R. Phosphorus nutrition: Plant growth in response to deficiency and excess. In Plant Nutrients and Abiotic Stress Tolerance; Hasanuzzaman, M., Fujita, M., Oku, H., Nahar, K., Hawrylak-Nowak, B., Eds.; Springer: Singapore, 2018; pp. 171–190. [Google Scholar]
- Liu, D. Root developmental responses to phosphorus nutrition. J. Integr. Plant Biol. 2021, 63, 1065–1090. [Google Scholar] [CrossRef] [PubMed]
- Zhang, J.; He, N.; Liu, C.; Xu, L.; Chen, Z.; Li, Y.; Wang, R.; Yu, G.; Sun, W.; Xiao, C.; et al. Variation and evolution of C:N ratio among different organs enable plants to adapt to N-limited environments. Glob. Change Biol. 2020, 26, 2534–2543. [Google Scholar] [CrossRef] [PubMed]
- Zhang, J.; Zhao, N.; Liu, C.; Yang, H.; Li, M.; Yu, G.; Wilcox, K.; Yu, Q.; He, N. C:N:P stoichiometry in China’s forests: From organs to ecosystems. Funct. Ecol. 2017, 32, 50–60. [Google Scholar] [CrossRef]
- Elser, J.J.; Fagan, W.F.; Denno, R.F.; Dobberfuhl, D.R.; Folarin, A.; Huberty, A.; Interlandi, S.; Kilham, S.S.; McCauley, E.; Schulz, K.L.; et al. Nutritional constraints in terrestrial and freshwater food webs. Nature 2000, 408, 578–580. [Google Scholar] [CrossRef] [PubMed]
- Pawlikowski, P.; Abramczyk, K.; Szczepaniuk, A.; Kozub, Ł. Nitrogen: Phosphorus ratio as the main ecological determinant of the differences in the species composition of brown-moss rich fens in north-eastern Poland. Preslia 2013, 85, 349–367. [Google Scholar]
- Gelfand, I.; Grünzweig, J.M.; Yakir, D. Slowing of nitrogen cycling and increasing nitrogen use efficiency following afforestation of semi-arid shrubland. Oecologia 2012, 168, 563–575. [Google Scholar] [CrossRef]
- Aitkenhead, J.A.; McDowell, W.H. Soil C: N ratio as a predictor of annual riverine DOC flux at local and global scales. Glob. Biogeochem. Cycles 2000, 14, 127–138. [Google Scholar] [CrossRef]
- Xu, H.; Wang, M.; You, C.; Tan, B.; Xu, L.; Li, H.; Zhang, L.; Wang, L.; Liu, S.; Hou, G.; et al. Warming effects on C:N:P stoichiometry and nutrient limitation in terrestrial ecosystems. Soil Tillage Res. 2024, 235, 105896. [Google Scholar] [CrossRef]
- Shi, L.; Lin, Z.; Wei, X.; Peng, C.; Yao, Z.; Han, B.; Xiao, Q.; Zhou, H.; Deng, Y.; Liu, K.; et al. Precipitation increase counteracts warming effects on plant and soil C:N:P stoichiometry in an alpine meadow. Front. Plant Sci. 2022, 13, 1044173. [Google Scholar] [CrossRef] [PubMed]
- Wang, T.; Wang, G.; Innes, J.L.; Brad Seely, B.; Chen, B. ClimateAP: An application for dynamic local downscaling of historical and future climate data in Asia Pacific. Front. Agric. Sci. Eng. 2017, 4, 448–458. [Google Scholar] [CrossRef]
- Meng, Q.; Ge, L.; Lin, Y.; Qiu, L.; Hu, H.; He, Z.; Dong, Q.; Cui, J. Ecolcgical Stoichiometric characteristics of leaf-litter-soil in natural and planted forests of Castanopsis kawakamii and Cunninghamia lanceolata. J. Northwest For. Univ. 2019, 34, 8–15. (In Chinese) [Google Scholar]
- Hong, L.; Tang, S.; Li, H.; Li, Y.; de Coligny, F. Integrated Stand Growth Model (ISGM) and its application. In Proceedings of the 2006 Second International Symposium on Plant Growth Modeling and Applications, Beijing, China, 13–17 November 2006; IEEE: Piscataway, NJ, USA, 2006; pp. 223–230. [Google Scholar]
- Chen, P.T.; Kang, X.G.; Gong, Z.W.; Yang, H.; Cai, S. The DBH growth process of larch in northeast was modeled by computer. In Proceedings of the 2010 International Symposium on Intelligence Information Processing and Trusted Computing, Huanggang, China, 28–29 October 2010; IEEE: Piscataway, NJ, USA, 2010; pp. 337–340. [Google Scholar]
- Li, F.R.; Zhao, B.D.; Su, G.L. A derivation of the generalized Korf growth equation and its application. J. For. Res. 2000, 11, 81–88. [Google Scholar]
- Stoll, P.; Weiner, J.; Schmid, B. Growth variation in a naturally established population of Pinus sylvestris. Ecology 1994, 75, 660–670. [Google Scholar] [CrossRef]
- Jin, S.; Zhang, W.; Shao, J.; Wan, P.; Cheng, S.; Cai, S.; Yan, G.; Li, A. Estimation of larch growth at the stem, crown, and branch levels using ground-based LiDAR point cloud. J. Remote Sens. 2022, 2022, 9836979. [Google Scholar] [CrossRef]
- Tan, C.; Nie, W.; Liu, Y.; Wang, Y.; Dong, Y.; Huang, R.; Liu, J.; Shi, S.; Chang, E.; Zhao, X.; et al. Tree growth model and bark thickness model of three Quercus species based on trunk analysis. Zhejiang Agric. For. Univ. 2023, 40, 589–597. (In Chinese) [Google Scholar]
- Xu, H.; Sun, Y.; Wang, X.; Fu, Y.; Dong, Y.; Li, Y. Nonlinear mixed-effects (NLME) diameter growth models for individual China-fir (Cunninghamia lanceolata) trees in southeast China. PLoS ONE 2014, 9, e104012. [Google Scholar] [CrossRef]
- Sumida, A.; Miyaura, T.; Torii, H. Relationships of tree height and diameter at breast height revisited: Analyses of stem growth using 20-year data of an even-aged Chamaecyparis obtusa stand. Tree Physiol. 2013, 33, 106–118. [Google Scholar] [CrossRef]
- Larsen, M.L.; Wilhelm, S.W.; Lennon, J.T. Nutrient stoichiometry shapes microbial coevolution. Ecol. Lett. 2019, 22, 1009–1018. [Google Scholar] [CrossRef]
- Niklas, K.; Owens, T.; Reich, P.B.; Cobb, E.D. Nitrogen/phosphorus leaf stoichiometry and the scaling of plant growth. Ecol. Lett. 2005, 8, 636–642. [Google Scholar] [CrossRef]
- Wu, H.; Zhang, Y.; Jia, Z.; He, K.; Wang, J.; Wei, X. C, N and stoichiometry characteristics of oat cultivars in eastern agricultural area of Qinghai Province. Agric. Res. Arid Areas 2023, 41, 160–168. (In Chinese) [Google Scholar]
- Meng, B.; Li, J.; Maurer, G.E.; Zhong, S.; Yao, Y.; Yang, X.; Collins, S.L. Nitrogen addition amplifies the nonlinear drought response of grassland productivity to extended growing-season droughts. Ecology 2021, 102, e03483. [Google Scholar] [CrossRef] [PubMed]
- de Bang, T.C.; Husted, S.; Laursen, K.H.; Persson, D.P.; Schjoerring, J.K. The molecular-physiological functions of mineral macronutrients and their consequences for deficiency symptoms in plants. New Phytol. 2021, 229, 2446–2469. [Google Scholar] [CrossRef]
- Wang, R.; Wang, Q.; Zhao, N.; Yu, G.; He, N. Complex trait relationships between leaves and absorptive roots: Coordination in tissue N concentration but divergence in morphology. Ecol. Evol. 2017, 7, 2697–2705. [Google Scholar] [CrossRef] [PubMed]
- Kramer-Walter, K.R.; Laughlin, D.C. Root nutrient concentration and biomass allocation are more plastic than morphological traits in response to nutrient limitation. Plant Soil 2017, 416, 539–550. [Google Scholar] [CrossRef]
- Liu, Z.; Hikosaka, K.; Li, F.; Zhu, L.; Jin, G. Plant size, environmental factors and functional traits jointly shape the stem radius growth rate in an evergreen coniferous species across ontogenetic stages. J. Plant Ecol. 2021, 14, 257–269. [Google Scholar] [CrossRef]
- Li, H.; Crabbe, M.J.C.; Xu, F.; Wang, W.; Ma, L.; Niu, R.; Gao, X.; Zhang, P.; Ma, X.; Chen, H. Seasonal variations in carbon, nitrogen and phosphorus concentrations and C:N:P stoichiometry in different organs of a Larix principis-rupprechtii Mayr. plantation in the Qinling Mountains, China. PLoS ONE 2017, 12, e0185163. [Google Scholar] [CrossRef]
- Du, Y.; Lu, R.; Xia, J. Impacts of global environmental change drivers on non-structural carbohydrates in terrestrial plants. Funct. Ecol. 2020, 34, 1525–1536. [Google Scholar] [CrossRef]
- Song, L.; Luo, W.; Griffin-Nolan, R.J.; Cai, J.; Zuo, X.; Yu, Q.; Hartmann, H.; Li, M.H.; Smith, M.D.; Collins, S.L.; et al. Differential responses of grassland community nonstructural carbohydrate to experimental drought along a natural aridity gradient. Sci. Total Environ. 2022, 822, 153589. [Google Scholar] [CrossRef]
- Zhao, R.; Wang, C.; Quan, X.; Wang, X. Ecological stoichiometric characteristics of different organs of broadleaf tree species in a temperate forest in Maoershan area, Heilongjiang Province. Sci. Silver Sin. 2021, 57, 1–11. (In Chinese) [Google Scholar]
- Loomis, R.S. On the utility of nitrogen in leaves. Proc. Natl. Acad. Sci. USA 1997, 94, 13378–13379. [Google Scholar] [CrossRef]
- Zhang, J.; Li, M.; Xu, L.; Zhu, J.; Dai, G.; He, N. C:N:P stoichiometry in terrestrial ecosystems in China. Sci. Total Environ. 2021, 795, 148849. [Google Scholar] [CrossRef]
- Henry, H.A.L.; Aarssen, L.W. On the relationship between shade tolerance and shade avoidance strategies in woodland plants. Oikos 1997, 80, 575–582. [Google Scholar] [CrossRef]
- Minden, V.; Kleyer, M. Internal and external regulation of plant organ stoichiometry. Plant Biol. 2014, 16, 897–907. [Google Scholar] [CrossRef]
- Luo, Y.; Peng, Q.; Li, K.; Gong, Y.; Liu, Y.; Han, W. Patterns of nitrogen and phosphorus stoichiometry among leaf, stem and root of desert plants and responses to climate and soil factors in Xinjiang, China. Catena 2021, 199, 105100. [Google Scholar] [CrossRef]
- Gong, Y.M.; Ling, H.B.; Chen, Y.; Cao, J.; Guo, Z.J.; Lv, G.H. N:P stoichiometric changes via species turnover in arid versus saline desert environments. Ecol. Evol. 2020, 10, 6636–6645. [Google Scholar] [CrossRef]
- Vrede, T.; Dobberfuhl, D.R.; Kooijman, S.A.L.M.; Elser, J.J. Fundamental connections among organism C:N:P stoichiometry, macromolecular composition, and growth. Ecology 2004, 85, 1217–1229. [Google Scholar] [CrossRef]
- Hooker, T.D.; Compton, J.E. Forest ecosystem carbon and nitrogen accumulation during the first century after agricultural abandonment. Ecol. Appl. 2003, 13, 299–313. [Google Scholar] [CrossRef]
- Elser, J.J.; Dobberfuhl, D.R.; MacKay, N.A.; Schampel, J.H. Organism size, life history, and N:P stoichiometry toward a unified view of cellular and ecosystem processes. BioScience 1996, 46, 674–684. [Google Scholar] [CrossRef]
- Han, W.; Fang, J.; Guo, D.; Zhang, Y. Leaf nitrogen and phosphorus stoichiometry across 753 terrestrial plant species in China. New Phytol. 2005, 168, 377–385. [Google Scholar] [CrossRef] [PubMed]
- Tian, D.; Yan, Z.; Ma, S.; Ding, Y.; Luo, Y.; Chen, Y.; Du, E.; Han, W.; Kovacs, E.D.; Shen, H.; et al. Family-level leaf nitrogen and phosphorus stoichiometry of global terrestrial plants. Sci. China Life Sci. 2019, 62, 1047–1057. [Google Scholar] [CrossRef] [PubMed]
- Zhang, H.; Wu, H.; Yu, Q.; Wang, Z.; Wei, C.; Long, M.; Kattge, J.; Smith, M.; Han, X. Sampling date, leaf ageand root size:implications for the study of plant C:N:P stoichiometry. PLoS ONE 2013, 8, e60360. [Google Scholar]
- Tao, Y.; Zhou, X.B.; Li, Y.G.; Liu, H.L.; Zhang, Y.M. Short-term N and P additions differentially alter the multiple functional traits and trait associations of a desert ephemeral plant in China. Environ. Exp. Bot. 2022, 200, 104932. [Google Scholar] [CrossRef]
- You, C.; Wu, F.; Yang, W.; Xu, Z.; Tan, B.; Yue, K.; Ni, X. Nutrient-limited conditions determine theresponses offoliar nitrogen andphosphorus stoichiometry to nitrogenaddition: A global meta-analysis. Environ. Pollut. 2018, 241, 740–749. [Google Scholar] [CrossRef]
- Du, E.; Terrer, C.; Pellegrini, A.F.A.; Ahlström, A.; van Lissa, C.J.; Zhao, X.; Xia, N.; Wu, X.; Jackson, R.B. Global patterns of terrestrial nitrogen and phosphorus limitation. Nat. Geosci. 2020, 13, 221–226. [Google Scholar] [CrossRef]
- Koerselman, W.; Meuleman, A.F.M. The vegetation N:P ratio: A new tool to detect the nature of nutrient limitation. J. Appl. Ecol. 1996, 33, 1441–1450. [Google Scholar] [CrossRef]
- Chen, Y.; Han, W.; Tang, L.; Tang, Z.; Fang, J. Leaf nitrogen and phosphorus concentrations of woody plants differ in responses to climate, soil and plant growth form. Ecography 2013, 36, 178–184. [Google Scholar] [CrossRef]
- Zheng, Y.; Hu, Z.; Pan, X.; Chen, X.; Derrien, D.; Hu, F.; Liu, M.; Hättenschwiler, S. Carbon and nitrogen transfer from litter to soil is higher in slow than rapiddecomposing plant litter: A synthesis of stable isotope studies. Soil Biol. Biochem. 2021, 156, 108196. [Google Scholar] [CrossRef]
- Yang, L.X.; Wang, Y.L.; Huang, J.Y.; Zhu, J.G.; Yang, H.J.; Liu, G.; Liu, H.J.; Dong, G.C.; Hu, J. Seasonal changes in the effects of free-air CO2 enrichment (FACE) on phosphorus uptake and utilization of rice at three levels of nitrogen fertilization. Field Crop. Res. 2007, 102, 141–150. [Google Scholar] [CrossRef]
- Tian, X.J.; Takahiro, T. Relative roles of microorganisms and soil animals on needel litter decomposition in a subalpine coniferous forest. Acta Phytoecol. Sin. 2002, 26, 257–263. [Google Scholar]
Disclaimer/Publisher’s Note: The statements, opinions and data contained in all publications are solely those of the individual author(s) and contributor(s) and not of MDPI and/or the editor(s). MDPI and/or the editor(s) disclaim responsibility for any injury to people or property resulting from any ideas, methods, instructions or products referred to in the content. |
© 2023 by the authors. Licensee MDPI, Basel, Switzerland. This article is an open access article distributed under the terms and conditions of the Creative Commons Attribution (CC BY) license (https://creativecommons.org/licenses/by/4.0/).