Abstract
In order to accurately estimate the water consumption of a Minqin desert Haloxylon ammodendron sand fixation forest, we used thermal equilibrium stem flow measurement to monitor the stem flow dynamics of Minqin desert H. ammodendron (5, 10, 15, and 20 years old, respectively, denoted as H5, H10, H15, and H20). In this study, we chose the growth index of assimilated branches (expressed as Ab in the following text) as the scalar quantity for expansion, and then estimated the water consumption of the H. ammodendron sand fixation forest by fitting the correlation between the water consumption of single H. ammodendron plants and the surface area and dry weight of single Ab. The results showed that the growth of assimilated H. ammodendron branches and the plant’s monthly water consumption were synchronized, and that the growth of Ab and water consumption were significantly higher during the fast-growth period of H. ammodendron (July) compared to during the leaf-expanding (May) and leaf-falling periods (October). After correlation analysis, it was determined that there was a linear function between the surface area and dry weight of Ab and water consumption in H. ammodendron. The simulated water consumption values (kg) of H. ammodendron sand fixation forests were greatly affected by stand density and branching configuration, and the simulated values of H. ammodendron assimilated branch growth (cm) were slightly smaller than the measured values for forests of different ages, while the simulated values of assimilated branch surface area (cm2) had a much smaller relative error (8.92%) on average. Therefore, it is feasible to use the surface area and dry weight of Ab to calculate the water consumption of H. ammodendron sand fixation forests. This can enable the reliable estimation of the water consumption of H. ammodendron forests and provide a reference for desert vegetation sand fixation afforestation and its ecological water management.
1. Introduction
In the context of global warming, the arid zone is the region that has undergone the most significant increase in the temperature in the last 100 years; the expansion of deserts, water scarcity, and deprivation due to human activities have been frequent, with about 10%–20% of land in the arid zone experiencing severe degradation [1]. Coupled with the increase in global warming and the continuing decrease in rainfall, the number of areas of extreme drought is multiplying globally [2]. Currently, more than 110 countries around the world are facing the threat of desertification, and China, the largest country in the mid-latitude arid zone in the northern hemisphere, is one of the countries where desertification is most developed [3]. H. ammodendron is a perennial C4 plant unique to desert areas [4]. Due to its strong resistance to stress, such as salinity, high temperature, drought, and barrenness, it is widely planted in the desert areas of northwest China as a sand-fixing tree species, with over 20 million new plants added so far [5]. Minqin County is a demonstration area for desertification control in China. There are nearly 350 km2 of artificial H. ammodendron sand fixation forests in this area, accounting for 51.5% of the total area of artificial forests, and it is the most common type of sand fixation forest [6]. However, large-scale afforestation has led to a sharp decrease in surface water resources and groundwater levels in the region. The growth of such forests requires more water with age, and the current soil moisture is no longer able to support the growth of Ha forests, resulting in their large-scale decline [7]. Therefore, accurately ascertaining the evapotranspiration water consumption of H. ammodendron is key to maintaining the survival and growth of sand fixation forests in desert areas.
Evapotranspiration is the main way for plants to consume water [8]. International research on evapotranspiration has been ongoing for two centuries. However, there is still relatively little direct research on the issue of natural ecological water consumption. Research on the evapotranspiration and water consumption of H. ammodendron mainly includes monitoring its leaves [9] and individual-scale data [6,10], as well as estimating forest- and regional-scale models, and there are significant differences in the research methods for assessing evapotranspiration and water consumption between scales. The study of leaf-scale transpiration in H. ammodendron commonly evaluates the photosynthetic transpiration and environmental responses of the leaves [11], as well as changes in their water-related physiological and biochemical characteristics [12]. There are many reports on the use of thermal pulse technology to study the liquid flow characteristics of individual plants (branches) of H. ammodendron, mainly involving aspects such as the liquid flow rate [13], the water consumption characteristics of its transpiration [14], and the its transpiration response to the environment [7]. However, in order to effectively protect and restore artificial H. ammodendron forests in desert areas, it is necessary not only to understand the consumption of limited water resources by individual plants, but also to understand water consumption information at the stand level.
At the stand scale, most scholars use micro-meteorological methods to determine water dissipation at the stand level, but it is difficult to accurately distinguish the transpiration of trees [15]. In addition, using a certain scale conversion net scalar, the water consumption of a single plant of H. ammodendron can be calculated at the stand scale, and choosing the appropriate scale conversion net scalar is key to accurately estimating stand water consumption. To date, research has been conducted to estimate plant water consumption by assessing the functional relationship between plant stem flow and diameter at breast height [16,17], stem cross-sectional area [18], sapwood area [19,20], sapwood density [6], and leaf area index [21,22], and has achieved good experimental results. However, the shortcomings are also quite obvious. For example, the premise of estimating forest water consumption by determining the sapwood area is to assume that all individual trees have the same transpiration rate. In reality, whether the liquid flow rate of individual trees with different breast diameters is the same in reality needs further verification [23]. The growth rate of the diameter at breast height and cross-sectional area of the stem is relatively slow, making it difficult to accurately estimate the annual water consumption changes of the forest stand. Previous studies have shown that the functional characteristics of leaves are closely related to plant growth and dynamic changes in ecosystems [24]. At the ecosystem level, the functional characteristics of leaves have a significant impact on the water cycle and energy balance, and the water quality of leaves can better predict the leaf area for full leaf photosynthesis [25]. At the leaf level, water availability may also directly affect other leaf traits [26,27]. On the other hand, the distribution of H. ammodendron forests in the desert area is sparse, the degree of mutual shading between Ab is not high during sunlight irradiation, and the seasonal variation in Ab growth is particularly obvious. Moreover, its Ab growth indexes are easier to obtain, which can be used as a sensitive scalar quantity for the conversion of the scale of the forest stand’s water consumption. Therefore, we hypothesized that there is a strong correlation between the evapotranspiration water consumption and assimilated branch growth of a single plant, and that its stand-scale water consumption can be extrapolated based on the measurement of assimilated branch growth metrics in conjunction with sap flow observations.
In order to verify the above hypotheses, this study takes different ages of H. ammodendron sand fixation forests in the Minqin Desert of China as its research object and estimates and converts the scale of water consumption in these forests based on data from an Ab growth survey of H. ammodendron stands, combined with observation data on the liquid flow of single plants in the growing season. In doing so, the authors aim to provide theoretical support for the quantification, analysis, and simulation prediction of the water consumption of H. ammodendron forests and ultimately provide scientific guidance for sand fixing and silviculture as well as ecological water use management in desert vegetation.
2. Materials and Methods
2.1. Study Site
Minqin is located in the lower reaches of the Shiyang River in the northeastern part of the Hexi Corridor in Gansu, China, where water resources are scarce, wind and sand hazards are severe, and the ecological environment is fragile. The region has a typical temperate continental desert climate, with an average annual temperature of 7.4 °C, ≥10 °C, a cumulative temperature of 3248.8 °C, average annual precipitation of 113 mm, average annual evaporation of 2644 mm, a perennial prevalence of northwesterly winds, an average annual wind speed of 2.1 m/s, and a maximum wind speed of 23 m/s. The region’s water use relies on recharging in the upper reaches of the Shiyang River, and the transitional utilization of groundwater has led to a continuous decline in the groundwater level, which declined from 2.24 m in 1961 to 21.53 m in 2013 and then rose to 20.47 m in 2021. The zonal soil is gray-brown desert soil, and the non-zonal soil is windy and sandy. The typical vegetation mainly consists of H. ammodendron, Calligonum arborescens, and Nitraria tangutorum. H. ammodendron is a typical artificial sand fixation forest vegetation species in the Minqin Desert (Figure 1).
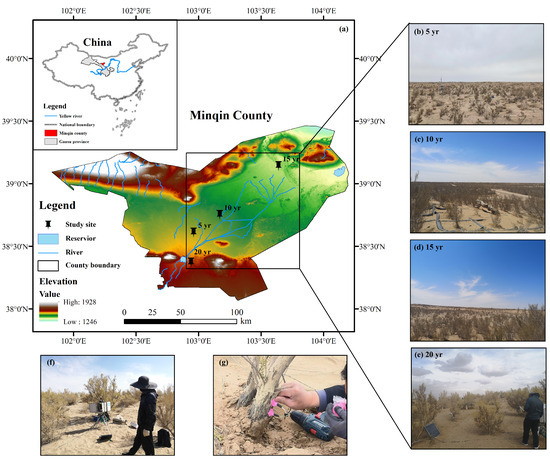
Figure 1.
Oasis–desert transition zone study site and H. ammodendron sampling locations in Minqin County, Wuwei, China, for (a) the geographical location of the research area; (b) the H5 sample; (c) the H10 sample; (d) the H15 sample; (e) the H20 sample; (f) Stem flow meter equipment; (g) TDP plug-in probe.
2.2. Study Areas and Sample Selection
From 2021 to 2022, artificial H. ammodendron in semi-fixed dune land in Minqin, in the arid zone of China, was used as a research object to determine the age of its stands by visiting local villagers who participated in afforestation and investigating the afforestation years through forestry data. We selected 5-, 10-, 15-, and 20-year-old artificial H. ammodendron stand test plots (300 m × 300 m), and evenly distributed 3 sample plots (30 m × 30 m). We investigated its stand and counted the frequency and distribution of the ground diameter of the stand. In each forest age, the four trees with the highest ground diameter frequency and the most widely distributed in the sample were used as standard trees to monitor the stem sap flow of the plant. The branches of the standard tree were used as standard branches to represent the entire stand. A TDP30 (Rainroot Scientific Limited, Beijing, China) probe was used to measure the smooth spot 40 cm above the ground on the east side of the stem, and the measured spot was sanded using sandpaper; then, the probe was drilled and inserted into the polished spot using a drill needle matching the probe. After the probe was installed, we wrapped it with a plastic fixing sponge, wrapped the plastic foam with silver radiation-proof aluminum platinum paper, and lay thermal insulation cotton on the ground around the probe to reduce the influence of ground temperature on the probe. We connected the probe to a CR1000 data collector (CR1000, Campbell Scientific Inc., Logan, UT, USA), which collected data every 1 min.
The 5–20-year age groups of H. ammodendron were concentrated in the desert area, under basically the same climatic conditions, with each stand having a neat structure, and with uniform growth of trees. There were some differences in the density and growth of its stands affected by soil moisture, but the differences in soil moisture and stand density between stands of different ages were not significant (p < 0.05) (Table 1).

Table 1.
Information on plots and sample trees.
2.3. Determination of the Stem Sap Flow and Water Consumption
The stem sap flow density was calculated according to an empirical formula associated with Granier [28].
In this formula, Fd is the stem sap flow density (cm3/(cm2·h), and ΔTmax is the maximum temperature difference between the two probes when there was no stem flow (°C). The measurement time without stem flow was set at LST 0:00–1:00 a.m. in May, July, August, September, and October, and 3:00–4:00 in June; ΔT is the temperature difference between the two probes when there was stem flow (°C); K is a dimensionless unit; and α and β depend on the thermal coefficient.
The formula for calculating the daily transpiration of a single sample was as follows:
where Q is the daily transpiration (cm3), As is the sapwood area (cm2), and T indicates 24 h of time in a day. In accordance with Zhang et al. (2017) [6], when measuring the stem flow of H. ammodendron in the area, the correlation between the sapwood area and the diameter of it was determined via a dyeing method, and it was concluded that there was an obvious exponential functional relationship between them.
In this formula, y is the sapwood area (cm2) and x is the diameter (cm) of the area.
A density–volume formula (ρ = m/V) was used to calculate water consumption and convert transpiration Q (cm3) to mass M (kg).
2.4. Determination of Ab Growth
Three H. ammodendron sample plants were selected within each stand-age sample plot, and Ab growth was determined for both the standard sample tree and the sample plants. The standard sample tree was sampled in the middle of each month from May to October, and the relationship between its water consumption and Ab growth was fitted and analyzed. Based on the plant’s four directions of southeast, northwest, and the upper and lower parts, eight standard branches were selected and sampled separately, and 50 Ab were collected for each sample. The Ab were cut off, packed in a cooler to preserve freshness, and immediately brought back to the laboratory for weighing to obtain the wet weight (g), which was then scanned into a leaf area meter (Yaxin-1241, Beijing Yaxin Liyi Technology Co., Ltd., Beijing, China) to determine the leaf area (cm2). The scanned Ab were packed into an aluminum box, killed green at 105 °C for 30 min, and dried at 65 °C until they reached a constant weight, and the dry weight (g) was obtained. We simultaneously measured the crown size (east–west and north–south length), plant height, ground diameter, and standard basal branch diameter and branch length of standard trees; counted the standard tree branching configuration and the number of Ab of the standard branches of plants born in the current year; and calculated the Ab growth parameters of the tested this plant based on the Ab growth parameters of the standard branches.
Based on the basal diameter and length of the standard branches, four functional forms (linear, power, logarithmic, and exponential) were used to establish estimation models of the surface area of the Ab and the dry weight of the Ab obtained from the standard branch. The coefficient of determination R2 was used to judge the fitted regression equations, from which the optimal estimation function was selected as follows:
where Az is the surface area of the Ab obtained from the standard H. ammodendron branch (cm2) or the dry weight of the Ab (g), d is the basal diameter of the standard branch (mm2), h is the length of the standard branch (cm), and a and b are the parameters of the fitted equation.
Based on the statistical analysis of the standard sample tree’s branching configuration, the estimation model for the optimal Ab surface area or Ab dry weight, shown in Equations (4)–(7), was used to obtain the standard sample tree’s single Ab surface area or Ab dry weight, which was expressed as:
In this formula, Ai is the surface area (cm2) or Ab weight (g) of the i-th Ab, ni is the total number of i-th branches, and Azi is the average surface area (cm2) or Ab weight (g) of the standard branch, obtained by calculating the product of the square of the i-th branch’s base diameter and length, d2h.
The monthly water consumption of the standard sample tree was calculated and curve-fitted to the surface area of the Ab or the dry weight of the Ab of the standard sample tree calculated in the same month. The fitting equation Qs was:
where Qs is the monthly water consumption of the standard sample tree (kg), As is the surface area of the Ab of the standard sample tree (cm2) or the dry weight of the Ab (g), and a and b are equation parameters retrieved by linear regression.
2.5. Coupling Simulation of Water Consumption in H. ammodendron Stands
Based on a survey of H. ammodendron stand growth and branching configuration, the stand density, cover, number of branches, branch length, and branch diameter were counted. Based on the growth and sampling investigation of the standard branches of the its stand samples, the basal cross-sectional area and number of standard branches of the samples were calculated, and the surface area of the Ab was measured. Equation (8) was used to obtain the surface area and dry weight of the Ab of the samples. Combined with the ground diameter and plant height measurement obtained in the its stand survey, linear functional equations were established to determine the relationship of the surface area or dry weight of the Ab with the cross-sectional area of the basal diameter and the plant height of the its stand, respectively. This is expressed as follows:
In this formula, Qy is the surface area (cm2) or Ab weight (g) of the Ab of the surveyed H. ammodendron stand, S is the cross-sectional area of the surveyed plant base diameter (cm2), h is the height of the surveyed plant (cm), dk is the base diameter (cm) of the k-th shrub branch of the surveyed plant, and both a and b are coefficients.
We calculated the surface area or dry weight of the Ab of each individual plant in the sample plot using Formula (10). After determining the surface area or dry weight of the Ab of all investigated plants in the sample plot, we divided it by the area of the same survey sample plot to obtain the surface area or dry weight of the Ab per unit area of H. ammodendron forest:
where Q1 is the surface area of the Ab per unit area of H. ammodendron stand (cm2·m−2) or the dry weight of the Ab (g·m−2), n is the total number of plants in the sample plot, Qk is the surface area of the Ab of the k-th plant (cm2), and S is the area of the sample plot (m2).
Formula (9) obtained the linear proportional relationship between As (surface area or dry weight of Ab of standard wood) and monthly water consumption Qs of standard wood. The value of assimilating branch surface area or dry weight per unit area of H. ammodendron forest was calculated using Formula (12) and was substituted into Formula (9). Based on the known As and proportion coefficient, the monthly water consumption Qs of H. ammodendron per unit area was calculated based on the linear proportional relationship.
3. Results
3.1. Relationship between Water Consumption and Growth
We used regression models for estimating the surface area and dry weight of the Ab of H. ammodendron in forests of different ages (Table 2). We found that, among the four branch fitting functions for the standard branch assimilation, fitted using the product of the square of the basal diameter and length of the standard branch, the exponential function had the best fit. The R2 values of the exponential function of the Ab surface area ranged from 0.9406 to 0.9635, and the R2 values of the exponential function of the Ab dry weight ranged from 0.9220 to 0.9680. We used an exponential function to estimate the surface area and dry weight of the Ab of a single plant (Figure 2). The optimized results show that July is the fast-growth season for this plant, with the maximum surface area, dry weight, and monthly water consumption of Ab from a single plant, ranging from 5259.99 to 13,387.87 cm2, 333.68 to 2483.21 g, and 119.70 to 250.03 kg, respectively. H. ammodendron sprouted shoots in May, with small water consumption and even smaller Ab dry weights ranging from 164.63 to 317.86 g and 28.73 to 118.67 kg, respectively. Its Ab withered in October, during which the Ab surface area and water consumption were the smallest, ranging from 316.94 to 3189.49 cm2 and 10.10 to 108.06 kg, respectively. The growth of its Ab was synchronized with the monthly changes in its water consumption, indicating that there is a certain correlation between the growth of its Ab and its water consumption.
Table 2.
Four functions used to fit the regression equation for the growth of the Ab of Ha’s standard branches.
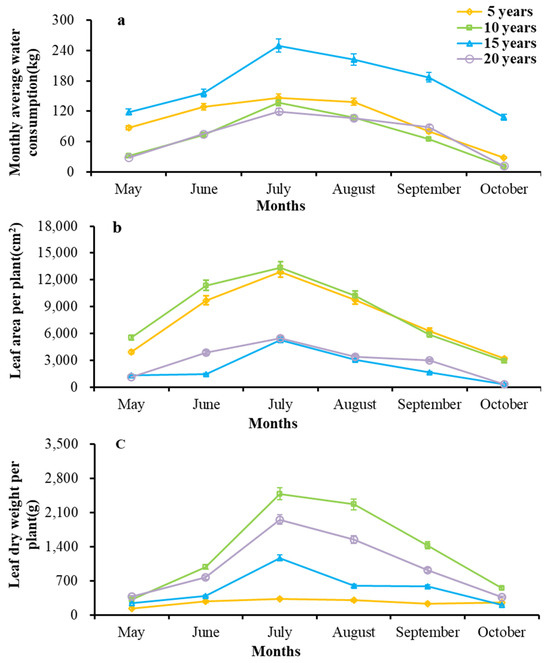
Figure 2.
Changes in water consumption of individual plants and monthly changes in growth of Ab in H. ammodendron forests of different ages. (a) Monthly average water consumption; (b) leaf area per plant; (c) leaf dry weight per plant.
The analysis of the relationship between the monthly water consumption and Ab growth of standard trees in forests of different ages revealed that there was a typical linear relationship between the monthly water consumption and both the dry weight of Ab and the surface area of Ab (Table 3). The fit of the linear function of the surface area of the Ab ranged from 0.83 to 0.87, and that of the dry weight of the Ab ranged from 0.83 to 0.88. Therefore, the linear relationship between the Ab growth and water consumption of a single plant can be used to make H. ammodendron stand-scale transpiration water consumption projections based on standard wood sap flow observations of Ab growth.
Table 3.
Linear relationship between monthly water consumption and Ab growth of standard Ha trees in different age forests.
3.2. Extrapolation of Water Consumption in H. ammodendron Stands
The surface area and dry weight of single Ab were derived using an Ab growth optimization model (4) for H. ammodendron forests (Table 4). The statistical results showed that the value of standard branch d2h was smaller for H. ammodendron forests in the 5–10-year age class and larger for those in the 15–20-year age class. The number of standardized branches was higher in middle-aged forests in the 10–15-year age range and lower in young and old forests. The converted surface area of the Ab of individual plants was larger in the 5–10-year age class, ranging from 5737.28 to 6491.47 cm2, and smaller in the 15–20-year age class, ranging from 2899.15 to 3248.97 cm2. The converted dry weight of the Ab of single plants was smallest at the age of 5, at only 249.05 g, and largest at the age of 20, at 1952.04 g.
Table 4.
Statistics on the growth parameters of Ab of single plants in forests of different ages.
Linear relationships of the surface area and dry weight of the Ab of a single plant with the cross-sectional area of its base and its height were constructed using the plant height and cross-sectional area of the base of the H. ammodendron stand. It was found that the surface area of the Ab samples from forests of different ages have a high degree of linear fit with the basal diameter cross-sectional area and plant height, with R² values above 0.91. The linear correlation of the dry weight of the Ab was relatively higher in the its samples, with R2 ranging from 0.9262 to 0.9766. Therefore, the Ab growth linear fit function could be used to calculate the water consumption of the samples in the H. ammodendron forest (Table 5). The density of 5-year-old H. ammodendron stands was high, and the water consumption of the calculated sample area ranged from 8698.02 to 9464.87 kg. The density of 20-year-old stands was small, and the water consumption of the sample plots ranged from 3098.73 to 5310.83 kg. The densities of 10- and 15-year-old forests were similar, but the branching configurations and water consumption of the converted samples varied greatly, ranging from 4039.30 to 4860.50 kg and 12,400.95 to 12,646.37 kg, respectively.
Table 5.
Simulated estimation of water consumption in H. ammodendron stands of different ages.
3.3. Validation of Water Consumption in H. ammodendron Stands
The area of Ab growth and dry weight of Ab and their corresponding specific conductance of Ab growth were calculated and extrapolated for individual woodland H. ammodendron plants in different months. The final water consumption of per plant in the woodland was calculated and verified by comparing the simulated values with the measured water consumption of per plant on standard logs (Figure 3). The simulation results showed that the simulated values of Ab growth were slightly smaller than the measured values for H. ammodendron from forests of different ages. The average relative error of the simulated water consumption of 5-year-old plants during the growing season was small, at 6.68%. The errors of the simulated values were 12.80% and 12.61% for 10- and 15-year-old plants, respectively. The simulated values for 20-year-old plants had greater errors, averaging 14.94%. The simulated values of the Ab growth parameters at different stand ages show some differences. The average relative error of the simulated values of Ab dry weight was 14.60%, and the simulated surface area of the Ab was closer to the measured values, with an average error of only 8.92%.

Figure 3.
Comparison of measured and simulated water consumption of per plant in forests of different ages. (a) Water consumption of 5-year-old plants; (b) water consumption of 10-year-old plants; (c) water consumption of 15-year-old plants; (d) water consumption of 20-year-old plants.
4. Discussion
Based on leaf growth parameters, Zhu Z et al. systematically analyzed the global trends and driving factors of the cumulative leaf area index (LAI) during the growing season of terrestrial vegetation using leaf area index (LAI) time series [29]. Zhang M et al., upon analyzing changes in leaf area index and CO2 concentration, emphasized that climate warming increases the risk of sudden droughts [30]. Zhang L et al. established a rapid estimation method for greenhouse lettuce growth using the indicators of leaf fresh weight, leaf dry weight, and leaf area [31]. Li X et al. analyzed the correlation between leaf parameters and environmental changes by comparing the leaf area and specific leaf dry weight of plants with different slope orientations [32]. The above studies illustrate that the scale conversion of plant metrics using leaf growth parameters is more reliable.
The current use of thermal techniques to determine the water consumption of forest trees often utilizes space scalar quantity such as the trees’ sapwood area, basal area, or diameter at breast height for scale conversion. For example, S Fu et al. used sapwood area as a spatially scalar quantity to derive the transpiration water consumption of farmland protection forests in the oasis of Xinjiang [33]. D Lüttschwager et al. used basal area as a spatially scalar quantity to analyze and derive a water saving strategy for beech stands in arid regions of northern Germany [34]. In their study, Yue G et al. used leaf area as the expanded scalar quantity to scale the water consumption of the Caragana microphylla shrub community in Horqin Sandy Land [22]. Kang, Y et al. simulated the water consumption of California vineyards using leaf area [35]. When converting the water consumption of H. ammodendron on a scale, due to the retrogression of its leaves into fleshy Ab for C4-type photosynthesis, the water consumption of H. ammodendron is more clearly reflected by changes in the Ab surface area and Ab dry weight.
This study found that the monthly variation in H. ammodendron’s Ab growth and water consumption was obvious, with their values significantly higher during the rapid growth period (July) than during the leaf spreading (May) and defoliation (October) periods. This shows that there is a certain correlation between the water consumption of single plants and the growth of Ab, and it is feasible to use the growth of Ab to calculate the water consumption of H. ammodendron stands. The simulated projected water consumption of H. ammodendron stands were strongly influenced by stand density and branching configuration, and the simulated values of its Ab growth were all slightly smaller than the measured values. Comparatively, the average relative error of the Ab dry weight simulation was large (14.60%), and the simulated Ab surface area was closer to the measured value (8.92%).
5. Conclusions
Using previous studies as a reference, this study selected the surface area and dry weight of Ab of H. ammodendron with significant seasonal growth changes as the expanded net quantity and carried out coupled modeling of water consumption in H. ammodendron stands by monitoring the dynamics of individual sap flow during the growing season in stands of different ages. The results show that there is a strong linear correlation between the surface area and dry weight of the Ab and their water consumption, and it is effective to use these parameters as the scalar quantities of scale expansion. Therefore, the water consumption of the whole forest stand can be derived from the coupled simulation by measuring the surface area of the Ab and the dry weight of the Ab, which are easier to measure. Combined with the hydrological situation, this can provide scientific guidance for the density planning of newly built H. ammodendron forests in desert areas and provide a reliable basis for the restoration and protection of existing H. ammodendron sand fixation forests.
Author Contributions
Conceptualization, Y.Q. and M.Z.; methodology, M.Z.; software, J.Z.; investigation, G.F.; resources, M.Z., J.Z. and P.Z.; data curation, Y.Z.; writing—original draft preparation, Y.Q.; writing—review and editing, M.Z.; supervision, Y.Q., Y.Z. and J.Z.; funding acquisition, M.Z. All authors have read and agreed to the published version of the manuscript.
Funding
This study was supported by the Basic Research Innovation Group Project of Gansu Province (No. 22JR5RA129); the Natural Science Foundation of China subsidization Project (No. 32260425); the National Youth Science Fund (No. 42207109); National Key Research and Development Program Project (No. 2022YFF1302505-04); and Gansu Provincial Key R&D Program Project (No. 23YFFA0025); Northwest Normal University Graduate Research Funding Project (2023KYZZ-072).
Data Availability Statement
The data presented in this study are available on request from the corresponding author. The data are not publicly available due to the data in this paper are obtained from Gansu Desert Control Research Institute. We have signed a data confidentiality contract with the unit, and the data cannot be used for other purposes.
Conflicts of Interest
The authors declare no conflicts of interest. The funders had no role in the design of the study; in the collection, analyses, or interpretation of data; in the writing of the manuscript; or in the decision to publish the results.
References
- Xu, D.; Song, A.; Li, D.; Ding, X.; Wang, Z. Assessing the relative role of climate change and human activities in desertification of north china from 1981 to 2010. Front. Earth Sci. 2019, 13, 43–54. [Google Scholar] [CrossRef]
- Pardikes, N.A.; Revilla, T.A.; Lue, C.H.; Thierry, M.; Souto-Vilarós, D.; Hrcek, J. Effects of phenological mismatch under warming are modified by community context. Glob. Change Biol. 2022, 28, 4013–4026. [Google Scholar] [CrossRef]
- Rahimi, J.; Khajeh, M.; Alipour, A.; Bazrafshan, O. Quantitative assessment of climate change impacts on the spatial characteristics of drought hazard in arid and semi-arid regions of Iran. Int. J. Water 2021, 14, 124–140. [Google Scholar] [CrossRef]
- Jia, Z.Q.; Lu, Q.; Guo, B.G.; Zhao, M.; Liang, Y.Q. Progress in the study of Psammophyte Haloxylon. For. Res. 2004, 17, 125–132. [Google Scholar]
- Zhao, P.; Xu, X.Y.; Qu, J.J.; Zhang, J.H.; Ma, Q.L.; Zhang, H.W.; Xu, G.X.; Ma, J.M.; Wu, Y.M. Relationships between artificial Haloxylon ammodendron communities and soil-water factors in Minqin oasis-desert ecotone. Ecol. Sin. 2017, 37, 1496–1505. [Google Scholar]
- Zhang, X.Y.; Chu, J.M.; Meng, P.; Yao, Z.W.; Wang, H.S.; Li, D.L.; Jiang, S.X. The effect of environmental factors on stem sap flow characteristics of Haloxylon ammodendron (C.A.Mey.) bunge in Minqin oasis-desert. Acta Ecol. Sin. 2017, 37, 1525–1536. [Google Scholar]
- Qiang, Y.; Zhang, J.; Xu, X.; Liu, H.; Duan, X. Stem sap flow of Haloxylon ammodendron at different ages and its response to physical factors in the minqin oasis-desert transition zone, China. J. Arid. Land 2023, 15, 842–857. [Google Scholar] [CrossRef]
- Yuan, G.F.; Luo, Y.; Shao, M.A.; Zhang, P.; Zhu, X.C. Evapotranspiration and its main controlling mechanism over the desert riparian forests in the lower Tarim River Basin. Sci. China Earth Sci. 2015, 45, 695–706. [Google Scholar] [CrossRef]
- Liu, H.; She, C.Y.; Bai, Z.Q.; Li, Q.; Liu, D.; Han, Y.L. Sap flow and transpiring water-consumption of Pinus sibirica in different diameter classes. Acta Bot. Boreali-Occident. Sin. 2016, 36, 390–397. [Google Scholar]
- Jin, Y.X.; Wang, X.P.; Zhang, Y.F.; Pan, Y.X.; Hu, R.; Xu, H.J.; Shi, W. Transpiration of Reaumuria soongorica and Salsola passerine at different scales. J. Desert Res. 2018, 38, 286–293. [Google Scholar]
- Xu, H.; Li, Y.; Xu, G.; Zou, T. Ecophysiological response and morphological adjustment of two Central Asian desert shrubs towards variation in summer precipitation. Plant Cell Environ. 2007, 30, 399–409. [Google Scholar] [CrossRef] [PubMed]
- Hu, D.; Lv, G.; Qie, Y.; Wang, H.; Yang, F.; Jiang, L. Response of morphological characters and photosynthetic characteristics of Haloxylon ammodendron to water and salt stress. Sustainability 2021, 13, 388. [Google Scholar] [CrossRef]
- Li, H.; Hu, S.; Zhu, H.; Li, X. Characterization of stem sap flow Haloxylon ammodendron by using thermal dissipation technology. Acta Ecol. Sin. 2017, 37, 7187–7196. [Google Scholar]
- Ji, X.; Zhao, W.; Kang, E.; Jin, B.; Xu, S. Transpiration from three dominant shrub species in a desert-oasis ecotone of arid regions of Northwestern China. Hydrol. Process. 2016, 30, 4841–4854. [Google Scholar] [CrossRef]
- Si, J.H.; Feng, Q.; Zhang, X.Y.; Chang, Z.Q.; Su, Y.H.; Xi, H.Y. Sap flow of Populus euphratica in a desert riparian forest in an extreme arid region during the growing season. J. Integr. Plant Biol. 2007, 49, 425–436. [Google Scholar] [CrossRef]
- Fisher, R.A.; Williams, M.; Da Costa, A.L.; Malhi, Y.; Da Costa, R.F.; Almeida, S.; Meir, P. The response of an Eastern Amazonian rain forest to drought stress: Results and modelling analyses from a throughfall exclusion experiment. Glob. Change Biol. 2007, 13, 2361–2378. [Google Scholar] [CrossRef]
- Zhang, Y.; Liang, F.; Chang, S.; Shi, Q.; Li, X.; Lu, J. Scaling up for transpiration of Pinaceae schrenkiana stands based on 8 hm super (2) permanent plots in Tianshan Mountains. Acta Ecol. Sin. 2011, 31, 3330–3339. [Google Scholar]
- Cao, X.M.; Chen, X.; Wang, J.L.; Wang, Q.; Wang, S. Water consumption and transpiration of non-irrigated Haloxylon ammodendron in hinterland of Taklimakan Desert. Arid. Land Geogr. 2013, 36, 292–302. [Google Scholar]
- Bai, Y.G.; Zhang, J.H.; Wang, X.Y.; Li, B.; Fan, H.B. Studies on scale convention of individual Populus euphratica and forest water consumption in Tarim Basin. China Water Resour. 2008, 5, 24–25. [Google Scholar]
- Sun, L.; Wang, C.K.; Yang, G.T.; Zhang, Q.Z.; Zhou, X.F. Sap flow flux of Pinus koraiensis plantation measured by thermal dissipation probes. Sci. Silva. Sin 2007, 43, 8–14. [Google Scholar]
- Chabot, R.; Bouarfa, S.; Zimmer, D.; Chaumont, C.; Moreau, S. Evaluation of the sap flow determined with a heat balance method to measure the transpiration of a sugarcane canopy. Agric. Water Manag. 2005, 75, 10–24. [Google Scholar] [CrossRef]
- Yue, G.; Zhao, H.; Zhang, T.; Zhao, X.; Zhao, W.; Niu, L.; Liu, X. Estimation of transpiration in communities dominated by shrub Caragana microphylla. J. Plant Ecol. (Chin. Version) 2009, 33, 508–515. [Google Scholar]
- Yang, J.; Feng, J.; He, Z. Estimating whole-tree water use of Picea crassifolia based on heat ratio method. Chin. J. Plant Ecol. 2018, 42, 195–201. [Google Scholar]
- Wright, I.J.; Reich, P.B.; Westoby, M.; Ackerly, D.D.; Baruch, Z.; Bongers, F.; Villar, R. The worldwide leaf economics spectrum. Nature 2004, 428, 821–827. [Google Scholar] [CrossRef]
- Craine, J.M. Resource Strategies of Wild Plants; Princeton University Press: Princeton, NJ, USA, 2009. [Google Scholar]
- Huxman, T.E.; Snyder, K.A.; Tissue, D.; Leffler, A.J.; Ogle, K.; Pockman, W.T.; Schwinning, S. Precipitation pulses and carbon fluxes in semiarid and arid ecosystems. Oecologia 2004, 141, 254–268. [Google Scholar] [CrossRef] [PubMed]
- Anderson-Teixeira, K.J.; Miller, A.D.; Mohan, J.E.; Hudiburg, T.W.; Duval, B.D.; DeLucia, E.H. Altered dynamics of forest recovery under a changing climate. Glob. Change Biol. 2013, 19, 2001–2021. [Google Scholar] [CrossRef]
- Granier, A. Sap flow measurements in Douglas-fir tree trunks by means of a new thermal method. Ann. Des Sci. For. 1987, 44, 1–14. [Google Scholar] [CrossRef]
- Zhu, Z.; Piao, S.; Myneni, R.B.; Huang, M.; Zeng, Z.; Canadell, J.G.; Zeng, N. Greening of the Earth and its drivers. Nat. Clim. Change 2016, 6, 791–795. [Google Scholar] [CrossRef]
- Zhang, M.; Yuan, X.; Otkin, J.A.; Ji, P. Climate warming outweighs vegetation greening in intensifying flash droughts over China. Environ. Res. Lett. 2022, 17, 054041. [Google Scholar] [CrossRef]
- Zhang, L.; Xu, Z.; Xu, D.; Ma, J.; Chen, Y.; Fu, Z. Growth monitoring of greenhouse lettuce based on a convolutional neural network. Hortic. Res. 2022, 7, 124. [Google Scholar] [CrossRef]
- Li, X.E.; Song, X.; Zhao, J.; Lu, H.; Qian, C.; Zhao, X. Shifts and plasticity of plant leaf mass per area and leaf size among slope aspects in a subalpine meadow. Ecol. Evol. 2021, 11, 14042–14055. [Google Scholar] [CrossRef] [PubMed]
- Fu, S.; Sun, L.; Luo, Y. Combining sap flow measurements and modelling to assess water needs in an oasis farmland shelterbelt of Populus simonii Carr in Northwest China. Agric. Water Manag. 2016, 177, 172–180. [Google Scholar] [CrossRef]
- Lüttschwager, D.; Jochheim, H. Drought primarily reduces canopy transpiration of exposed beech trees and decreases the share of water uptake from deeper soil layers. Forests 2020, 11, 537. [Google Scholar] [CrossRef]
- Kang, Y.; Gao, F.; Anderson, M.; Kustas, W.; Nieto, H.; Knipper, K.; Karnieli, A. Evaluation of satellite Leaf Area Index in California vineyards for improving water use estimation. Irrig. Sci. 2022, 40, 531–551. [Google Scholar] [CrossRef]
Disclaimer/Publisher’s Note: The statements, opinions and data contained in all publications are solely those of the individual author(s) and contributor(s) and not of MDPI and/or the editor(s). MDPI and/or the editor(s) disclaim responsibility for any injury to people or property resulting from any ideas, methods, instructions or products referred to in the content. |
© 2023 by the authors. Licensee MDPI, Basel, Switzerland. This article is an open access article distributed under the terms and conditions of the Creative Commons Attribution (CC BY) license (https://creativecommons.org/licenses/by/4.0/).