Article

The Impact of Earlywood and Latewood on the Compressive Stress of Thermally Modified Douglas Fir

1
Guangxi Key Laboratory of Superior Timber Trees Resource Cultivation, Nanning 530002, China
2
College of Materials Science and Engineering, Nanjing Forestry University, Longpan Road 159, Nanjing 210037, China
3
UGent-Woodlab, Laboratory of Wood Technology, Department of Environment, Faculty of Bioscience Engineering, Ghent University, Coupure Links 653, 9000 Ghent, Belgium
*
Author to whom correspondence should be addressed.
Forests 2023, 14(7), 1376; https://doi.org/10.3390/f14071376
Submission received: 27 June 2023 / Revised: 3 July 2023 / Accepted: 3 July 2023 / Published: 5 July 2023

Abstract

:
Thermal modification can increase the physical stability and impact the mechanical strength of wood. It is necessary to understand the effects of modifications on the compressive stress of wood. In this study, Douglas fir (Pseudotsuga menziessi) blocks were modified at 180 °C (TM-180 °C) and 210 °C (TM-210 °C). The compressive stress of pure earlywood (EW), pure latewood (LW), and combined earlywood and latewood (ELW) specimens was measured. The specimens were compressed at 30% of their original thickness, and during the compression test the strain distribution of the ELW was recorded. In addition, the microstructures before and after compression were investigated, complemented with SEM to understand the structural changes taking place. The results showed that the compressive stress of the TM-180 °C specimens was the highest because the thermal modification increased the stiffness of cell walls and the homogenized strain distribution in the ELW specimens. The control specimens had a higher compression set recovery rate than the thermally modified specimens. The tracheid cell walls in the EW and LW specimens were flattened and buckled, respectively, due to compression. In the thermally modified materials, cell wall fissures and wood ray fractures in the EW and LW specimens, respectively, were observed. For the ELW specimens, the structural changes in the latewood were not obvious and the structural changes in the earlywood were less significant than in the full EW specimens. Compared to the EW specimens, the earlywood in the ELW specimens showed higher compression set recovery rates. It seems that structural failure in earlywood is limited when used in combination with latewood, resulting from the homogenized strain distribution in earlywood.

1. Introduction

As an important construction material, the structural characteristics of wood closely define its mechanical performance. They are mainly determined by the growth of the tree. The growth rings are obvious, especially in softwood. In softwood, early in the growing season, the vascular cambium tends to produce cells with large lumens and thin walls, called earlywood, while towards the end of the growing season the cambium produces cells with smaller lumens and thicker walls, called latewood. The boundary between the latewood and earlywood of the next growing season is the growth ring boundary [1]. Because of the different cell wall thicknesses and lumen sizes in earlywood and latewood, this growth ring boundary has a large impact on the density and physical and mechanical properties of wood [2,3,4,5]. Boutelje found that earlywood is anisotropic with regard to the transverse elasticity, while latewood is almost isotropic in the transverse direction [6]. Under loading, shearing ruptures can occur in regions adjacent to the growth ring boundary due to the abrupt change in the structure. The stiffness of earlywood is lower, and it was noted that ruptures in earlywood tracheids next to the growth ring boundary can occur in a compression test [7]. The earlywood width and the number of growth rings, therefore, significantly influence the mechanical behavior of the wood [8,9]. The modulus of elasticity and tensile strength of strands from loblolly pine trees positively relate to the number of growth rings [10]. Indented ring boundaries in slow-grown wood cause the overlapping of high-density latewood and low-density earlywood, leading to an increased modulus of elasticity and modulus of rupture in spruce wood [11].
The interaction of earlywood and latewood and the effects on the mechanical performance of the wood are not fully understood yet, and on top of that physical and chemical modifications further complicate the story. Several modification methods are commonly used to improve the moisture resistance and dimensional stability of wood. Thermal modification, for example, has been proven as an economic and environmentally friendly method [12], increasing the moisture resistance and dimensional stability of the wood but sacrificing part of the mechanical strength [13,14,15]. It is clear that the effects of the thermal modification on earlywood and latewood are not the same, which further complicates the effect of earlywood and latewood on the overall mechanical performance of the thermally modified wood [16]. The cell wall thickness decreases and cell lumen size increases with increasing thermal modification temperature [17]. Using a thermo-gravimetric analysis, it was found that earlywood is more susceptible to thermal degradation than latewood [18,19]. During the thermal modification, earlywood exchanges more thermal energy than latewood, and the earlywood near the growth ring boundary has the lowest stiffness in thermally modified wood [20]. After thermal modification, wood failure mainly occurs in the growth ring boundaries because of the increased brittleness of the cell walls and structural changes, such as shrinkage and collapse of the cell walls [21,22]. Although the mechanical properties of earlywood and latewood have been of research interest for decades, the relationship between the mechanical properties, microstructure, and dynamic strain transfer has not been fully understood yet. The interaction of earlywood and latewood, especially for thermally modified wood, needs to be further investigated.
The objective of this study is to understand the compressive stress levels of earlywood, latewood, and the combination thereof in thermally treated wood. The compressive stress directly relates to the wood’s loadbearing capability and the densified wood process [23,24]. Wood blocks obtained from Douglas fir (Pseudotsuga menziessi (Mirb.) Franco) trees were thermally modified at two different temperatures. The specimens were cut from earlywood (EW) regions, latewood (LW) regions, and regions with both earlywood and latewood (ELW). Growth rings in the ELW specimens were perpendicular to the loading force direction. The compressive stress of the specimens was measured. The strain distribution in ELW specimens was recorded using digital image correlation (DIC) during the compression test. Before and after the compression test, the microstructure of the specimens was visualized using scanning electron microscopy (SEM). The findings of this study contribute to the effective application of wood and thermally modified wood under loadbearing conditions.

2. Materials and Methods

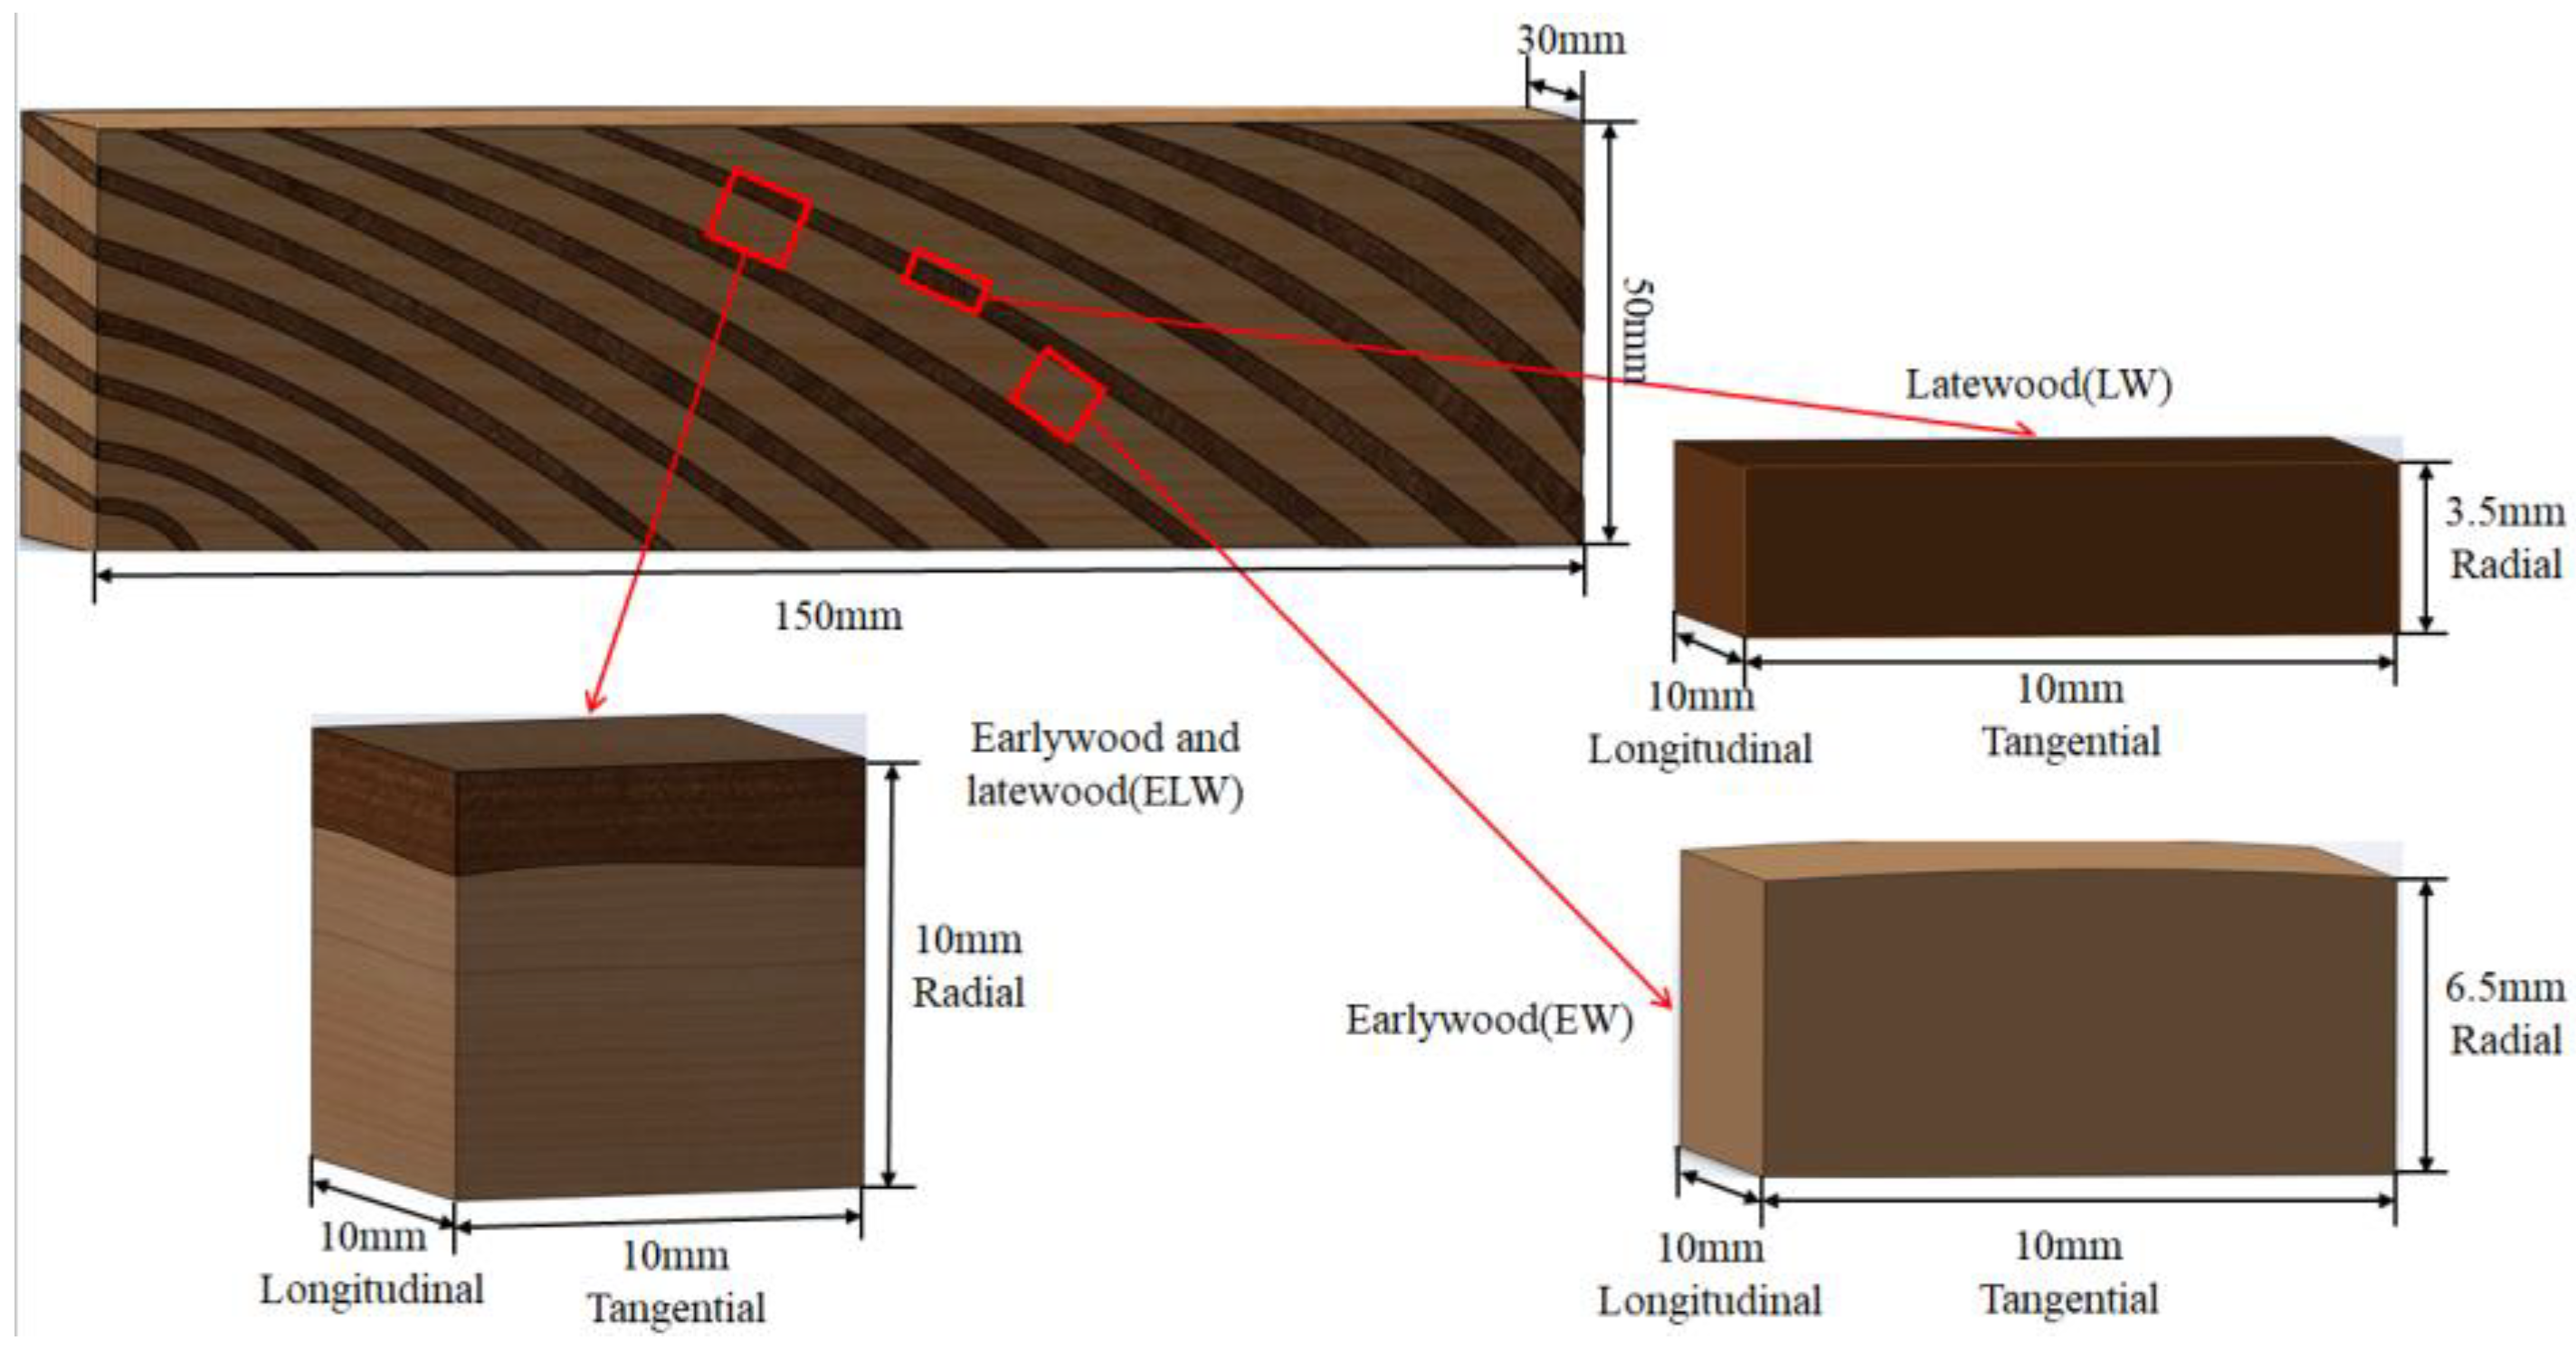
2.1. Preparation of Specimens

The wood blocks, measuring 30 mm × 50 mm × 150 mm, located around the 18th annual ring counting from the pith, were cut from Douglas fir (Pseudotsuga menziessi) tress. One ring width was approximately 10 mm. The density of the wood blocks was approximately 0.53 g/cm3, after conditioning at 65% RH and 20 °C. Defects, such as knots and cracks, were avoided by visual selection. The wood blocks were divided into three groups. The first group was untreated and used to prepare the control specimens. The other two groups were thermally modified for 2 h with saturated steam at 180 °C and 210 °C, respectively. Afterwards, all wood blocks were conditioned at 65% RH and 20 °C until reaching a constant weight. Sixteen specimens were cut from each group of wood blocks (Figure 1). Specifically, six specimens were cut in regions consisting of both earlywood and latewood (ELW), five specimens were cut from earlywood (EW), and five specimens from latewood (LW). For the EW and LW specimens, they were cut in the regions located at least 0.5 mm away from a growth ring boundary. One side of five ELW specimens was slightly polished using sandpaper, before adding speckle patterns by spraying black dots on the surfaces. From each group of wood blocks, five ELW specimens with speckle pattern, five EW specimens, and five LW specimens were used in the compression test, while one EW, LW, and ELW specimen were used for the microstructural observations.

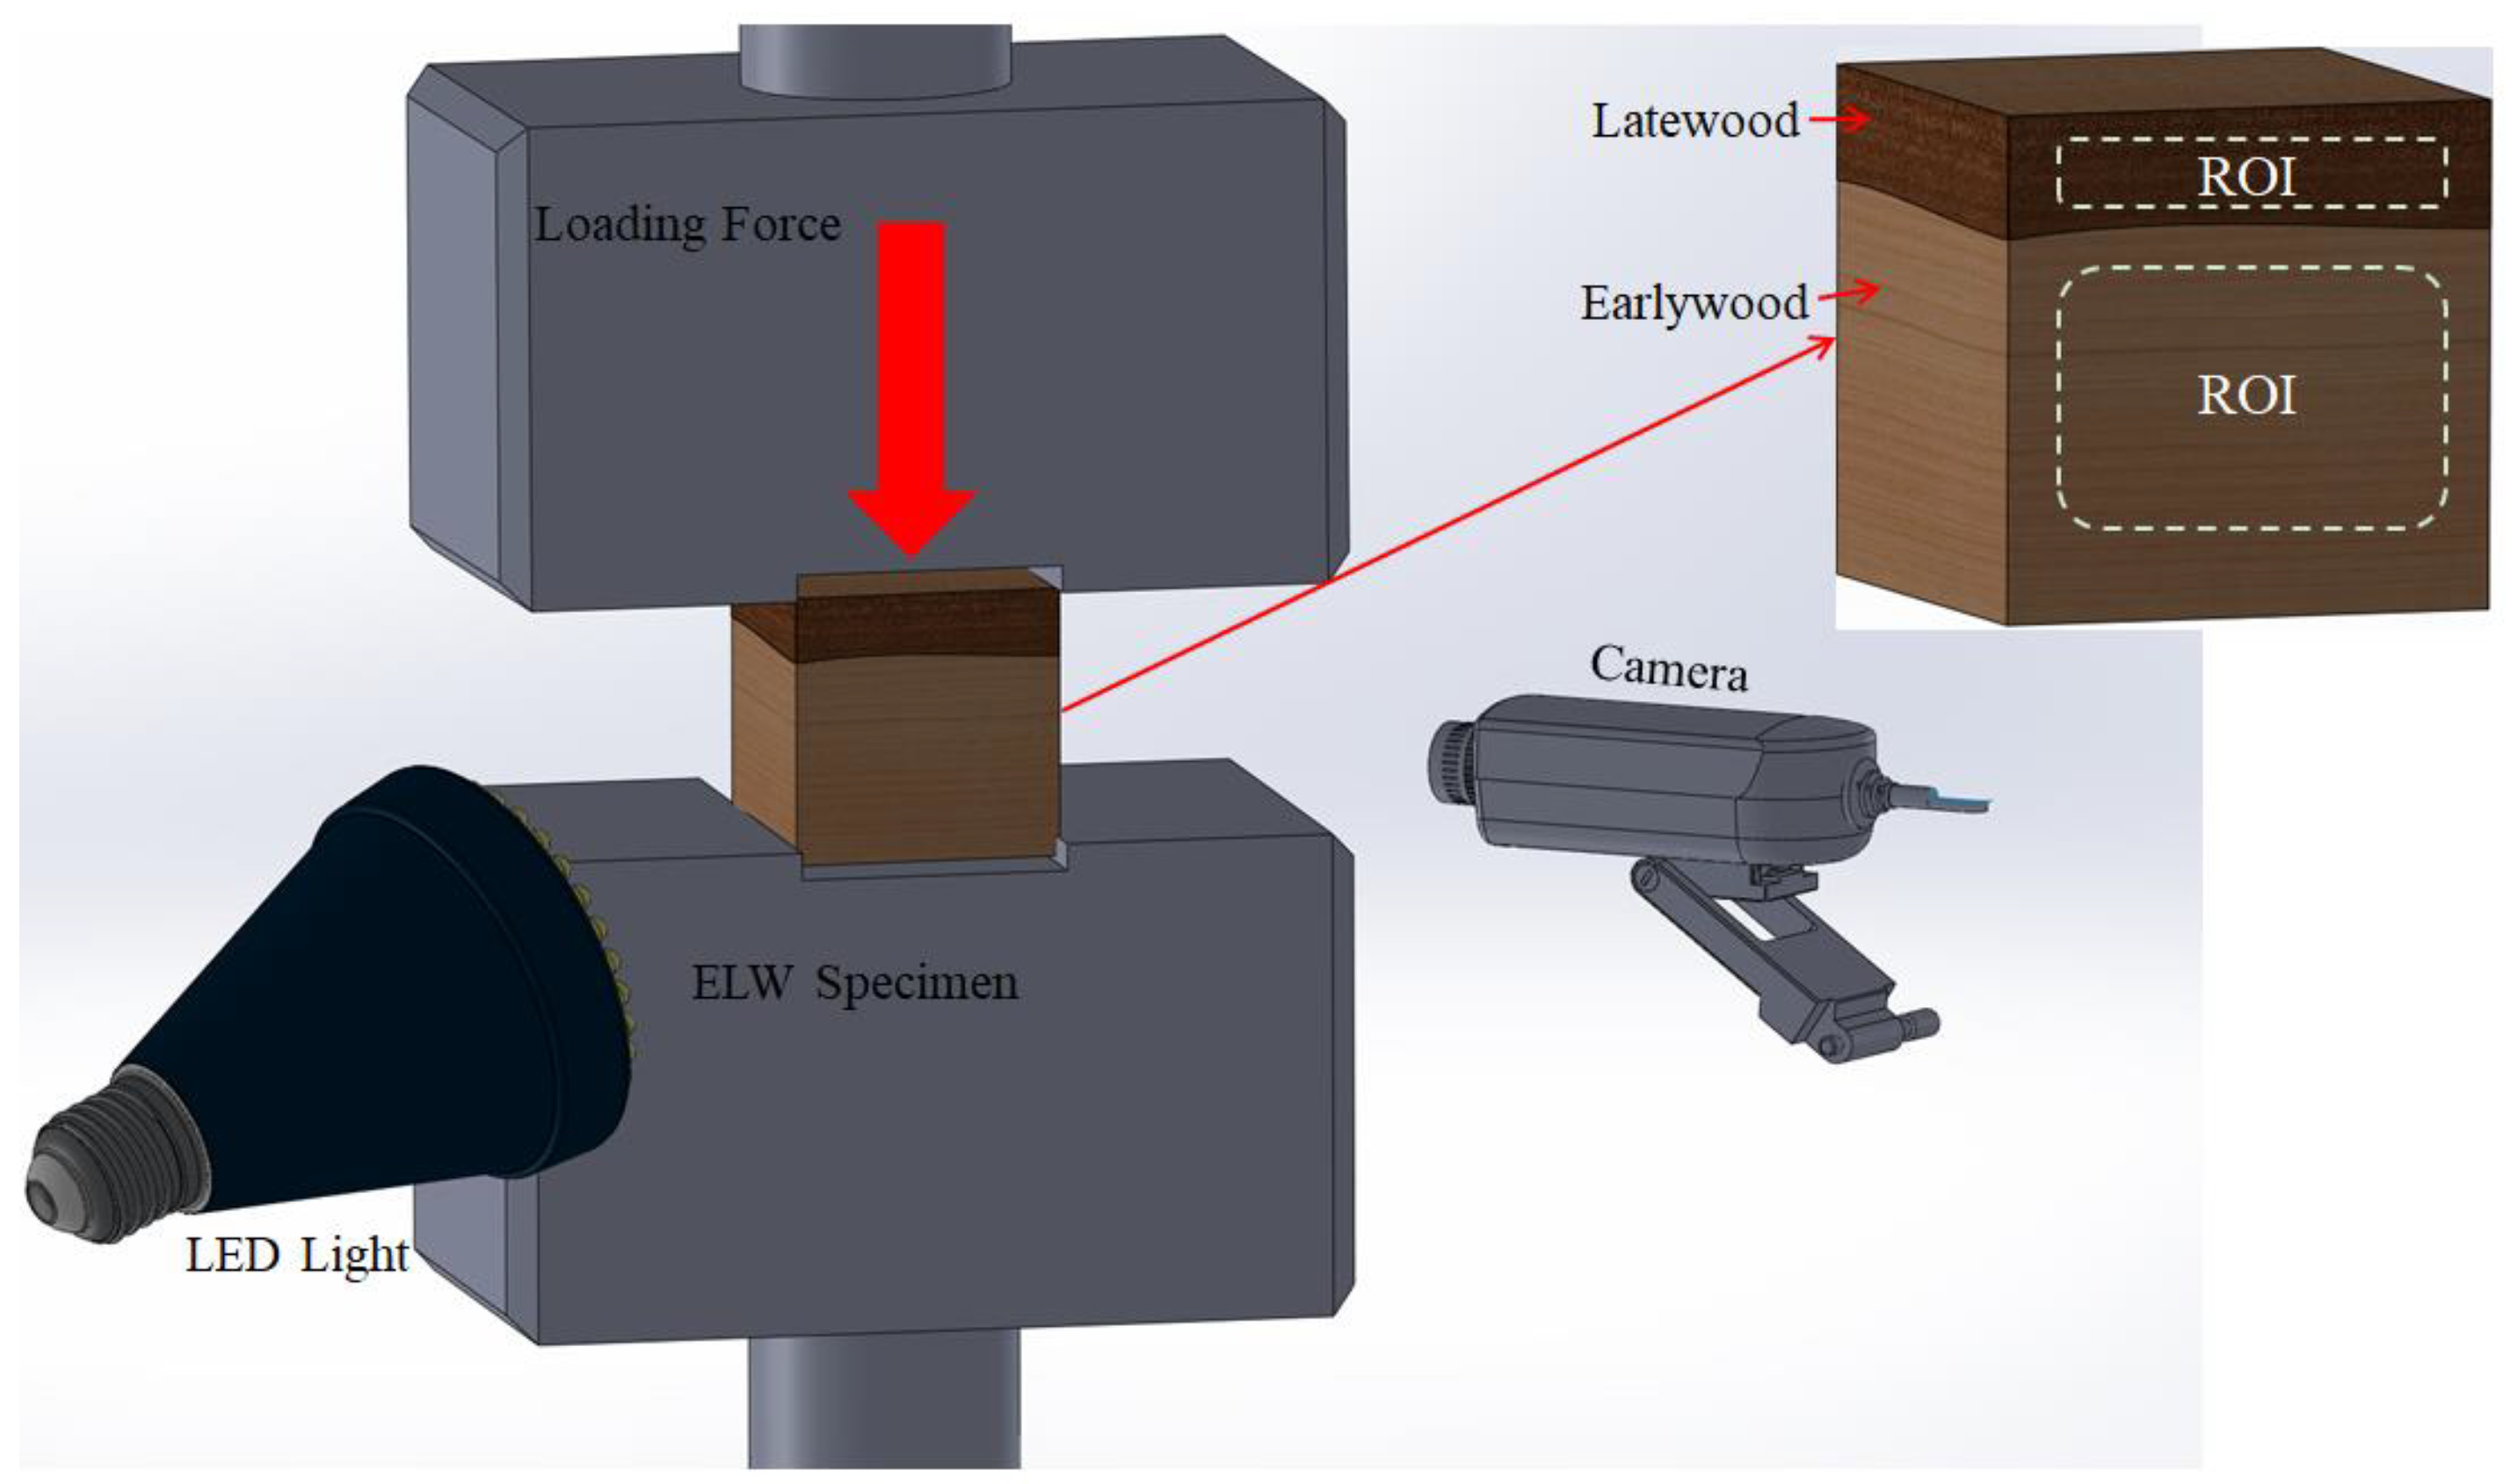
2.2. Compression Test and Digital Image Correlation

The specimens were compressed in the radial direction, which is the main direction of interest in compressed wood [25], using a universal testing machine (Instron 5966), while recording the displacement of the loading wedge (±0.001 mm) and the loading force (±0.001 N) at 10 Hz. The surface area of the loading wedge was 50.0 × 50.0 mm2. The starting position of the loading wedge was manually adjusted to a loading force of 20.0 N (CS 0.2 MPa). The velocity of the loading wedge movement was set to 1.0 mm/min. The final displacement of the loading wedge was determined based on the specimens’ thickness. For the ELW, EW, and LW specimens, the final displacement of the loading wedge was set to 3.0 mm, 2.0 mm, or 1.1 mm, respectively. As such, the final compressive ratio of the specimens was consistent. Considering the non-trivial impact of the growth ring direction on the mechanical strength of the wood, to minimize the variation between the specimens, the growth ring was kept as straight as possible.
During compression, the strain distribution of the ELW specimens was mapped using digital image correlation (DIC) (Figure 2). As such, the interaction effect of the earlywood and latewood on the compressive performance could be tracked. The image correlation was performed using the commercial software package Correlated Solutions. Photographs of the specimens’ side face were captured every 0.1 s by a CCD camera. Each square millimeter at the sample surface comprised 50 strain pixels. To increase the signal-to-noise ratio, the speckle patterns were illuminated by a Lowel Pro LED light. Image acquisition and compression of the sample were then started simultaneously. Each picture, therefore, represents a distinct loading phase.

2.3. Microstructural Observation

One EW, LW, and ELW specimen from each group of wood blocks was used to visualize the wood microstructure before compression. It is believed that these specimens can represent the possible structural characteristics without a compression test. The specimens were oven-dried at 103 °C for 5 h to minimize the impact of moisture on the image quality obtained with a scanning electron microscope (SEM) (model PW-100-018, brand Phenom). Any dust or particles on the transverse surface of the specimens were blown off. The specimens were placed in a vacuum chamber and a conductive coating was sprayed on the transverse surface. The microstructure of the transverse surface was finally visualized with SEM.
The specimens used in the compression test were oven-dried and their transverse surface was coated. The microstructure of the specimens’ compressed section was also visualized with SEM.

2.4. Data Analysis

The compressive stress of each specimen was calculated according to Equation (1). The cross-section area of each specimen was measured before the compression test.
CS = F/S
Here, CS is the compressive stress of a specimen (MPa), F is the loading force on a specimen (N), and S is the cross-section area of a specimen (mm2).
Considering that the specimens’ thicknesses were variable, the compressive ratio was used to evaluate the deformation of the specimens. The compressive stress was further analyzed based on the same compressive ratio. The compressive ratio of each specimen was calculated according to Equation (2):
CR = D × 100/T
where CR is the compressive ratio of a specimen (%), D is the displacement of the loading wedge (mm), and T is the thickness of a specimen before the compression test (mm).
The thickness of the specimens was measured after the compression test and conditioning at 65% RH and 20 °C for 7 days. The dimensional recovery of the specimens was calculated according to Equation (3).
CSR = 100 × ((T1 − T2)/(T − T2))
where CSR is the compression set recovery of a specimen (%), T is the thickness of a specimen before compression (mm), T1 is the thickness of a specimen after compression and conditioning (mm), and T2 is the thickness of a specimen right after compression (mm).
The compression test mainly induces compression and shear force; hence, this study only focuses on investigating the normal strain and shear strain distribution. For normal strain, positive values indicate tension and negative values indicate compression. For shear strain, positive strain values indicate clockwise shearing and negative strain values indicate anti-clockwise shearing. The strain was calculated with the Lagrangian finite strain. The data were further processed using MATLAB®. The average strain in the earlywood and latewood samples was investigated independently. Specifically, the strain in the region of interest (ROI) in the earlywood and latewood samples was investigated (Figure 2). The position of the ROI was away from the growth ring boundary and edges of the specimens. The absolute normal and shear strain value in the ROI was used to analyze the strain distribution in two regions (Equation (4)). The dynamic strain distribution was tracked in 10 deformation steps. Considering the thickness variations among the specimens, the interval between two deformation steps was set based on the final compressive ratio of each specimen during data processing. Specifically, the deformation interval was set to be 3% of the compressive ratio.
S i = ( i | SS | ) / n
where Si is the average normal or shear strain in region i; SS is the normal or shear strain of one pixel located in region i; n is the number of pixels in region i.

3. Results

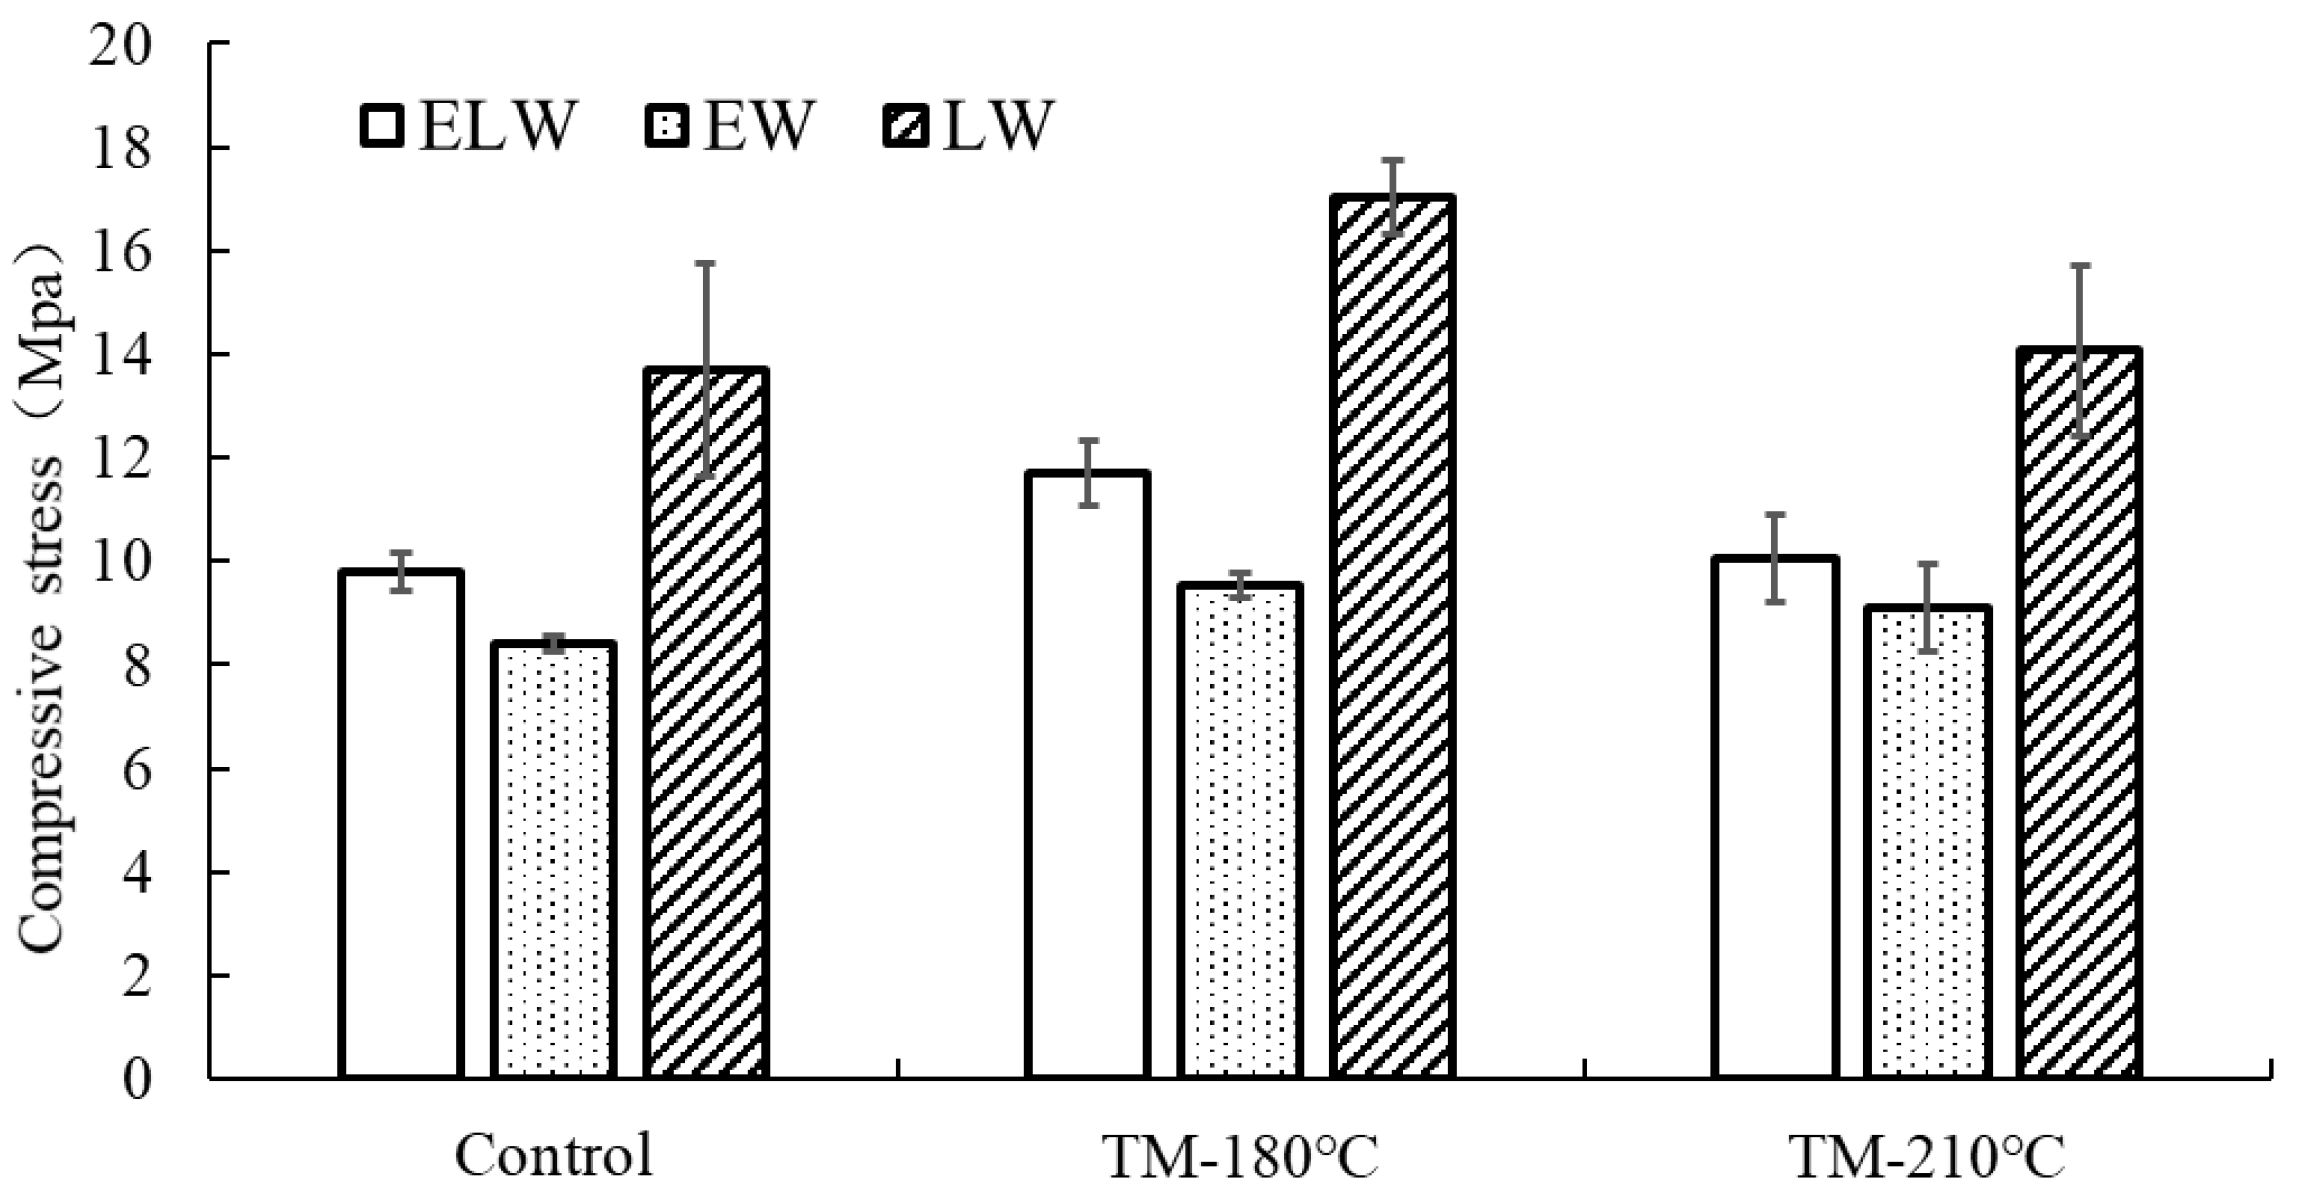
3.1. Physical and Mechanical Properties

Figure 3 shows the average compressive stress of the EW, LW, and ELW specimens when the compressive ratio was 30%. The compressive stress of the LW specimens was much higher than the EW and ELW specimens. The compressive stress of the ELW specimens was slightly higher than the EW specimens. Due to the thin cell walls and large cell lumens, the earlywood was easy to compress; hence, the compressive stress of the ELW was mainly determined by the compressive stress of the earlywood. This is in agreement with the findings from Tabarsa and Chui [26]. After the thermal modification, the compressive stress of the EW, LW, and ELW specimens was larger than the compressive stress of the untreated specimens. This is because thermal modification causes increased wood stiffness [13]. The increased cross-linking of the lignin polymer network contributes to the higher stiffness of thermally modified wood [27]. The cell wall thickness, however, decreases with increasing thermal modification temperature. In our previous study on the same wood species and modification parameters, the mass losses of the specimens treated at 180 °C and 210 °C were 2.8% and 6.1%, respectively [28]. This resulted in the lower compressive stress of the specimens modified at 210 °C.
Figure 4 presents the relationship between the compressive stress and compressive ratio. The profiles of the ELW and EW specimens are very similar. The effect of the thermal modification on the profiles of the ELW and EW specimens was not substantial. After thermal modification, there was a slight increase in compressive stress in the EW specimens when the compressive ratio was smaller than 5%. This may have been due to increased stiffness of the cell walls. Figure 4 shows the large difference between the control and thermally modified LW specimens. For the control specimens, there is more or less a linear relationship between the compressive stress and compressive ratio, which means that the structural deformation in the LW specimens was uniform as a function of time. The variation, however, in the LW specimens was large, corresponding to the findings of other researchers [29]. The different structural characteristics among specimens, i.e., the cell wall thickness, rays, and resin ducts, could have a substantial effect on the stiffness of LW. After thermal modification, the compressive stress of the LW specimens decreased when the compressive ratio was smaller than 10%, possibly due to the existence of low-stiffness areas. As such, on the one hand, the thermal modification increased the stiffness of the wood cell walls, resulting in a straightforward stress transfer to low-stiffness areas. On the other hand, the thermal modification degraded parts of the cell walls, which created lower stiffness areas [14].
After removing the loading force, the deformation of the specimens was partially recovered. The thermal modification decreased the compression set recovery, which was higher at 210 °C than at 180 °C (Table 1). In comparison to LW, the impact of the thermal modification on the compression set recovery of EW is more critical. This is because earlywood is more susceptible to thermal degradation than latewood [18,19]. For control specimens, the compression set recovery of the EW and ELW was larger than for the LW. Although the compression set recovery rates of the EW and ELW were alike, the variability (standard deviation) of the EW was much larger than that of the ELW. These phenomena were not evident in the TM-180 °C and TM-210 °C specimens. The variability of the LW was much larger than that of EW and ELW, both in specimens with and without thermal modification. Considering the significant stiffness difference between earlywood and latewood, the ELW specimens’ deformation mainly occurred in earlywood. If assuming the deformation only occurred in earlywood, the compression set recovery in the earlywood in the ELW specimens would be much higher than that of pure EW. To understand this, the microstructure and strain distribution were further investigated.

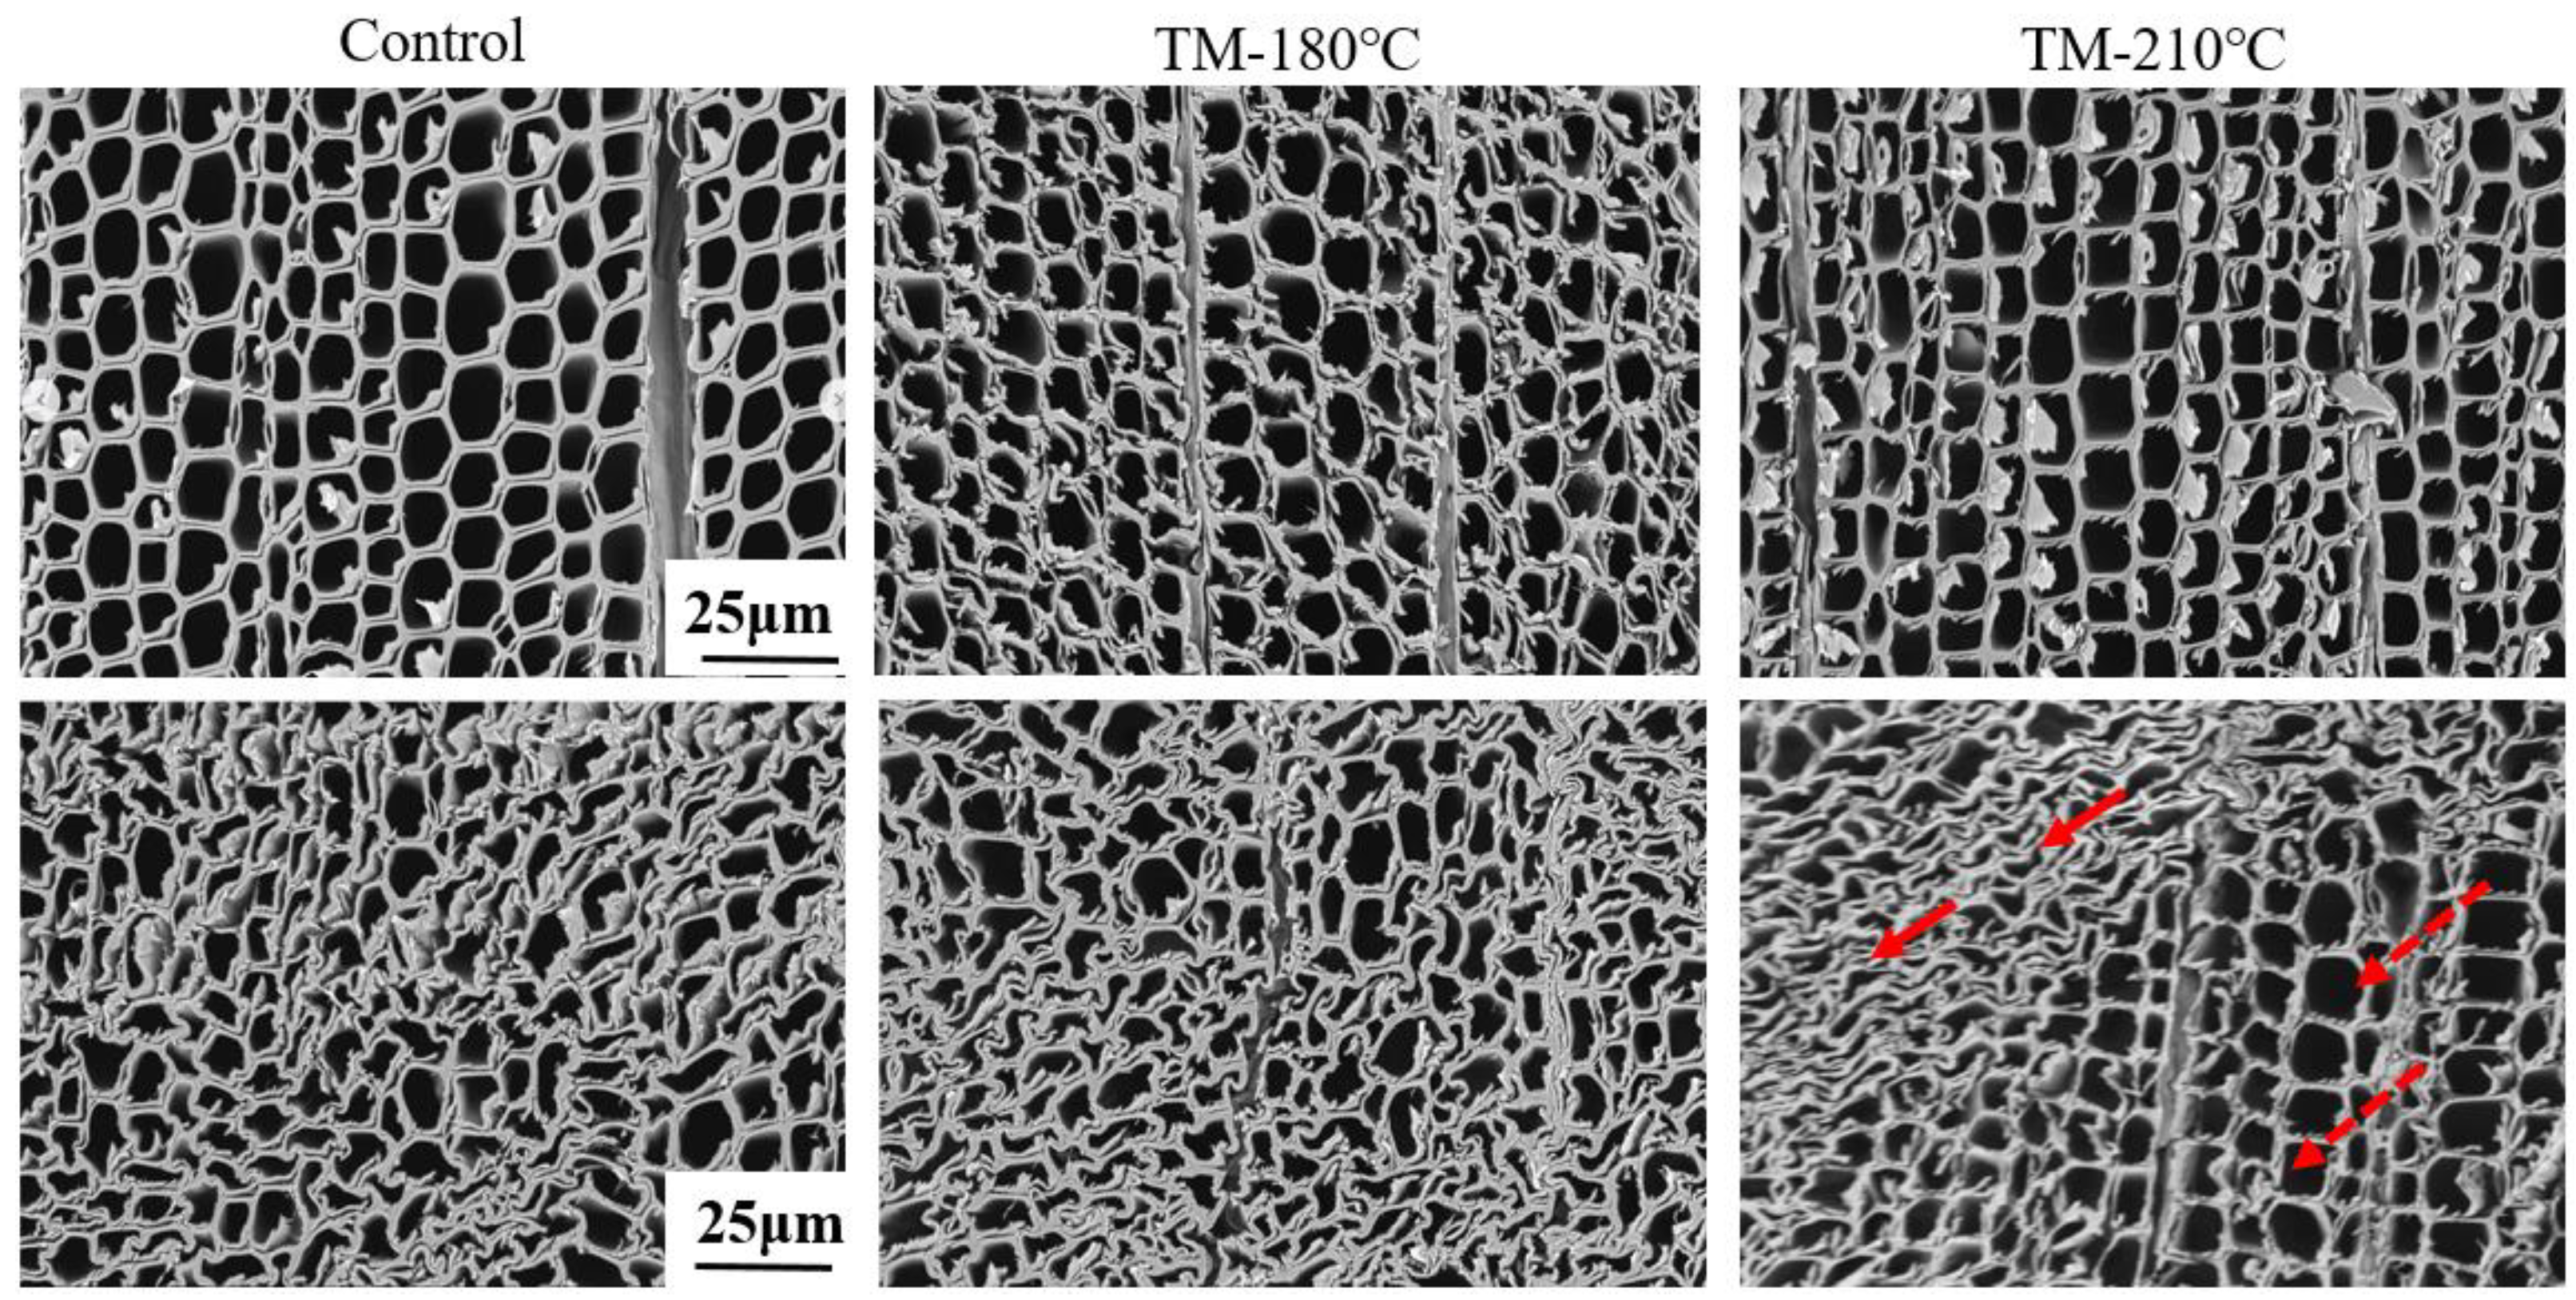
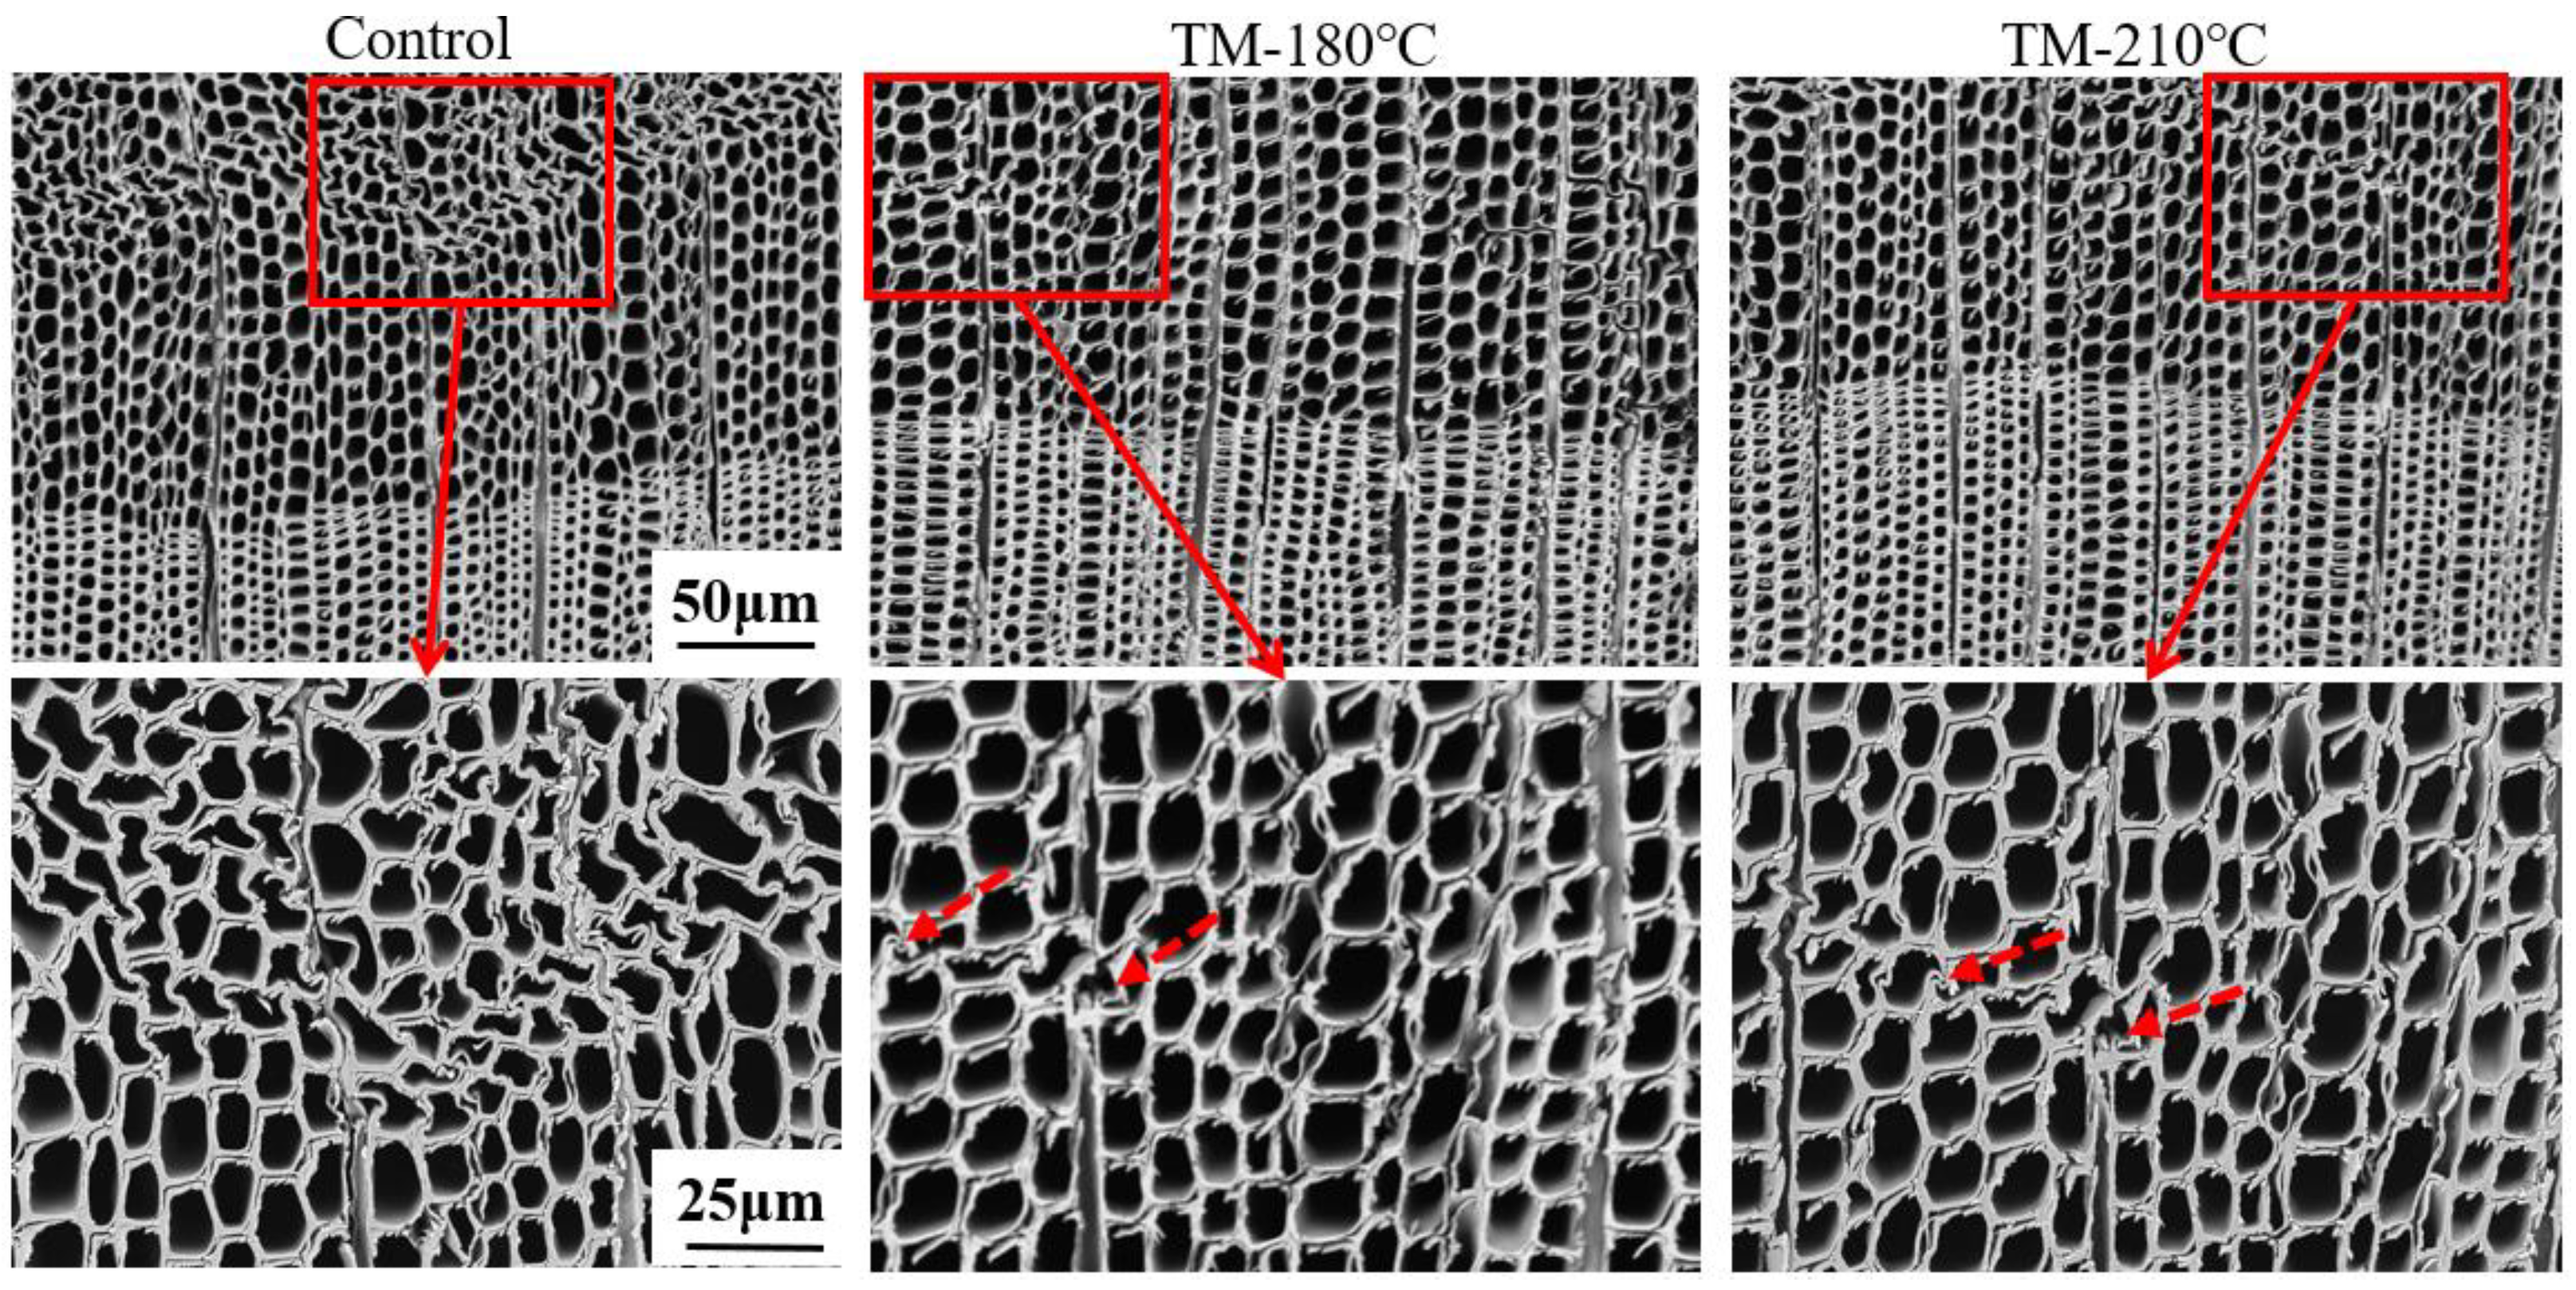
3.2. Microstructural Changes

Figure 5 and Figure 6 show the microstructure of pure earlywood (EW) and latewood (LW) with no modification, thermal modification at 180 °C (TM-180 °C), and thermal modification at 210 °C (TM-210 °C). The TM-180 °C and TM-210 °C images are less sharp because the surfaces of the thermally modified specimens were not smooth. The tracheids were compressed, resulting in significant deformation. Parts of the tracheids were even completely flattened. For the TM-210 °C specimens, the deformation of the tracheids was not as homogeneous as for the control specimens and the TM-180 °C specimens. Specifically, some wood cells were entirely compressed (Figure 5 solid arrows) but there were also tracheids with a nearly intact morphology (Figure 5 dashed arrows). Most probably, the high thermal modification temperature degraded the wood cell walls [17], although not to the same extent everywhere, resulting in large differences in local stiffness and local damage. During the compression test, the strain most probably accumulated in low-stiffness regions consisting of such low-stiffness cell walls. The cell walls with high stiffness levels, therefore, were less deformed. This is in agreement with the low compressive stress levels of thermally modified specimens at low compressive ratios (Figure 4). The thermal modification caused damages in the regions where large compression deformation occurred at low loading forces.
Instead of being flattened, tracheid buckling was found in the latewood due to compression (Figure 6). The cell walls in latewood are thick and stiff; hence, the specimens were prone to bending along one direction. After the thermal modification, the internal structure became brittle and fractures occurred in the wood rays (dashed arrows in Figure 6). Some of the tracheids did deform heavily and fissures were found in the TM-210 °C specimen (solid arrow in Figure 6).
Based on the microstructure, the spring back of the earlywood was mainly caused by the shape recovery of flattened wood cells. Due to their thin cell walls and large cell lumens, the earlywood cells could recover. The permanent deformation occurs essentially within the cell walls, which is due to micro-cracks in the cell walls and a permanent shear relaxation of the matrix between the cellulose microfibrils [30,31]. However, the flexibility of the cell walls was diminished after the thermal modification, resulting in lower compression set recovery for the thermally modified EW (Table 1). The spring back of the latewood was mainly caused by the reversal of tracheid buckling. Based on visual observations, it was found that the deformed LW changed to show less tilting after the conditioning. The tracheid buckling was possibly caused by elastic and rigid bending of the specimens. The magnitudes of elastic and rigid bending were very different between specimens, resulting in large variability in the compression set recovery of the LW specimens.
Figure 7 shows the microstructure of the unmodified ELW and the ELW specimens thermally modified at 180 °C (TM-180 °C) and 210 °C (TM-210 °C). After compression, the microstructural changes mainly occurred in the earlywood, while microstructural changes in the latewood were hardly visible. This is in agreement with the findings reported by Li et al. [21]. Earlywood cells in the control specimen were deformed but the fissures were not substantial. The fissures in the earlywood in TM-180 °C and TM-210 °C were obvious (highlighted with dashed arrows in Figure 7). The emergence of the fissures was mainly due to the brittleness of the cell walls and lower amount of bound water. Compared to the EW specimens shown in Figure 5, the structural deformation in the earlywood of the ELW specimens was less severe. Considering the minor structural changes in the latewood of the ELW specimens, the deformation of the ELW specimens mainly occurred in earlywood areas. After the removal of the loading force, the earlywood tracheids of the ELW specimens were able to recover their shape to a large extent. Although the compression set recovery of the ELW specimens was similar to that of the EW specimens, the compression set recovery of the earlywood in the ELW specimens was probably even higher (Table 1). Note that the final compressive ratio of earlywood in ELW specimens was higher than the nominal 30%. If all of the deformation of the ELW specimens would have occurred in the earlywood, the final compressive ratio in the earlywood would have been 47.3%. Based on the above analysis, it seems that a combination of earlywood and latewood could protect the earlywood from structural failure to a certain extent. Latewood, thus, contributes to the large compression set recovery of earlywood in ELW specimens.

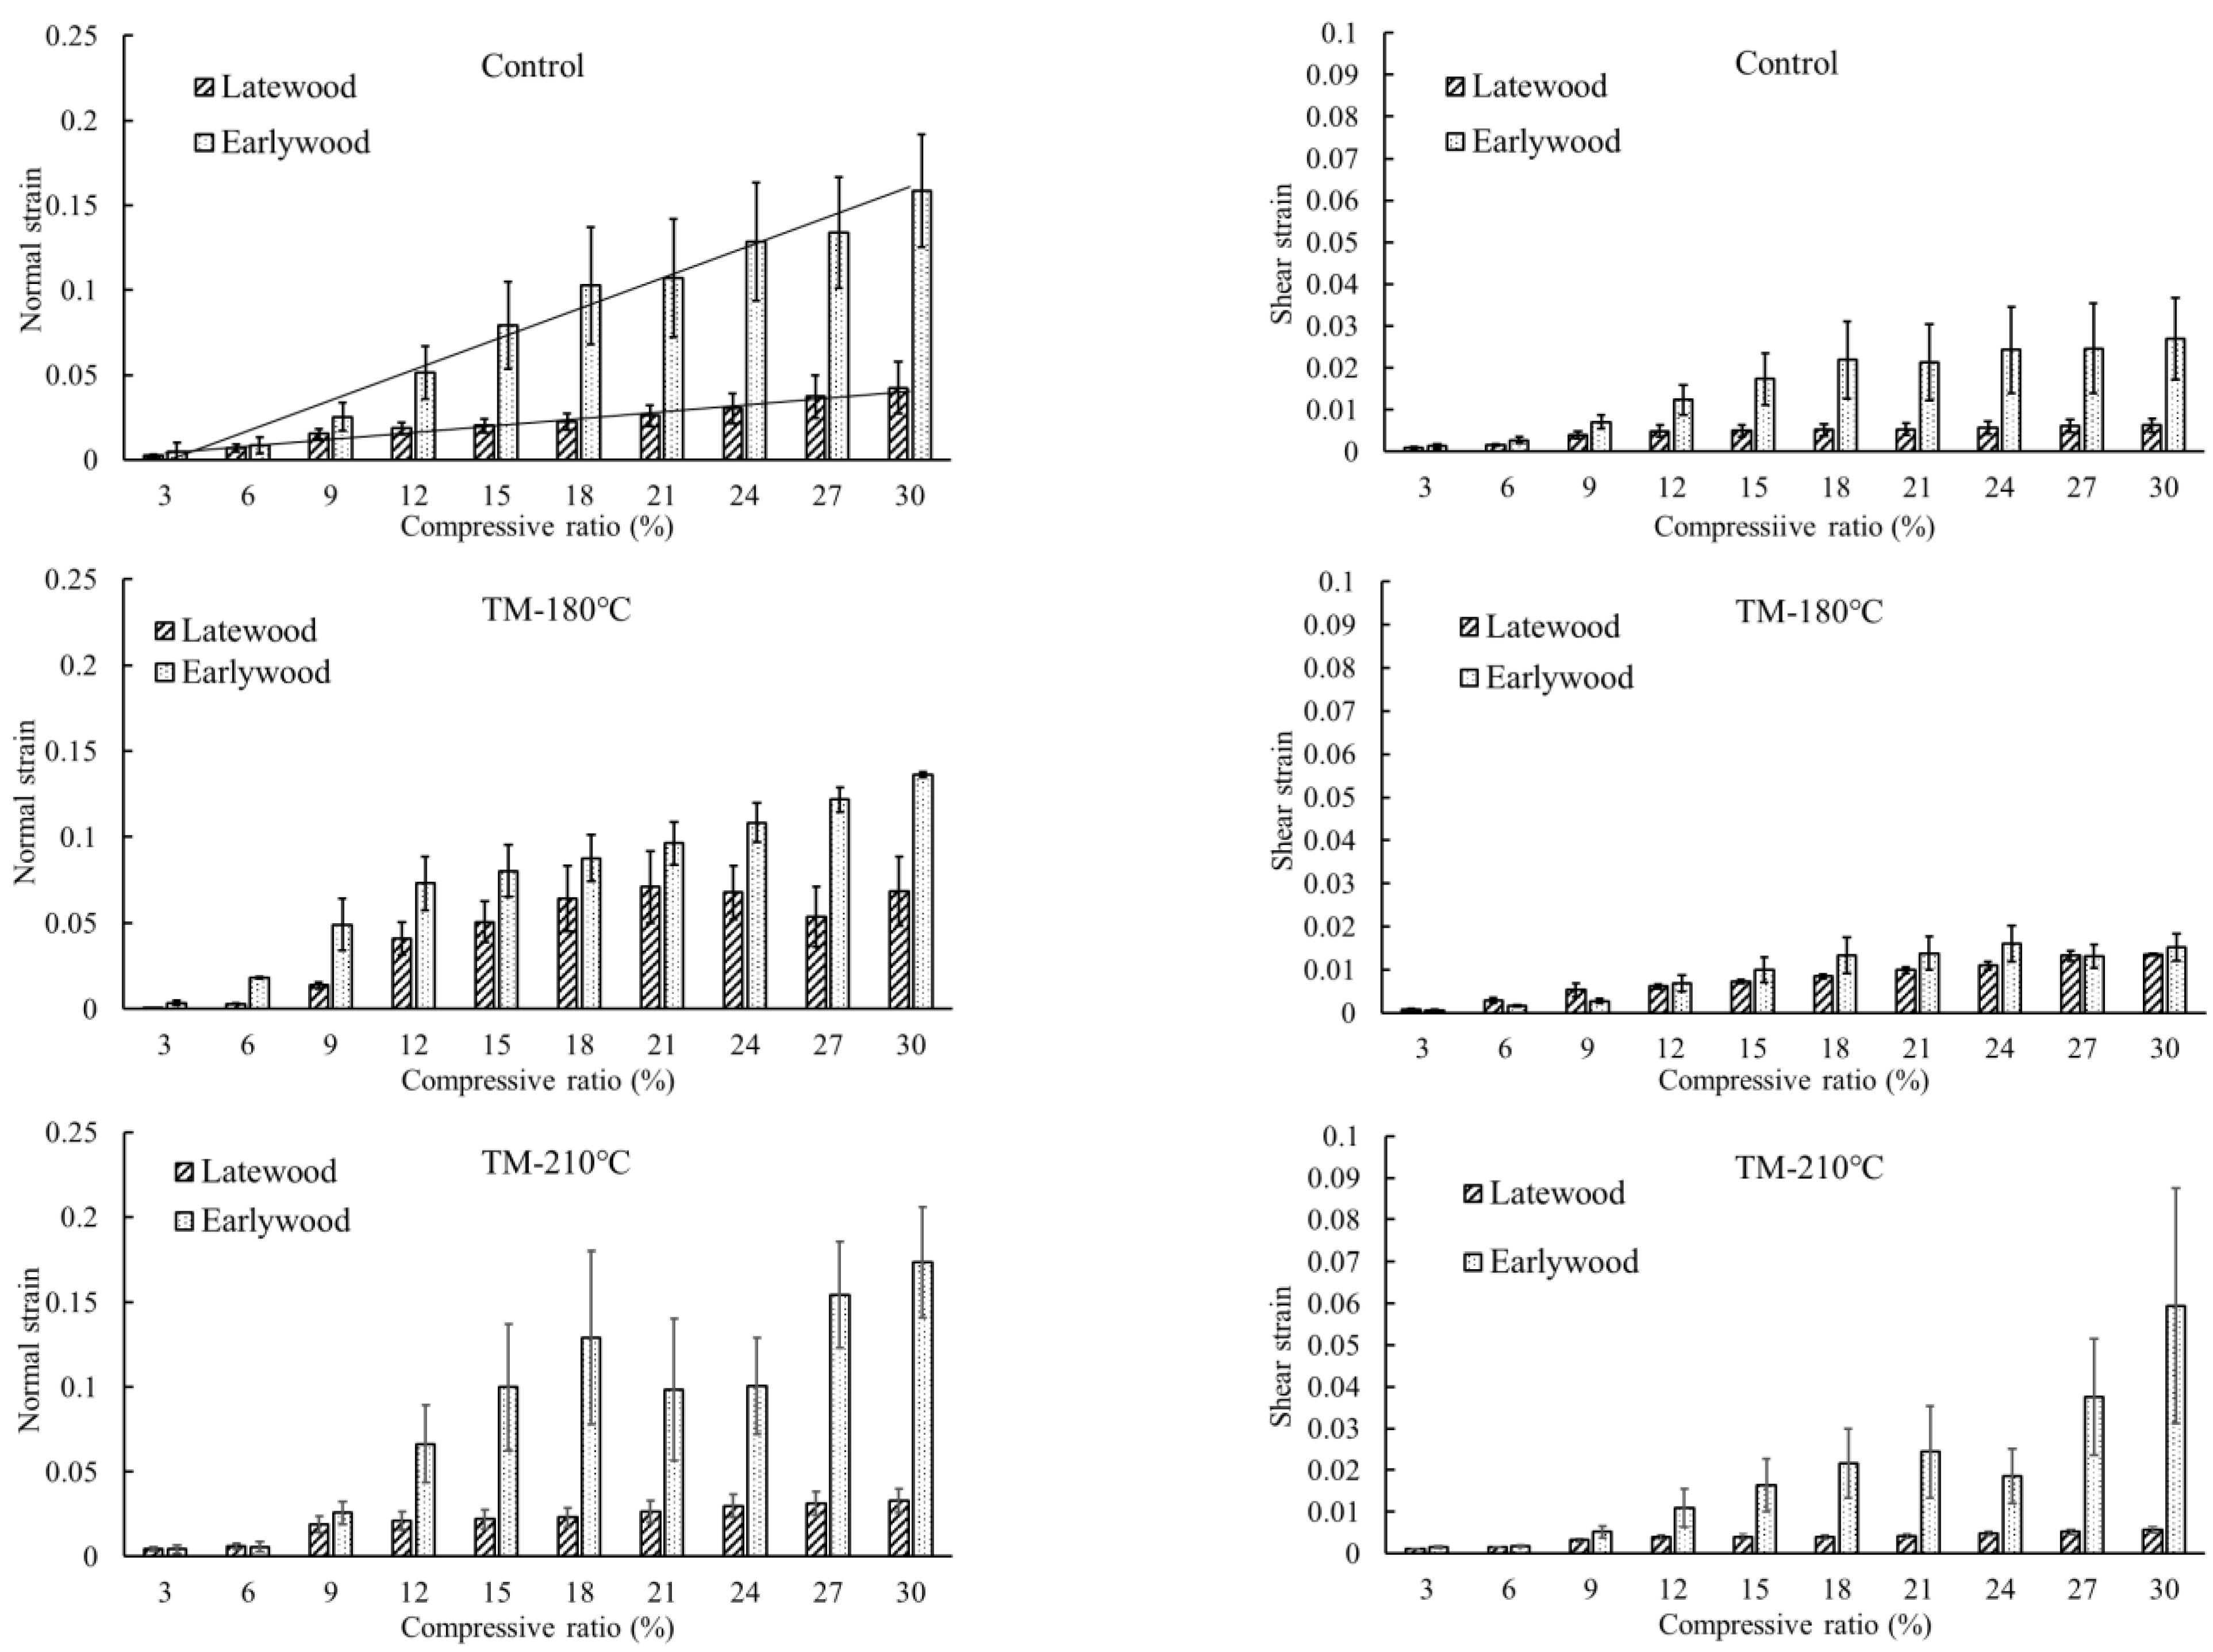
3.3. Strain Distribution in ELW Specimens

In order to understand the function of earlywood and latewood in the compressive stress of the combined ELW specimens, the strain distribution was recorded using DIC and the strain values in earlywood and latewood were calculated, respectively. Figure 8 shows the strain values in earlywood and latewood of ELW specimens at consecutive steps of the compression test. In general, the strain increases with increases in the compressive ratio and mainly accumulates in the earlywood. Latewood cells can absorb a large amount of compression energy with only a little strain due to their high stiffness. Latewood, which has thick tracheid cell walls, a small microfibril angle, and high density has a higher shear strength than earlywood, with thin cell walls, a large microfibril angle, and low density [21]. Hence, a large part of the specimens’ deformation is attributed to the more flexible earlywood.
For the control specimens, the normal strain in both earlywood and latewood areas was linearly related to the compressive ratio. This means that both earlywood and latewood areas were constantly compressed at different rates. The compression rate of the earlywood was much faster than the latewood. The shear strain in the earlywood increased along with the compressive ratio. In the latewood, the shear strain was small and barely changed after the 9% compressive ratio. This means that the structural changes in the latewood cells were trivial. This agrees with the microstructure shown in Figure 7.
For the specimens that were thermally modified, there was no linear relationship between the normal strain and compressive ratio. The normal strain in the earlywood in TM-210 °C at the 18% compressive ratio was even larger than that at the 21% compression ratio. A shear strain decrease was found in the earlywood in TM-180 °C at the 27% compressive ratio. This could be explained by the emergence of fissures in the earlywood, resulting in regional structural failure and flattening of the cells. The strain difference between the earlywood and latewood was significantly lower for TM-180 °C. The large strain in the latewood occurred because of the existence of low-stiffness areas that can be compressed at low loading forces (Figure 4), in agreement with the finding that the strain difference between the earlywood and latewood was larger after the 21% compressive ratio (Figure 8; earlywood of TM-180 °C). The homogenous strain distribution certainly contributed to the improved mechanical strength, resulting in the high compressive stress of the TM-180 °C specimens. For the TM-210 °C specimens, the strain difference between the earlywood and latewood was large due to cell wall degradation in the earlywood [18,19]. Strain accumulation in the earlywood resulted in lower compressive stress than in the TM-180 °C specimens.
Figure 9 shows the strain distributions in three randomly selected ELW specimens. Both the normal and shear strain effects mainly accumulated in the earlywood. The normal strain distribution in the earlywood in the control specimens was homogeneous. This could effectively avoid stress accumulation during compression, contributing to the high compression set recovery of the control specimens. After thermal modification, the normal strain distribution became less homogeneous and tension strain was even found due to severe local structural changes. Tension strain could be caused by the loosened structure resulting from the emergence of fissures. This corresponded with the low compression set recovery rates of the TM-180 °C and TM-210 °C specimens (Table 1). Although the shear strain was small, bi-directional shear strain was found, especially in earlywood. The shear stain in the earlywood was caused by tracheid flattening, which could be tilted either clockwise or anti-clockwise. The unidirectional shear strain indicated that the tracheid buckling in the latewood mainly occurred in a single direction.

4. Discussion

The compressive stress rates of pure earlywood (EW), pure latewood (LW), and a combination of earlywood and latewood (ELW) were measured. The combination of earlywood and latewood could protect earlywood from structural failure during compression. This study focused on understanding the compressive stress of pure earlywood, pure latewood, and the combination of earlywood and latewood. Samples were selected with straight growth ring boundaries. Obviously, shearing will have a substantial effect on the mechanical strength of wood if the growth ring boundaries are not straight. Using X-ray CT scanning could further unravel the intriguing effects of latewood and earlywood on the mechanical behavior. The effect of rays on the mechanical performances of earlywood and latewood needs to be further studied. For example, the effect of the amount of latewood on the compressive stress of ELW specimens is still not understood.

5. Conclusions

At a 30% compressive ratio, the compressive stress of the LW specimens was much higher than that of the ELW and EW specimens, while the compressive stress of the ELW specimens was higher than that of the EW specimens. The thermal modification at 180 °C (TM-180 °C) increased the compressive stress of the EW, LW, and ELW specimens. Compared to TM-180 °C, the effect of the thermal modification at 210 °C (TM-210 °C) on the compressive stress was minor. The tracheid cell walls were flattened in the EW specimens and the structural changes in the control specimens were more homogenous than in the TM-180 °C and TM-210 °C specimens. The tracheid cell walls were prone to buckling in the LW specimens and fractures in the wood rays were found in the TM-180 °C and TM-210 °C specimens. The structural changes in the latewood of the ELW specimens were not obvious, and the structural changes in the earlywood of the ELW specimens were smaller than in the pure EW specimens. Compared with the EW specimens, the earlywood zones of ELW specimens can more effectively recover to their original morphology after removing the compressive force. This phenomenon occurred in specimens with and without thermal modification.

Author Contributions

Conceptualization, J.W., W.L. and X.W.; methodology, K.Y.; data curation, K.Y.; writing—original draft preparation, W.L.; writing—review and editing, J.W., J.V.d.B. and J.V.A. All authors have read and agreed to the published version of the manuscript.

Funding

This study was funded by the Guangxi Key Laboratory of Superior Timber Tree Resource Cultivation [22-B-01-02] and Research Project of Jiangxi Forestry Bureau [No. 202135].

Data Availability Statement

The data presented in this study are available upon request from the corresponding author.

Acknowledgments

Thanks for the project of Guangxi Key Laboratory of Superior Timber Tree Resource Cultivation [22-B-01-02] and Research Project of Jiangxi Forestry Bureau [No. 202135].

Conflicts of Interest

The authors declare no conflict of interest.

References

  1. Walker, J.C. Primary Wood Processing: Principles and Practice; Springer: Dordrecht, The Netherlands, 2006. [Google Scholar]
  2. Mvolo, C.S.; Koubaa, A.; Beaulieu, J.; Cloutier, A.; Defo, M.; Yemele, M.-C. Phenotypic correlations among growth and selected wood properties in white spruce (Picea glauca (Moench) Voss). Forests 2019, 10, 589. [Google Scholar] [CrossRef] [Green Version]
  3. Hu, W.; Zhang, J. Effect of growth rings on acoustic emission characteristic signals of southern yellow pine wood cracked in mode I. Constr. Build. Mater. 2022, 329, 127092. [Google Scholar] [CrossRef]
  4. Kosiachevskyi, D.; Hachem, E.L.; Abahri, K.; Bennacer, R.; Chaouche, M. Biomaterials heterogeneous displacement, strain and swelling under hydric sorption/desorption: 2D image correlation on spruce wood. Constr. Build. Mater. 2021, 286, 122997. [Google Scholar] [CrossRef]
  5. Xu, L.; Zhang, H.; Xu, F.; Zheng, C.; Wu, J. Study on the constructions of special wettability surface of earlywood and latewood. J. For. Eng. 2022, 7, 35–42. [Google Scholar]
  6. Boutelje, J. The relationship of structure to transverse anisotropy in wood with reference to shrinkage and elasticity. Holzforschung 1962, 16, 33–46. [Google Scholar] [CrossRef]
  7. Li, W.; Zhang, Z.; Zhou, G.; Kibleur, P.; Mei, C.; Shi, J.; Van Acker, J.; Van den Bulcke, J. The effect of structural changes on the compressive strength of LVL. Wood Sci. Technol. 2020, 54, 1253–1267. [Google Scholar] [CrossRef]
  8. Nziengui, C.F.P.; Turesson, J.; Pitti, R.M.; Ekevad, M. Experimental Assessment of the Annual Growth Ring’s Impact onthe Mechanical Behavior of Temperate and Tropical Species. BioResources 2020, 9, 105–119. [Google Scholar]
  9. Lanvermann, C.; Hass, P.; Wittel, F.K.; Niemz, P. Mechanical properties of Norway spruce: Intra-ring variation and generic behavior of earlywood and latewood until failure. BioResources 2014, 9, 105–119. [Google Scholar] [CrossRef] [Green Version]
  10. Jeong, G.Y. Relationship between anatomical and mechanical properties of loblolly pine (Pinus taeda). For. Prod. J. 2013, 63, 47–53. [Google Scholar] [CrossRef]
  11. Buksnowitz, C.; Evans, R.; Müller, U.; Teischinger, A. Indented rings (hazel growth) of Norway spruce reduce anisotropy of mechanical properties. Wood Sci. Technol. 2012, 46, 1239–1246. [Google Scholar] [CrossRef]
  12. Czajkowski, Ł.; Olek, W.; Weres, J. Effects of heat treatment on thermal properties of European beech wood. Eur. J. Wood Wood Prod. 2020, 78, 425–431. [Google Scholar] [CrossRef] [Green Version]
  13. Widmann, R.; Fernandez-Cabo, J.L.; Steiger, R. Mechanical properties of thermally modified beech timber for structural purposes. Eur. J. Wood Wood Prod. 2012, 70, 775–784. [Google Scholar] [CrossRef] [Green Version]
  14. Wang, X.; Chen, X.; Xie, X.; Wu, Y.; Zhao, L.; Li, Y.; Wang, S. Effects of thermal modification on the physical, chemical and micromechanical properties of Masson pine wood (Pinus massoniana Lamb.). Holzforschung 2018, 72, 1063–1070. [Google Scholar] [CrossRef] [Green Version]
  15. Welzbacher, C.R.; Wehsener, J.; Rapp, A.O.; Haller, P. Thermo-mechanical densification combined with thermal modification of Norway spruce (Picea abies Karst) in industrial scale—Dimensional stability and durability aspects. Eur. J. Wood Wood Prod. 2008, 66, 39–49. [Google Scholar] [CrossRef]
  16. Stamzl-Tschegg, S.; Beikircher, W.; Loidl, D. Comparison of mechanical properties of thermally modified wood at growth ring and cell wall level by means of instrumented indentation tests. Holzforschung 2009, 63, 443–448. [Google Scholar] [CrossRef]
  17. Cabezas-Romero, J.L.; Salvo-Sepúlveda, L.; Contreras-Moraga, H.; Perez-Pena, N.; Sepúlveda-Villarroel, V.; Wentzel, M.; Ananías, R.A. Microstructure of thermally modified Radiata Pine wood. BioResources 2021, 16, 1523. [Google Scholar] [CrossRef]
  18. Hamada, J.; Pétrissans, A.; Mothe, F.; Ruelle, J.; Pétrissans, M.; Gérardin, P. Variations in the natural density of European oak wood affect thermal degradation during thermal modification. Ann. For. Sci. 2016, 73, 277–286. [Google Scholar] [CrossRef] [Green Version]
  19. Hamada, J.; Pétrissans, A.; Mothe, F.; Ruelle, J.; Pétrissans, M.; Gérardin, P. Intraspecific variation of European oak wood thermal stability according to radial position. Wood Sci. Technol. 2017, 51, 785–794. [Google Scholar] [CrossRef]
  20. Chen, Z.; Gabbitas, B.; Hunt, D. A thermal imaging technique for studying crack development in wood under torsional loading. J. Mater. Sci. 2005, 40, 1929–1935. [Google Scholar] [CrossRef]
  21. Li, W.; Zhang, Z.; Wang, X.; Mei, C.; Van Acker, J.; Van den Bulcke, J. Understanding the effect of growth ring orientation on the compressive strength perpendicular to the grain of thermally treated wood. Wood Sci. Technol. 2021, 55, 1439–1456. [Google Scholar] [CrossRef]
  22. Li, W.; Zhang, Z.; Yang, K.; Mei, C.; Van den Bulcke, J.; Van Acker, J. Understanding the effect of combined thermal treatment and phenol–formaldehyde resin impregnation on the compressive stress of wood. Wood Sci. Technol. 2022, 56, 1071–1086. [Google Scholar] [CrossRef]
  23. Kutnar, A.; Sandberg, D.; Haller, P. Compressed and moulded wood from processing to products. Holzforschung 2015, 69, 885–897. [Google Scholar] [CrossRef]
  24. Tu, D.; Chen, C.; Zhou, Q.; Ou, R.; Wang, X. Research progress of thermo-mechanical compression techniques for wood products. J. For. Eng. 2021, 6, 13–20. [Google Scholar]
  25. Dubey, M.K.; Pang, S.; Chauhan, S.; Walker, J. Dimensional stability, fungal resistance and mechanical properties of radiata pine after combined thermo-mechanical compression and oil heat-treatment. Holzforschung 2016, 70, 793–800. [Google Scholar] [CrossRef]
  26. Tabarsa, T.; Chui, Y.H. Stress-strain response of wood under radial compression. Part I. Test method and influences of cellular properties. Wood Fiber Sci. 2000, 32, 144–152. [Google Scholar]
  27. Boonstra, M.J.; Van Acker, J.; Tjeerdsma, B.F.; Kegel, E.V. Strength properties of thermally modified softwoods and its relation to polymeric structural wood constituents. Ann. For. Sci. 2007, 64, 679–690. [Google Scholar] [CrossRef] [Green Version]
  28. Li, M.; Zhang, S.; Wang, Y.; Ren, H. Effect of Microstructures on the Shear Strength of Larix kaempferi. Forests 2021, 12, 830. [Google Scholar] [CrossRef]
  29. Mańkowski, P.; Laskowska, A. Compressive strength parallel to grain of earlywood and latewood of yellow pine. Maderas. Cienc. Y Tecnol. 2021, 23. [Google Scholar] [CrossRef]
  30. Xiang, E.; Feng, S.; Yang, S.; Huang, R. Sandwich compression of wood: Effect of superheated steam treatment on sandwich compression fixation and its mechanisms. Wood Sci. Technol. 2020, 54, 1529–1549. [Google Scholar] [CrossRef]
  31. Keckes, J.; Burgert, I.; Frühmann, K.; Müller, M.; Kölln, K.; Hamilton, M.; Burghammer, M.; Roth, S.V.; Stanzl-Tschegg, S.; Fratzl, P. Cell-wall recovery after irreversible deformation of wood. Nat. Mater. 2003, 2, 810–813. [Google Scholar] [CrossRef]
Figure 1. Illustration of the preparation of specimens.
Forests 14 01376 g001
Figure 2. Illustration of the compression test and digital image correlation.
Forests 14 01376 g002
Figure 3. The compressive stress of the EW, LW, and ELW specimens with and without thermal modification™ at a 30% compressive ratio.
Forests 14 01376 g003
Figure 4. The relationship between stress and deformation in three different groups of specimens with and without thermal modification (TM). Dashed lines indicate the standard deviation.
Forests 14 01376 g004
Figure 5. The microstructure of pure earlywood (EW) before (top row) and after (bottom row) the compression test. TM-180 °C indicates thermal modification at 180 °C. TM-210 °C indicates thermal modification at 210 °C. Solid arrows indicate entirely compressed cell walls. Dashed arrows indicate nearly intact cell walls.
Forests 14 01376 g005
Figure 6. The microstructures of pure latewood (LW) before (top row) and after (bottom row) compression. TM-180 °C indicates thermal modification at 180 °C and TM-210 °C indicates thermal modification at 210 °C. Solid arrows indicate cell wall tracheids’ deformation. Dashed arrows indicate fractures in wood rays.
Forests 14 01376 g006
Figure 7. Microstructures of both earlywood and latewood after compression, visualized with SEM. The regions highlighted with squares are magnified in the bottom row. TM-180 °C indicates thermal modification at 180 °C. TM-210 °C indicates thermal modification at 210 °C. Dashed lines indicate fissures in earlywood.
Forests 14 01376 g007
Figure 8. Normal and shear strain values in earlywood and latewood in the ELW specimens at different displacement steps. Displacement is the movement of the loading wedge during compression. TM-180 °C indicates thermal modification at 180 °C. TM-210 °C indicates thermal modification at 210 °C.
Forests 14 01376 g008
Figure 9. Normal (top row) and shear strain (bottom row) distributions in three ELW specimens at the 90% compressive ratio.
Forests 14 01376 g009
Table 1. Compression set recovery of the specimens with and without thermal modification.
Sample (N = 5)ControlTM-180 °CTM-210 °C
EW (%)58.6 (18.9)29.0 (7.9)10.8 (3.8)
LW (%)49.1 (36.2)35.3 (24.8)23.9 (14.9)
ELW (%)61.1 (4.4)33.9 (11.7)16.2 (6.1)
ELW-E (%)80.0 (14.9)44.4 (16.0)21.6 (9.6)
Note: EW indicates earlywood specimens. LW indicates latewood specimens. ELW indicates combined earlywood and latewood specimens. ELW-E indicates earlywood in ELW specimens. TM-180 °C indicates the specimens thermally modified at 180 °C. TM-210 °C indicates the specimens thermally modified at 210 °C. Values in bracket indicate the standard deviations.
Disclaimer/Publisher’s Note: The statements, opinions and data contained in all publications are solely those of the individual author(s) and contributor(s) and not of MDPI and/or the editor(s). MDPI and/or the editor(s) disclaim responsibility for any injury to people or property resulting from any ideas, methods, instructions or products referred to in the content.

