
Research on Walnut (Juglans regia L.) Classification Based on Convolutional Neural Networks and Landsat-8 Remote Sensing Imagery


Abstract
1. Introduction
2. Materials and Methods
2.1. Research Area and Image Acquisition
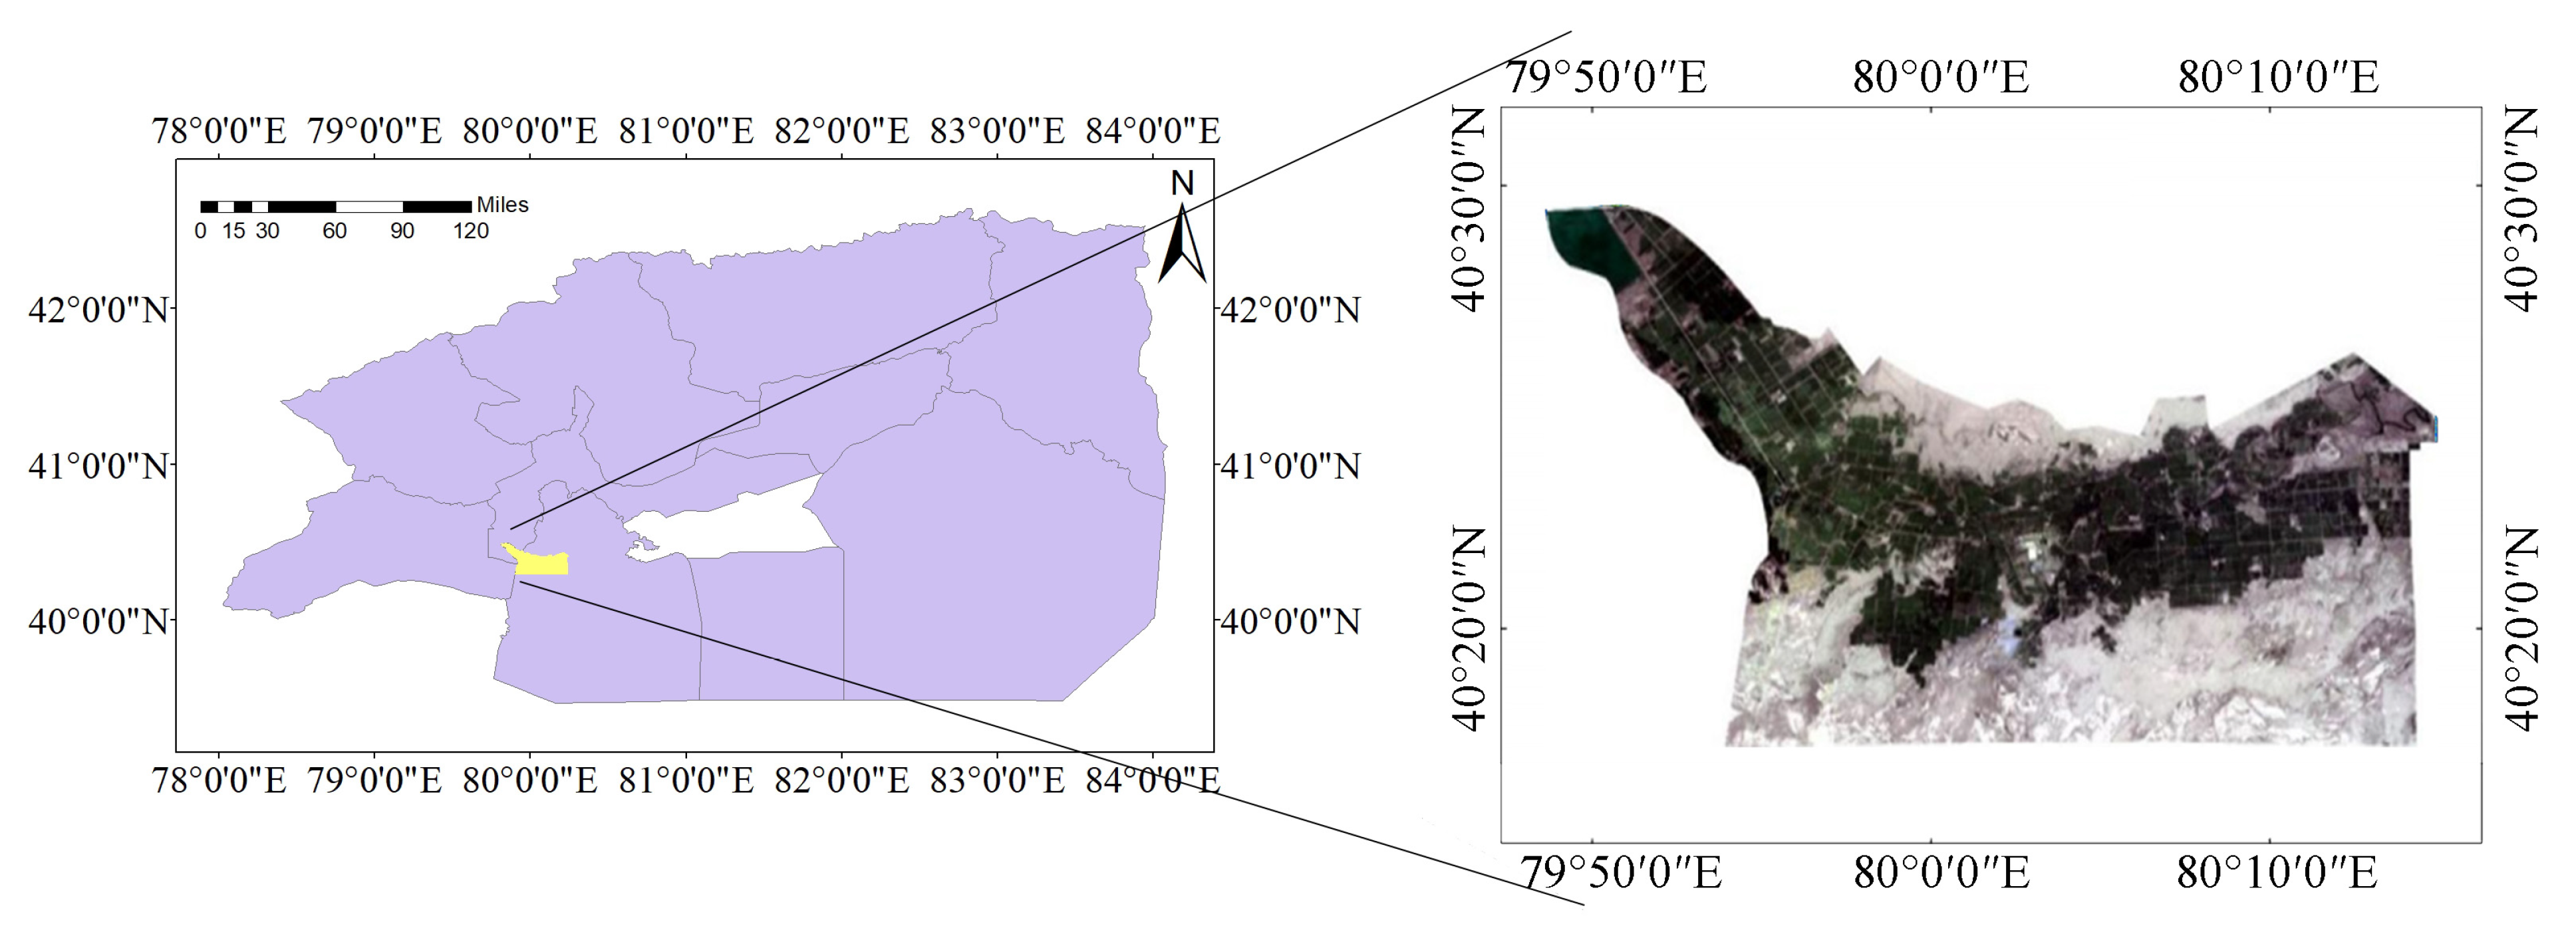
2.1.1. Research Area
2.1.2. Data Information and Experimental Environment
2.1.3. Methodological Models Used in the Study
2.2. Convolution Neural Network
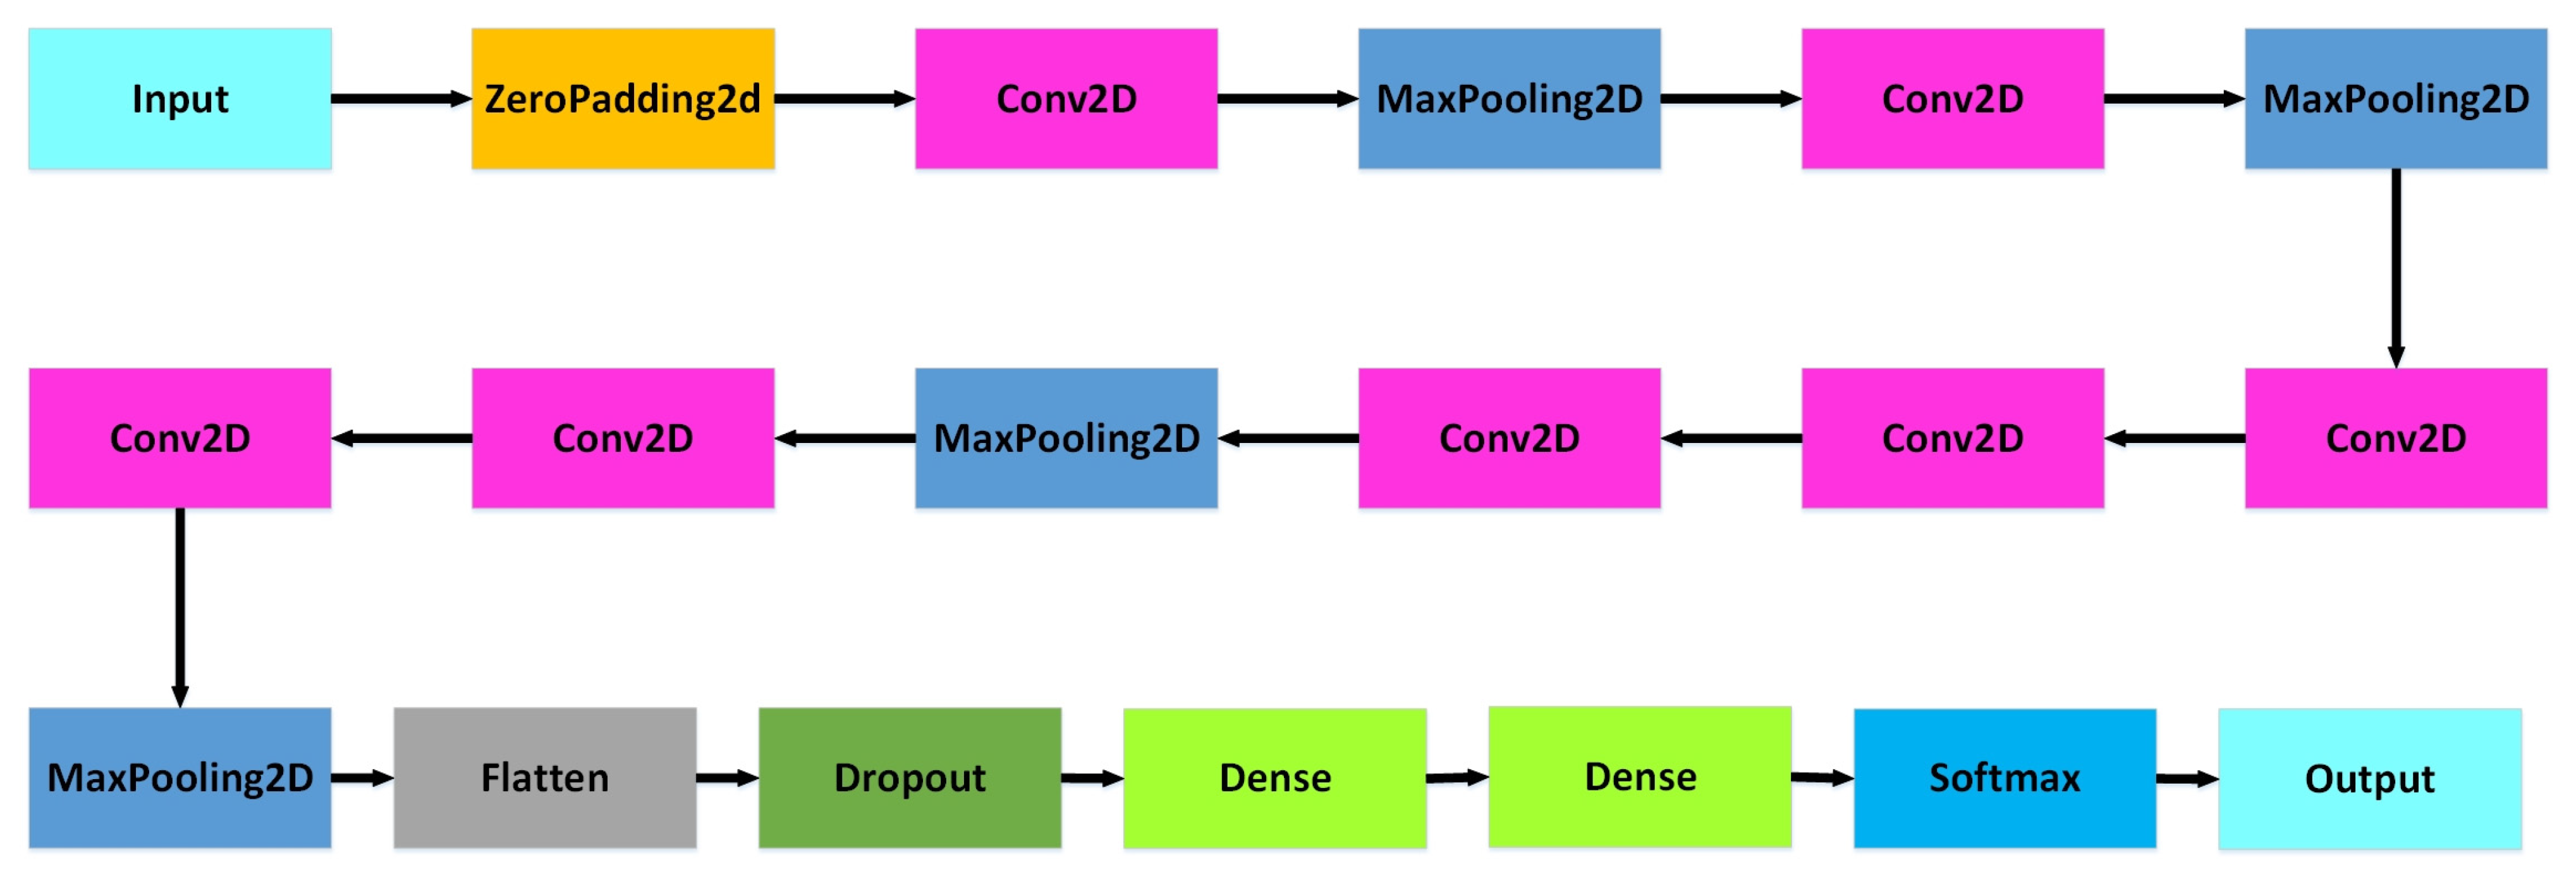
2.2.1. AlexNet
2.2.2. VGG
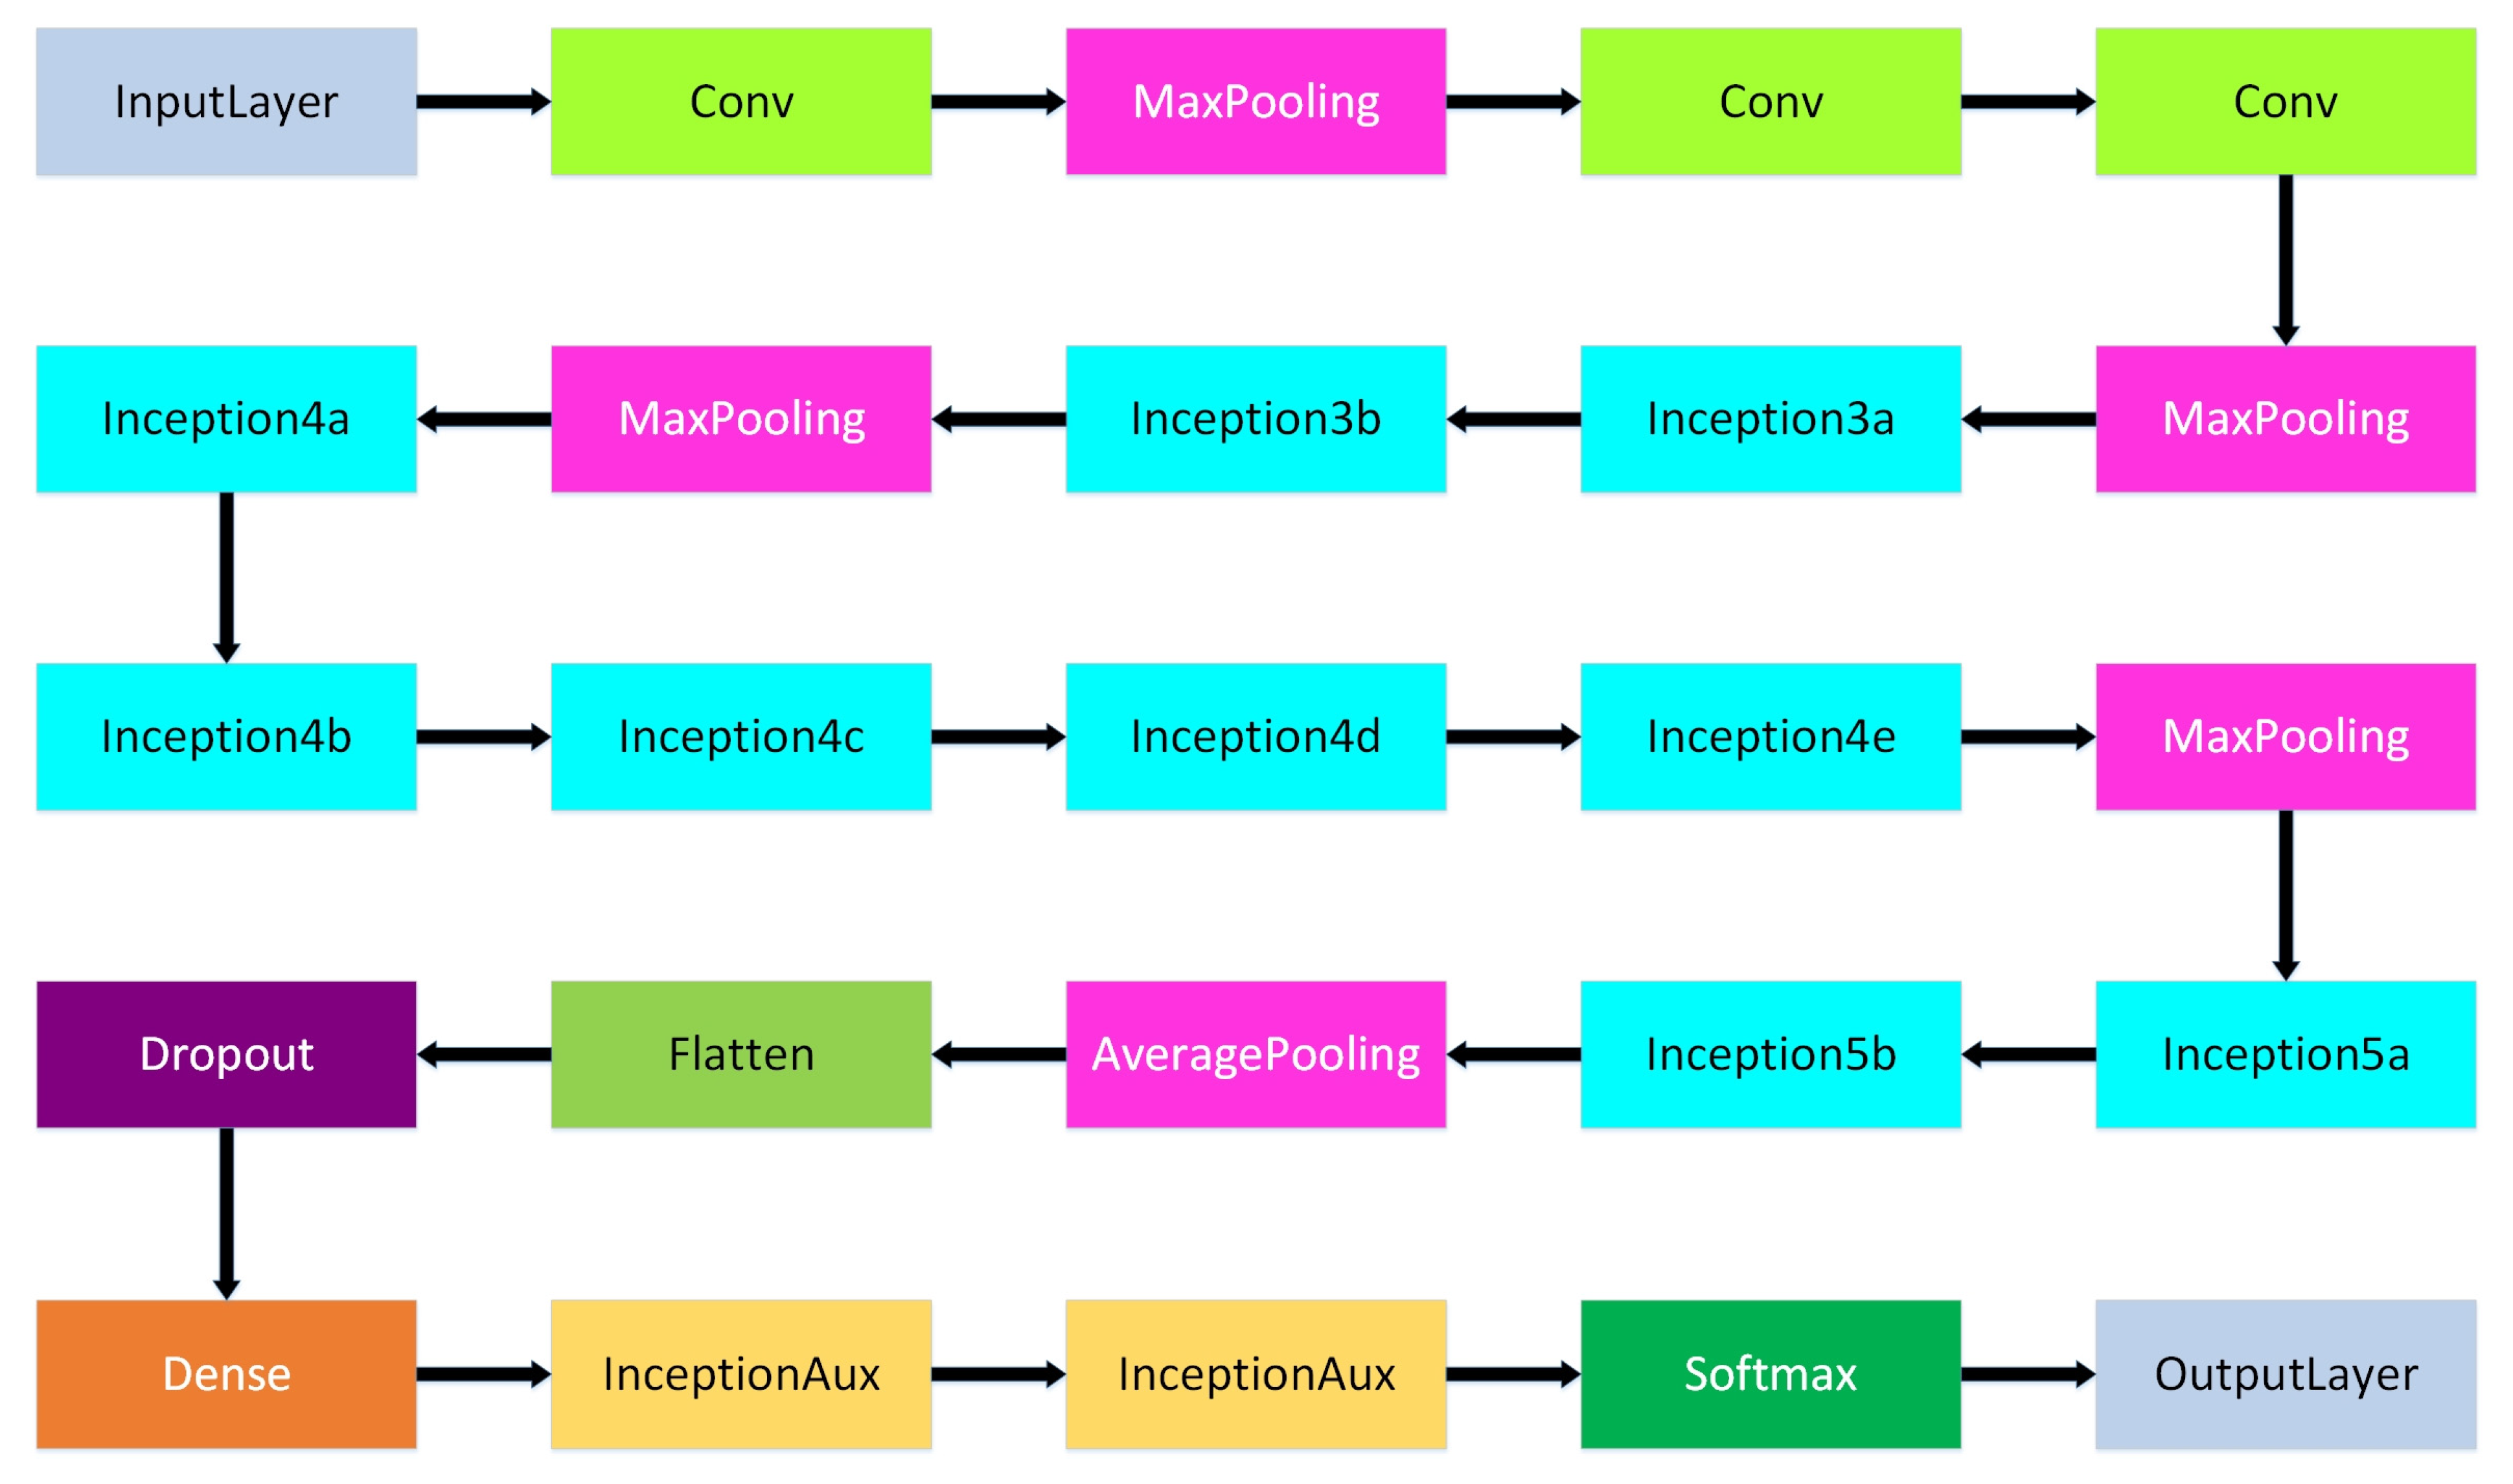
2.2.3. GoogleNet
2.2.4. ResNet
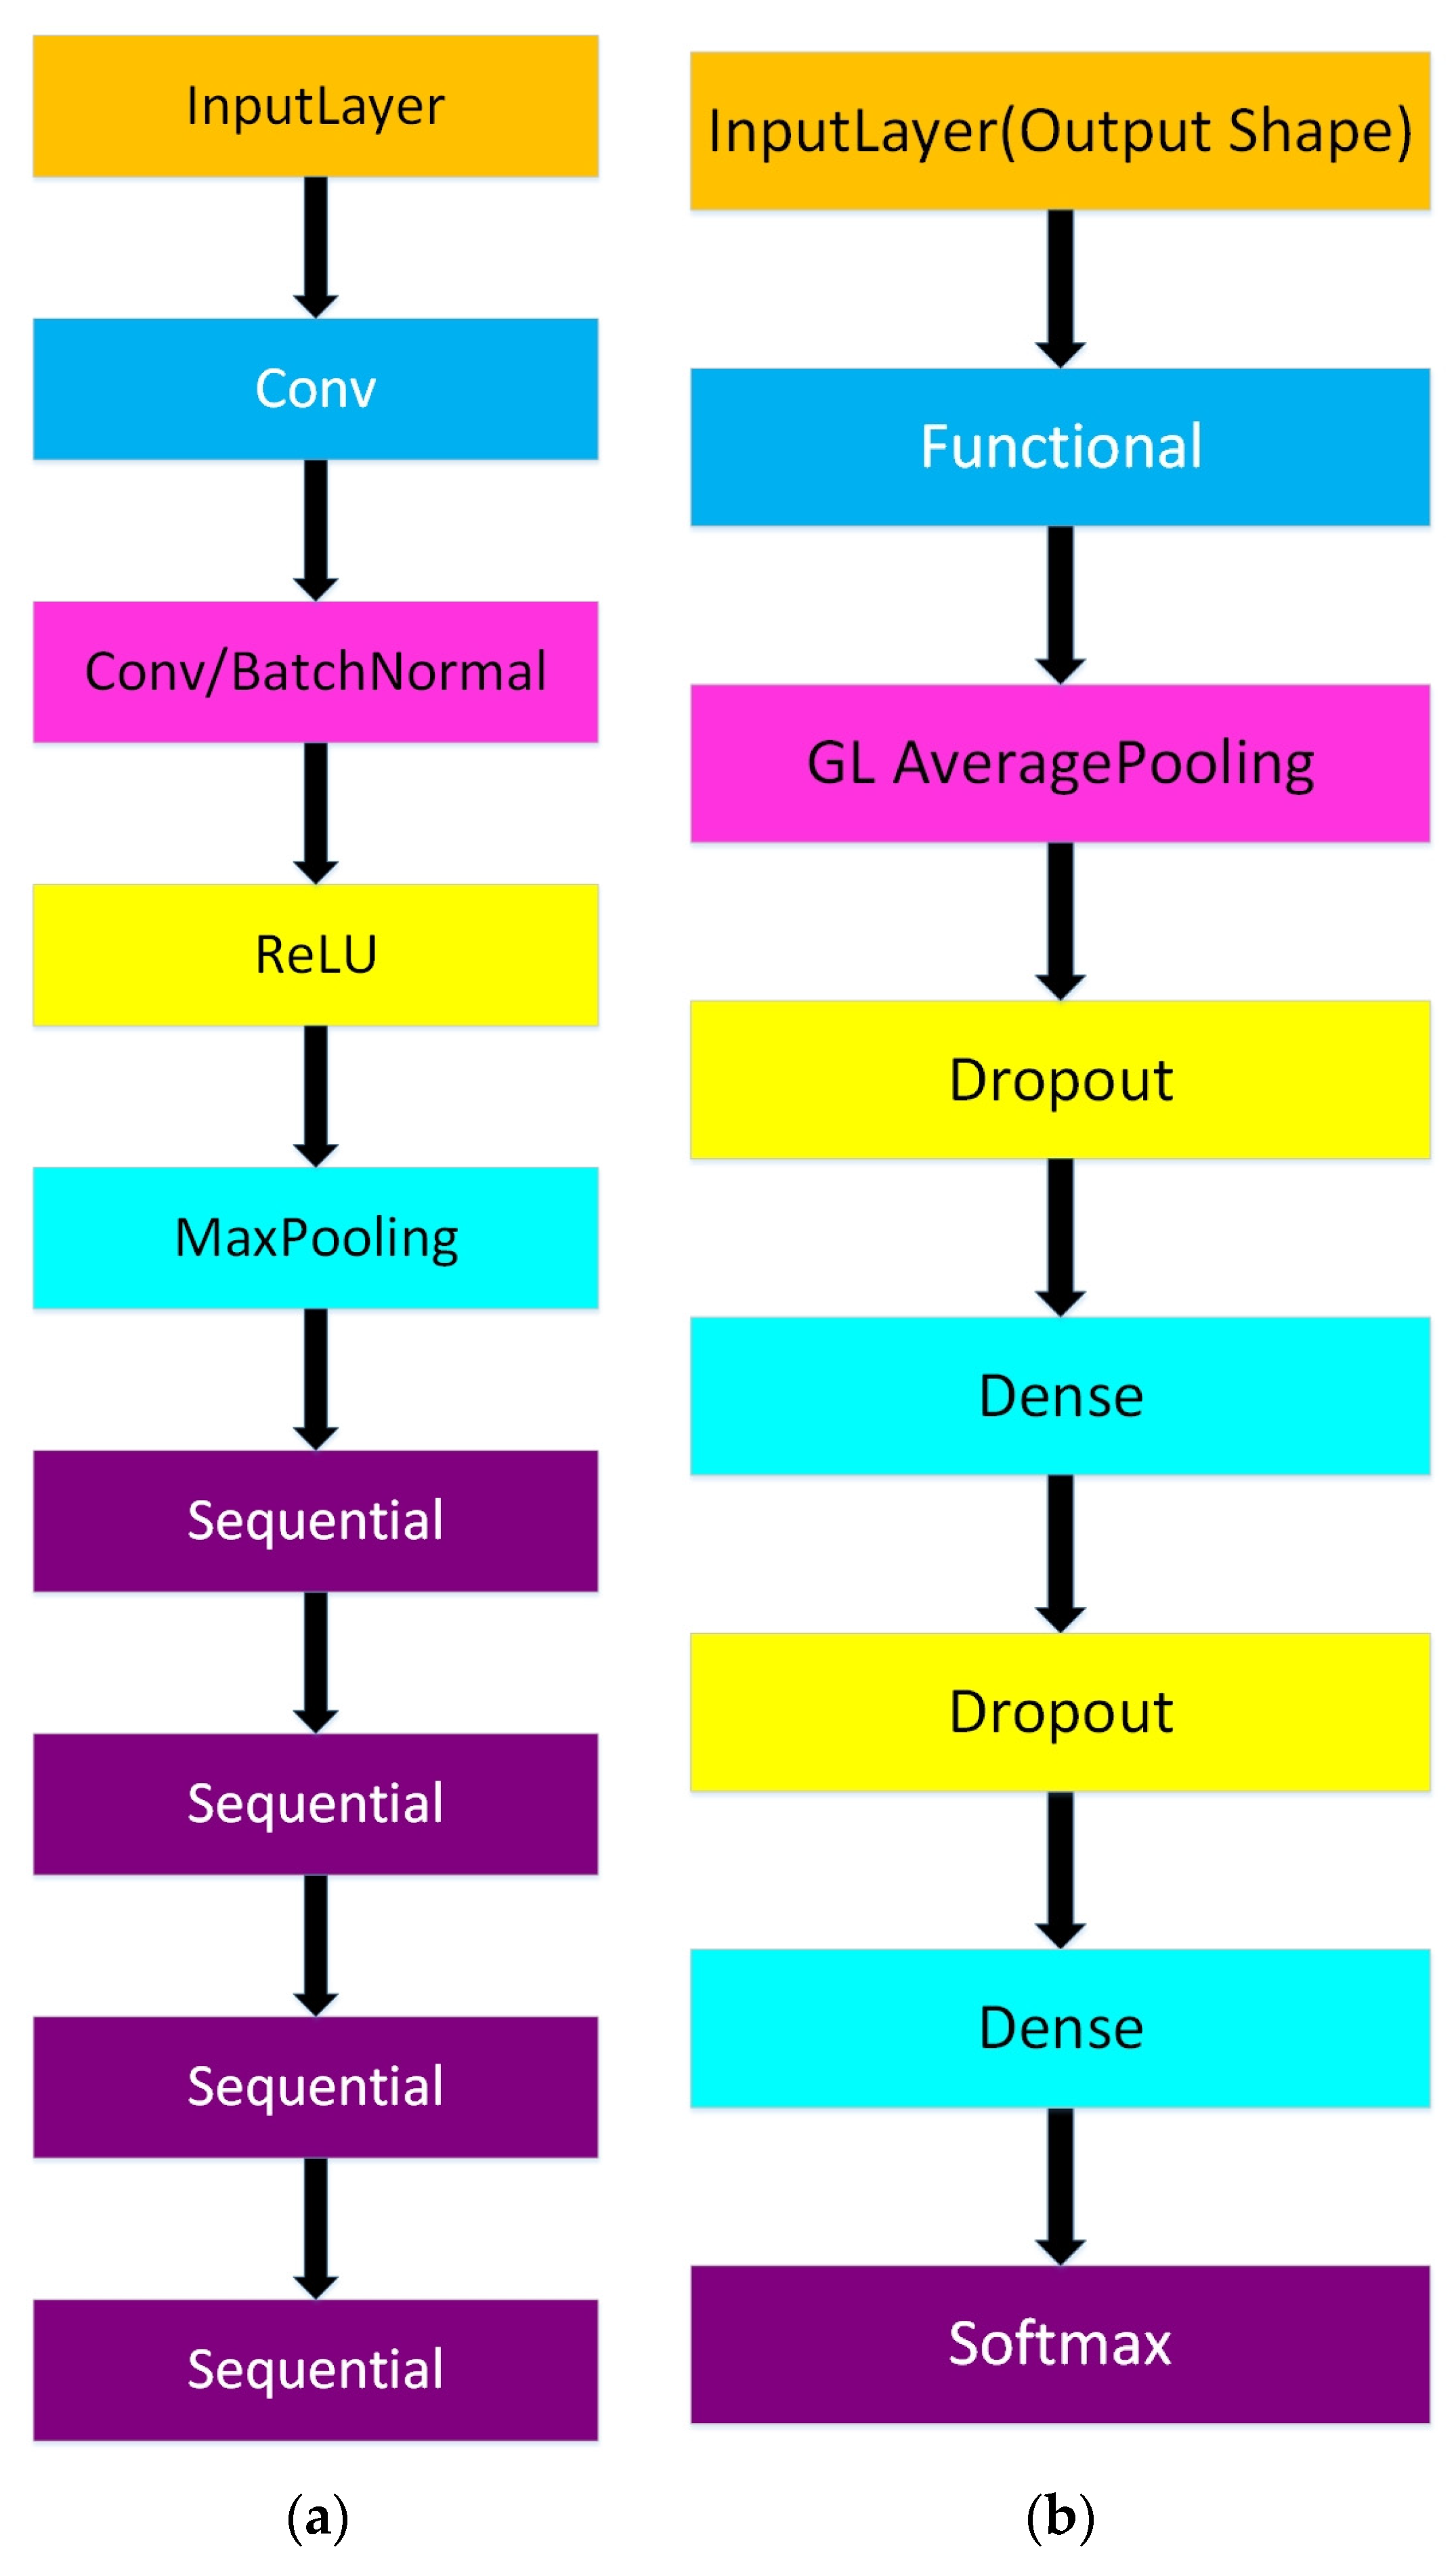
2.2.5. EfficientNet
2.3. Traditional Methods
2.4. Evaluation of Precision and Efficiency
3. Results
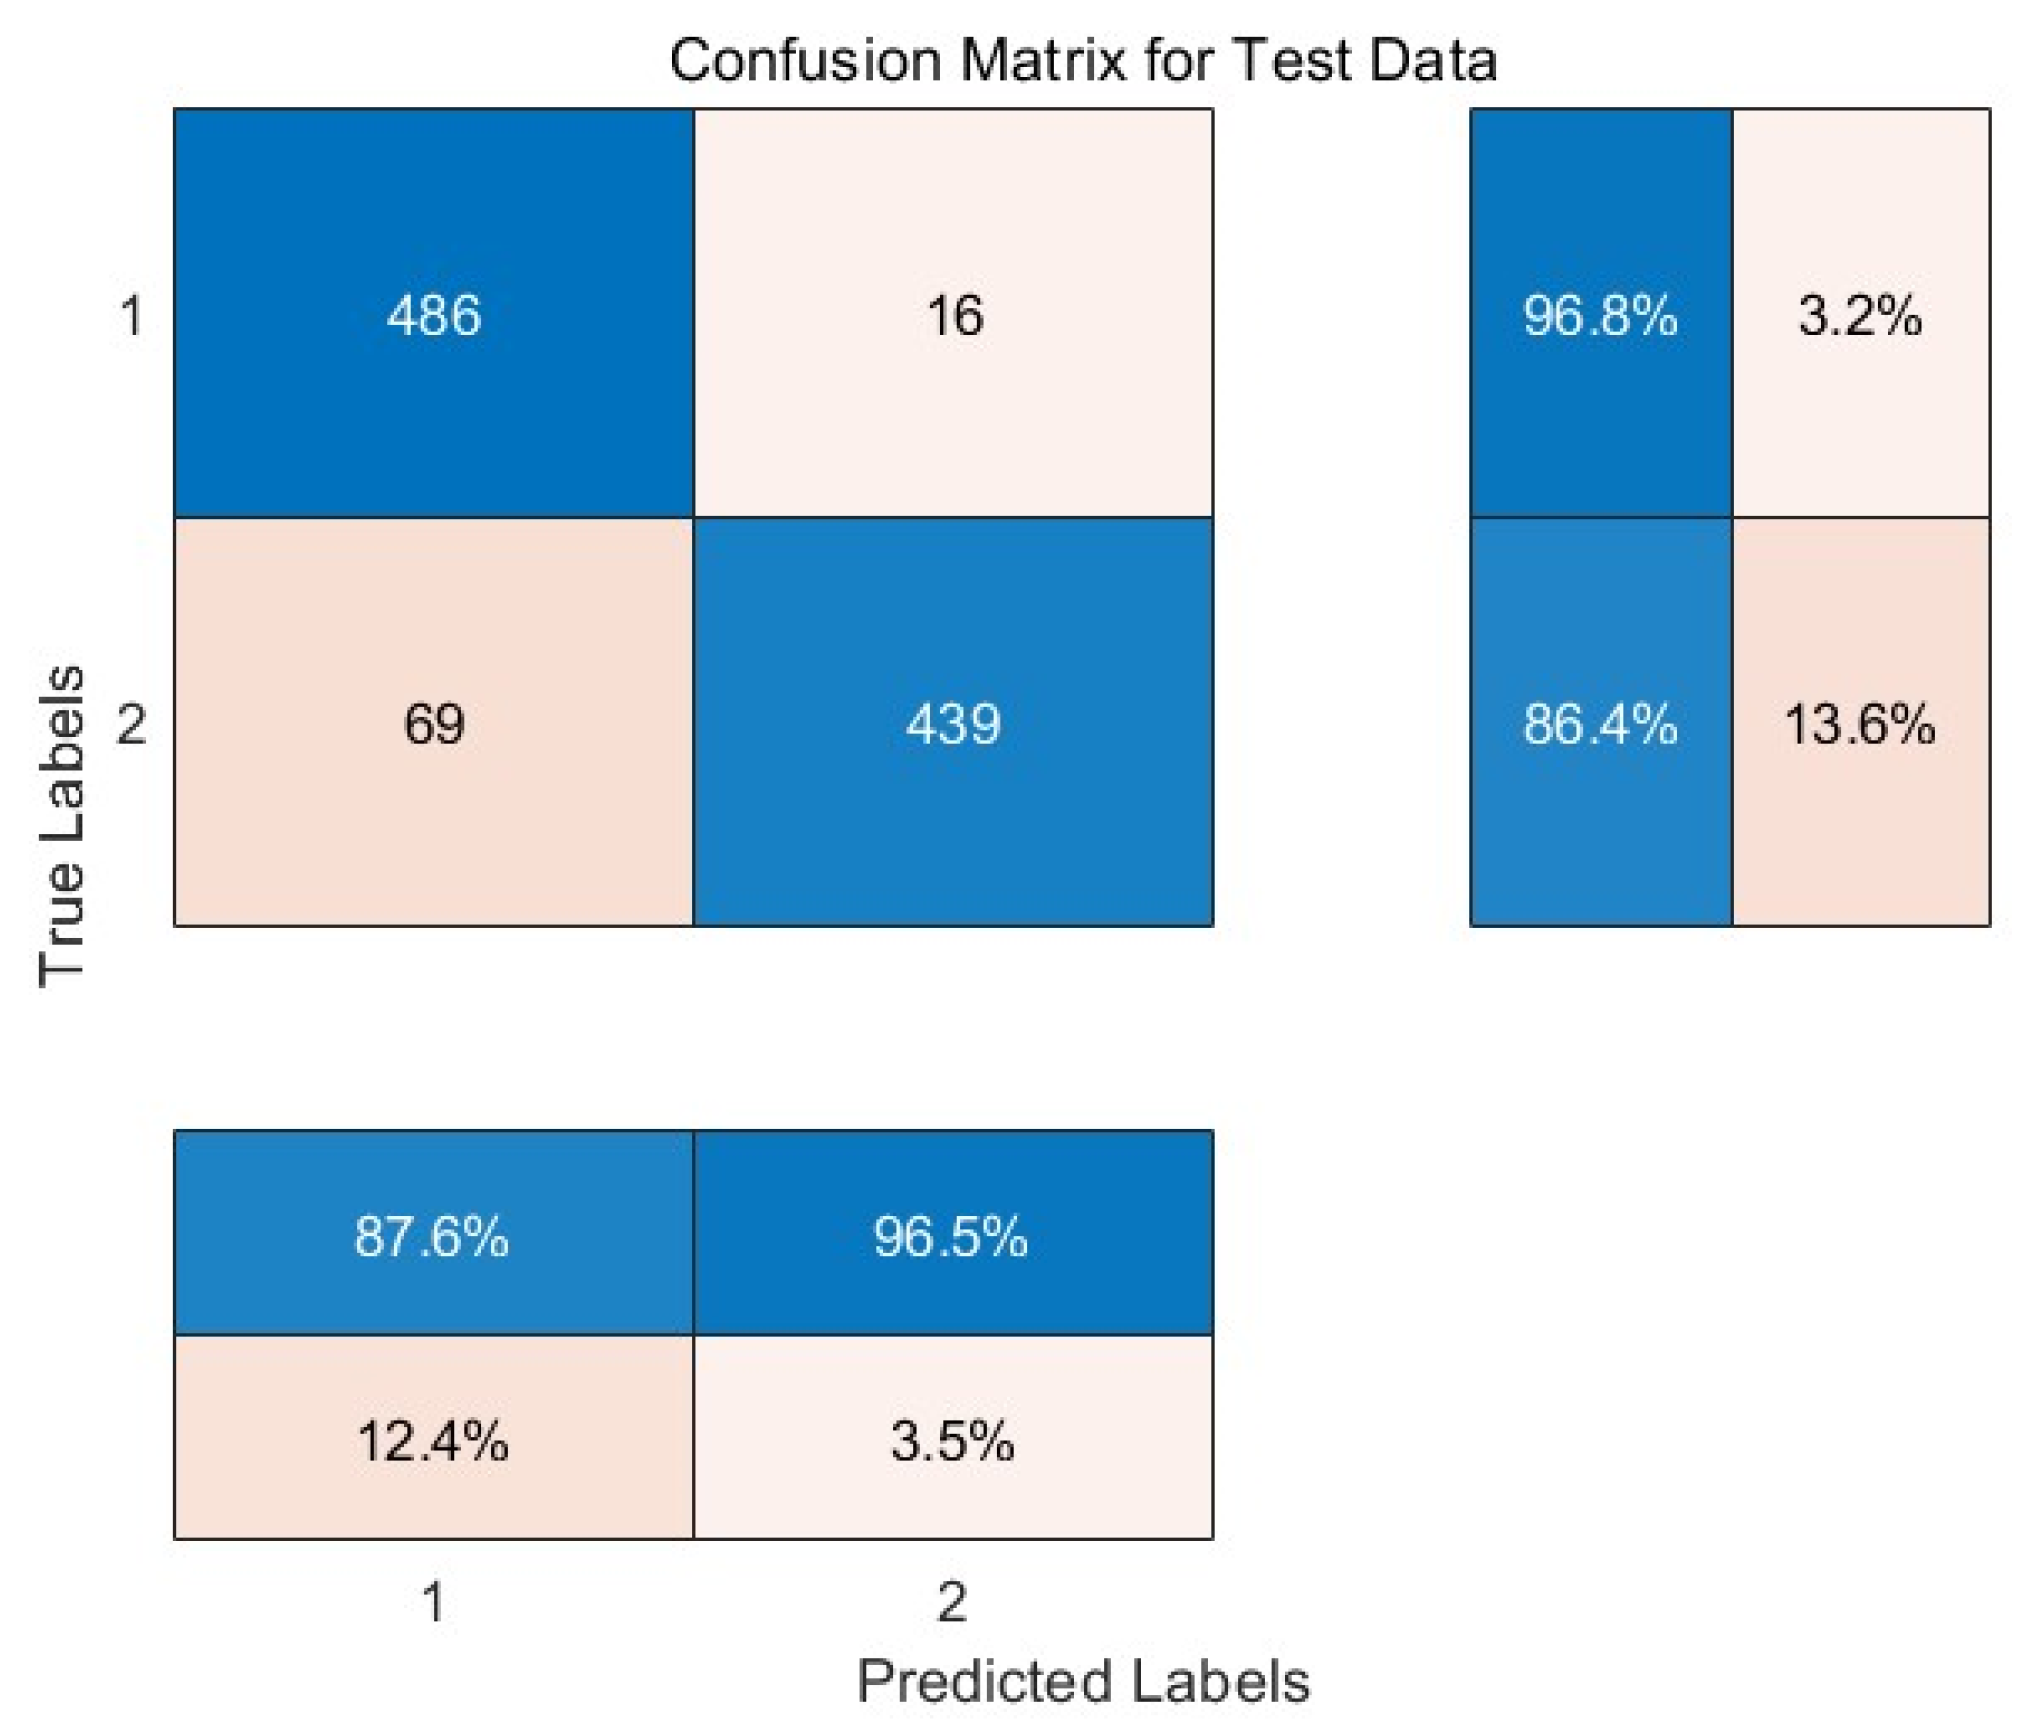
3.1. AlexNet Results
3.2. VGG Results
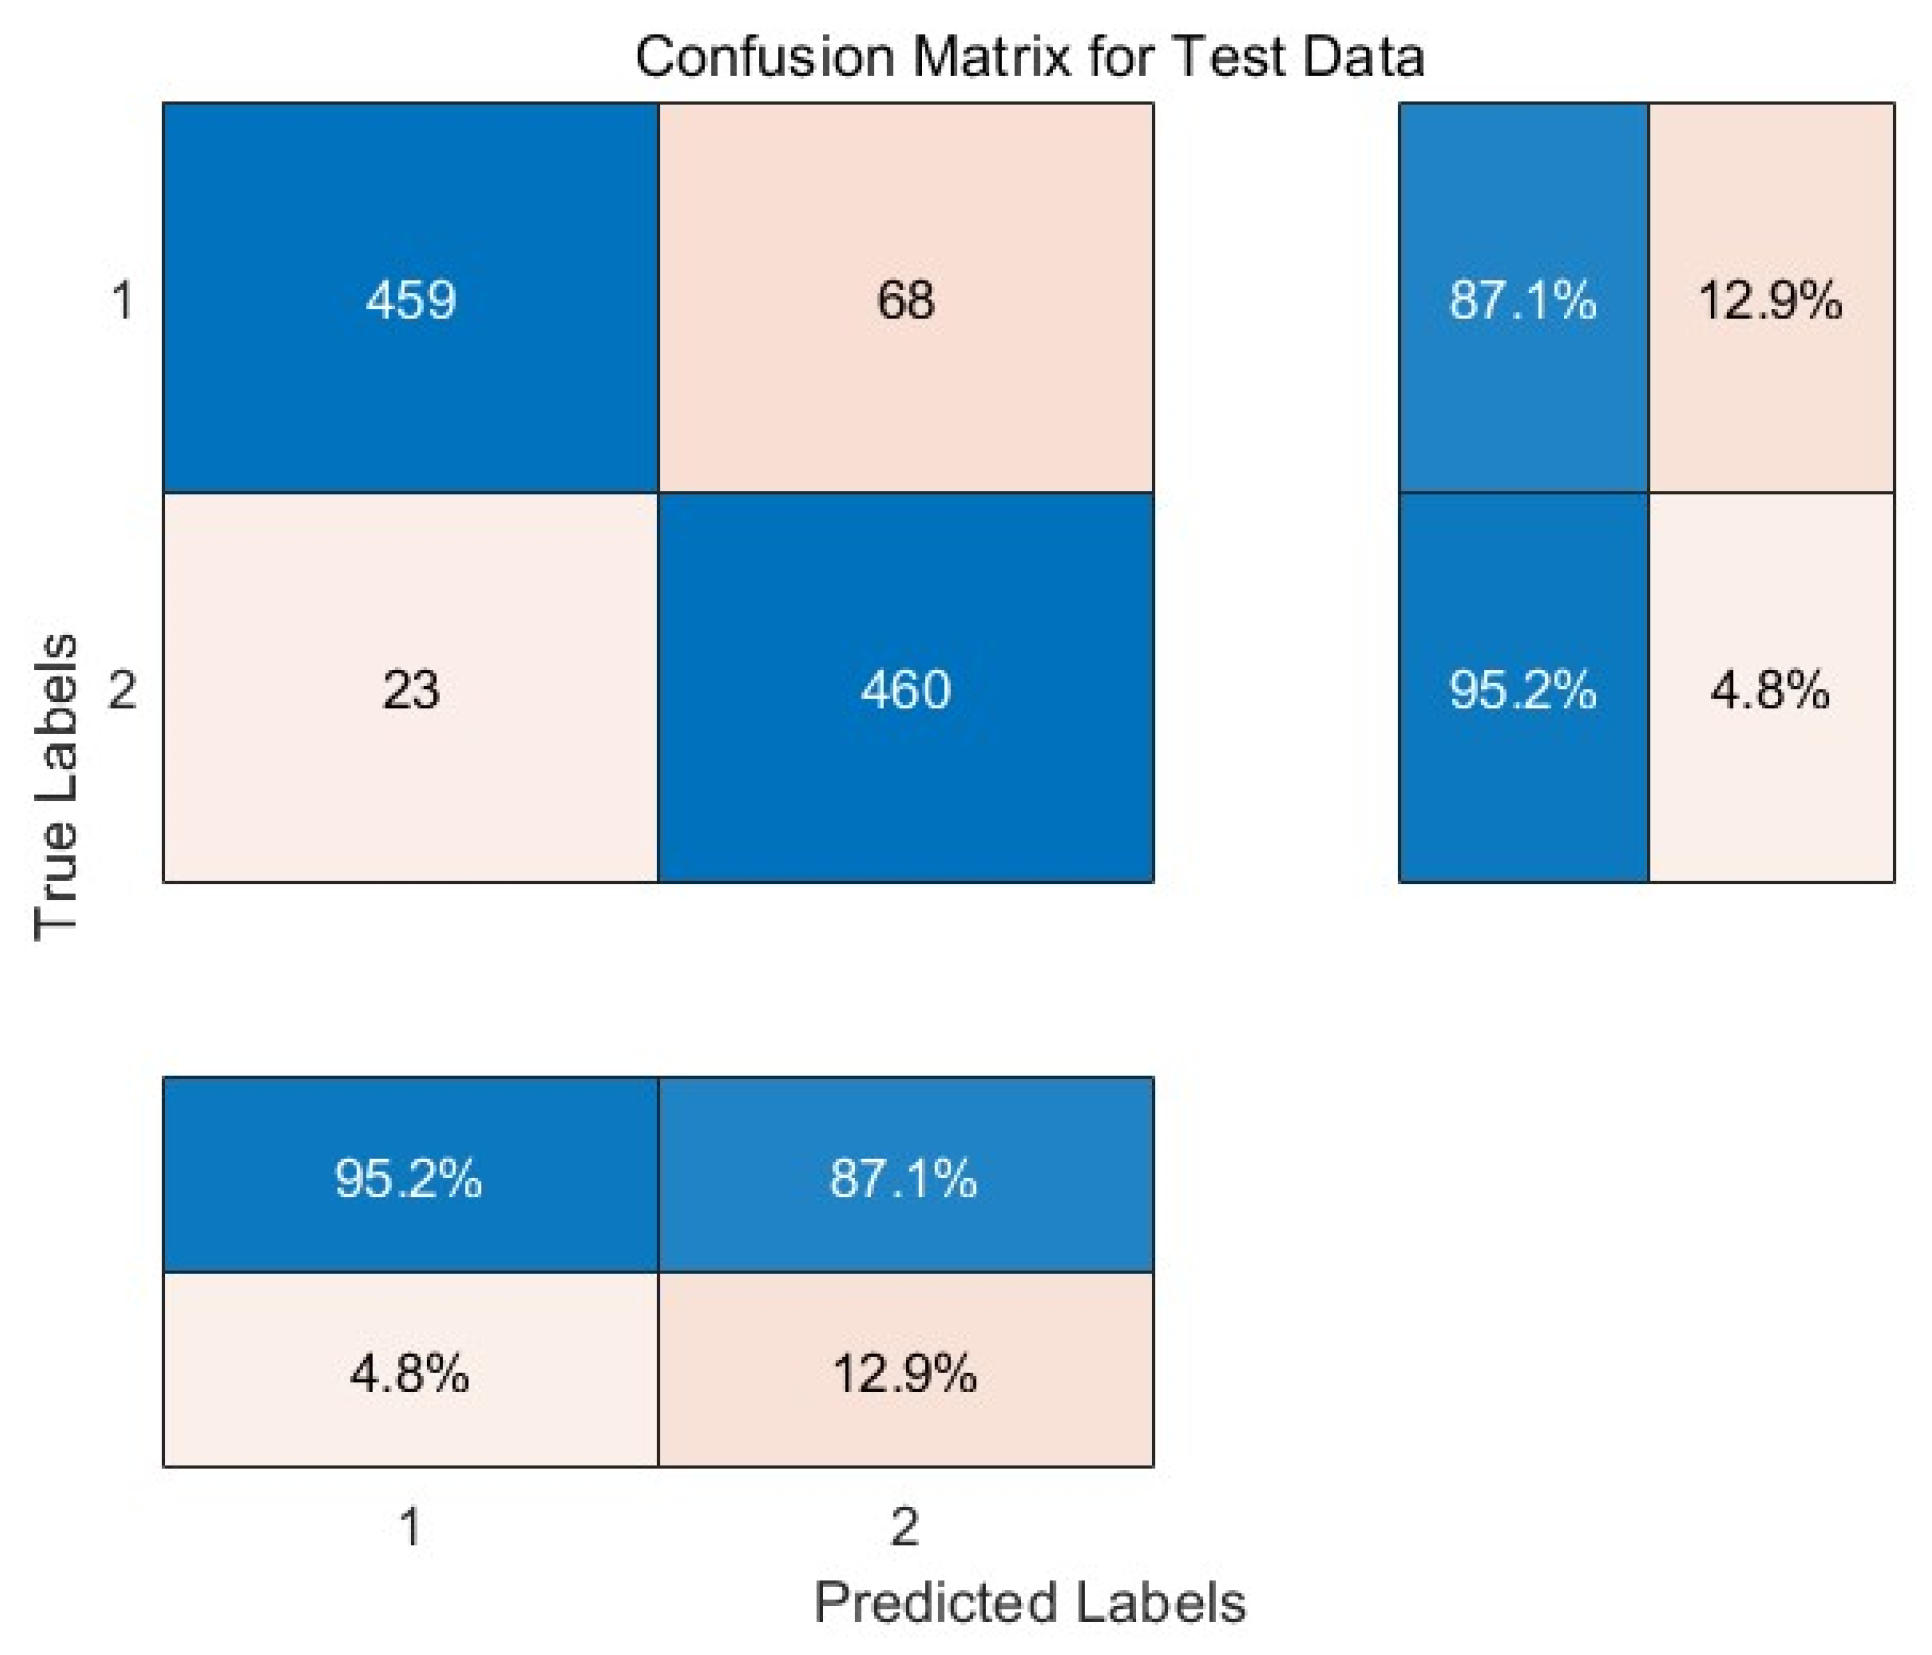
3.3. GoogleNet Results
3.4. ResNet Results
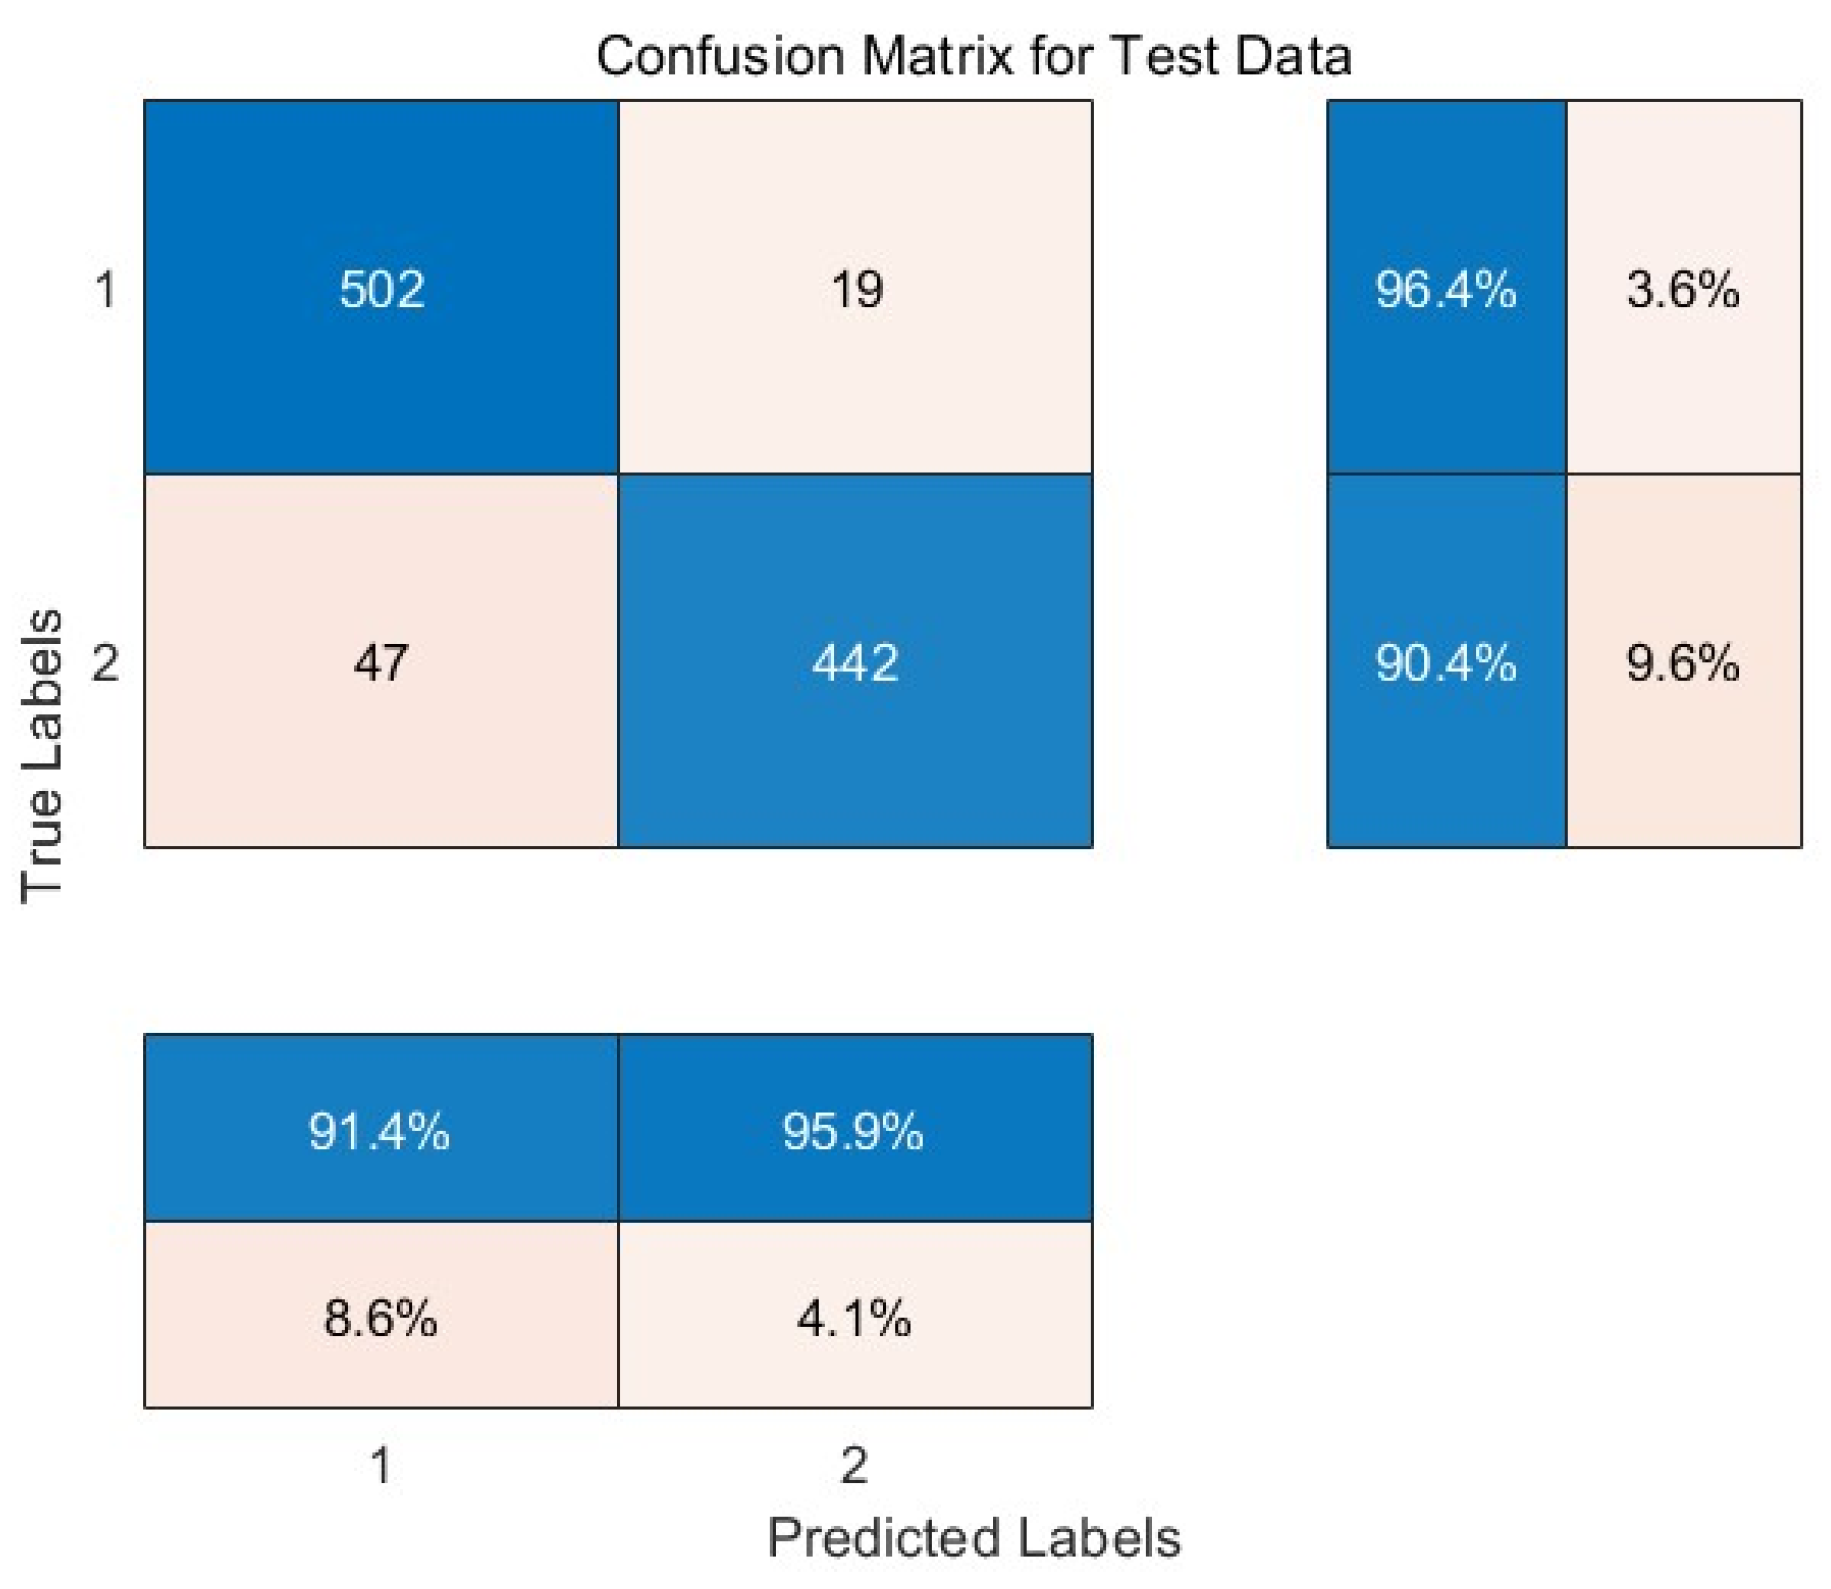
3.5. Efficientnet Results
3.6. Convolutional Neural Network Classification Efficiency Summary
3.7. Results of Traditional Classification Methods
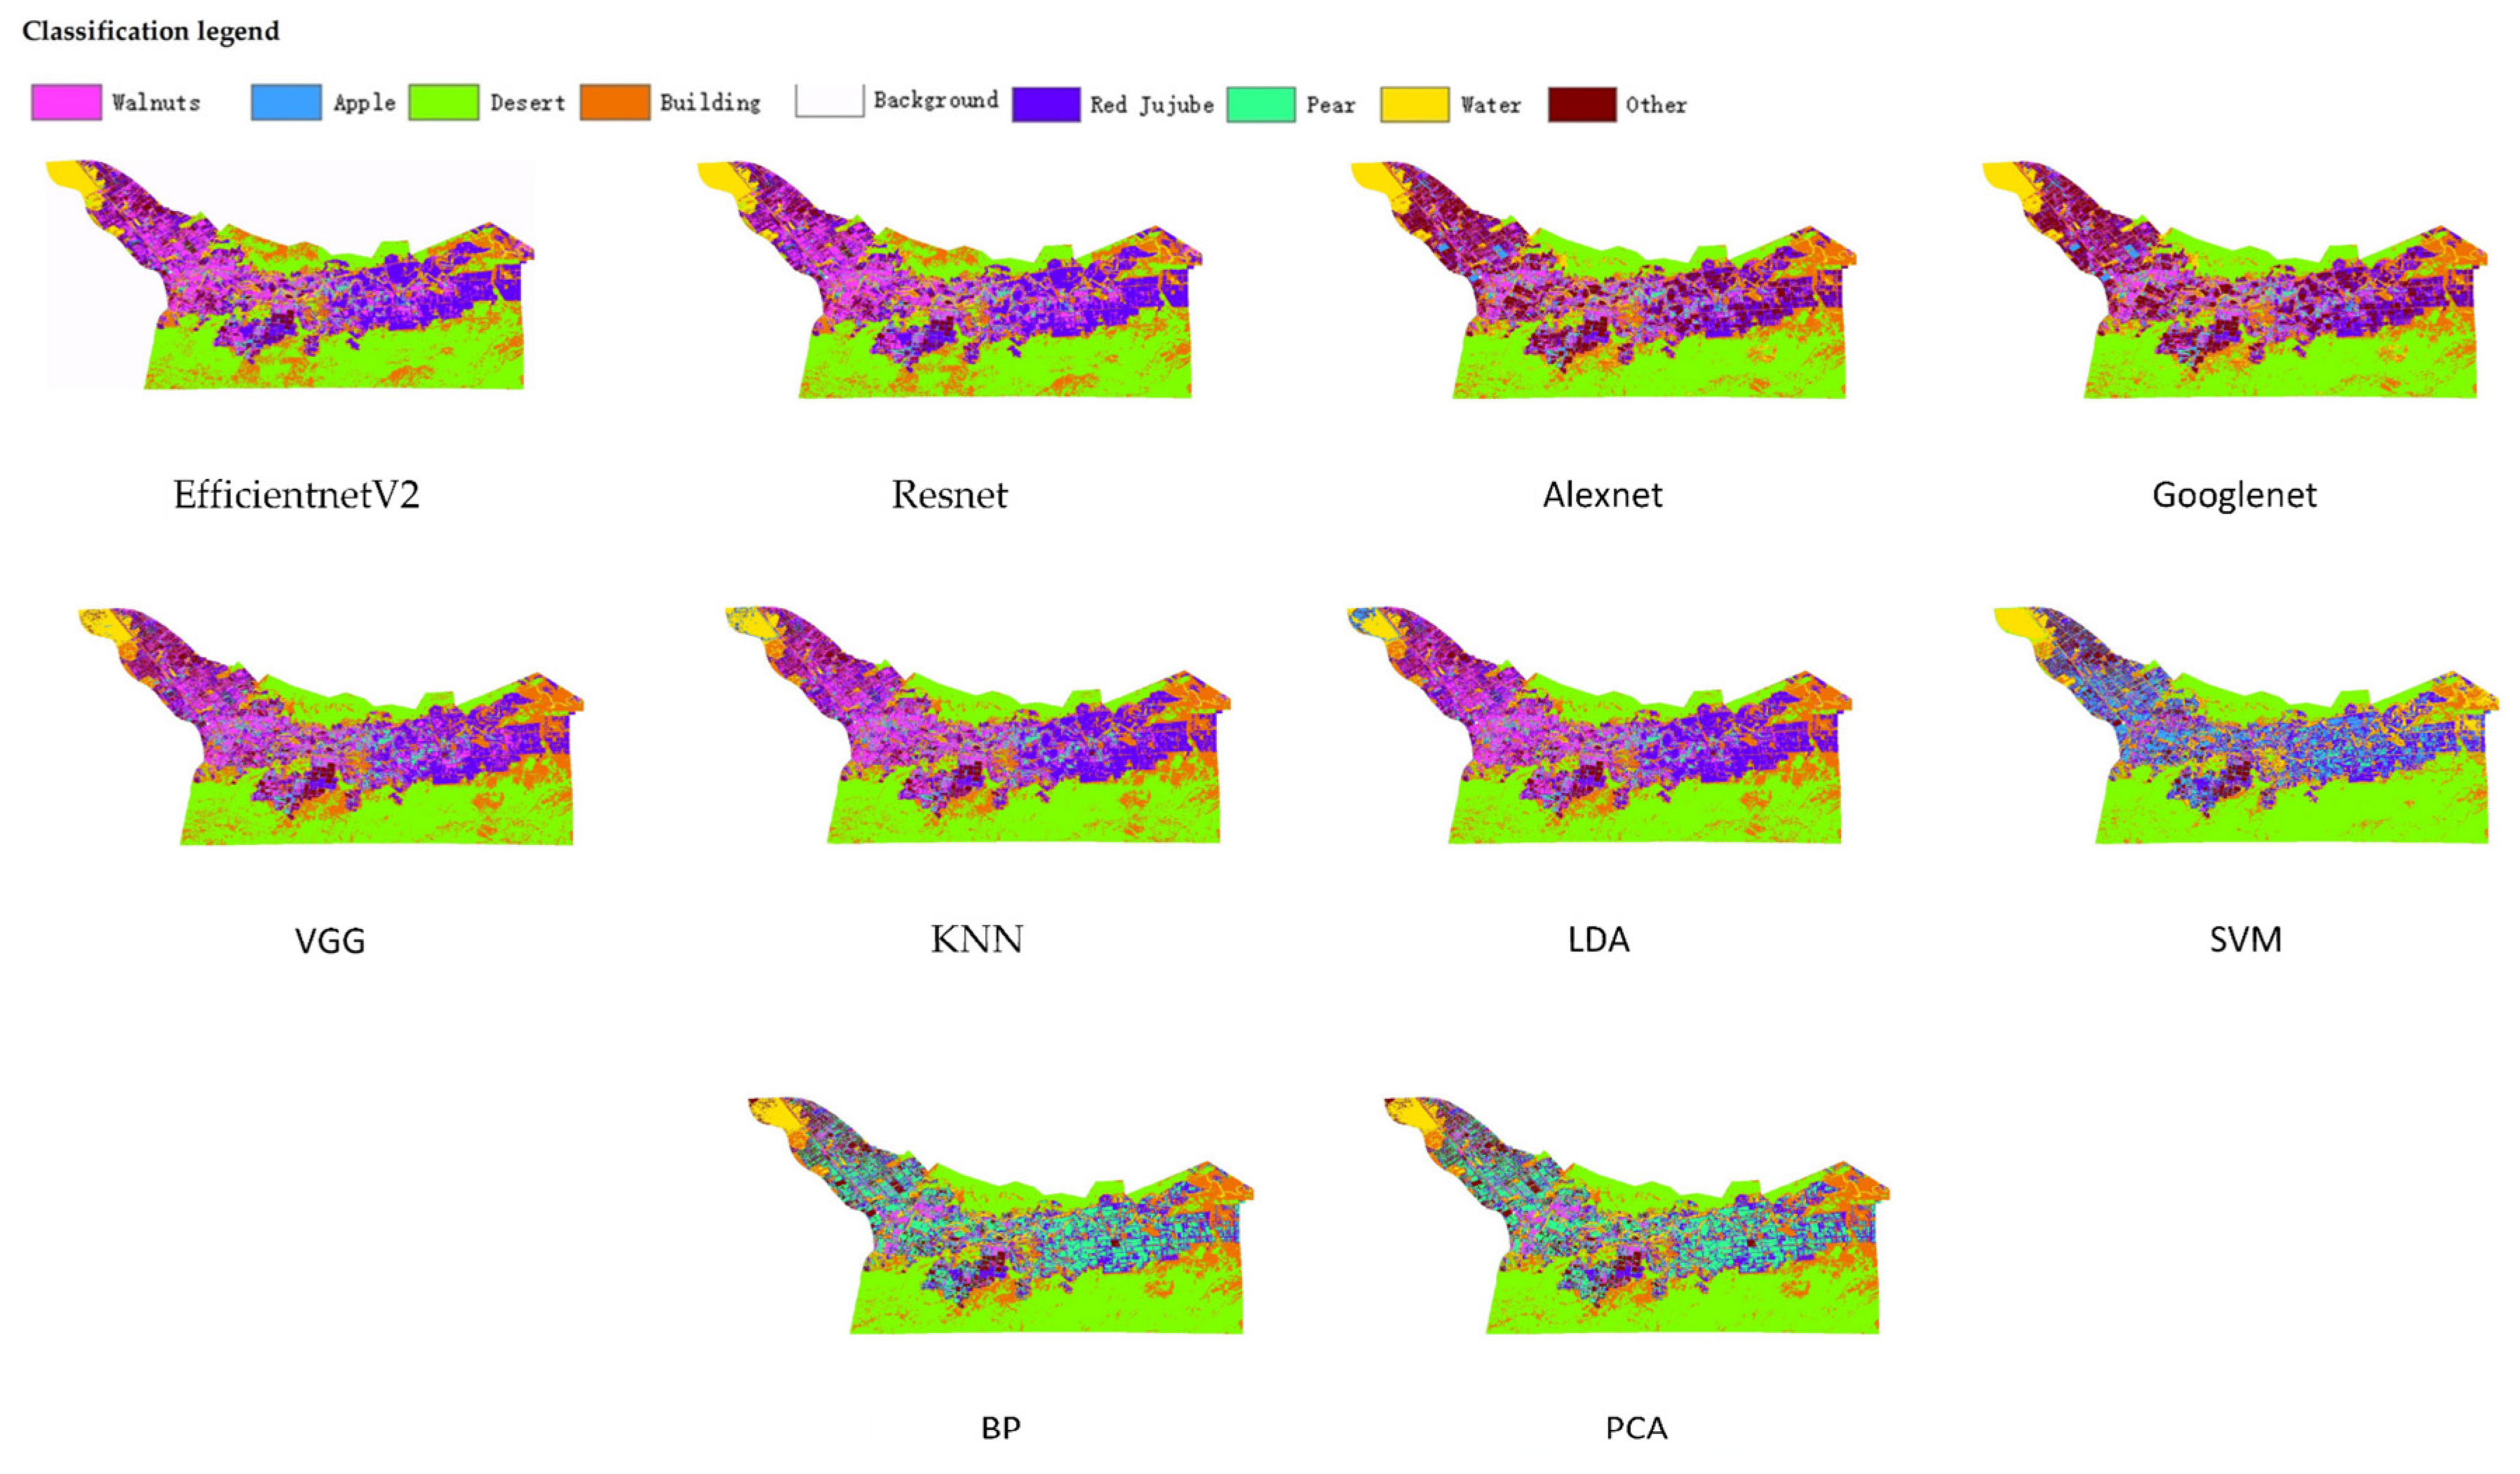
3.8. Comparative Summary of Results for Different Methods
4. Discussion
5. Conclusions
Author Contributions
Funding
Data Availability Statement
Conflicts of Interest
Appendix A


References
- Banks, T. Property rights reform in rangeland China: Dilemmas on the road to the household ranch. World Dev. 2003, 31, 2129–2142. [Google Scholar] [CrossRef]
- Fu, X.; Niu, H. Key technologies and applications of agricultural energy internet for agricultural planting and fisheries industry. Inf. Process. Agric. 2022, 10, 416–437. [Google Scholar] [CrossRef]
- Valjarević, A.; Algarni, S.; Morar, C.; Grama, V.; Stupariu, M.; Tiba, A.; Lukić, T. The coastal fog and ecological balance for plants in the Jizan region, Saudi Arabia. Saudi J. Biol. Sci. 2023, 30, 103494. [Google Scholar] [CrossRef] [PubMed]
- Ramos, D.E. Walnut Production Manual; UCANR Publications: San Diego, CA, USA, 1997; Volume 3373. [Google Scholar]
- Martínez, M.L.; Labuckas, D.O.; Lamarque, A.L.; Maestri, D.M. Walnut (Juglans regia L.): Genetic resources, chemistry, by-products. J. Sci. Food Agric. 2010, 90, 1959–1967. [Google Scholar] [CrossRef] [PubMed]
- Bernard, A.; Lheureux, F.; Dirlewanger, E. Walnut: Past and future of genetic improvement. Tree Genet. Genomes 2018, 14, 1. [Google Scholar] [CrossRef]
- Tian, J.; Wu, Y.; Wang, Y.; Han, F. Development and prospects of the walnut industry in China. In VI International Walnut Symposium 861; ISHS: Leuven, Belgium, 2009; pp. 31–38. [Google Scholar]
- Fang, G.; Chen, Y.; Li, Z. Variation in agricultural water demand and its attributions in the arid Tarim River Basin. J. Agric. Sci. 2018, 156, 301–311. [Google Scholar] [CrossRef]
- Hu, M.; Tian, C.; Zhao, Z.; Wang, L. Salinization causes and research progress of technologies improving saline-alkali soil in Xinjiang. J. Northwest A F Univ.-Nat. Sci. Ed. 2012, 40, 111–117. [Google Scholar]
- Zhou, B.; Yang, L.; Chen, X.; Ye, S.; Peng, Y.; Liang, C. Effect of magnetic water irrigation on the improvement of salinized soil and cotton growth in Xinjiang. Agric. Water Manag. 2021, 248, 106784. [Google Scholar] [CrossRef]
- Liu, M.; Yang, J.; Li, X.; Mei, Y.; Jin, W. Effects of irrigation water quality and drip tape arrangement on soil salinity, soil moisture distribution, and cotton yield (Gossypium hirsutum L.) under mulched drip irrigation in Xinjiang, China. J. Integr. Agric. 2012, 11, 502–511. [Google Scholar] [CrossRef]
- Hou, X.; Xiang, Y.; Fan, J.; Zhang, F.; Hu, W.; Yan, F.; Xiao, C.; Li, Y.; Cheng, H.; Li, Z. Spatial distribution and variability of soil salinity in film-mulched cotton fields under various drip irrigation regimes in southern Xinjiang of China. Soil Tillage Res. 2022, 223, 105470. [Google Scholar] [CrossRef]
- Feng, X.; Zhou, H.; Zulfiqar, S.; Luo, X.; Hu, Y.; Feng, L.; Malvolti, M.E.; Woeste, K.; Zhao, P. The phytogeographic history of common walnut in China. Front. Plant Sci. 2018, 9, 1399. [Google Scholar] [CrossRef]
- Baojun, Z.; Yonghong, G.; Liqun, H. Overview of walnut culture in China. In VI International Walnut Symposium 861; ISHS: Leuven, Belgium, 2009; pp. 39–44. [Google Scholar]
- Shigaeva, J.; Darr, D. On the socio-economic importance of natural and planted walnut (Juglans regia L.) forests in the Silk Road countries: A systematic review. For. Policy Econ. 2020, 118, 102233. [Google Scholar] [CrossRef]
- Dong, Y.-Z.; Liang, F.-L.; Wang, Z.-Y.; Xie, E.-J.; Zhu, X.-H. Investigation and analysis on the wild walnut in Gongliu, Xinjiang. J. Plant Genet. Resour. 2012, 13, 386–392. [Google Scholar]
- Gu, X.; Zhang, L.; Li, L.; Ma, N.; Tu, K.; Song, L.; Pan, L. Multisource fingerprinting for region identification of walnuts in Xinjiang combined with chemometrics. J. Food Process Eng. 2018, 41, e12687. [Google Scholar] [CrossRef]
- Lv, X.; Ming, D.; Chen, Y.; Wang, M. Very high resolution remote sensing image classification with SEEDS-CNN and scale effect analysis for superpixel CNN classification. Int. J. Remote Sens. 2019, 40, 506–531. [Google Scholar] [CrossRef]
- Ghassemian, H. A review of remote sensing image fusion methods. Inf. Fusion 2016, 32, 75–89. [Google Scholar] [CrossRef]
- Cheng, G.; Han, J.; Lu, X. Remote sensing image scene classification: Benchmark and state of the art. Proc. IEEE 2017, 105, 1865–1883. [Google Scholar] [CrossRef]
- Bo, Y.; Wang, H. The application of cloud computing and the internet of things in agriculture and forestry. In Proceedings of the 2011 International Joint Conference on Service Sciences, Taipei, Taiwan, 25–27 May 2011; pp. 168–172. [Google Scholar]
- Zhang, S.; Zhang, C.; Ding, J. Disease and insect pest forecasting model of greenhouse winter jujube based on modified deep belief network. Trans. Chin. Soc. Agric. Eng. 2017, 33, 202–208. [Google Scholar]
- Li, W.; Fu, H.; Yu, L.; Cracknell, A. Deep learning based oil palm tree detection and counting for high-resolution remote sensing images. Remote Sens. 2016, 9, 22. [Google Scholar] [CrossRef]
- Campbell, J.B.; Wynne, R.H. Introduction to Remote Sensing; Guilford Press: New York, NY, USA, 2011. [Google Scholar]
- McCarthy, N.F.; Tohidi, A.; Aziz, Y.; Dennie, M.; Valero, M.M.; Hu, N. A Deep Learning Approach to Downscale Geostationary Satellite Imagery for Decision Support in High Impact Wildfires. Forests 2021, 12, 294. [Google Scholar] [CrossRef]
- Iban, M.C.; Sahin, E. Monitoring land use and land cover change near a nuclear power plant construction site: Akkuyu case, Turkey. Environ. Monit. Assess. 2022, 194, 724. [Google Scholar] [CrossRef] [PubMed]
- Zhang, C.; Zhang, H.; Tian, S. Phenology-assisted supervised paddy rice mapping with the Landsat imagery on Google Earth Engine: Experiments in Heilongjiang Province of China from 1990 to 2020. Comput. Electron. Agric. 2023, 212, 108105. [Google Scholar] [CrossRef]
- Gorelick, N.; Hancher, M.; Dixon, M.; Ilyushchenko, S.; Thau, D.; Moore, R. Google Earth Engine: Planetary-scale geospatial analysis for everyone. Remote Sens. Environ. 2017, 202, 18–27. [Google Scholar] [CrossRef]
- Dillon, T.; Wu, C.; Chang, E. Cloud computing: Issues and challenges. In Proceedings of the 2010 24th IEEE International Conference on Advanced Information Networking and Applications, Perth, Australia, 20–23 April 2010; pp. 27–33. [Google Scholar]
- Kumar, L.; Mutanga, O. Google Earth Engine applications since inception: Usage, trends, and potential. Remote Sens. 2018, 10, 1509. [Google Scholar] [CrossRef]
- Tamiminia, H.; Salehi, B.; Mahdianpari, M.; Quackenbush, L.; Adeli, S.; Brisco, B. Google Earth Engine for geo-big data applications: A meta-analysis and systematic review. ISPRS J. Photogramm. Remote Sens. 2020, 164, 152–170. [Google Scholar] [CrossRef]
- Voulodimos, A.; Doulamis, N.; Doulamis, A.; Protopapadakis, E. Deep learning for computer vision: A brief review. Comput. Intell. Neurosci. 2018, 2018, 7068349. [Google Scholar] [CrossRef]
- Jung, J.; Maeda, M.; Chang, A.; Bhandari, M.; Ashapure, A.; Landivar-Bowles, J. The potential of remote sensing and artificial intelligence as tools to improve the resilience of agriculture production systems. Curr. Opin. Biotechnol. 2021, 70, 15–22. [Google Scholar] [CrossRef]
- Cheng, G.; Xie, X.; Han, J.; Guo, L.; Xia, G.-S. Remote sensing image scene classification meets deep learning: Challenges, methods, benchmarks, and opportunities. IEEE J. Sel. Top. Appl. Earth Obs. Remote Sens. 2020, 13, 3735–3756. [Google Scholar] [CrossRef]
- Shi, Z.; Zhang, R.; Bai, T.; Li, X. Walnut Acreage Extraction and Growth Monitoring Based on the NDVI Time Series and Google Earth Engine. Appl. Sci. 2023, 13, 5666. [Google Scholar] [CrossRef]
- Wang, Y.; Li, G.; Wang, S.; Zhang, Y.; Li, D.; Zhou, H.; Yu, W.; Xu, S. A Comprehensive Evaluation of Benefit of High-Standard Farmland Development in China. Sustainability 2022, 14, 10361. [Google Scholar] [CrossRef]
- Valjarević, A.; Djekić, T.; Stevanović, V.; Ivanović, R.; Jandziković, B. GIS numerical and remote sensing analyses of forest changes in the Toplica region for the period of 1953–2013. Appl. Geogr. 2018, 92, 131–139. [Google Scholar] [CrossRef]
- Albawi, S.; Mohammed, T.A.; Al-Zawi, S. Understanding of a convolutional neural network. In Proceedings of the 2017 International Conference on Engineering and Technology (ICET), Antalya, Turkey, 21–23 August 2017; pp. 1–6. [Google Scholar]
- O’Shea, K.; Nash, R. An introduction to convolutional neural networks. arXiv 2015, arXiv:1511.08458. [Google Scholar]
- Krizhevsky, A.; Sutskever, I.; Hinton, G.E. ImageNet classification with deep convolutional neural networks. Adv. Neural Inf. Process. Syst. 2012, 25, 1–9. [Google Scholar] [CrossRef]
- Alom, M.Z.; Taha, T.M.; Yakopcic, C.; Westberg, S.; Sidike, P.; Nasrin, M.S.; Van Esesn, B.C.; Awwal, A.A.S.; Asari, V.K. The history began from alexnet: A comprehensive survey on deep learning approaches. arXiv 2018, arXiv:1803.01164. [Google Scholar]
- Simonyan, K.; Zisserman, A. Very deep convolutional networks for large-scale image recognition. arXiv 2014, arXiv:1409.1556. [Google Scholar]
- Sengupta, A.; Ye, Y.; Wang, R.; Liu, C.; Roy, K. Going deeper in spiking neural networks: VGG and residual architectures. Front. Neurosci. 2019, 13, 95. [Google Scholar] [CrossRef]
- Szegedy, C.; Liu, W.; Jia, Y.; Sermanet, P.; Reed, S.; Anguelov, D.; Erhan, D.; Vanhoucke, V.; Rabinovich, A. Going deeper with convolutions. In Proceedings of the IEEE Conference on Computer Vision and Pattern Recognition, Boston, MA, USA, 7–12 June 2015; pp. 1–9. [Google Scholar]
- He, K.; Zhang, X.; Ren, S.; Sun, J. Deep residual learning for image recognition. In Proceedings of the IEEE Conference on Computer Vision and Pattern Recognition, Honolulu, HI, USA, 21–26 July 2016; pp. 770–778. [Google Scholar]
- Wu, Z.; Shen, C.; Van Den Hengel, A. Wider or deeper: Revisiting the resnet model for visual recognition. Pattern Recognit. 2019, 90, 119–133. [Google Scholar] [CrossRef]
- Tan, M.; Le, Q. Efficientnetv2: Smaller models and faster training. In Proceedings of the International Conference on Machine Learning, PMLR, Virtual. 18–24 July 2021; pp. 10096–10106. [Google Scholar]
- Martinez, A.M.; Kak, A.C. Pca versus lda. IEEE Trans. Pattern Anal. Mach. Intell. 2001, 23, 228–233. [Google Scholar] [CrossRef]
- Li, J.; Cheng, J.; Shi, J.; Huang, F. Brief introduction of back propagation (BP) neural network algorithm and its improvement. In Advances in Computer Science and Information Engineering; Springer: Berlin/Heidelberg, Germany, 2012; Volume 2, pp. 553–558. [Google Scholar]
- Cortes, C.; Vapnik, V. Support-vector networks. Mach. Learn. 1995, 20, 273–297. [Google Scholar] [CrossRef]
- Goutte, C.; Gaussier, E. A probabilistic interpretation of precision, recall and F-score, with implication for evaluation. In European Conference on Information Retrieval; Springer: Berlin/Heidelberg, Germany, 2005; pp. 345–359. [Google Scholar]
- Albatrni, H.; Qiblawey, H.; Al-Marri, M.J. Walnut shell based adsorbents: A review study on preparation, mechanism, and application. J. Water Process Eng. 2022, 45, 102527. [Google Scholar] [CrossRef]
- Ji, F.; Ma, Q.; Zhang, W.; Liu, J.; Feng, Y.; Zhao, P.; Song, X.; Chen, J.; Zhang, J.; Wei, X. A genome variation map provides insights into the genetics of walnut adaptation and agronomic traits. Genome Biol. 2021, 22, 300. [Google Scholar] [CrossRef] [PubMed]
- Madrid, R.; García-García, A.; Cabrera, P.; González, I.; Martín, R.; García, T. Survey of commercial food products for detection of walnut (Juglans regia) by two elisa methods and real time pcr. Foods 2021, 10, 440. [Google Scholar] [CrossRef] [PubMed]
- Fei, H.; Fan, Z.; Wang, C.; Zhang, N.; Wang, T.; Chen, R.; Bai, T. Cotton Classification Method at the County Scale Based on Multi-Features and Random Forest Feature Selection Algorithm and Classifier. Remote Sens. 2022, 14, 829. [Google Scholar] [CrossRef]
- Li, J.; Pei, Y.; Zhao, S.; Xiao, R.; Sang, X.; Zhang, C. A review of remote sensing for environmental monitoring in China. Remote Sens. 2020, 12, 1130. [Google Scholar] [CrossRef]
- Xi, Y.; Ren, C.; Tian, Q.; Ren, Y.; Dong, X.; Zhang, Z. Exploitation of time series sentinel-2 data and different machine learning algorithms for detailed tree species classification. IEEE J. Sel. Top. Appl. Earth Obs. Remote Sens. 2021, 14, 7589–7603. [Google Scholar] [CrossRef]
- He, R.; He, B.; Shi, Y.; Chen, L.; Wang, Z.; Lai, X. Feasibility of Using Landsat Synthetic Images to Classify Tree Species in Southwest Sichuan, China. In Proceedings of the IGARSS 2022—2022 IEEE International Geoscience and Remote Sensing Symposium, Kuala Lumpur, Malaysia, 17–22 July 2022; pp. 5692–5695. [Google Scholar]
- Zhou, Y.; Chen, S.; Wang, Y.; Huan, W. Review of research on lightweight convolutional neural networks. In Proceedings of the 2020 IEEE 5th Information Technology and Mechatronics Engineering Conference (ITOEC), Chongqing, China, 12–14 June 2020; pp. 1713–1720. [Google Scholar]
- Li, X.; Yang, C.; Zhang, H.; Wang, P.; Tang, J.; Tian, Y.; Zhang, Q. Identification of Abandoned Jujube Fields Using Multi-Temporal High-Resolution Imagery and Machine Learning. Remote Sens. 2021, 13, 801. [Google Scholar] [CrossRef]
- Anisimov, D.; Khanova, T. Towards lightweight convolutional neural networks for object detection. In Proceedings of the 2017 14th IEEE International Conference on Advanced Video and Signal Based Surveillance (AVSS), Lecce, Italy, 29 August–1 September 2017; pp. 1–8. [Google Scholar]
- Wieczorek, M.; Siłka, J.; Woźniak, M.; Garg, S.; Hassan, M.M. Lightweight convolutional neural network model for human face detection in risk situations. IEEE Trans. Ind. Inform. 2021, 18, 4820–4829. [Google Scholar] [CrossRef]

| Model | Average Length of Time Per Training Session (s) | Number of Trainings | Test Duration (s) | Total Duration (s) |
|---|---|---|---|---|
| AlexNet | 12 | 70 | 6 | 846 |
| VGG | 19 | 180 | 7 | 3427 |
| GoogleNet | 21 | 70 | 8 | 1478 |
| ResNet | 23 | 30 | 8 | 698 |
| EfficientnetV2 | 10 | 460 | 11 | 4611 |
| Model | Precision (%) | Recall (%) | F1-Score (%) | Accuracy (%) |
|---|---|---|---|---|
| BP | 71.99 | 87.74 | 79.09 | 80.89 |
| k-NN | 75.78 | 92.43 | 83.28 | 84.46 |
| PCA | 58.70 | 94.89 | 72.53 | 77.72 |
| LDA | 73.44 | 90.35 | 81.02 | 83.07 |
| SVM | 68.74 | 93.40 | 79.19 | 81.58 |
| Model | Training Duration (s) | Test Duration (s) | Total Duration (s) |
|---|---|---|---|
| BP | 2378 | 12 | 2390 |
| k-NN | 178 | 11 | 189 |
| PCA | 338 | 11 | 349 |
| LDA | 569 | 12 | 581 |
| SVM | 127 | 11 | 138 |
| Model | Precision (%) | Recall (%) | F1-Score (%) | Accuracy (%) | Total Time |
|---|---|---|---|---|---|
| AlexNet | 96.81 | 87.57 | 91.96 | 91.58 | 846 |
| VGG | 90.98 | 87.98 | 89.46 | 89.41 | 3427 |
| GoogleNet | 87.10 | 95.23 | 90.98 | 90.99 | 1478 |
| ResNet | 92.47 | 94.29 | 93.37 | 93.27 | 698 |
| EfficientnetV2 | 96.35 | 91.44 | 93.83 | 93.47 | 4611 |
| BP | 71.99 | 87.74 | 79.09 | 80.89 | 2390 |
| k-NN | 75.78 | 92.43 | 83.28 | 84.46 | 189 |
| PCA | 58.70 | 94.89 | 72.53 | 77.72 | 349 |
| LDA | 73.44 | 90.35 | 81.02 | 83.07 | 581 |
| SVM | 68.74 | 93.40 | 79.19 | 81.58 | 138 |
Disclaimer/Publisher’s Note: The statements, opinions and data contained in all publications are solely those of the individual author(s) and contributor(s) and not of MDPI and/or the editor(s). MDPI and/or the editor(s) disclaim responsibility for any injury to people or property resulting from any ideas, methods, instructions or products referred to in the content. |
© 2024 by the authors. Licensee MDPI, Basel, Switzerland. This article is an open access article distributed under the terms and conditions of the Creative Commons Attribution (CC BY) license (https://creativecommons.org/licenses/by/4.0/).
Share and Cite
Wu, J.; Li, X.; Shi, Z.; Li, S.; Hou, K.; Bai, T. Research on Walnut (Juglans regia L.) Classification Based on Convolutional Neural Networks and Landsat-8 Remote Sensing Imagery. Forests 2024, 15, 165. https://doi.org/10.3390/f15010165
Wu J, Li X, Shi Z, Li S, Hou K, Bai T. Research on Walnut (Juglans regia L.) Classification Based on Convolutional Neural Networks and Landsat-8 Remote Sensing Imagery. Forests. 2024; 15(1):165. https://doi.org/10.3390/f15010165
Chicago/Turabian StyleWu, Jingming, Xu Li, Ziyan Shi, Senwei Li, Kaiyao Hou, and Tiecheng Bai. 2024. "Research on Walnut (Juglans regia L.) Classification Based on Convolutional Neural Networks and Landsat-8 Remote Sensing Imagery" Forests 15, no. 1: 165. https://doi.org/10.3390/f15010165
APA StyleWu, J., Li, X., Shi, Z., Li, S., Hou, K., & Bai, T. (2024). Research on Walnut (Juglans regia L.) Classification Based on Convolutional Neural Networks and Landsat-8 Remote Sensing Imagery. Forests, 15(1), 165. https://doi.org/10.3390/f15010165