Abstract
Mangrove forests are significant participants in coastal ecological environment systems. For the development of protection strategies, it is crucial to automatically and accurately detect the distribution and area of mangroves using satellite images. Although many deep-learning-based mangrove detection and segmentation algorithms have made notable progress, the complex regional structures and the great similarity between mangroves and the surrounding environment, as well as the diversity of mangroves, render the task still challenging. To cover these issues, we propose a novel deep-supervision-guided feature aggregation network for mangrove detection and segmentation called MangroveSeg, which is based on a U-shaped structure with ResNet, combining an attention mechanism and a multi-scale feature extraction framework. We also consider the detection and segmentation of mangroves as camouflage detection problems for the improvement and enhancement of accuracy. To determine more information from extracted feature maps in a hidden layer, a deep supervision model is introduced in up-sampling to enhance feature representation. The spatial attention mechanism with attention gates is utilized to highlight significant regions and suppress task-independent feature responses. The feature fusion module can obtain multi-scale information by binding each layer to the underlying information and update feature mappings. We validated our framework for mangrove detection and segmentation using a satellite image dataset, which includes 4000 images comprising 256 × 256 pixels; we used 3002 for training and 998 for testing. The satellite images dataset was obtained from the Dongzhaigang National Nature Reserve located in Haikou City, Hainan Province, China. The proposed method achieved a 89.58% overall accuracy, 89.02% precision, and 80.7% mIoU. We also used the trained MangroveSeg model to detect mangroves on satellite images from other regions. We evaluated the statistical square measure of some mangrove areas and found that the evaluation accuracy can reach 96% using MangroveSeg. The proposed MangroveSeg model can automatically and accurately detect the distribution and area of mangroves from satellite images, which provides a method for monitoring the ecological environment.
1. Introduction
Mangrove forests can be found mainly in the southeast, south coasts, and bays with silt deposits in China [1,2]. The mangrove ecosystem supports an incredible diversity of creatures, including some species that are unique to mangrove forests and extremely important to the coastal ecosystems they inhabit [3,4,5,6,7]. Physically, mangrove forests improve water quality by filtering pollutants, mitigate climate change by storing carbon, reduce coastal erosion, and act as a buffer zone between marine and terrestrial communities, protecting coastlines from damaging floods, waves, and winds. However, mangrove ecosystems are gradually degraded by human disturbance, such as the shift towards aquaculture and agriculture [8,9,10]. Traditional studies relied mainly on remote sensing images and used low-altitude unmanned aerial vehicles to collect images or field surveys. However, field surveys are difficult to conduct due to the distribution of mangroves in beach marshes [11]. It is relatively easy and reliable to effectively segment the area of mangrove distribution from satellite remote sensing images, which are usually used to monitor the surface of the Earth, especially with field surveys in the coastal ecosystem. Therefore, it is very significant for remote image processing and analysis to have high requirements such as good accuracy, high speed, and low algorithm cost. Both for the study of individual trees and mangrove categories, low-altitude radar images have been used as the primary analysis objects, and a large number of satellite images are used to monitor the growth areas of mangroves. From the above research, it can be observed that satellite images play important roles for the distribution and species monitoring of mangroves.
Pettorelli et al. [12] continuously tracked the use of remote sensing images for monitoring forest area, plant growth, carbon cycle ecology, and other aspects. Valderrama Landeros et al. [13] proposed an NDVI-based classifier to monitor mangrove forest species in Mexico. Baloloy et al. [14] proposed a Mangrove Vegetation Index (MVI) using the near-infrared and shortwave infrared and green bands of Sentinel-2 to enable rapid and accurate mapping of mangroves. Liu et al. [15] classified four types of mangrove species in the Mai Po area of Hong Kong and conducted research on the spatial distribution pattern of mangroves. Wang et al. [16] released the first mangrove height and AGB map of Hainan Island and demonstrated the feasibility of using drone LiDAR as a mangrove sampling tool to measure the distribution of mangroves. However, it is difficult to achieve robust and generalized performance for these studies of mangrove distribution due to various objective factors. The selection of classification algorithms is primarily based on the intensity or texture information of mangrove images.
Given the rapid development of machine learning, the current remote sensing image processing algorithms are divided into two categories: unsupervised and supervised [17]. (1) Unsupervised algorithms: Taureau et al. [18] introduced the K-means algorithm for analysis and research on mangrove distribution. Nagarajan et al. [19] focused on the comparison of machine learning algorithms for classifying mangrove species and presented the potential of using random forests. Pourshamsi [20] completed tree height measurements using machine learning algorithms. (2) Supervised algorithms: The authors of [17] mentioned that pattern recognition and computer vision have advantages for future mangrove detection, especially in machine learning, and these technologies can provide improvements in the future through new methods. Wang et al. [21] applied the faster R-CNN network to segment individual rubber trees. Guillaume Lassalle et al. [22] employed a neural network and a Laplacian Gaussian filter to enhance the crown borders for the resulting image. Since the U-Net [23] with a U-shaped structure has far-reaching influences benefiting from a symmetric encoder–decoder mechanism with skip connections, which can be built usingVGG [24], ResNet [25,26], or others, lots of methods based on U-Net have been proposed promising good object detection and segmentation performance. Soni et al. [27] modified the U-Net architecture based on DenseNet with long-range skip connections to extract contextual information from satellite imagery utilizing a repetitive feature map and reinforced the information propagation throughout the network. Chen Xu et al. [28] brought out a semantic segmentation model that integrates multiple-scale features to extract mangroves. Guo et al. [29] introduced a ME-Net semantic segmentation model. Lomeo and Singh [30] designed a mangrove monitoring model for Southeast Asia, in which three types of networks are used to extract mangrove distributions. Ulku et al. [31] tested various multispectral remote sensing image and spectral bands using deep semantic segmentation architectures, and it was concluded that combining different categories of multispectral vegetation inDices into a single three-channel input and using state-of-the-art semantic segmentation architectures can improve tree segmentation accuracy under certain conditions. These studies demonstrate the advantages of deep learning frameworks in satellite image processing and analysis. The deep supervision strategy can capture multi-level features by a set of auxiliary networks in the training stage for image segmentation tasks [32,33,34]. Deep supervision makes the trained model able to obtain the shapes and sizes of different objects by progressively localizing and refining segmentation objects that can be used to identify camouflaged targets [35]. Current studies generally focus on different classification algorithms through the spectral, spatial, and texture characteristics of images using deep learning methods.
However, it is difficult to solve the challenges of mangrove detection and segmentation owing to the following issues:
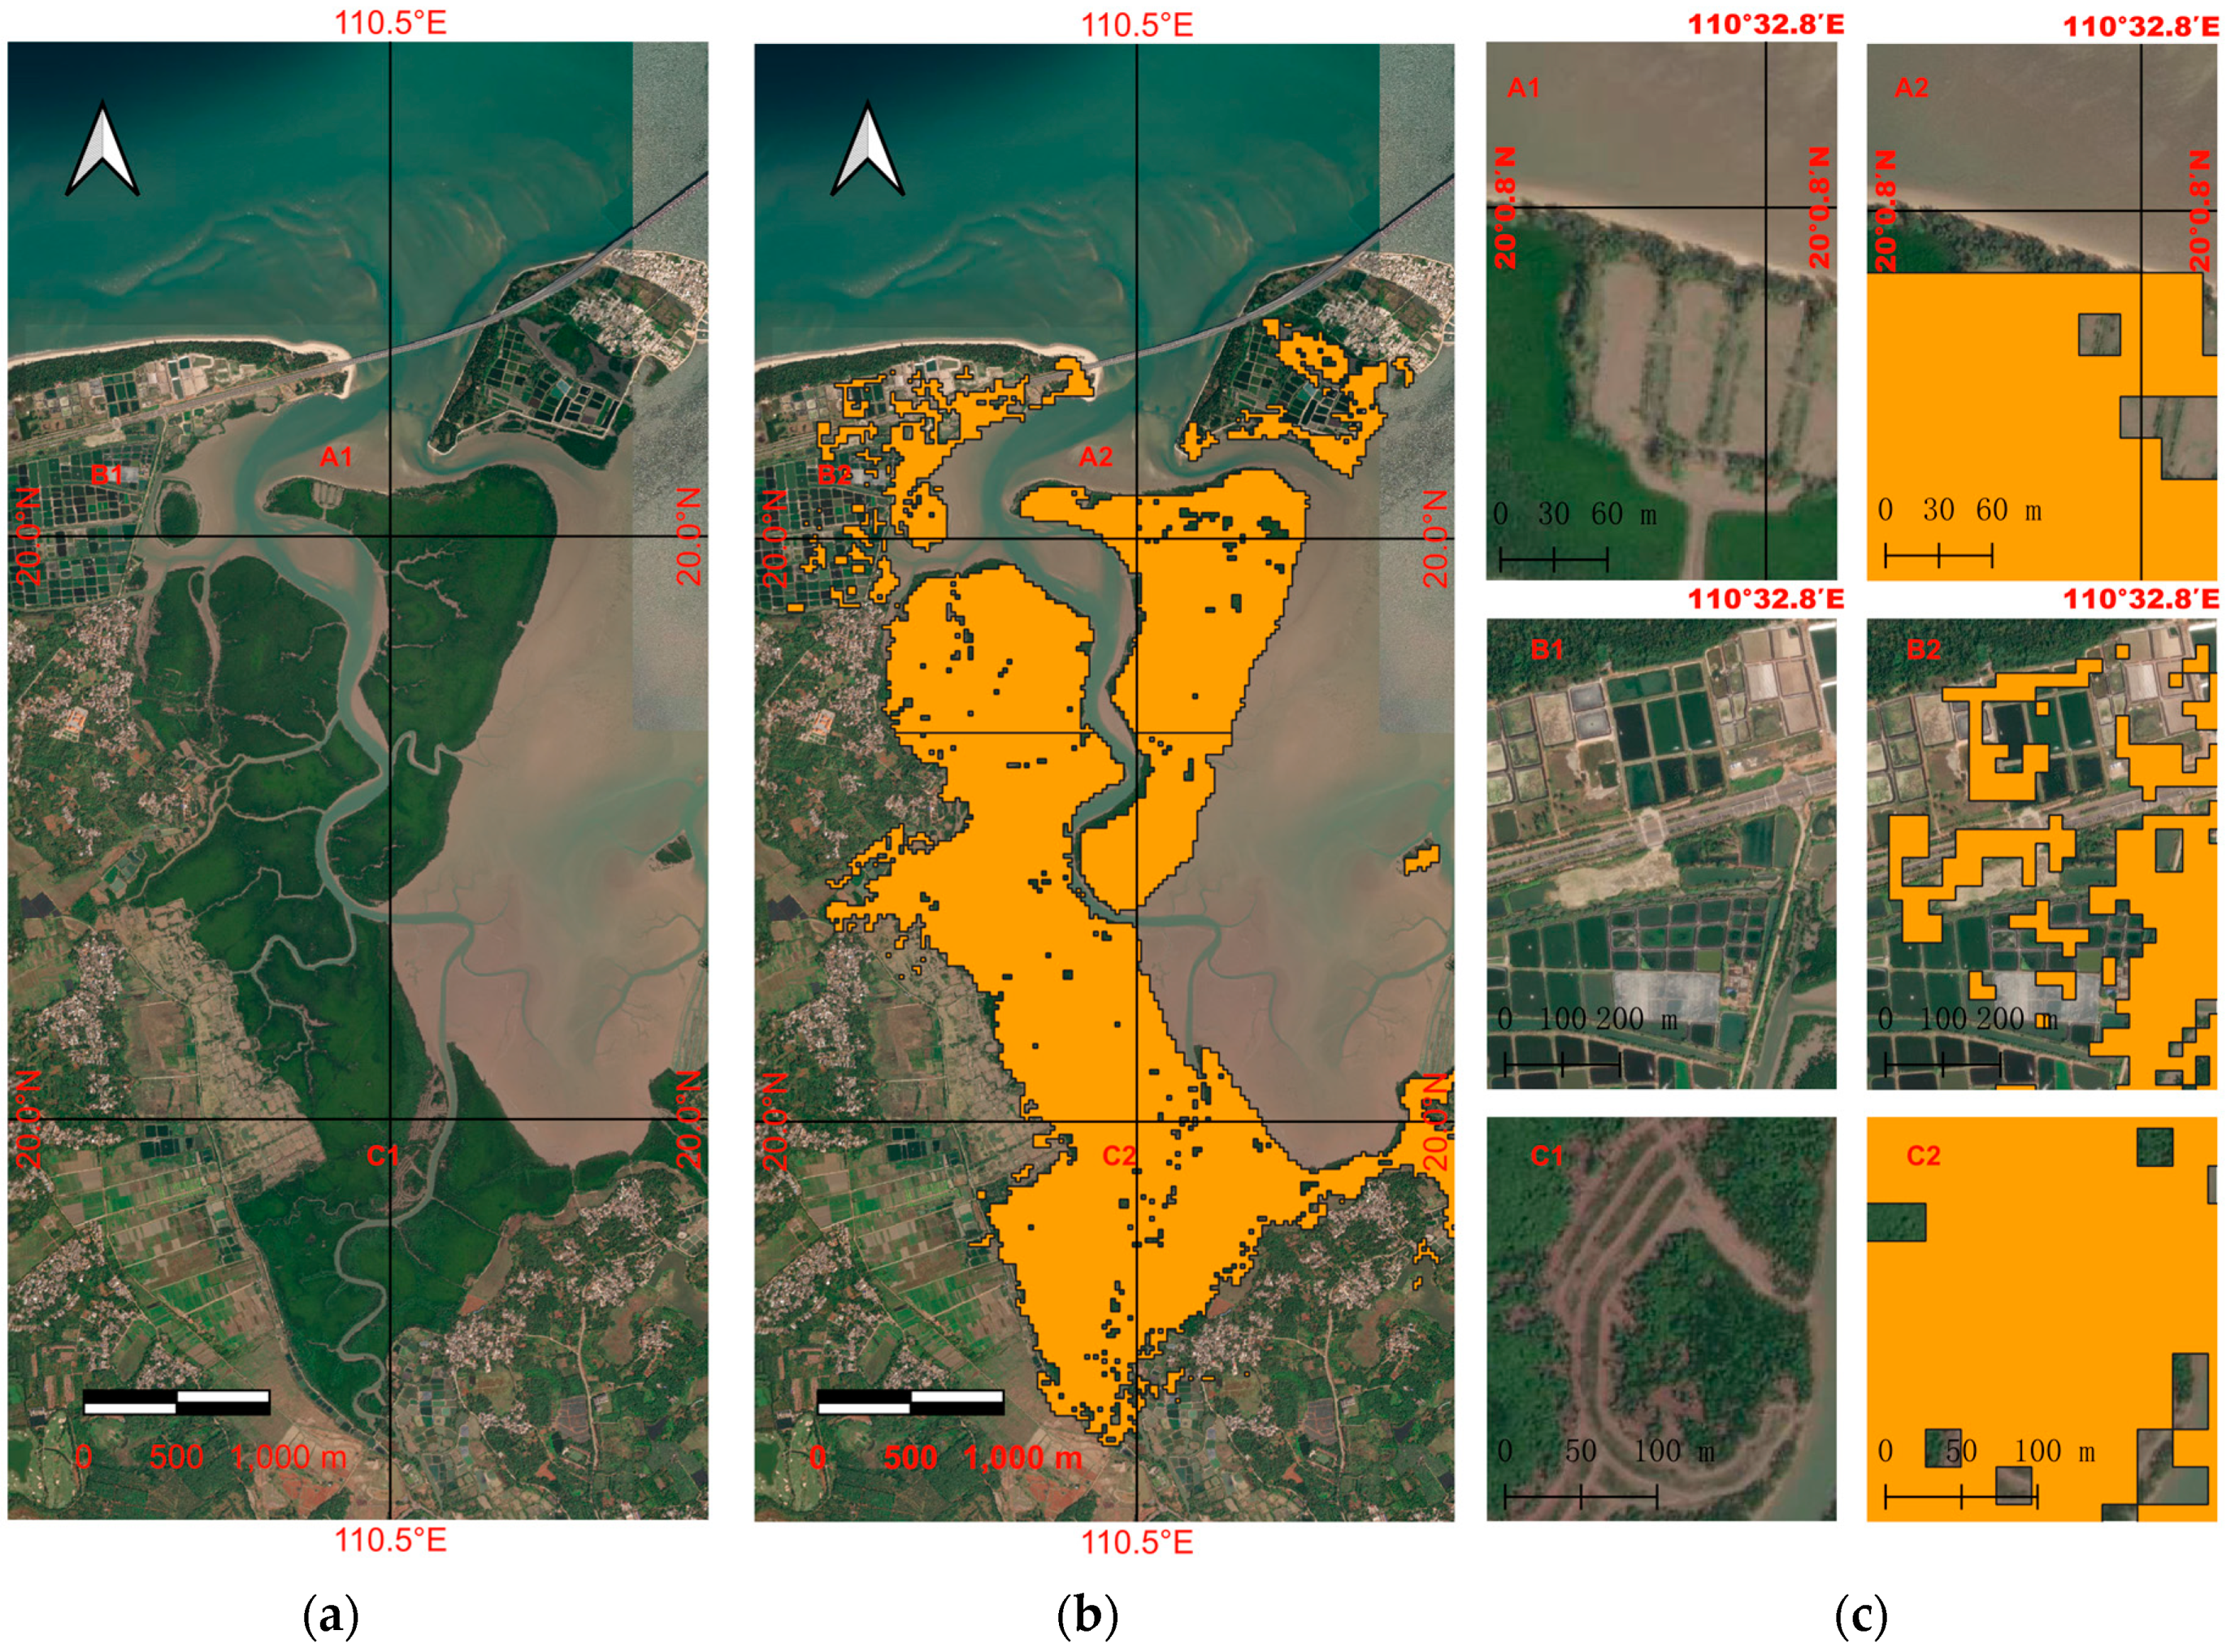
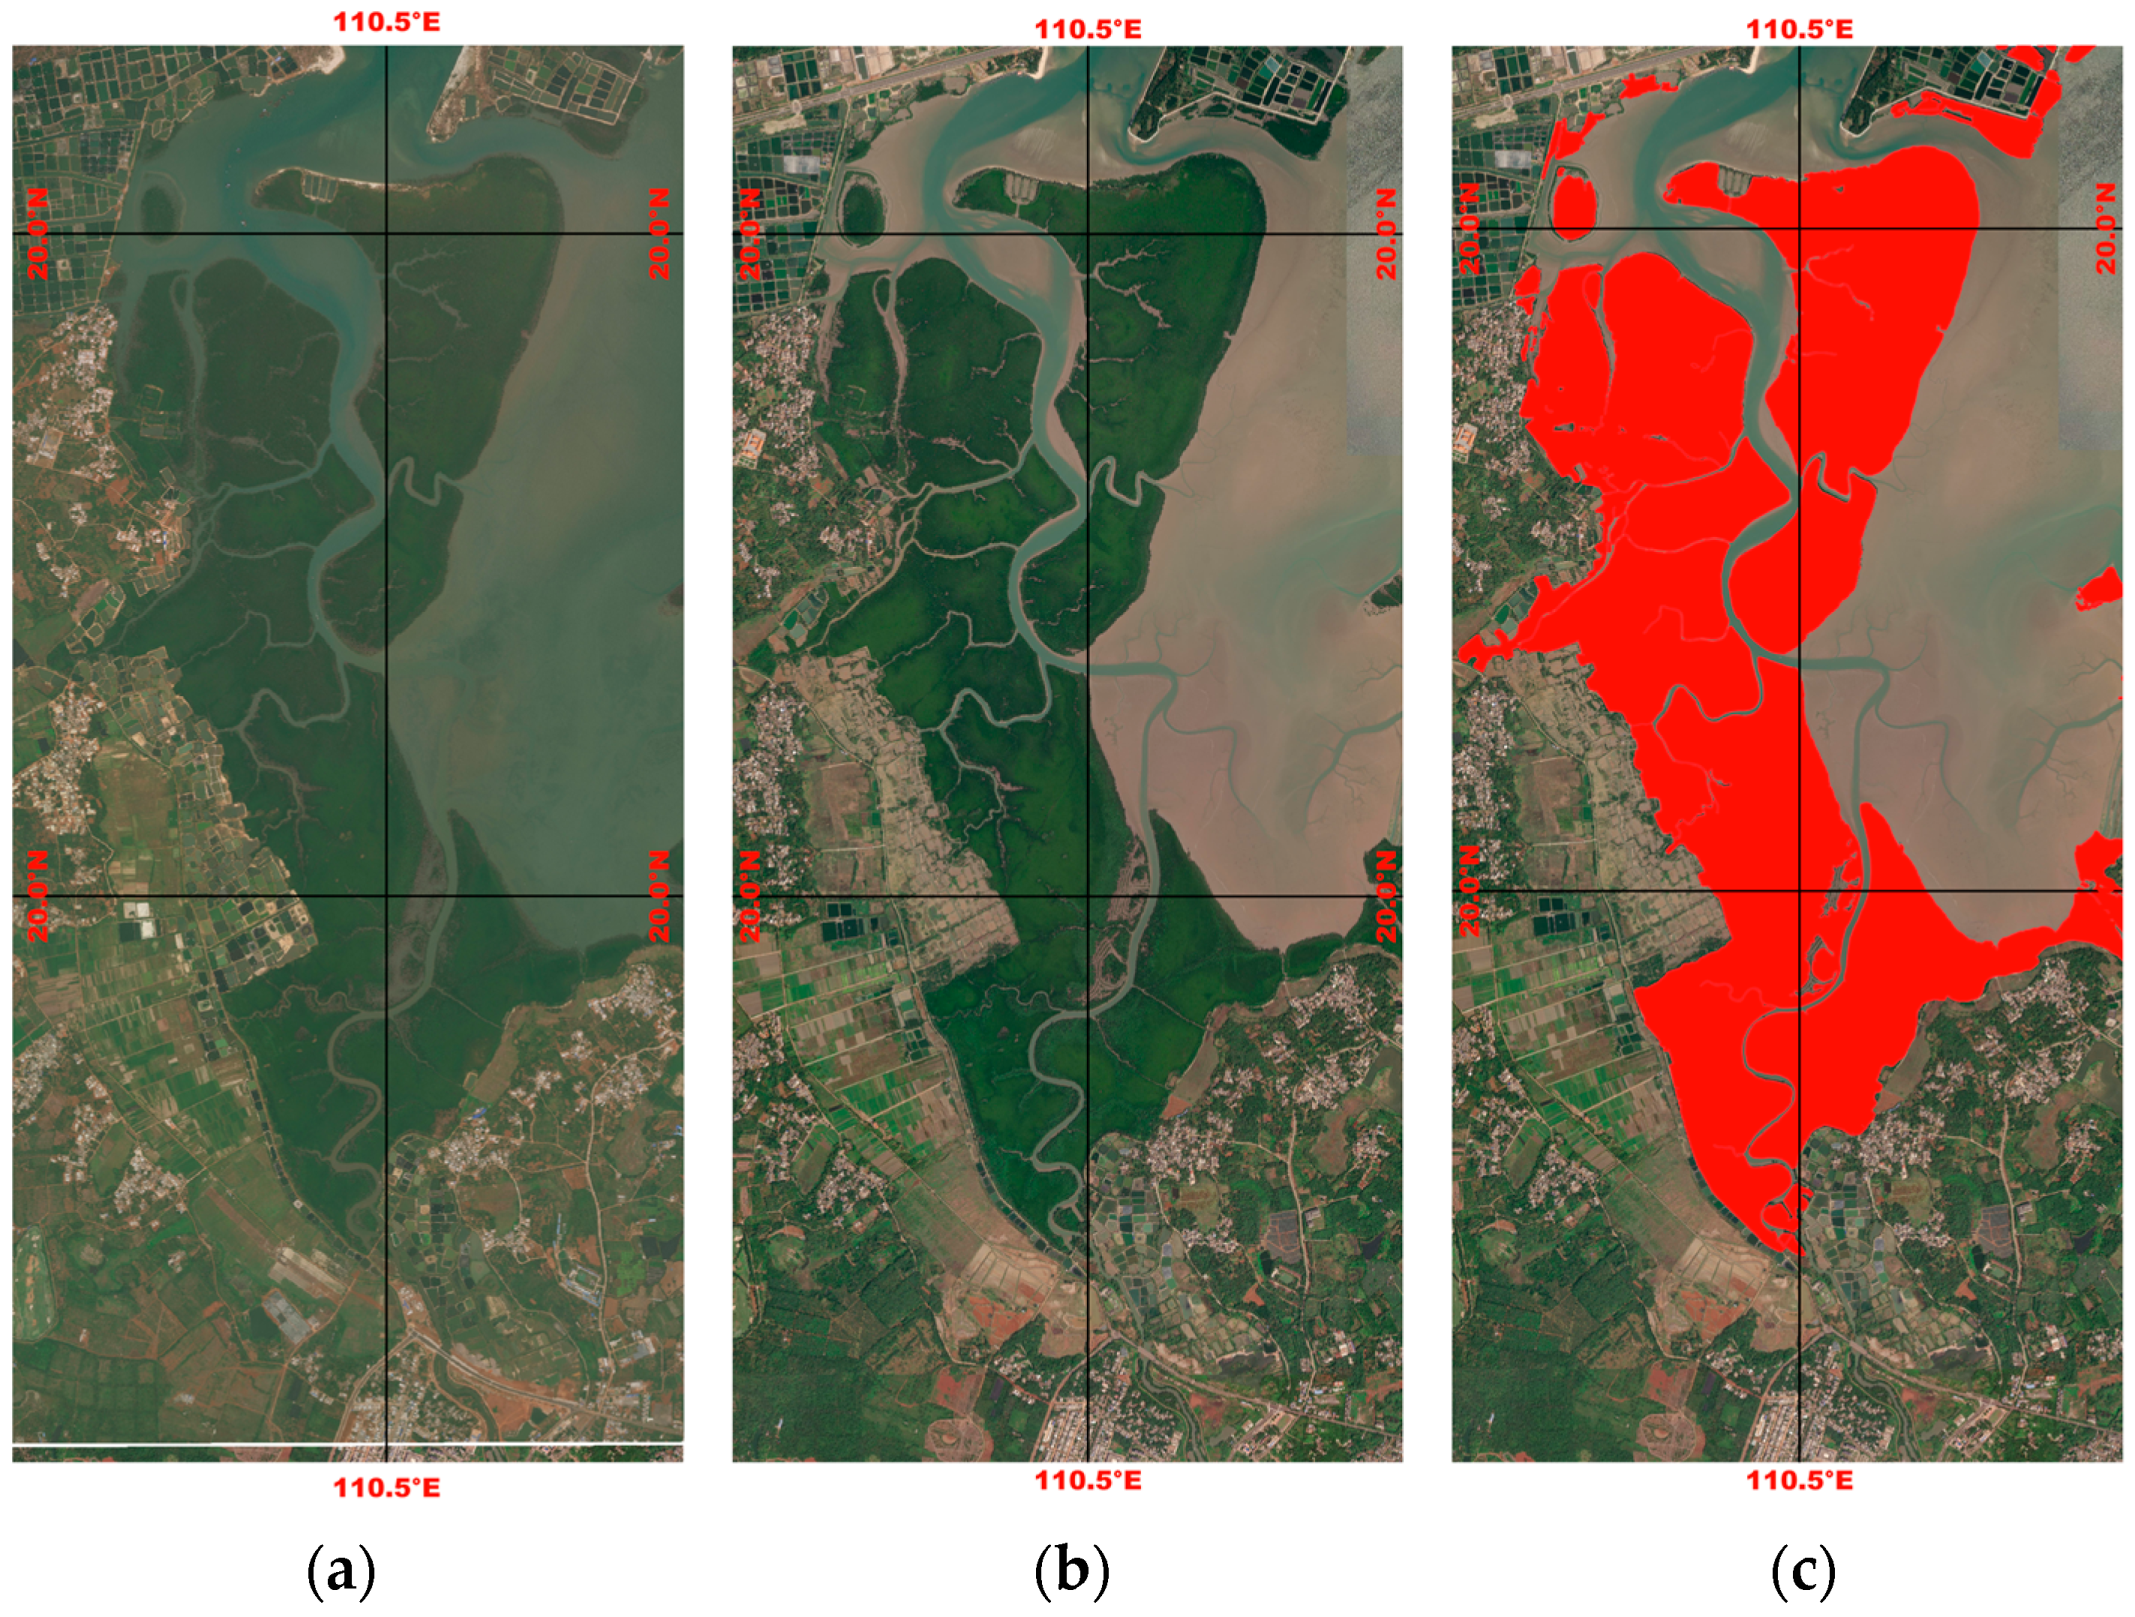
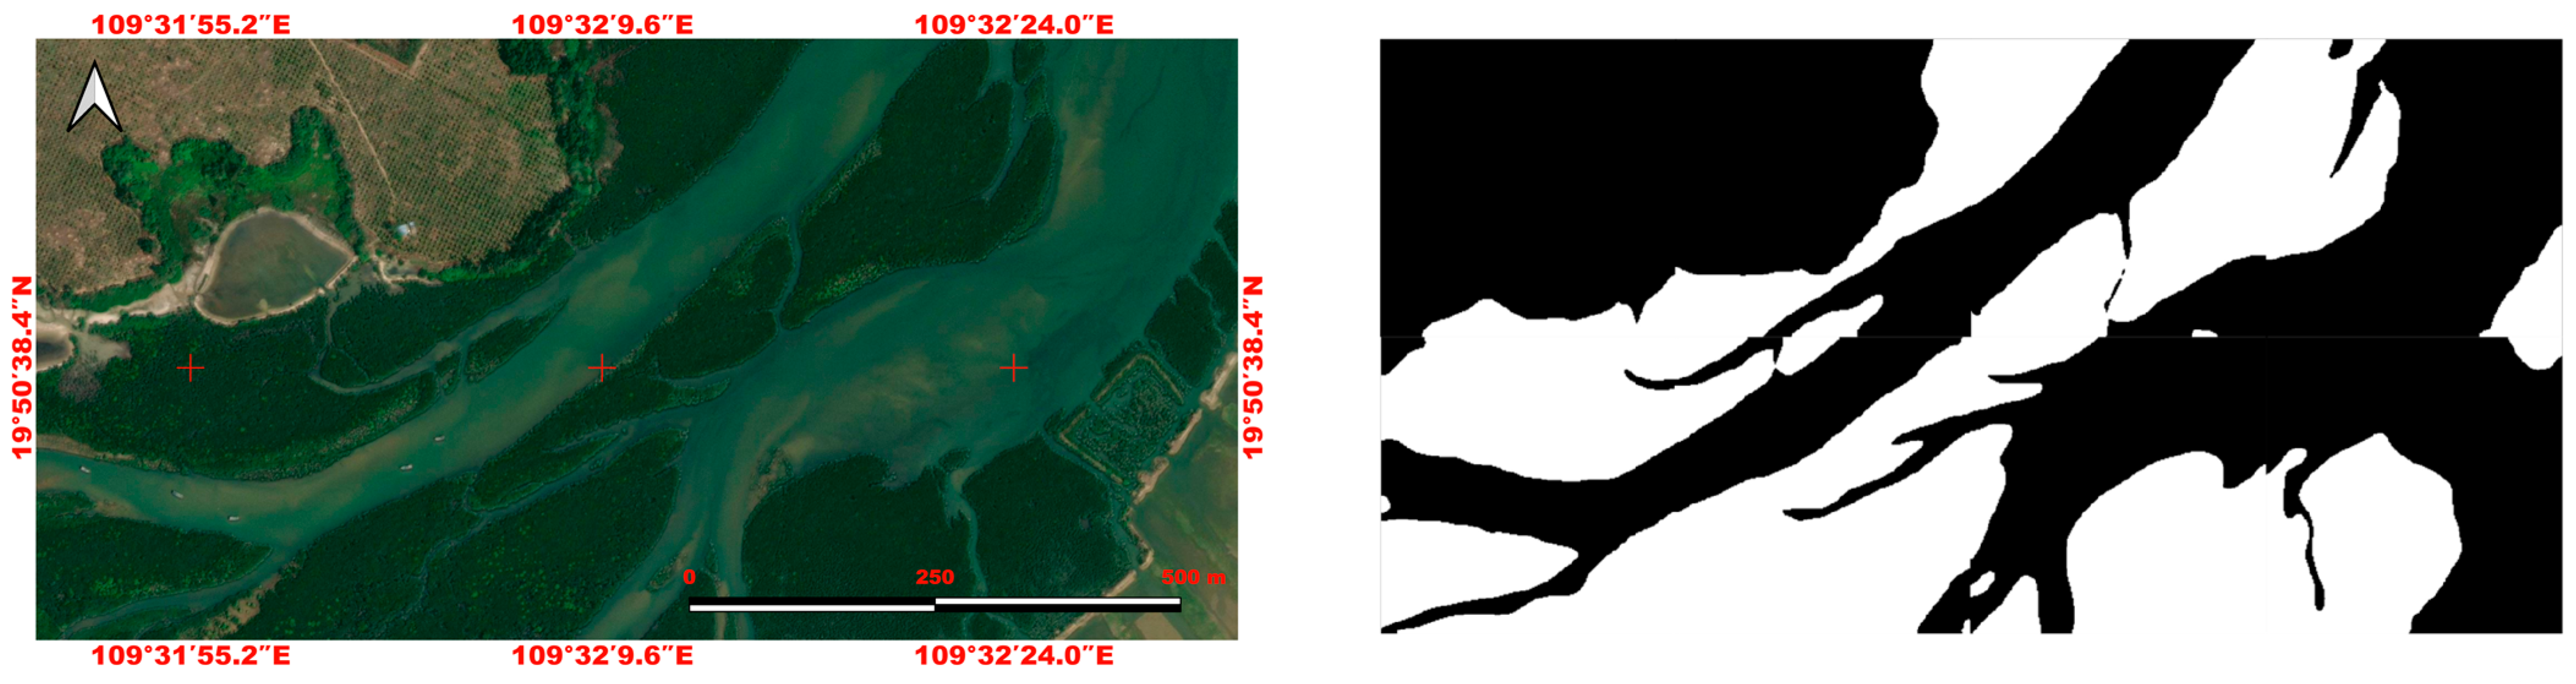
(1) There are complex regional structures, great similarity between the mangroves and the surrounding environment, and a diversity of mangroves, as shown in Figure 1, where Figure 1a is a satellite image from MAPWORLD 2023 (https://www.tianditu.gov.cn/, accessed on 12 November 2023). Figure 1b is the newest corresponding annotated data obtained from the Global Mangrove Alliance (https://www.mangrovealliance.org/gma/, accessed on 21 December 2023). This is suitable for tracking global mangrove extent and change, and the accuracies of the individual gain and loss change classes were lower [36]. Since the surface characteristics of farmlands are similar to the mangroves in the B1 area, there are a lot of obvious false detections in the annotated data as shown in the B2 area.

Figure 1.
The example of mangrove distribution in the northwest of Hainan Dongzhaigang National Nature Reserve. (a) is the original satellite image, (b) is the corresponding annotated data for mangroves, (c) is the enlarged view of corresponding marked area. (A1-A2, B1-B2, C1-C2) come from (a,b).
(2) Accurate annotation data are difficult to obtain, as shown in Figure 1b. It can be observed that there are obvious incorrect results for the annotation data, and some details can be shown in the comparison images in Figure 1c.
(3) Since real-time annotation information is difficult to obtain, most analyses use a certain point in time as a baseline to discuss data changes over several years.
The aim of this study was to develop a high-precision and highly robust algorithm for detecting and segmenting mangrove areas to address the above issues by employing satellite images. We took the data from Hainan province in China as the basis data. We approached the detection and segmentation issue of mangroves as a camouflage target detection problem for the improvement and enhancement of accuracy. We proposed a deep-supervision-guided feature aggregation network based on a U-shape structure with ResNet as the backbone network for mangrove detection and segmentation. The construction of the dataset was achieved through the utilization of QGIS software version 3.28 (QGIS is released under the GPL Version 2 or any later version).
The significant contributions of this study can be summarized as follows:
- A novel deep-supervision-guided feature aggregation network called MangroveSeg is proposed for mangrove detection and segmentation. This innovative network constructs an encoder module inspired by the hybrid ResNet structure.
- The deep supervision model is introduced to further enhance the representation of features, which mitigates the complexities associated with camouflage target detection by integrating an attention mechanism and a multi-scale feature fusion framework to effectively obtain both local and global features for enhancing feature representation.
- The novel learning-based mangrove detection model can be used to update the baselines over multi-year, (2015–2019) to 2023, periods for change detecting. The proposed model can automatically and accurately detect the distribution and area of mangroves from satellite images, which provides a way of achieving a mangrove monitoring gateway for application at the global scale.
2. Materials
Our aim was to identify and segment the area of mangroves in order to monitor the status of their ecological conservation. The dataset setup was carried out in two stages: (1) preparation of the study area; and (2) acquisition, pre-processing of satellite images, and ground truth annotation.
2.1. Study Area
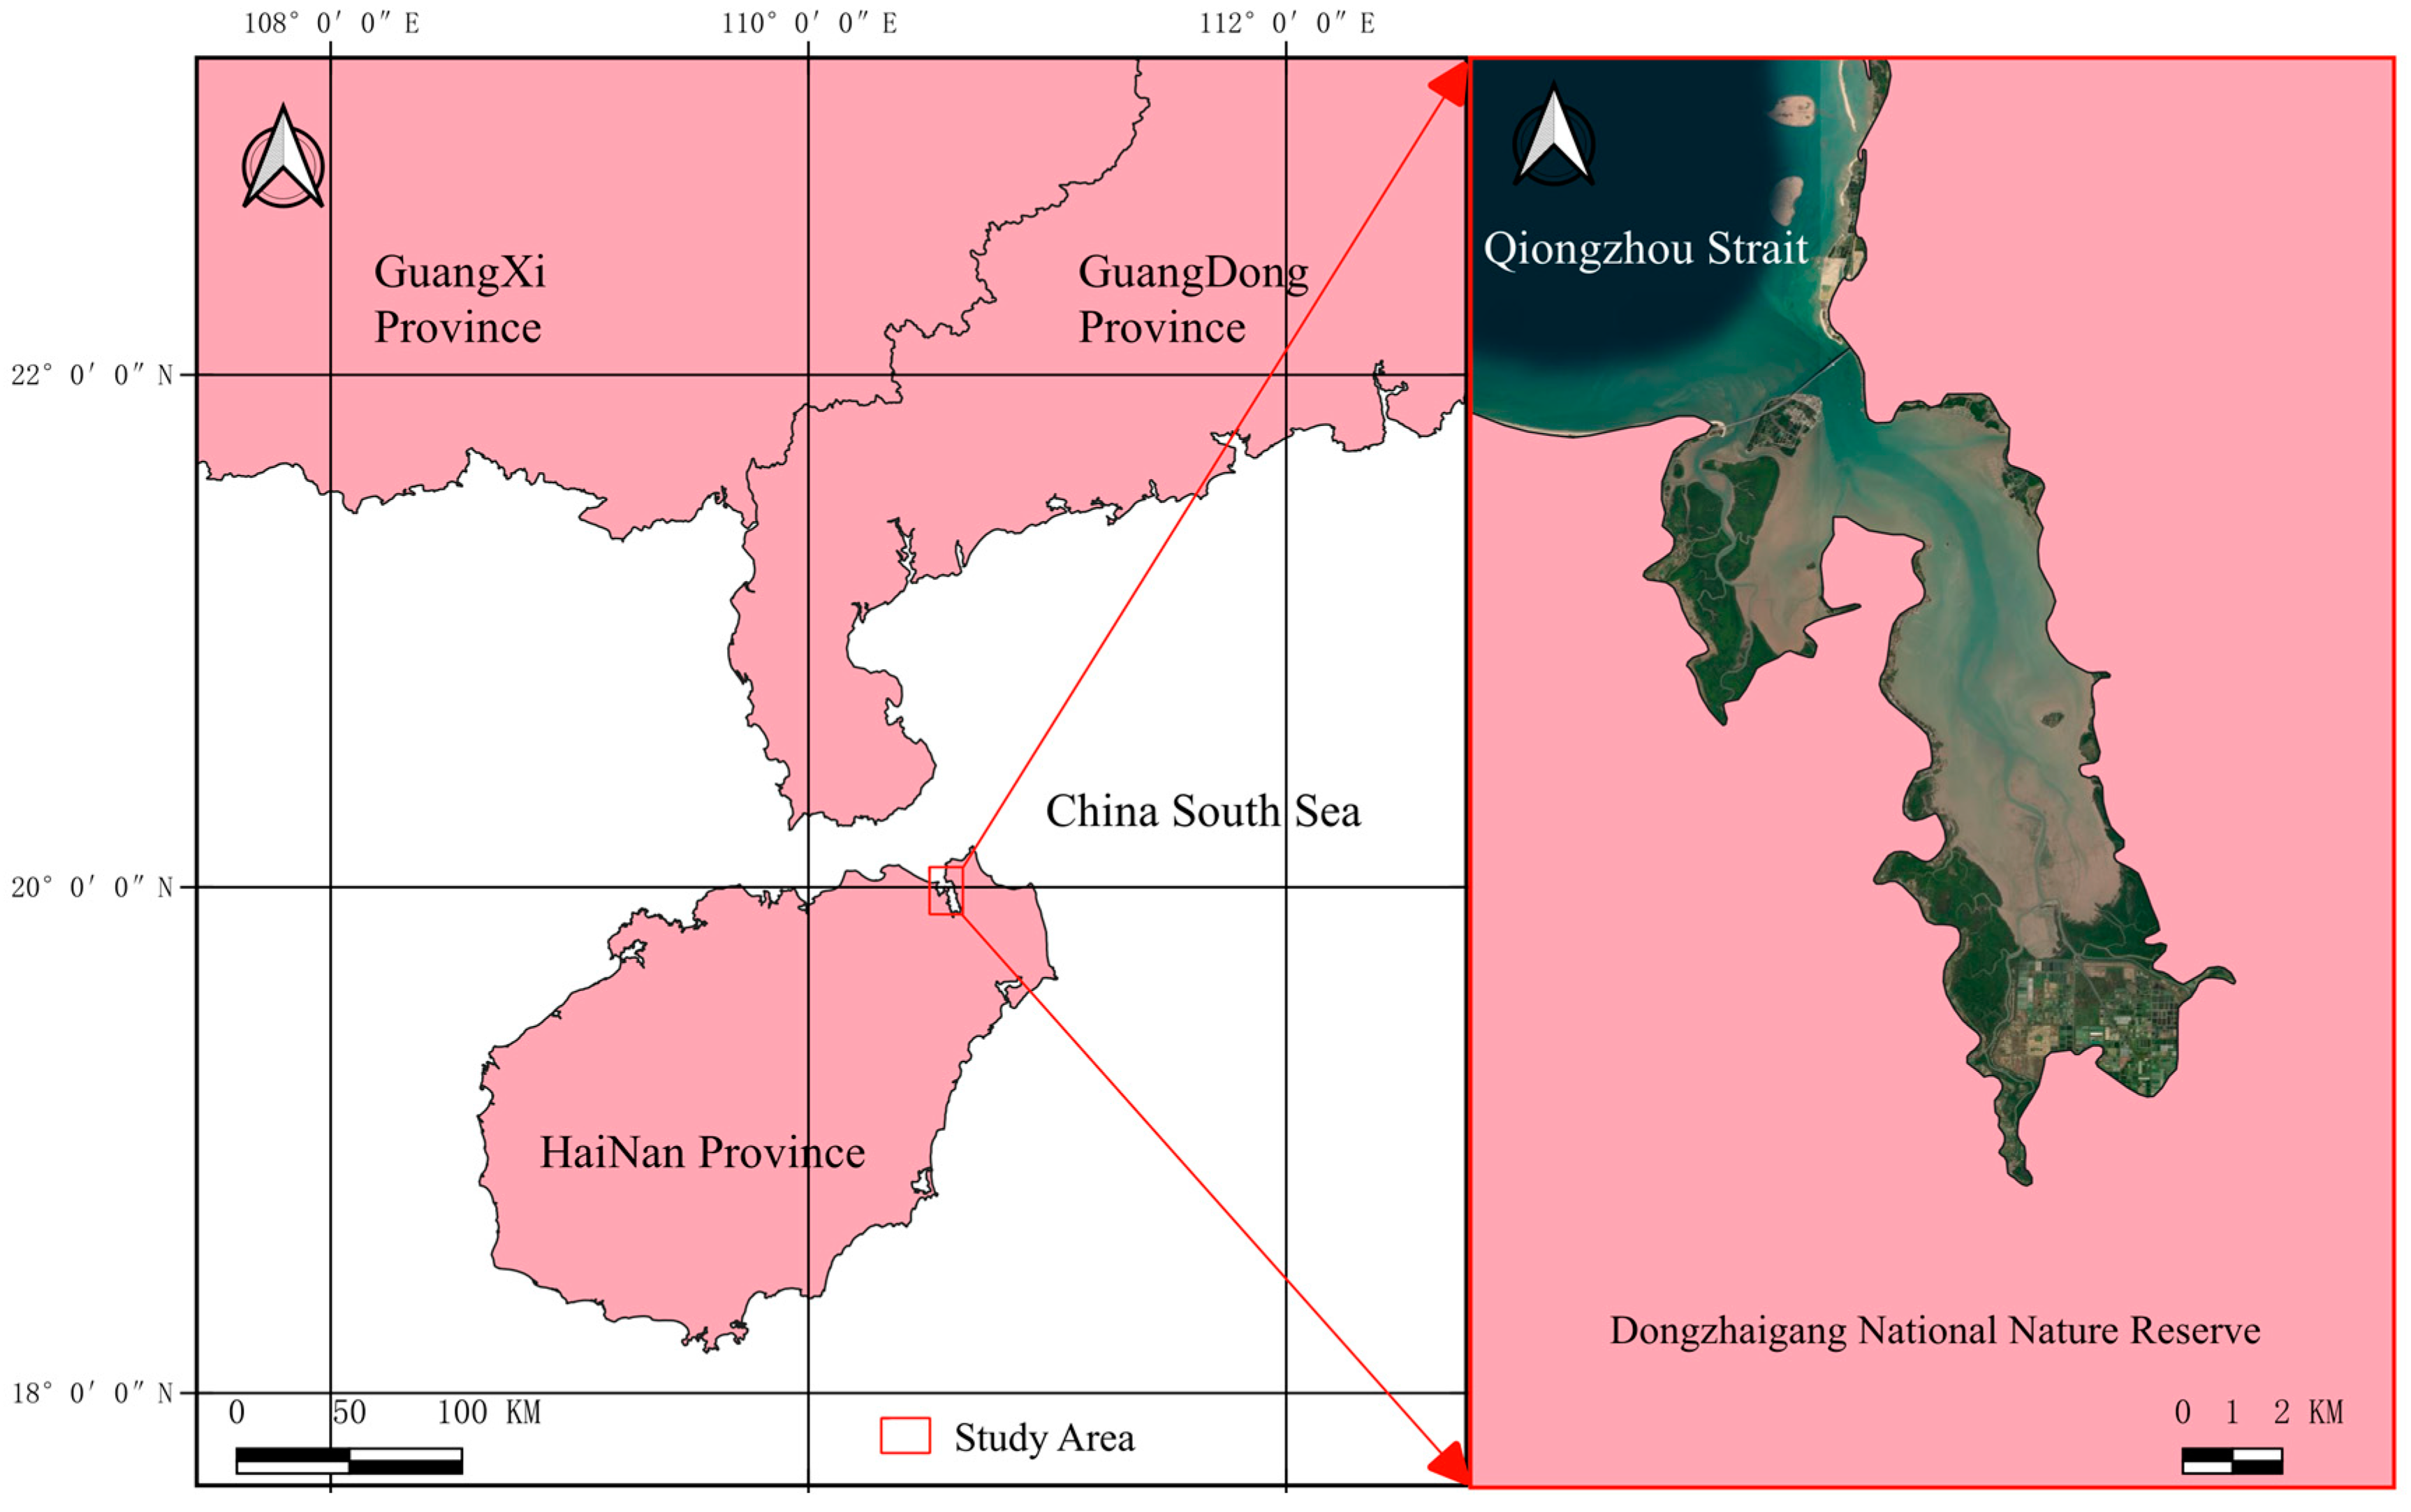
Dongzhaigang National Nature Reserve is located in Yanfeng Town, Meilan District, Haikou City in the northeast part of Hainan Province. As Figure 2 shows, its geographical coordinates are 110°32′~110°37′ east longitude and 19°51′~20°1′ north latitude. Dongzhaigang Mangrove Nature Reserve is rich in plant and animal resources, that is, a treasure trove of species genes and resources. The Dongzhaigang mangrove reserves are unique compared to other reserves as they comprise the most important ecosystem. Therefore, the Dongzhaigang mangrove reserve was selected as the research object, with the aim of evaluating the effectiveness and generalization of deep learning models in the segmentation of mangrove distribution areas.

Figure 2.
Mangrove location diagram of Hainan Dongzhaigang National Nature Reserve.
2.2. Dataset Acquisition and Ground Truth Annotation
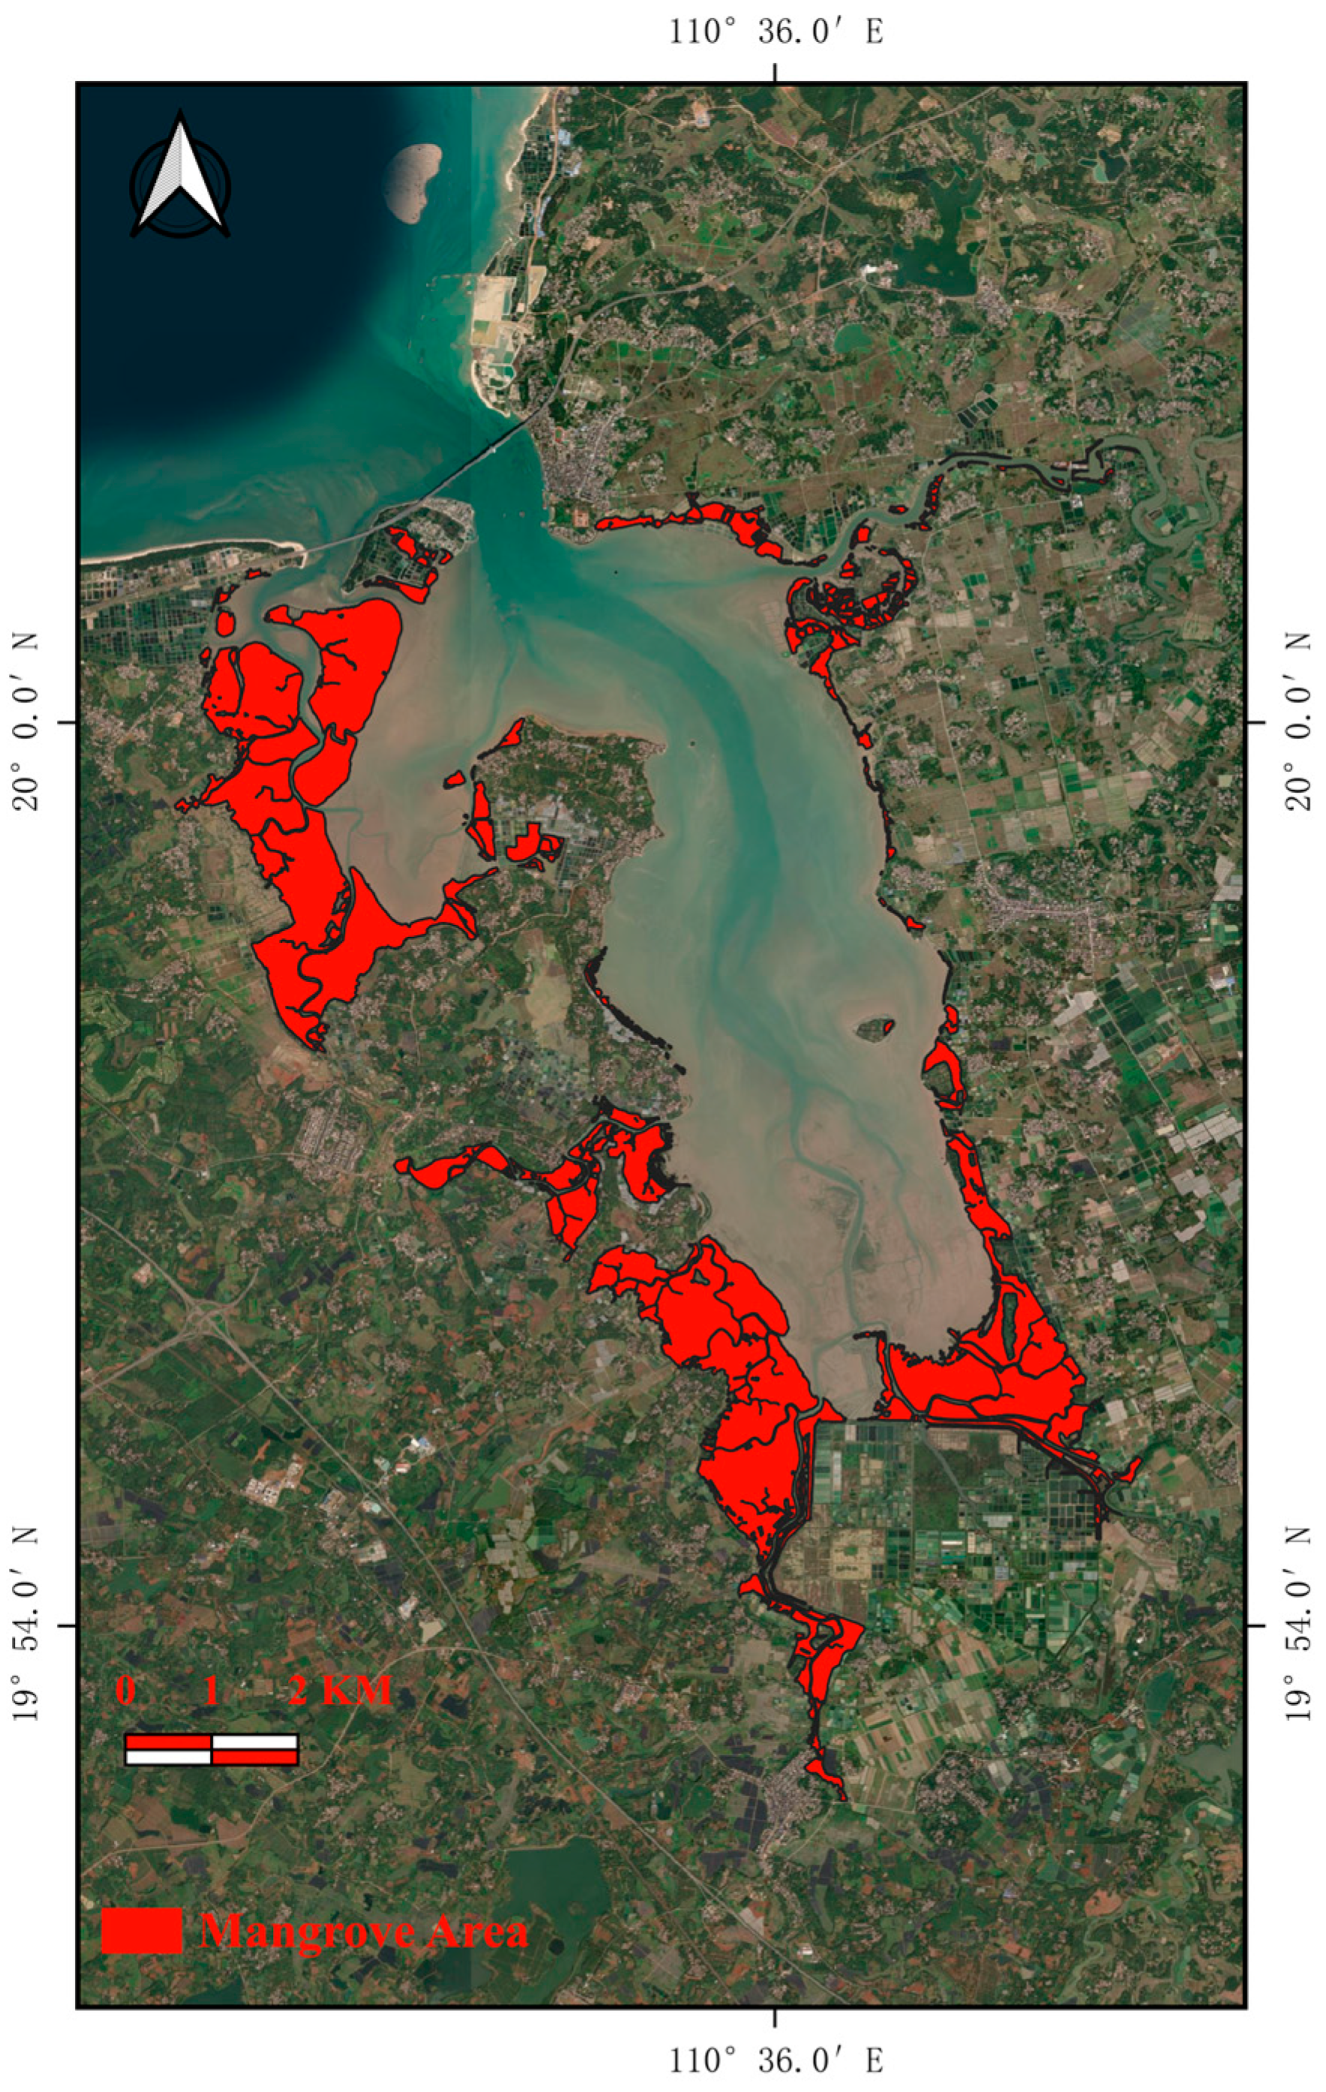
The satellite images used in our research were gathered from the China National Platform for Common Geospatial Information Service (https://www.tianditu.gov.cn/, accessed on 12 November 2023) [37], and the 2023 version of MAPWORLD was used to build the training dataset. The ground truth annotation was obtained from LIAO [38] through a combination of remote images from the GaoFen-2 satellite and UAVs. The GF-2 satellite is China’s inaugural civilian optical satellite, independently constructed and possessing a spatial resolution exceeding 1 m, with sub-satellite points having a resolution capability of 0.8 m. The satellite comes equipped with two high-resolution cameras: one panchromatic, featuring a wavelength range of 0.45–0.90 μm, and another multi-spectral, with wavelengths between 0.45 and 0.89 μm. The spatial resolution of the panchromatic camera is 1 m, whereas the multi-spectral variant has a 4 m spatial resolution. The GF-2 satellite renews its observations every five days. In view of the combination with high resolution and 4 bands (blue/green/red/near-red) for the multispectral and panchromatic images, the accuracy of the annotation is satisfactory and we take it as the ground truth as shown in Figure 3.

Figure 3.
Hainan Dongzhaigang National Nature Reserve mangrove remote image (ground truth annotation marked as red).
We utilized the labeled data from 2019 [38] as the ground truth, and our training data use satellite imagery data from 2023 to alleviate errors caused by data heterogeneity between 2019 and 2023 in consideration of the mangrove forests in this area not changing much. The satellite imagery is as shown in Figure 4, obtained from 2019 and 2023. (a) is the satellite imagery obtained from 2019, (b) is the satellite imagery obtained from 2023, and (c) is the ground truth annotation that still is more accurate than the others. Then, we used the trained model to monitor the distribution of mangrove forests in any area, and we evaluated the statistical square measure of some mangrove areas from Hainan Xinying Mangrove National Wetland Park via MangroveSeg.

Figure 4.
The mangrove distribution statistical charts for northwest of Hainan Dongzhaigang National Nature Reserve Mangrove. (a) is the satellite remote sensing imagery obtained from 2019, (b) is the satellite remote sensing imagery obtained from 2023, (c) is ground truth annotation marked as red.
2.3. Data Pre-Processing
Due to the very large size of the acquired satellite remote sensing images, it is difficult to directly perform calculations and analysis. Therefore, the software QGIS was used to build the samples, including training samples and test samples with small size. In our study, we set the image size as 256 × 256 for model training via QGIS. Also, the ground truth is processed in a corresponding way to ensure a one-to-one match between the original image block and the ground truth. The specific implementation process is as follows:
- The initial step was to integrate the satellite image layer into the QGIS program. Subsequently, the truth label was imported as a new layer, and the locations of both layers were fine-tuned.
- The next step comprised aligning the map layer with Dongzhaigang Nature Reserve. The map scale of 5300:1 was utilized to divide the designated area. To generate the required XYZ tiles, the Raster Tools module in the QGIS software was employed. The tile size was set to 256 × 256 pixels, and the map layer’s zoom level was adjusted to level 17. Following this, the satellite images and ground truth label image were then exported based on the map layer.
- Finally, the produced image files were organized into a dataset, sorted based on their file names. The dataset of the mangroves was divided into two parts, consisting of 4000 images, with 3002 for training and 998 for testing. Since the trained model can be used to monitor the distribution of mangrove forests in any area, we also evaluated the statistical square measure of some mangrove areas from Hainan Xinying Mangrove National Wetland Park as testing data.
3. Methods
3.1. The Proposed MangroveSeg Network
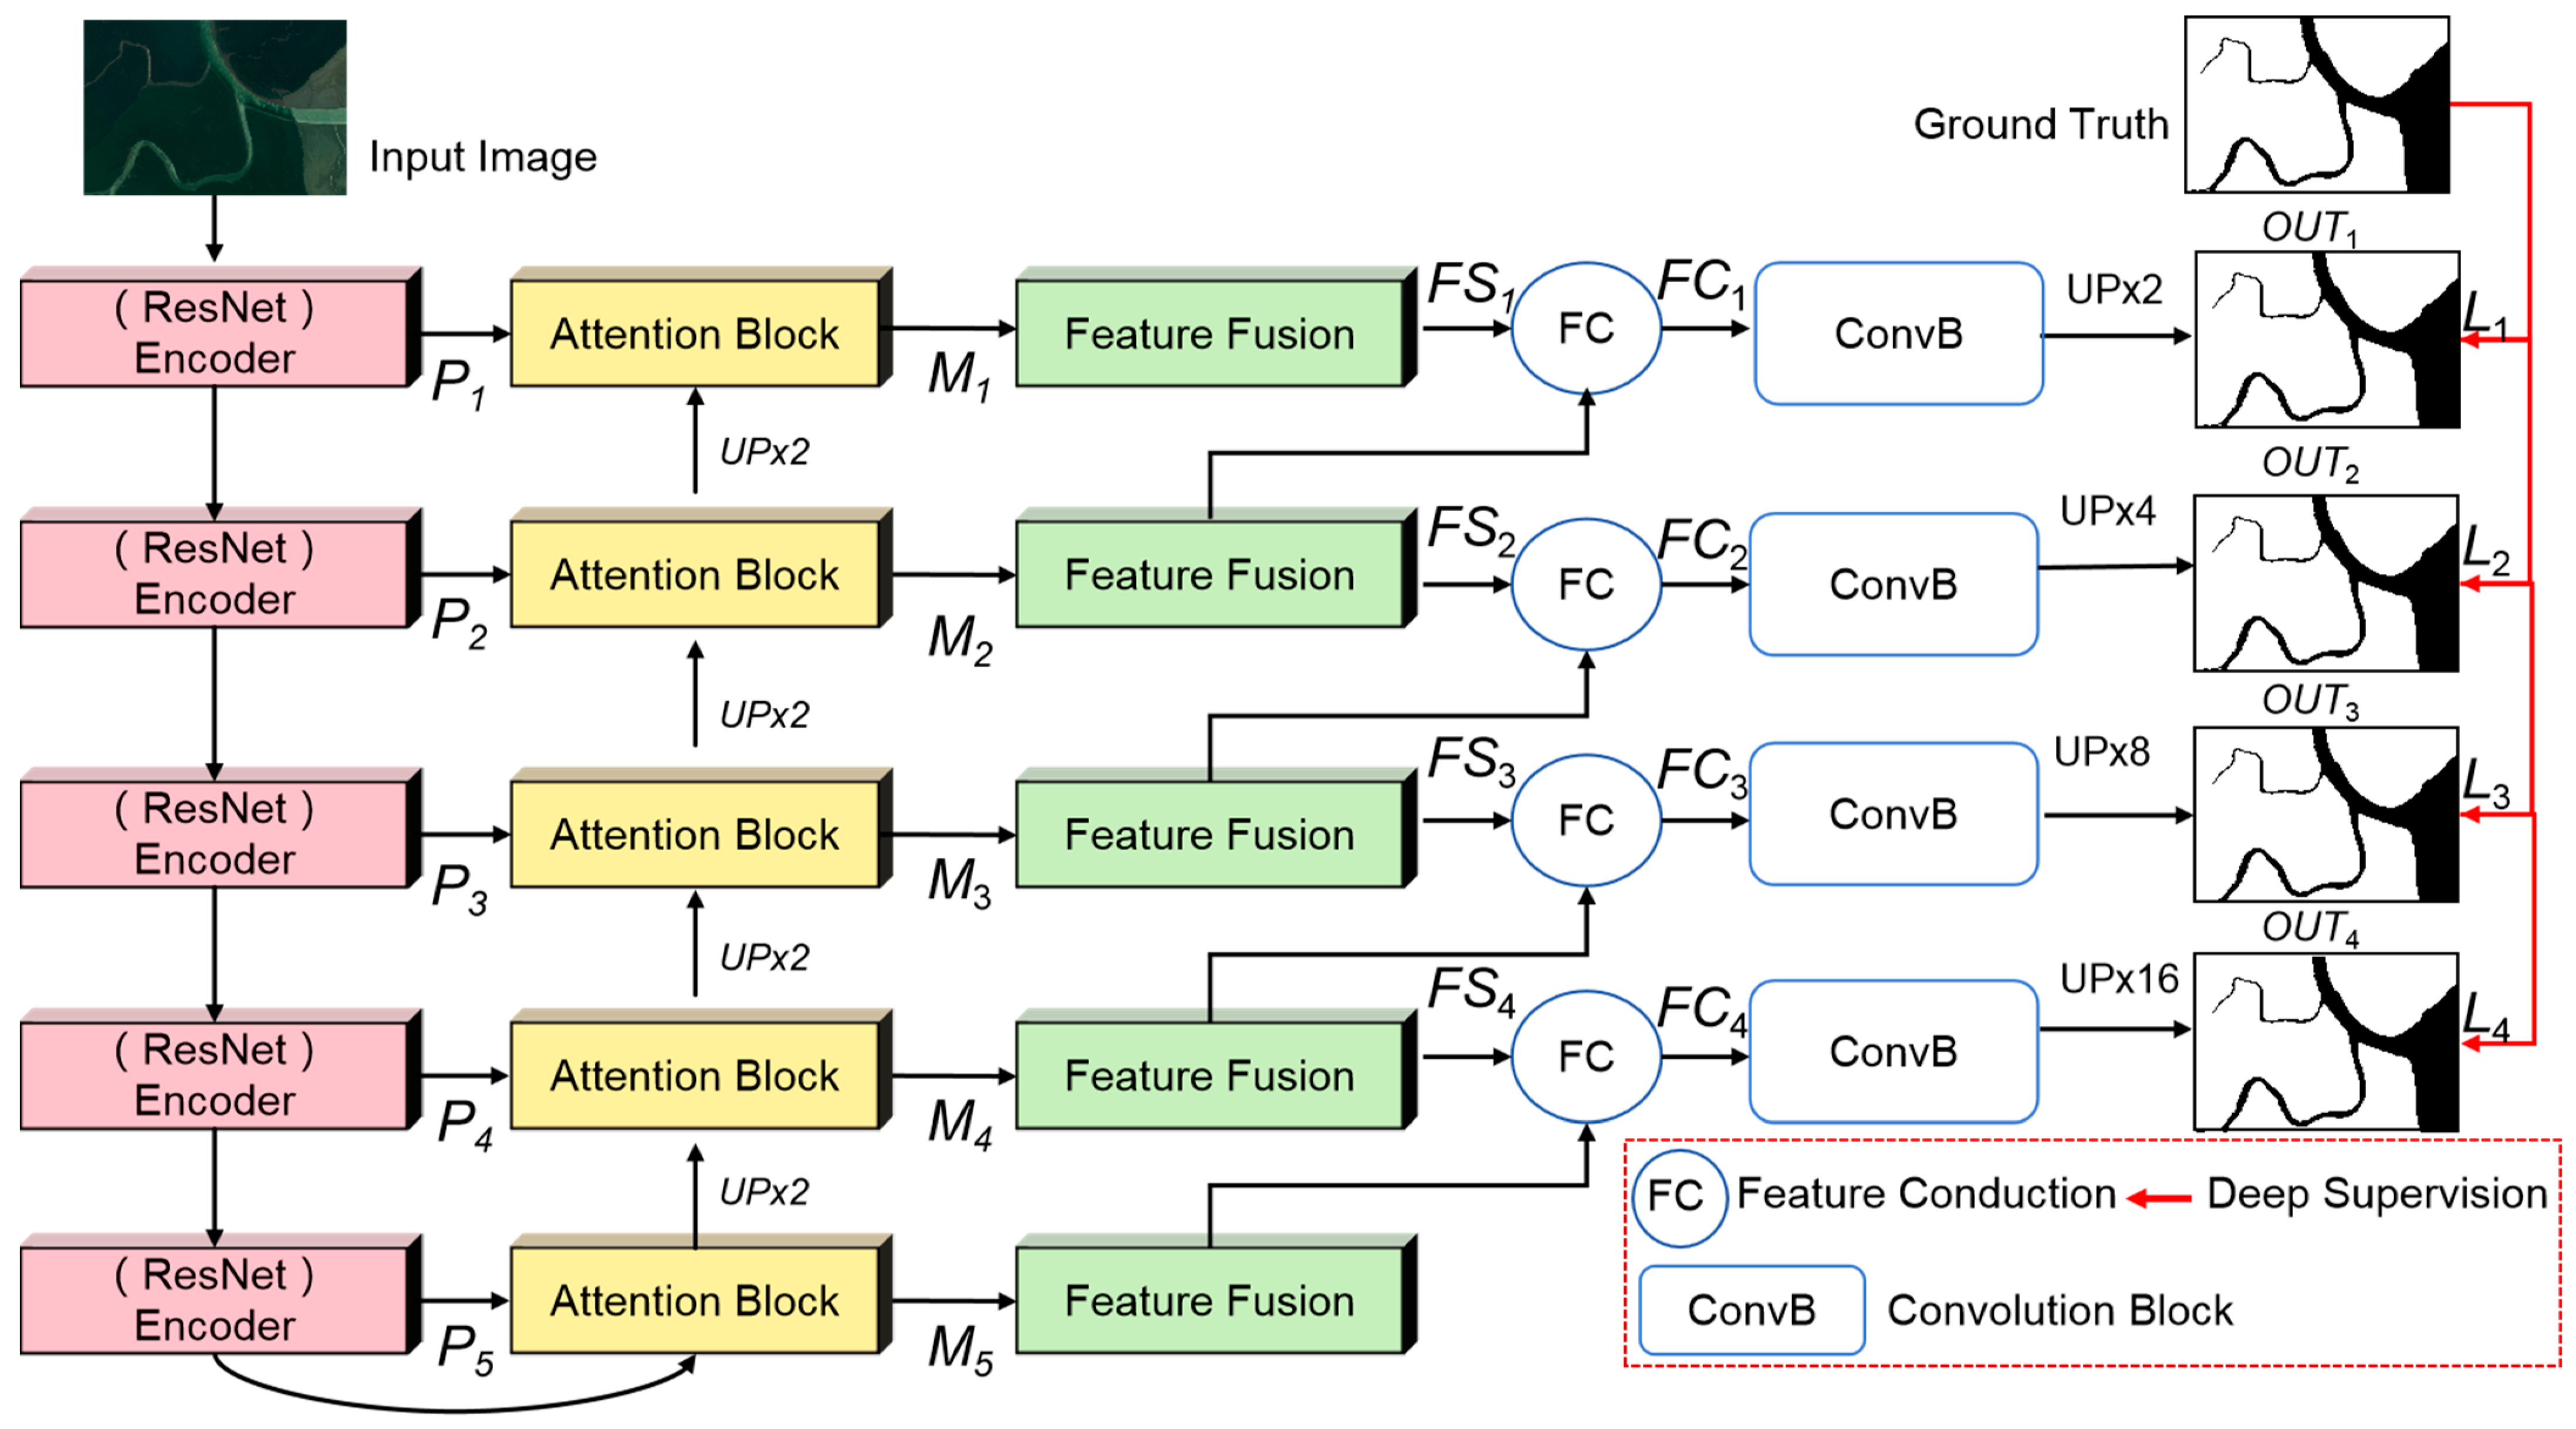
The aim of this study was to build a network for the detection and segmentation of mangroves from remote sensing images. Given the characteristics of mangrove detection and segmentation tasks, we considered the detection and segmentation of mangroves a camouflage detection problem for the improvement and enhancement of accuracy. We chose FAPNet [35] as the baseline network, as it has outstanding performance in the detection of camouflage targets. On the other hand, in order to make the network more suitable for detecting mangroves, we made some improvements to the proposed network based on FAPNet [35]. Figure 5 shows the overall architecture of the new framework, MangroveSeg, which is a deep-supervision-guided feature aggregation network. It is an encode–decode model that includes two main parts: (1) Attention-based feature fusion network: Firstly, ResNet-50 as the backbone network is introduced to extract features from input data and generate feature mapping in each layer with different resolutions via down-sampling. The outputs of each ResNet layer are the corresponding feature maps P1, P2, P3, P4, and P5. Then, these features obtained from each layer are fed into an attention module, which is designed to focus features from different layers with spatial information. The feature fusion module undergoes feature decoupling to obtain the multi-scale fused features FS1, FS2, FS3, FS4, and FS5. Since different layer scans cover more feature content, the feature fusion module can obtain these features together from each layer and further enhance the feature representation. (2) Feature conduction: The feature conduction model is used to aggregate features from different layers as FSi and FSi+1, which are first added together. Then, this is fed into a 3 × 3 convolutional layer for normalized feature maps, the same framework as FAPNet [35]. (3) Deep supervision model: In the decoder, the deep supervision upsamples the output maps from the last encoding layer and all decoding layers to match the size of the label. The loss is calculated separately for each and combined as the total model loss.

Figure 5.
The framework of the proposed MangroveSeg network.
For deep supervision, the feature map OUTi comes from the fusion and conduction of FSi and FSi+1, which come from the fusion of Pi and Pi+1. Finally, OUTi contains the characteristics of the different depth feature maps layer i, layer i + 1, and layer i + 2, that is, it contains the characteristics of the different sizes of receptive fields. In addition, the ConvBlock is used to recalibrate the fused feature map in the channel dimension, and the weight of the features is adaptively adjusted to adapt the importance of different depth feature maps with the change in target scale. Then, the fused feature map can be more in accordance with segmented targets of different scales.
3.1.1. Attention Block Module
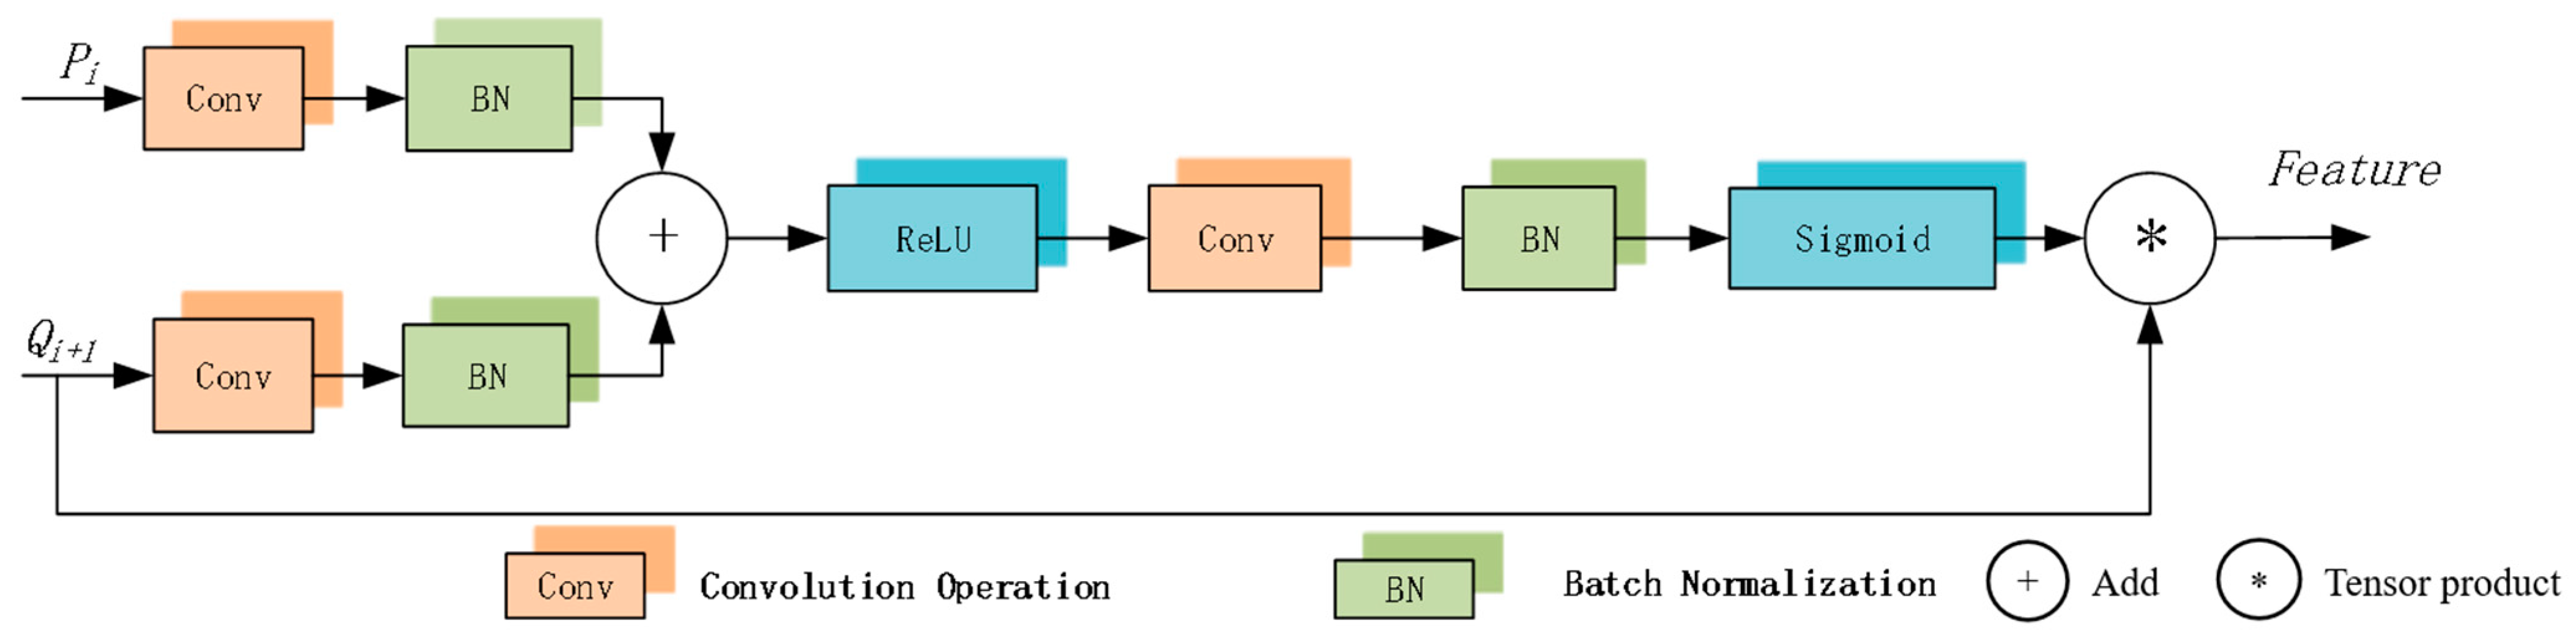
To predict false positives (FPs) for small targets with large degrees of deformation in traditional network structures is very difficult, so the usual practice is to locate first and then segment. However, attention gates (AGs) can achieve this without training multiple models and many additional parameters. AGs suppress feature responses in unrelated background regions without clipping ROIs between networks. As shown in Figure 6, attention gates are designed to highlight significant image regions and suppress task-independent feature responses. Attention gate vectors contain contextual information to prune low-level feature responses. In this paper, additive attention was chosen to obtain the gating coefficient, as it performs better than multiplicative attention. Given the number of trainable parameters and the computational complexity of AG, a spatial support is unnecessary during linear transformation. The input feature map undergoes dimensionality reduction by downsampling it to the gating signal’s dimension. The feature map is then decoupled through a corresponding linear transformation and converted to a lower-dimensional space for gate operations. The outputs of each ResNet layer are the corresponding feature maps P1, P2, P3, P4, and P5. Then, the attention module can obtain Mi from Pi and Qi+1 via upsampled Mi+1, which is designed to focus the features of interest of layers with the spatial information.

Figure 6.
Attention gates block diagram.
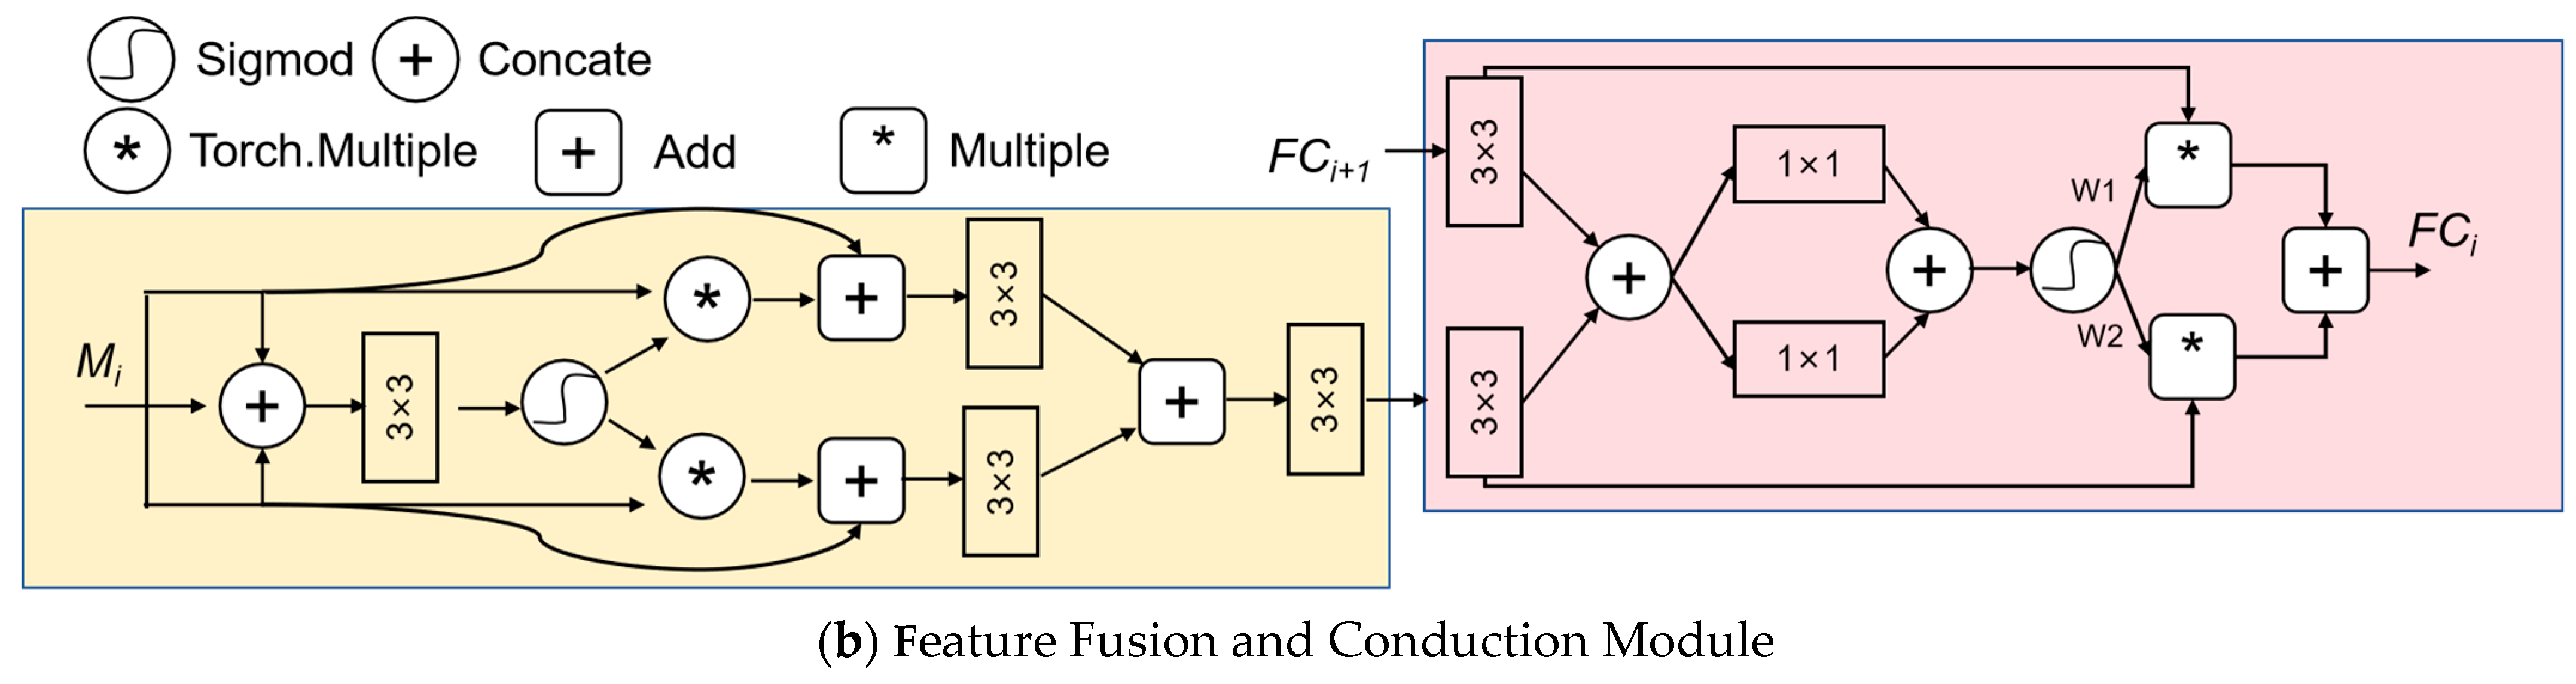
3.1.2. Feature Fusion and Conduction Module
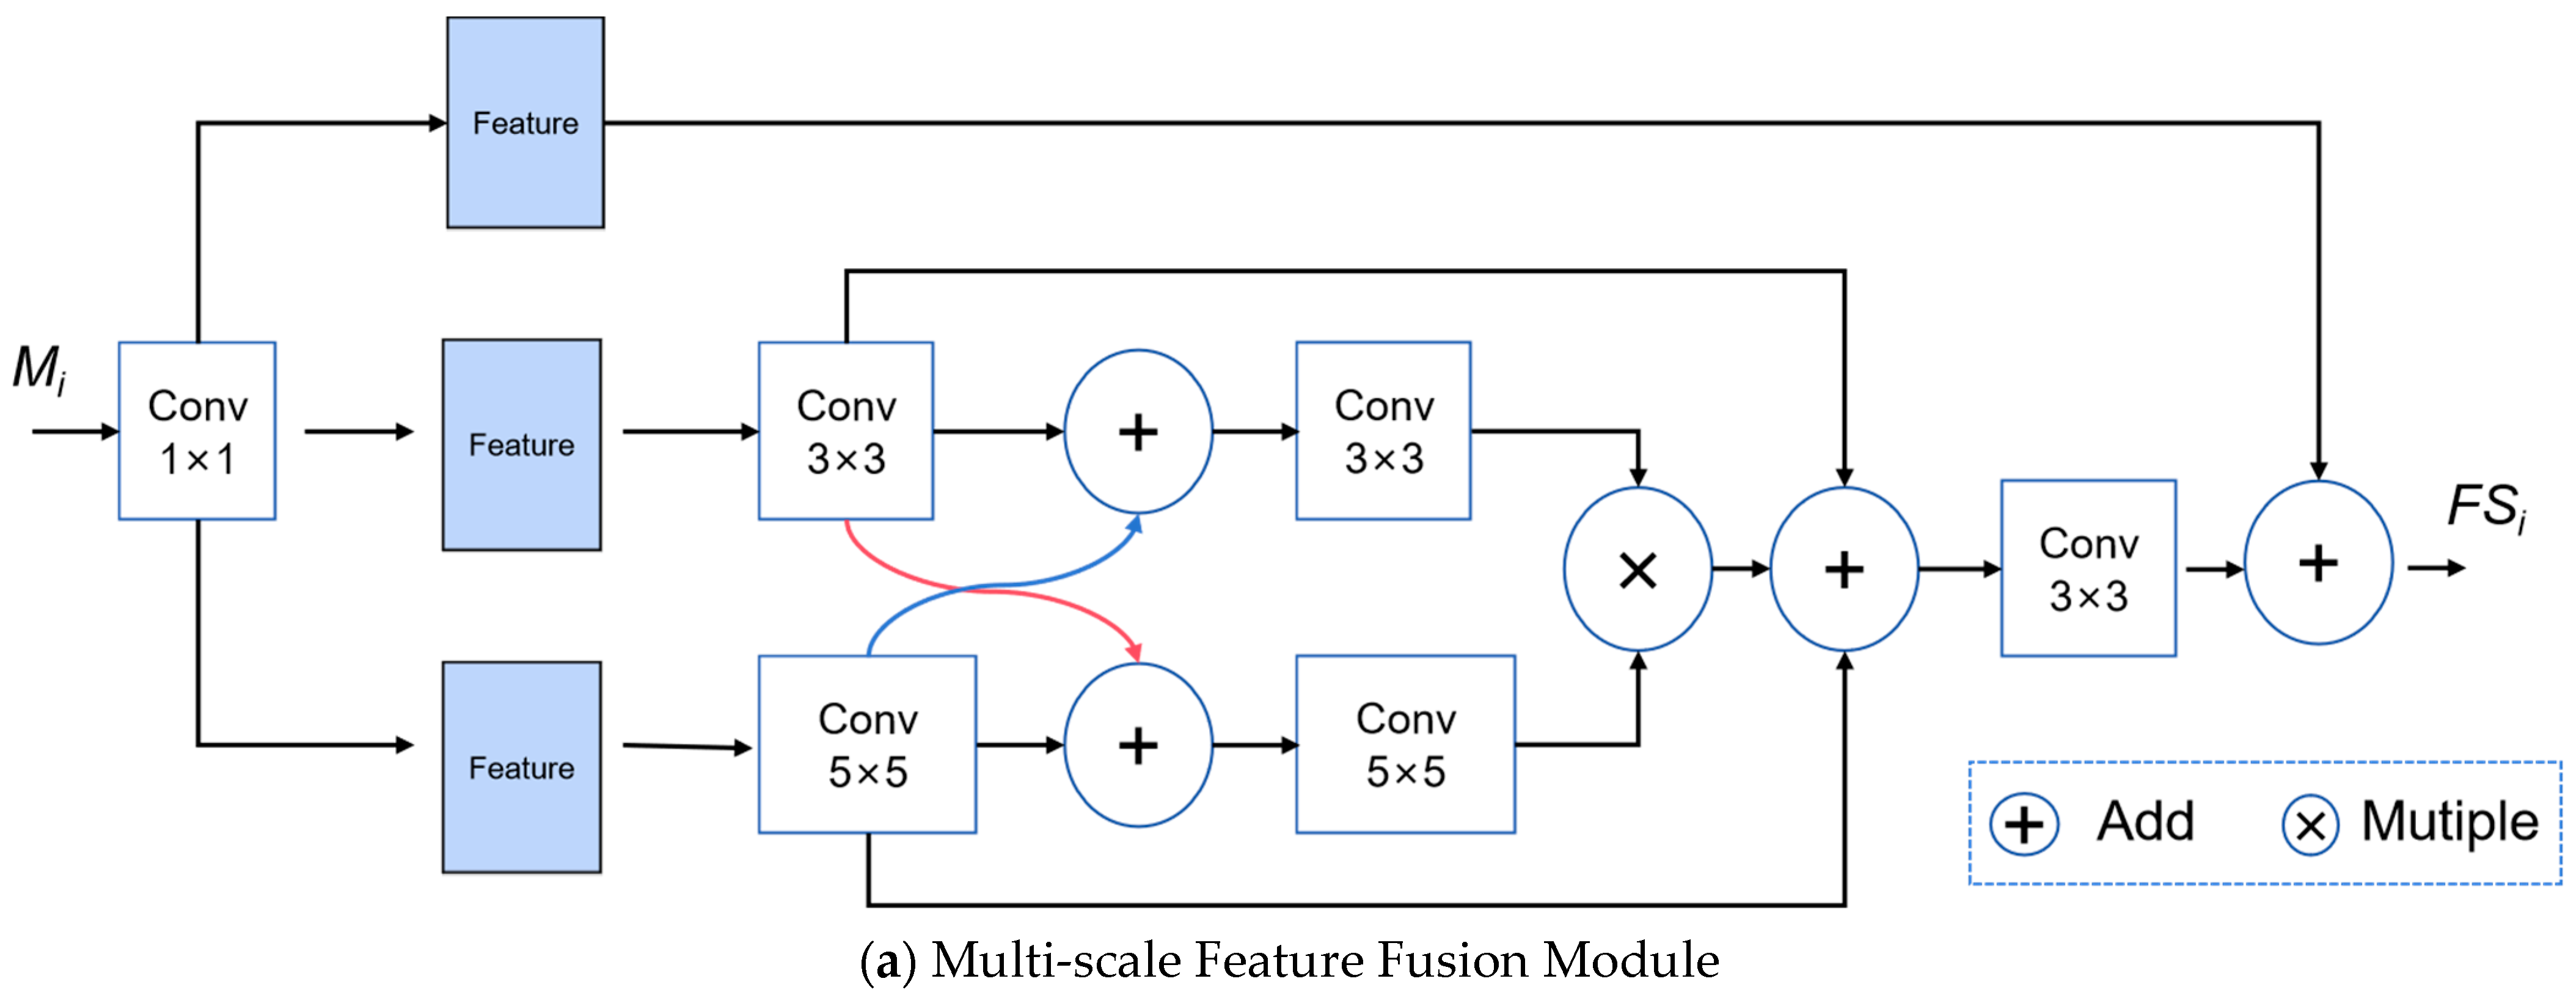
Since different layers can cover more feature content, the feature fusion module can obtain these features together from each layer and further enhance the feature representation. To detect targets with different scales and receptive fields, feature maps of different layers can be obtained from different layers. Therefore, we introduce a multi-scale feature extraction and integration module (MFAM module) [35] that aggregates image features at different scales. The extraction and integration of features are shown in Figure 7. First, the input data generate different scale information after the convolutional kernel layer through conv1 × 1, conv3 × 3, and conv5 × 5. Then, the different layers are concatenated by channel. This includes rich detailed localization information in the feature map. Feature maps from the same resolution are fused by channel splicing to realize the fusion of semantic and detailed information. The conv3 × 3 multiple results and conv5 × 5 are concatenated as the last input. Finally, the output splicing fusion using conv1 × 1 is concatenated to a double reduction of the characteristic channel number. Then, the output FSi of the feature fusion model is fed into the feature conduction module that has the same framework with baseline network for feature propagation. The output FCi of the features conduction module transfers to decoding for final output.
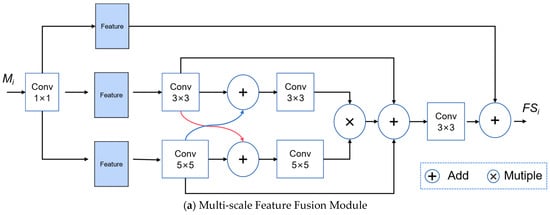

Figure 7.
The detailed architecture of multi-scale feature fusion module and features conduction module [35]. (a) is the multi-scale feature fusion module used to obtain the FSi. (b) is the feature fusion and conduction module used to obtain the FCi.
3.1.3. Deep Supervision Module
The deep supervision strategy can obtain multi-level features in the training stage of image segmentation tasks using a set of auxiliary networks. This strategy allows the trained model to localize and refine segmentation objects, enabling it to obtain the shapes and sizes of different objects.
The output features are utilized to guide the object features in the decoder for segmentation. These features are fused with multiple side-output features in the decoder, and a fused feature map is made the same size as the ground truth map via upsampling. By doing this, low-level information can be used to compensate for the information loss of small samples in deeper layers, which have stronger feature extraction capabilities for small targets.
Furthermore, we introduce multiple supervisions from both the side-output maps (i.e., ) and the ground-truth maps (i.e., ) as deep supervision information. To address the category imbalance issue, Dice loss is used, while BCE loss is employed to mitigate the uneven distribution of categories. The loss function is set up with the weighted Dice loss and weighted binary cross entropy (BCE) loss for each segmentation.
where λ is the weight, set to 0.66 in our experiment following the baseline setting. The multiple supervision loss function is as follows:
Combining the boundary loss function and stable loss functions and multiple supervision loss, the overall loss function can be defined as follows:
where denotes the final output. is the weight of the multiple supervisions loss functions, set to 0.1 in our experiment.
3.2. Experimental Setting
MangroveSeg is implemented based on the environment configuration with Python 3.10 (Open source project of Python Software Foundation) and Pytorch 1.13.1 (Pytorch open source project of The Linux Foundation). As for the hardware configuration of our experiments, we carried out the experiments on one NVIDIA GeForce RTX 3060 with 12 GB memory in ThinkStation P350 made by Lenovo, Beijing, China. The configurations are specified as follows: The image size and patch size input into the model were set as 256 × 256, the batch size was 4, the Adam optimizer was the initial learning rate of 0.0001, the decay rate of learning rate per decay step was set to 0.1, and the max epoch for training was 100.
3.3. Evaluation Criteria
The objective of mangrove segmentation is to utilize deep learning to detect individual image pixels, classifying them into either mangrove or background categories. Following the segmentation of the mangrove maps, four indexes were obtained: FP, FN, TP, and TN. TP (true positives) signifies the correctly predicted pixels in the mangrove category, while TN (true negatives) represents the correctly predicted pixels in the background category. FN (false negatives) indicates the number of pixels incorrectly identified as the background category, while FP (false positives) represents the number of pixels incorrectly identified as the mangrove category. On the basis of these four basic indicators, accuracy (ACC), mIoU (mean intersection over union), mPA (mean pixel accuracy), and Dice can be calculated.
The formulas are as below:
where P denotes prediction, G denotes ground truth, n is categories. The mIoU metric measures the accuracy of pixel-wise classification in image segmentation tasks. It compares the intersection area between the predicted segmentation mask and the ground truth mask, divided by the union area of both masks. A higher mIoU value indicates better segmentation accuracy. The mIoU is commonly used to assess the image segmentation model, allowing the user to compare and evaluate the performance of different algorithms or approaches.
The mPA metric calculates the overall accuracy of an image classification model by considering correct positive numbers and negative classifications compared to the total numbers. It is commonly used to evaluate the performance of image recognition algorithms.
In image segmentation tasks, the Dice coefficient is commonly used to assess the segmentation model performance. A higher Dice coefficient implies a better segmentation result, indicating that the algorithm successfully captured the desired object in the image. The accuracy, mPA and mIoU metrics were described by the confusion matrix of TP, TN, FP and FN. The present experiment used these three metrics to evaluate the mangrove segmentation model.
3.4. Result Analysis
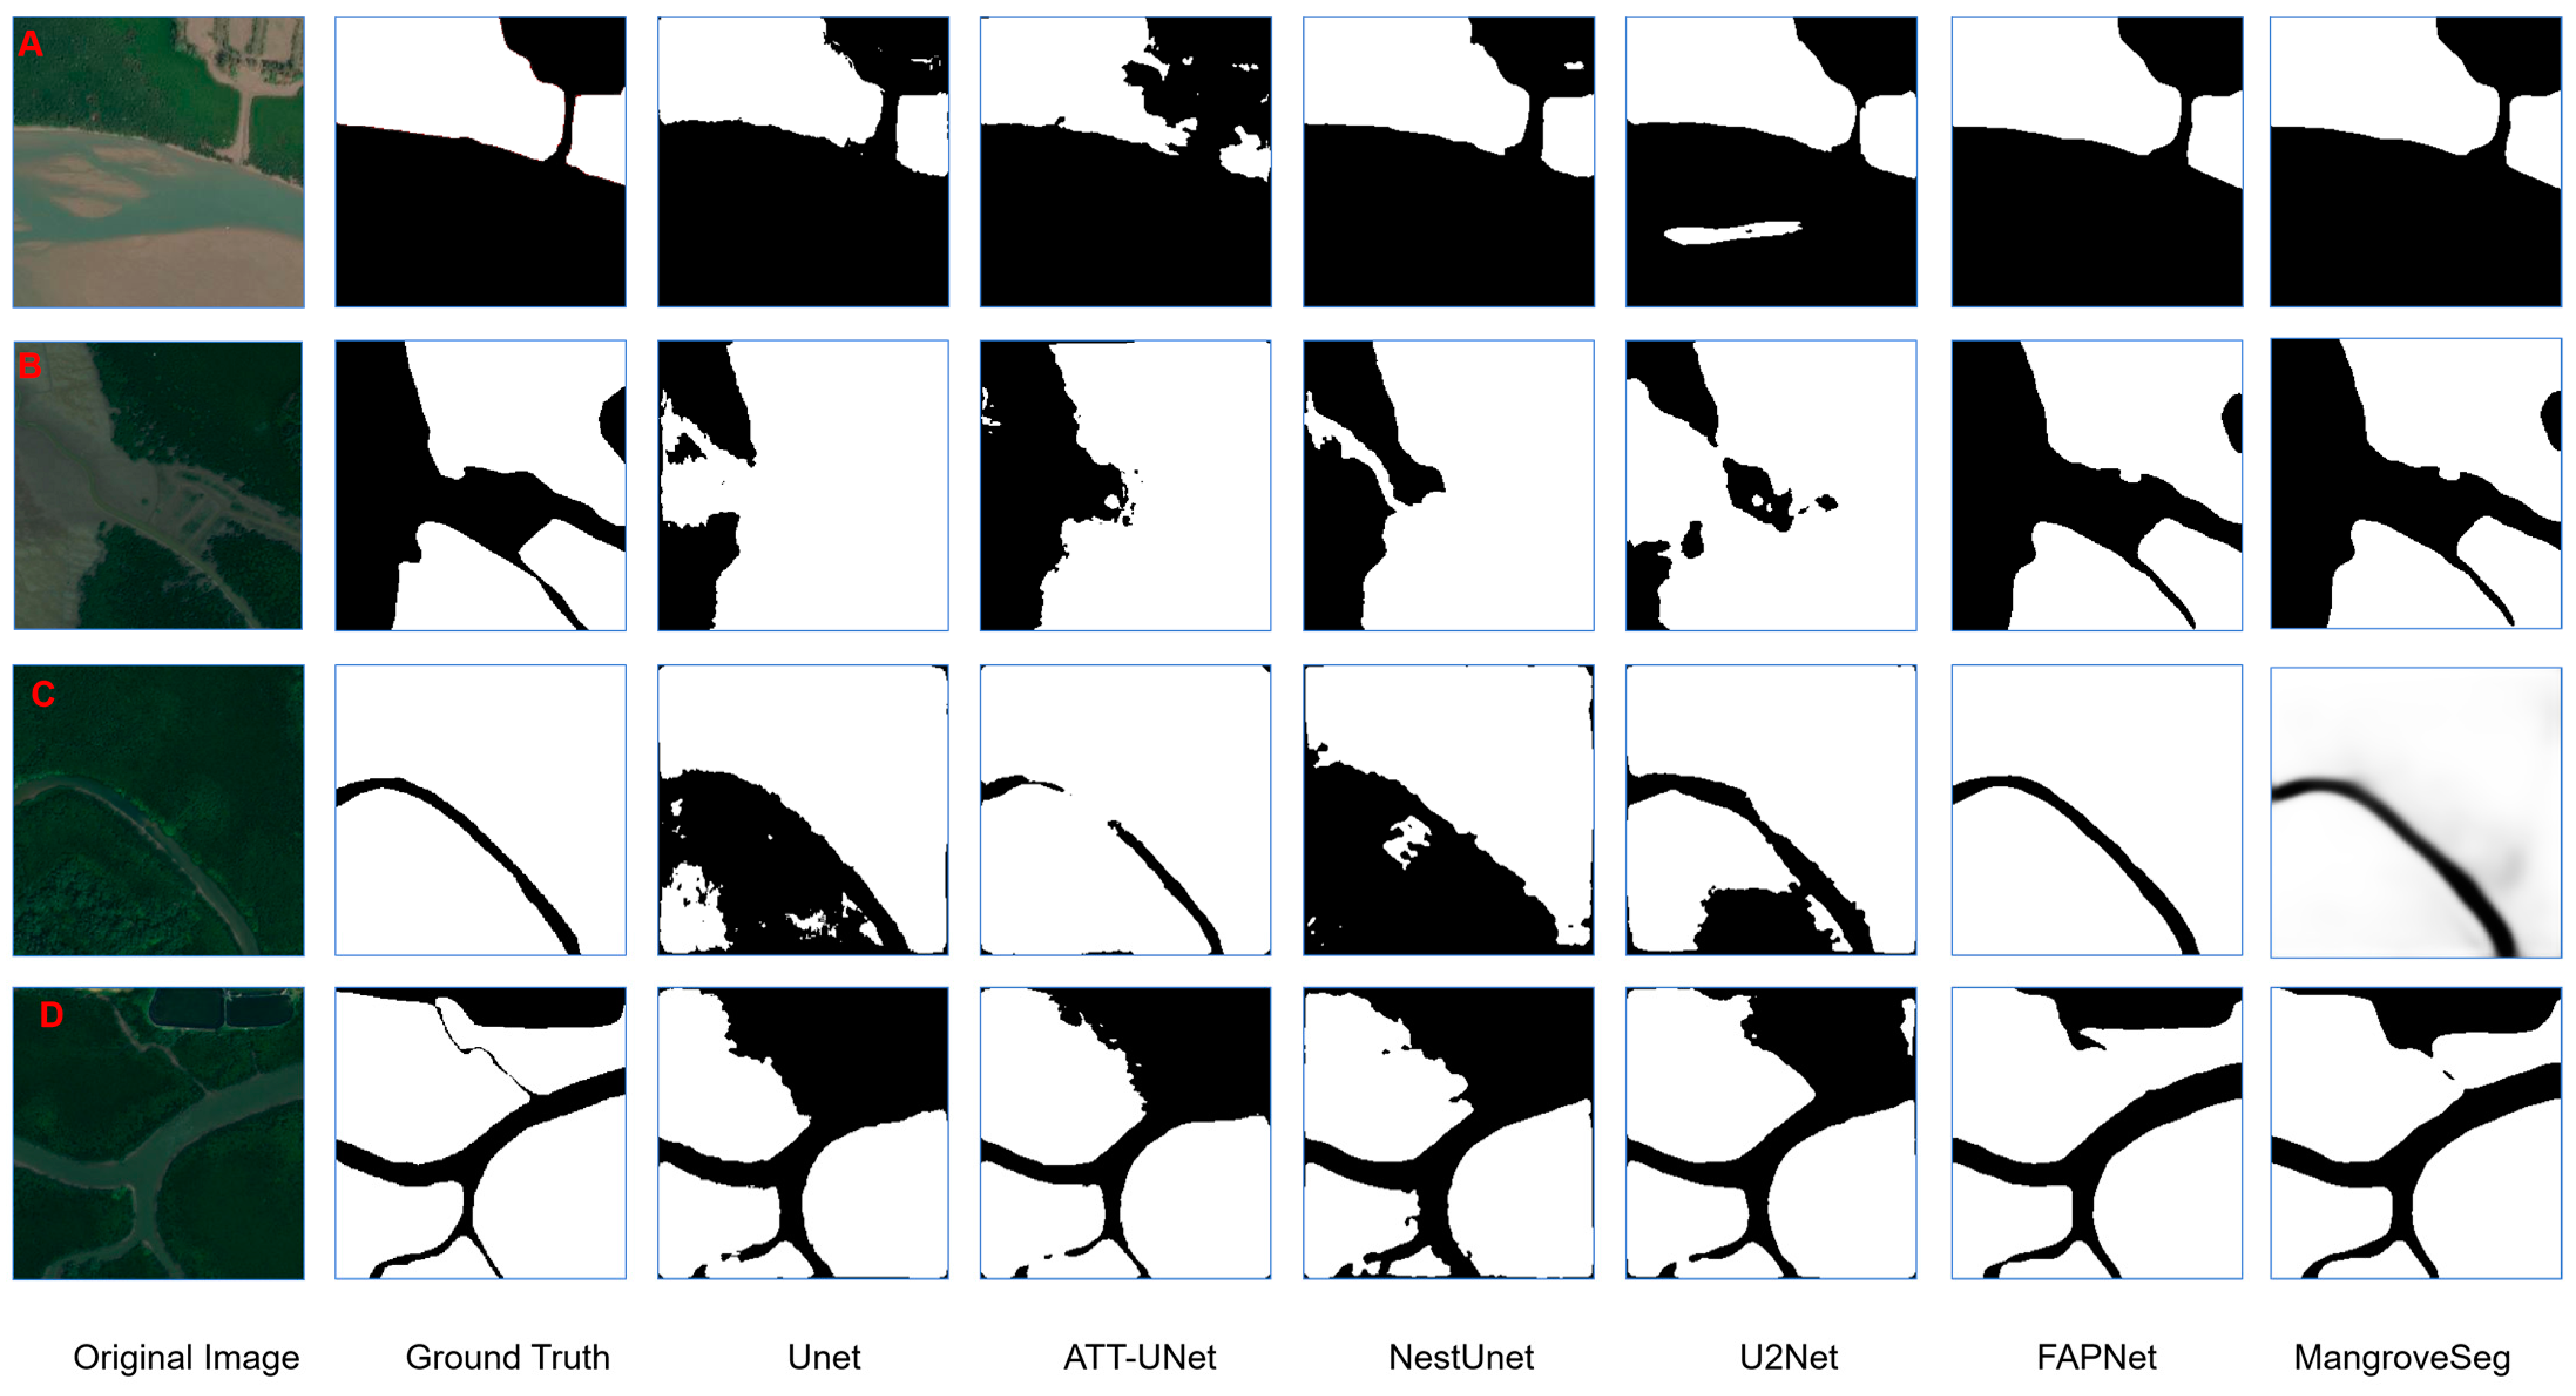
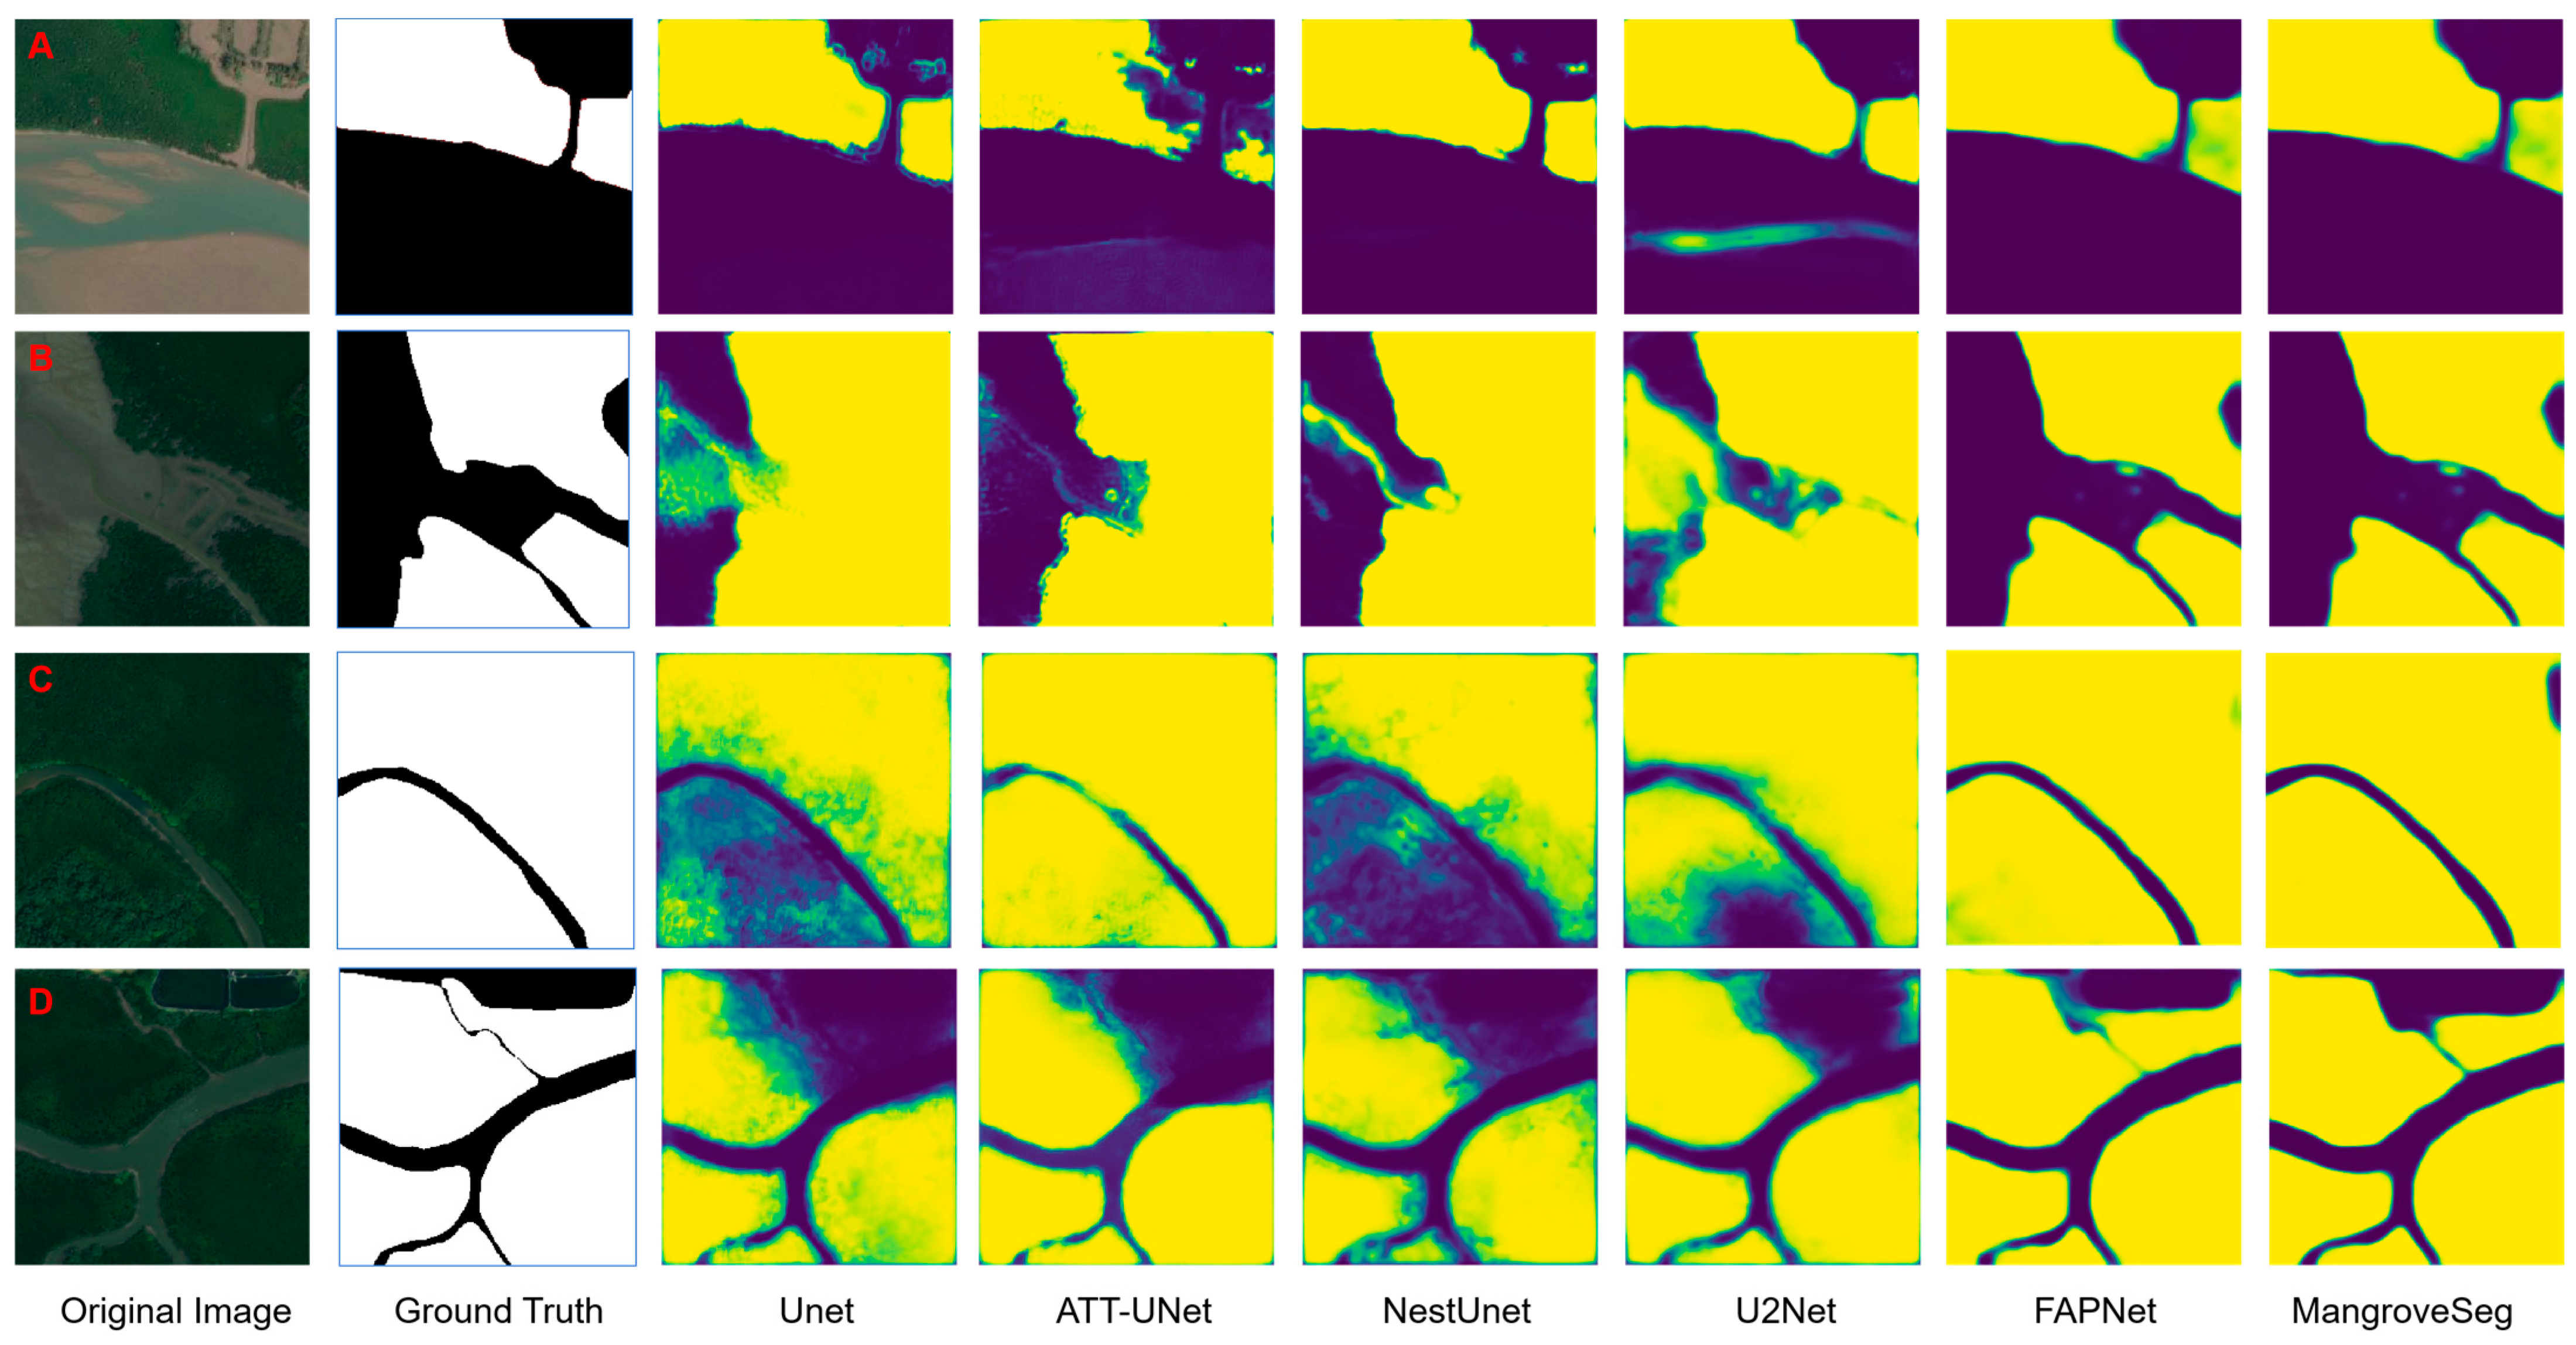
As Figure 8 shows, the partial segmentation results of the proposed method and the comparison method FAPNET [35], UNet [23], ATT-UNet [39], Unet++ [40] (also named NestUnet) and U2Net [41] on the mangrove dataset. Judging from the results, the UNet, ATT-UNet, and U2Net method basically obtain mangrove segmentation, but the detail information is not better. FAPNET, NestUnet, and MangroveSeg perform better for the details of the segmentation results in Figure 8. The feature map of different methods is shown in Figure 9. MangroveSeg and FAPNET can distinguish the texture features of different kinds of plants, and MangroveSeg can obtain clearer boundaries, especially in the fourth row of Figure 9.

Figure 8.
Visual comparison of our model and others ((A) located at 12,305,906.4 E 2,274,301.9 N; (B) located at 12,307,912.5 E 2,270,707.2 N, (C) located at 12,311,336.6 E 2,265,062.7 N; (D) located at 12,310,615.8 E 2,265,744.8 N; EPSG: 3857 coordinates).

Figure 9.
The output feature map from different methods ((A) located at 12,305,906.4 E 2,274,301.9 N; (B) located at 12,307,912.5 E 2,270,707.2 N, (C) located at 12,311,336.6E 2,265,062.7 N; (D) located at 12,310,615.8 E 2,265,744.8 N; EPSG: 3857 coordinates).
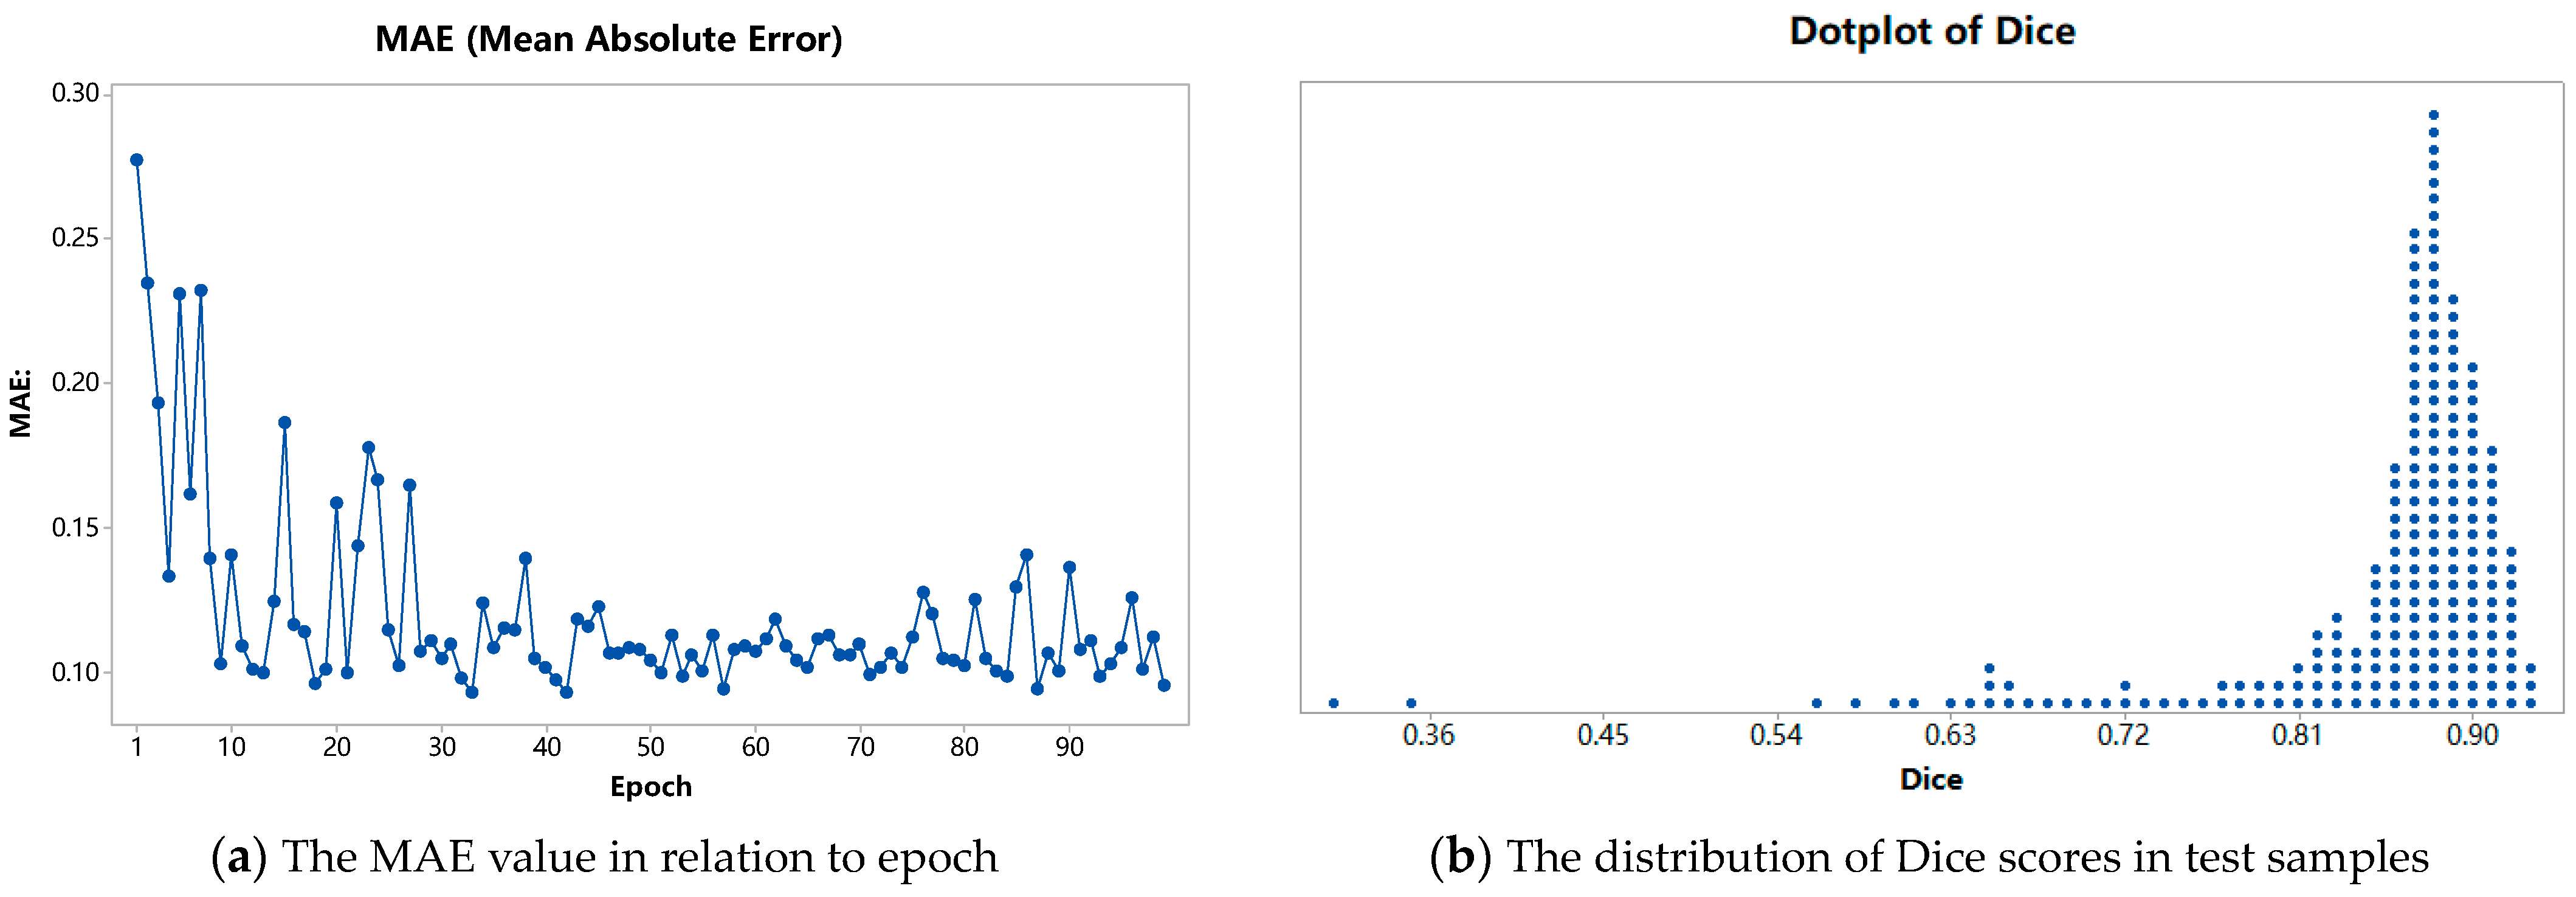
Figure 10a is the performance of the proposed method when verifying mangrove segmentation in the test dataset. The MAE (mean absolute error) of our method seesaws lower depending on Epoch number; before Epoch 40, the model MAE fluctuated greatly, and it was relatively stable between Epoch 40 and Epoch 70, with a small range of MAE fluctuations. As Figure 10b shows, most segmentation results are greater than 0.8 for the Dice score. Additionally, these models have no specific requirements for the amount of data. However, in order to ensure the robustness of the model and avoid overfitting issues, the more training data, the better.

Figure 10.
MAE of the proposed method for mangrove segmentation.
The quantitative comparison of our model with other models in four evaluation metrics is shown in Table 1 by comparing the main index parameters and the average running time of different segmentation methods. The results show that the time loss of UNet, ATT-Unet, and other image segmentation methods is shorter, and the time loss in our method is longer. The proposed method adopts the ResNet network architecture as the backbone and adds feature attention and feature fusion modules to improve the performance. Compared with the other methods, DAFNet has great advantages for performance in mIoU, mPA, and ACC. MangroveSeg improves by 22.55% mIoU, by 9.76% mPA, and by 10.23% ACC over the best model, FAPNET, in the list. It achieves considerable improvement in model performance at a small time cost.

Table 1.
Quantitative comparison of our model with other models on four evaluation metrics. The best results are highlighted in bold font.
We used the trained model to test satellite images from other regions, as shown in Figure 11, which shows the detection results for Hainan Xinying Mangrove National Wetland Park via MangroveSeg. We evaluated the statistical square measure of some mangrove areas, and the evaluation accuracy can reach 96% via MangroveSeg detection. According to the results, MangroveSeg can be used to detect mangrove areas well.

Figure 11.
The detection result for Hainan Xinying Mangrove National Wetland Park via MangroveSeg.
3.5. Ablation Study
In order to verify the performance of the network structure for the important components, such as the attention block and feature fusion block, we compared them experimentally in ablation experiments. As shown in Table 2, the comparison experiments include the FAPNET model only, the FAPNET model with the Feature Fusion Block, the FAPNET model with the Attention Block, the FAPNET model with the Attention Block and Feature Fusion Block (i.e., adding both the Attention Block and Feature Fusion module). All results come from our implementation, and the dataset is divided in the same way. The results show that the Attention Block that combines with the Feature Fusion Block can effectively improve the network performance for the prediction object.
Table 2.
The indicator parameters of different ablation experiments. The best results are highlighted in bold font.
According to the result of ablation validation on the Mangrove dataset as shown in Table 2, the model with the Feature Fusion Block module alone added to the original ResNet backbone network structure can improve performance by 11% mIoU. Similarly, adding the Attention Block module alone increases the performance by 6.5% mIoU compared to the original structure. Combining both modules results in a performance improvement of 22.5% mIoU. These results suggest that the feature fusion module, with its multi-scale and multi-level feature aggregation, significantly contributes to image segmentation. Additionally, the Attention Block module effectively helps the network focus on specified target regions. The interactions between these two modules in the network structure are also positive and beneficial.
4. Discussion
This article’s main goal is to achieve the accurate analysis of changes in mangrove via the proposed detection method. This paper proposes a MangroveSeg network for mangrove detection. Experiments and an analysis show that the MangroveSeg model is superior to most methods in terms of mIoU, mPA, ACC and recall. Additionally, a novel learning-based mangrove detection model is proposed to update the baselines over multi-year, (2015–2019) to 2023, periods for change detecting. The proposed model can automatically and accurately detect the distribution and area of mangroves from satellite remote sensing images, which provides a way of achieving a mangrove monitoring gateway for application at the global scale.
4.1. Advances for Alleviating Challenging Issues
Due to complex regional structures, great similarity between mangroves and the surrounding environment, and the diversity of mangroves, mangrove detection and segmentation still are challenging. To address this issue, this paper proposes a novel MangroveSeg network based on FAPNet [35], which has outstanding performance in the detection of camouflage targets. The MangroveSeg network is built by a U-shaped structure with ResNet combining an attention mechanism and multi-scale feature extraction framework to obtain salient feature aggregation. We also considered the detection and segmentation of mangroves as a camouflage detection problem to determine more information from extracted feature maps in a hidden layer, and a deep supervision model is introduced in downsampling for enhancing feature representation. The advantages of the proposed method for alleviating challenging issues can be summarized as follows.
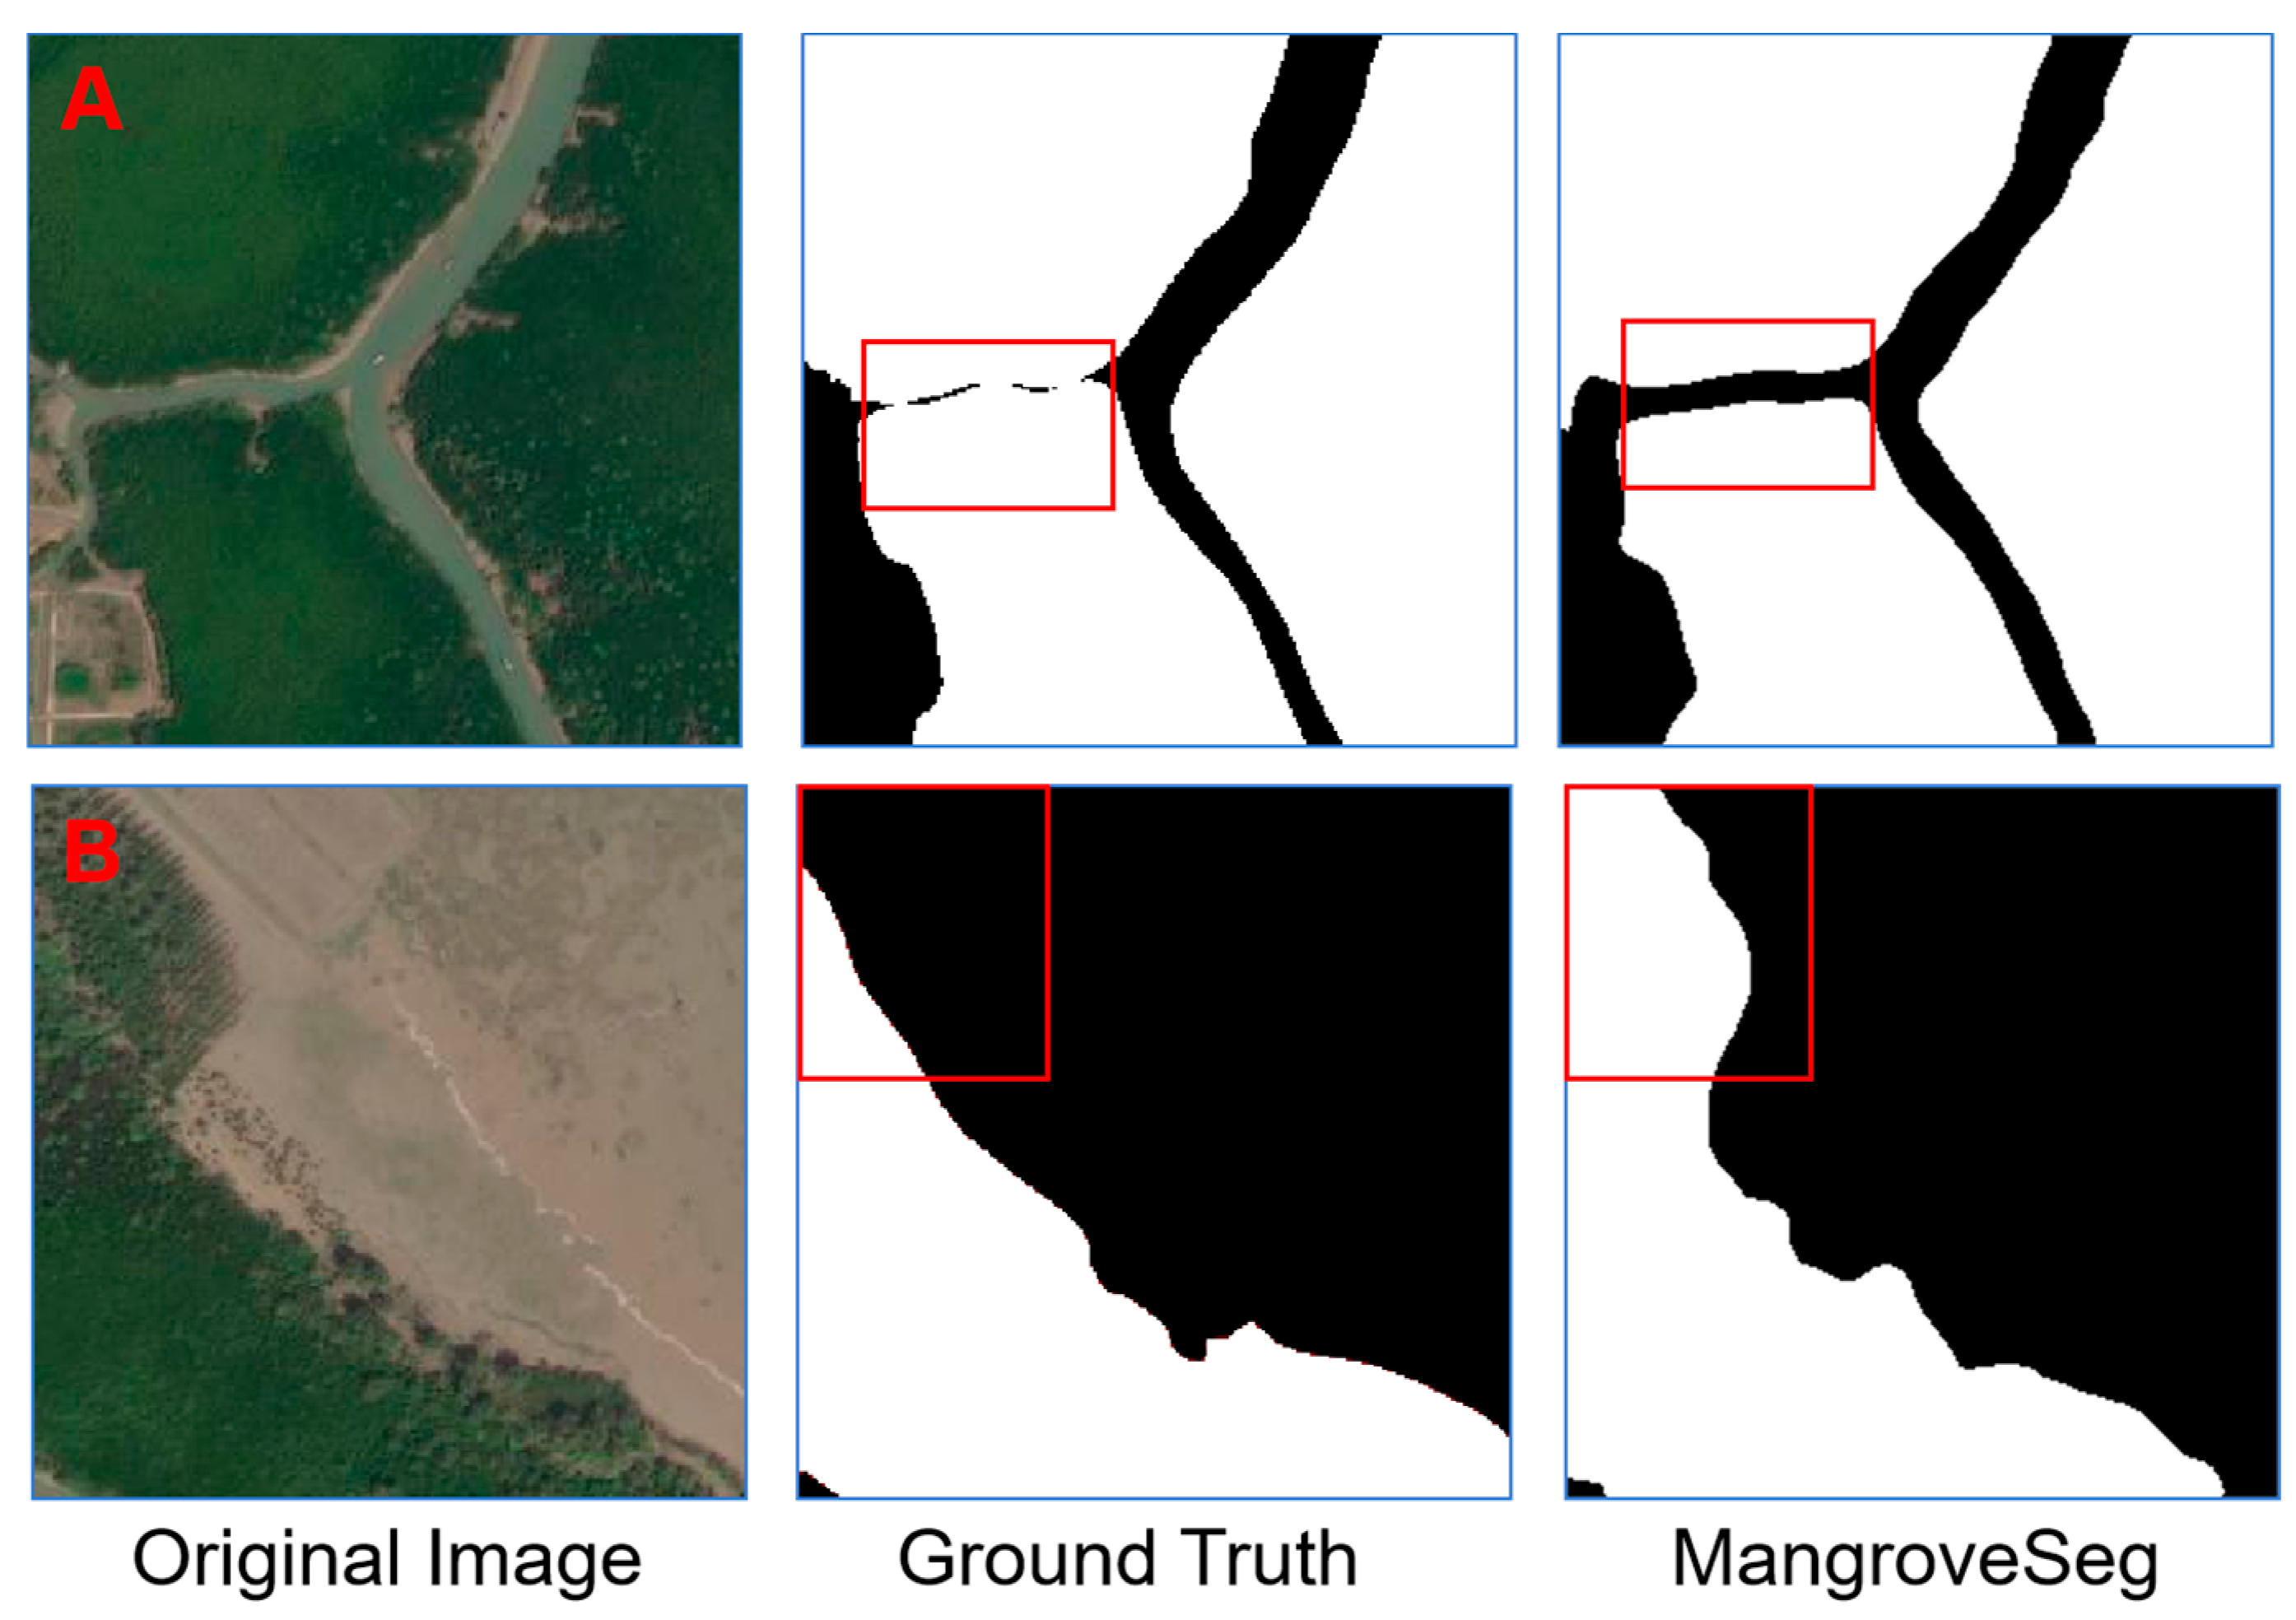
- This method improves the feature representation and contrast between mangroves and the surroundings; therefore, the deep supervision model enables more accurate segmentation. Figure 12 shows the testing results via MangroveSeg, in which it can be observed that the unannotated mangroves in the annotated ground truth were detected in the test result. The area marked in red demonstrates that the proposed MangroveSeg network can effectively detect camouflaged mangrove areas from the complex surrounding environment.
 Figure 12. Visual results via MangroveSeg ((A) located at 12,305,584.7 E 2,271,558.7 N; (B) located at 12,311,406.3 E 2,266,060.5 N; EPSG: 3857 coordinates; Highlight difference in the red box).
 - The proposed MangroveSeg network can be directly used for change detection in mangrove forests of certain areas during a specific period of time when the way of obtaining regional data is the same as that for the training data. It can be retrained as needed to adapt to data with different characteristics, which make change detection unrestricted by using existing software.
4.2. Limitations
A MangroveSeg network based on FAPNet [31] to obtain a mangrove segmentation model using 3002 training images achieved 89.58% overall accuracy, 89.02% precision, and 80.7% mIoU for the testing data. Although the trained mangrove segmentation model can automatically and accurately detect the distribution and area of mangroves from satellite remote sensing images, there are still some limitations in application.
- The mangrove detection performance is greatly affected by data heterogeneity caused by the phenology of this type of forest. When collecting data from detection areas, the performance of the model cannot be guaranteed where there are significant differences in weather, season, and other phenological conditions. How to improve the generalization ability of methods is a direction that needs to be continuously developed.
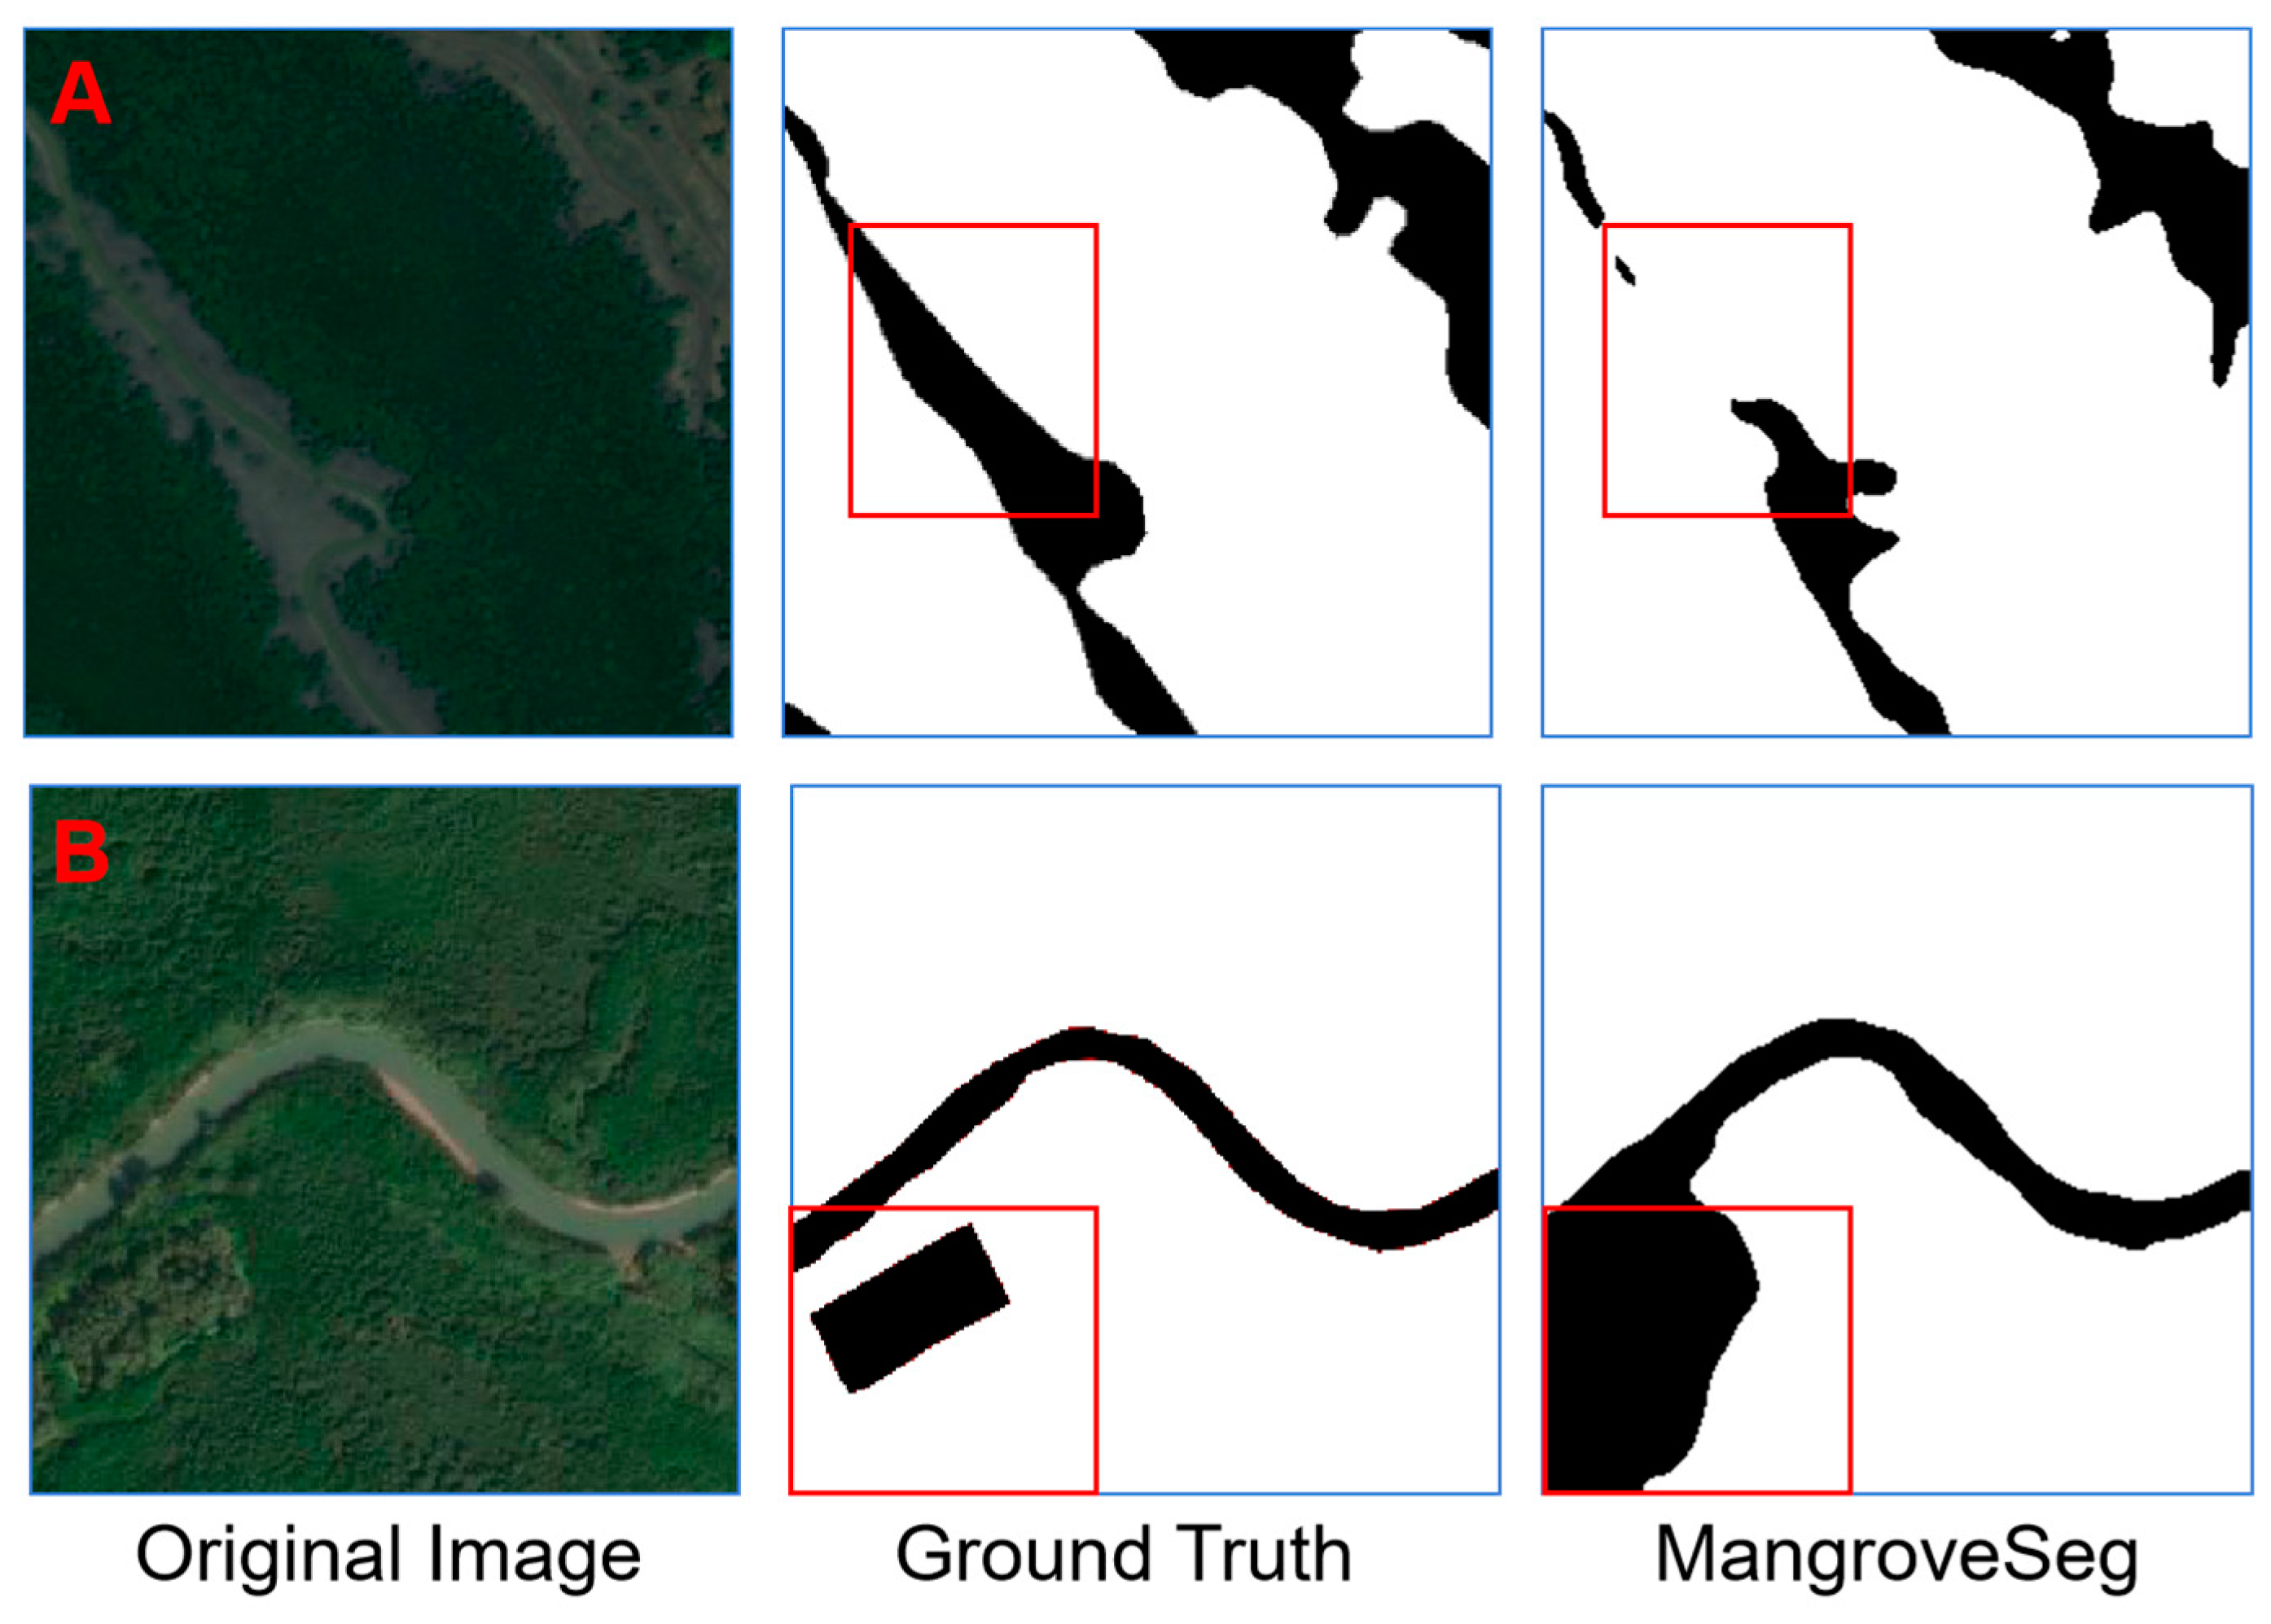
- When the terrain structure of the surface is complex and there are significant differences in surface information, false detections may occur as shown in Figure 13 and marked in red. Due to factors such as shadows and terrain, the texture information in satellite images is complex, resulting in inaccurate mangrove detection.
 Figure 13. Visual results via MangroveSeg ((A) located at 12,307,792.6 E 2,270,391.5 N; (B) located at 12,311,716.8 E 2,263,600.1 N; EPSG: 3857 coordinates; Highlight difference in the red box).
 - The MangroveSeg network runs on the Python development platform, which is inconvenient for users, and it can be developed on a web platform for users to approach conveniently.
- The MangroveSeg network only uses RGB images of visible light and does not fully utilize multi-band data. In the future, we can explore the fusion of multi-band and multi-scale data to further improve network performance.
5. Conclusions
We propose a new mangrove segmentation network, MangroveSeg, which is based on a U-shaped structure with ResNet combining an attention mechanism and multi-scale feature extraction framework to obtain salient feature aggregation. We introduce a deep supervision model in downsampling for enhancing feature representation to determine the quality of hidden layer feature maps. The spatial attention mechanism with attention gates is utilized to highlight important image areas and suppress task-irrelevant feature responses. The feature fusion module aims to obtain multi-scale information by combining each layer with semantic information and further obtain feature maps with sufficient details and receptive fields. We considered the detection and segmentation of mangroves as a camouflage detection problem to determine more information from extracted feature maps in the hidden layer, and this method can effectively detect camouflaged mangrove areas from the complex surrounding environment. The proposed MangroveSeg network can be directly used for detecting changes in mangrove forests in certain areas during a specific period of time when the method of obtaining regional data is the same as that of obtaining training data. We validated the proposed MangroveSeg network on some mangrove remote sensing datasets. The experimental results demonstrate that the proposed method has robustness and effectiveness in mangrove detection and segmentation.
Therefore, the main contribution was the proposed methodology MangroveSeg for mangrove detection and segmentation using satellite remote sensing imagery. MangroveSeg can be directly used for detecting changes in mangrove forests in certain areas during a specific period of time when the method of obtaining regional data is the same as that of obtaining training data. However, there are still some issues, for which we propose the following improvement methods to obtain more accurate change detection for the continuous monitoring of mangroves: (1) Multispectral images and LiDAR imagery can provide more information to help identify and distinguish the surface of the Earth in terms of semantics. (2) Smaller stride values for large images and multiscale images can achieve better results, with high resolution providing richer texture information. (3) The generalized model [42,43] for data heterogeneity issues can alleviate the false detection caused by phenology and other factors.
Author Contributions
Conceptualization, L.W. and R.C.; methodology, L.W.; software, H.D.; validation, L.W., H.D. and R.C.; formal analysis, H.D.; investigation, H.D.; resources, H.D.; data curation, Y.G.; writing—original draft preparation, H.D.; writing—review and editing, L.W. and R.C.; visualization, H.D.; supervision, L.W. and R.C.; project administration, L.W. and R.C.; funding acquisition, R.C. All authors have read and agreed to the published version of the manuscript.
Funding
This research was funded by the Natural Science Foundation of Fujian Province (Grant No. 2022H6006), Fujian Agriculture and Forestry University Innovation Fund Project (Grant No. KFb22095XA) and in part by the Fund of Cloud Computing and Big Data for Smart Agriculture (Grant No. 117-612014063). The APC was funded by the Natural Science Foundation of Fujian Province.
Data Availability Statement
All data generated or presented in this study are available upon request from the corresponding author. Furthermore, the models and code used during the study cannot be shared at this time as the data also form part of an ongoing study.
Conflicts of Interest
The authors declare no conflicts of interest.
References
- Jia, M.; Wang, Z.; Li, L.; Song, K.; Ren, C.; Liu, B.; Mao, D. Mapping China’s mangroves based on an object-oriented classification of Landsat imagery. Wetlands 2014, 34, 277–283. [Google Scholar] [CrossRef]
- Su, J.; Gasparatos, A. Perceptions about mangrove restoration and ecosystem services to inform ecosystem-based restoration in Large Xiamen Bay, China. Landsc. Urban Plan. 2023, 235, 104763. [Google Scholar] [CrossRef]
- Künzer, C.; Bluemel, A.; Gebhardt, S.; Quoc, T.V.; Dech, S. Remote Sensing of Mangrove Ecosystems: A Review. Remote Sens. 2011, 3, 878–928. [Google Scholar] [CrossRef]
- Pham, T.D.; Yokoya, N.; Bui, D.T.; Yoshino, K.; Friess, D.A. Remote Sensing Approaches for Monitoring Mangrove Species, Structure, and Biomass: Opportunities and Challenges. Remote Sens. 2019, 11, 230. [Google Scholar] [CrossRef]
- Zhang, Z.; Ahmed, M.R.; Zhang, Q.; Li, Y.; Li, Y.F. Monitoring of 35-Year Mangrove Wetland Change Dynamics and Agents in the Sundarbans Using Temporal Consistency Checking. Remote Sens. 2023, 15, 18. [Google Scholar] [CrossRef]
- Qiu, F.; Pu, W.; Zou, Y.; Zhong, F. Finer Resolution Estimation and Mapping of Mangrove Biomass Using UAV LiDAR and WorldView-2 Data. Forests 2019, 10, 871. [Google Scholar] [CrossRef]
- Aljahdali, M.O.; Munawar, S.; Khan, W.R. Monitoring Mangrove Forest Degradation and Regeneration: Landsat Time Series Analysis of Moisture and Vegetation Indices at Rabigh Lagoon, Red Sea. Forests 2021, 12, 52. [Google Scholar] [CrossRef]
- Hagger, V.; Worthington, T.A.; Lovelock, C.E.; Adame, M.F.; Amano, T.; Brown, B.M.; Friess, D.A.; Landis, E.; Mumby, P.J.; Morrison, T.H.; et al. Drivers of global mangrove loss and gain in social-ecological systems. Nat. Commun. 2022, 13, 6373. [Google Scholar] [CrossRef]
- Basáez-Muoz, A.d.J.; Jordán-Garza, A.G.; Serrano, A. Forest Structure and Projections of Avicennia germinans (L.) L. at Three Levels of Perturbation in a Southwestern Gulf of Mexico Mangrove. Forests 2021, 12, 989. [Google Scholar] [CrossRef]
- Longépée, E.; Abdallah, A.A.; Jeanson, M.; Golléty, C. Local Ecological Knowledge on Mangroves in Mayotte Island (Indian Ocean) and Influencing Factors. Forests 2021, 12, 53. [Google Scholar] [CrossRef]
- Anh, D.T.N.; Tran, H.D.; Ashley, M.; Nguyen, A.T. Monitoring landscape fragmentation and aboveground biomass estimation in Can Gio Mangrove Biosphere Reserve over the past 20 years. Ecol. Inform. 2022, 70, 101743. [Google Scholar] [CrossRef]
- Pettorelli, N.; Nagendra, H.; Rocchini, D.; Rowcliffe, M.; Williams, R.; Ahumada, J.; Angelo, C.D.D.; Atzberger, C.; Boyd, D.; Buchanan, G. Remote Sensing in Ecology and Conservation: Three years on. Remote Sens. Ecol. Conserv. 2017, 3, 53–56. [Google Scholar] [CrossRef]
- Valderrama-Landeros, L.; Flores-De-Santiago, F.; Kovacs, J.M.; Flores-Verdugo, F. An assessment of commonly employed satellite-based remote sensors for mapping mangrove species in Mexico using an NDVI-based classification scheme. Environ. Monit. Assess. 2018, 190, 23. [Google Scholar] [CrossRef]
- Baloloy, A.B.; Blanco, A.C.; Ana, R.R.C.S.; Nadaoka, K. Development and application of a new mangrove vegetation index (MVI) for rapid and accurate mangrove mapping. ISPRS J. Photogramm. Remote Sens. 2020, 166, 95–117. [Google Scholar] [CrossRef]
- Liu, M.; Zhang, H.; Lin, G.; Lin, H.; Tang, D. Zonation and Directional Dynamics of Mangrove Forests Derived from Time-Series Satellite Imagery in Mai Po, Hong Kong. Sustainability 2018, 10, 1913. [Google Scholar] [CrossRef]
- Wang, D.; Wan, B.; Qiu, P.; Zuo, Z.; Wu, X. Mapping Height and Aboveground Biomass of Mangrove Forests on Hainan Island Using UAV-LiDAR Sampling. Remote Sens. 2019, 11, 2156. [Google Scholar] [CrossRef]
- Maurya, K.; Mahajan, S.; Chaube, N.R. Remote sensing techniques: Mapping and monitoring of mangrove ecosystem—A review. Complex Intell. Syst. 2021, 7, 2797–2818. [Google Scholar] [CrossRef]
- Taureau, F.; Robin, M.; Proisy, C.; Fromard, F.; Imbert, D.; Debaine, F. Mapping the Mangrove Forest Canopy Using Spectral Unmixing of Very High Spatial Resolution Satellite Images. Remote Sens. 2019, 11, 17. [Google Scholar] [CrossRef]
- Nagarajan, P.; Rajendran, L.; Pillai, N.D.; Lakshmanan, G. Comparison of machine learning algorithms for mangrove species identification in Malad creek, Mumbai using WorldView-2 and Google Earth images. J. Coast. Conserv. 2022, 26, 1–13. [Google Scholar] [CrossRef]
- Pourshamsi, M.; Xia, J.; Yokoya, N.; Garcia, M.; Lavalle, M.; Pottier, E.; Balzter, H. Tropical forest canopy height estimation from combined polarimetric SAR and LiDAR using machine-learning. ISPRS J. Photogramm. Remote Sens. 2021, 172, 79–94. [Google Scholar] [CrossRef]
- Wang, J.; Chen, X.; Cao, L.; An, F.; Chen, B.; Xue, L.; Yun, T. Individual Rubber Tree Segmentation Based on Ground-Based LiDAR Data and Faster R-CNN of Deep Learning. Forests 2019, 10, 793. [Google Scholar] [CrossRef]
- Lassalle, G.; Ferreira, M.P.; La Rosa, L.E.C.; de Souza Filho, C.R. Deep learning-based individual tree crown delineation in mangrove forests using very-high-resolution satellite imagery. ISPRS J. Photogramm. Remote Sens. 2022, 189, 220–235. [Google Scholar] [CrossRef]
- Ronneberger, O.; Fischer, P.; Brox, T. U-net: Convolutional networks for biomedical image segmentation. In Proceedings of the International Conference on Medical Image Computing and Computer-Assisted Intervention, Munich, Germany, 5–9 October 2015; pp. 234–241. [Google Scholar]
- Simonyan, K.; Zisserman, A. Very Deep Convolutional Networks for Large-Scale Image Recognition. arXiv 2014, arXiv:1409.1556. [Google Scholar] [CrossRef]
- He, K.; Zhang, X.; Ren, S.; Sun, J. Deep Residual Learning for Image Recognition. In Proceedings of the 2016 IEEE Conference on Computer Vision and Pattern Recognition (CVPR), Las Vegas, NV, USA, 27–30 June 2016; pp. 770–778. [Google Scholar]
- Li, H.; Hu, B.; Li, Q.; Jing, L. CNN-Based Individual Tree Species Classification Using High-Resolution Satellite Imagery and Airborne LiDAR Data. Forests 2021, 12, 1697. [Google Scholar] [CrossRef]
- Soni, A.; Koner, R.; Villuri, V.G.K. M-UNet: Modified U-Net Segmentation Framework with Satellite Imagery. In Proceedings of the Global AI Congress 2019, Singapore, 3 April 2020; pp. 47–59. [Google Scholar]
- Xu, C.; Wang, J.; Sang, Y.; Li, K.; Liu, J.; Yang, G. An Effective Deep Learning Model for Monitoring Mangroves: A Case Study of the Indus Delta. Remote Sens. 2023, 15, 2220. [Google Scholar] [CrossRef]
- Guo, M.; Yu, Z.; Xu, Y.; Huang, Y.; Li, C. ME-Net: A Deep Convolutional Neural Network for Extracting Mangrove Using Sentinel-2A Data. Remote Sens. 2021, 13, 1292. [Google Scholar] [CrossRef]
- Lomeo, D.; Singh, M. Cloud-Based Monitoring and Evaluation of the Spatial-Temporal Distribution of Southeast Asia’s Mangroves Using Deep Learning. Remote Sens. 2022, 14, 2291. [Google Scholar] [CrossRef]
- Irem Ulku, E.A.; Ghamisi, P. Deep Semantic Segmentation of Trees Using Multispectral Images. IEEE J. Sel. Top. Appl. Earth Obs. Remote Sens. 2022, 15, 7589–7604. [Google Scholar] [CrossRef]
- Sinha, A.; Dolz, J. Multi-Scale Self-Guided Attention for Medical Image Segmentation. IEEE J. Biomed. Health Inform. 2021, 25, 121–130. [Google Scholar] [CrossRef]
- Li, H.; Li, H.; Peng, X.; Peng, X.; Zeng, J.; Zeng, J.; Xiao, J.; Xiao, J.; Nie, D.; Nie, D. Explainable attention guided adversarial deep network for 3D radiotherapy dose distribution prediction. Knowl.-Based Syst. 2022, 241, 108324. [Google Scholar] [CrossRef]
- Vardanjani, S.M.; Fathi, A.; Moradkhani, K. Grsnet: Gated residual supervision network for pixel-wise building segmentation in remote sensing imagery. Int. J. Remote Sens. 2022, 43, 4872–4887. [Google Scholar] [CrossRef]
- Zhou, T.; Zhou, Y.; Gong, C.; Yang, J.; Zhang, Y. Feature Aggregation and Propagation Network for Camouflaged Object Detection. IEEE Trans. Image Process. 2022, 31, 7036–7047. [Google Scholar] [CrossRef] [PubMed]
- Bunting, P.; Rosenqvist, A.; Hilarides, L.; Lucas, R.M.; Thomas, N.; Tadono, T.; Worthington, T.A.; Spalding, M.; Murray, N.J.; Rebelo, L.-M. Global Mangrove Extent Change 1996-2020: Global Mangrove Watch Version 3.0. Remote Sens. 2022, 14, 3657. [Google Scholar] [CrossRef]
- China National Platform for Common Geospatial Information Service. Available online: https://www.tianditu.gov.cn/ (accessed on 8 February 2023).
- Liao, J.; Zhu, B.; Chang, Y.; Zhang, L. A dataset of mangrove forests changes in Hainan Island based on GF-2 data during 2015–2019. Sci. Data Bank 2022, 7, 1–11. [Google Scholar] [CrossRef]
- Oktay, O.; Schlemper, J.; Folgoc, L.L.; Lee, M.; Heinrich, M.; Misawa, K.; Mori, K.; Mcdonagh, S.; Hammerla, N.Y.; Kainz, B. Attention U-Net: Learning Where to Look for the Pancreas. arXiv 2018, arXiv:1804.03999. [Google Scholar] [CrossRef]
- Zhou, Z.; Siddiquee, M.M.R.; Tajbakhsh, N.; Liang, J. UNet++: A Nested U-Net Architecture for Medical Image Segmentation. IEEE Trans. Med. Imaging 2018, 39, 1856–1867. [Google Scholar] [CrossRef]
- Qin, X.; Zhang, Z.; Huang, C.; Dehghan, M.; Jagersand, M. U2-Net: Going deeper with nested U-structure for salient object detection. Pattern Recognit. 2020, 106, 107404. [Google Scholar] [CrossRef]
- Shen, M.; Bu, Y.; Wornell, G.W. On Balancing Bias and Variance in Unsupervised Multi-Source-Free Domain Adaptation. In Proceedings of the 40th International Conference on Machine Learning, Honolulu, HI, USA, 23–29 July 2023; pp. 30976–30991. [Google Scholar]
- Zhang, X.; Xu, R.; Yu, H.; Zou, H.; Cui, P. Gradient Norm Aware Minimization Seeks First-Order Flatness and Improves Generalization. arXiv 2023, arXiv:2303.03108. [Google Scholar] [CrossRef]
Disclaimer/Publisher’s Note: The statements, opinions and data contained in all publications are solely those of the individual author(s) and contributor(s) and not of MDPI and/or the editor(s). MDPI and/or the editor(s) disclaim responsibility for any injury to people or property resulting from any ideas, methods, instructions or products referred to in the content. |
© 2024 by the authors. Licensee MDPI, Basel, Switzerland. This article is an open access article distributed under the terms and conditions of the Creative Commons Attribution (CC BY) license (https://creativecommons.org/licenses/by/4.0/).