Article

Study on the Response of Vegetation Water Use Efficiency to Drought in the Manas River Basin, Xinjiang, China

1
School of Geographical Sciences and Tourism, Xinjiang Normal University, Urumqi 830054, China
2
Xinjiang Laboratory of Lake Environment and Resources in the Arid Zone, Urumqi 830054, China
*
Author to whom correspondence should be addressed.
These authors contributed equally to this work.
Forests 2024, 15(1), 114; https://doi.org/10.3390/f15010114
Submission received: 30 November 2023 / Revised: 25 December 2023 / Accepted: 5 January 2024 / Published: 7 January 2024
(This article belongs to the Section Forest Hydrology)

Abstract

:
Ecosystem water use efficiency (WUE) is an important measure of the degree of water–hydrogen coupling and an important indicator for assessing ecosystem responses to climate change. Drought adversely affects ecosystem security, particularly in irrigated agricultural areas; therefore, understanding the relationship between WUE and drought is important. This study revealed the spatial and temporal characteristics of drought in the Manas River Basin, Xinjiang, China, from 2001 to 2020 through multi-source data using standardised anomaly indices and mutation detection. It also quantitatively analysed the hysteresis effect and resilience characteristics of drought for different vegetation types in the study area. The results showed that droughts at a severe level occurred less frequently in most of the study area on average from 2001 to 2020, and that droughts in the vegetation growing season occurred more frequently, particularly in grasslands; the frequency of droughts in woodlands was low. Furthermore, the lag in WUE to drought occurred on a 3-month scale and accounted for 64.0% of the total watershed area. Finally, 38.16% of the regional vegetation ecosystems in the Manas River Basin exhibited drought resistance. In conclusion, our results provide novel insights into the water-use strategies of plants in the study area and will help facilitate WUE optimisation.

Graphical Abstract

1. Introduction

Drought is a key factor that affects terrestrial ecosystems globally, with significant effects on global carbon and water cycles [1]. Severe droughts seriously impact human health, agricultural production, and natural ecosystems [2,3,4]. The Standardised Precipitation Evapotranspiration Index (SPEI) reflects cumulative moisture deficits at various time scales. It has been commonly used to monitor the characteristics and trends of regional droughts, and is suitable for investigating drought characteristics in the arid regions of Xinjiang [5,6]. Different SPEI timescales have yielded different results for drought studies in different regions. Monitoring drought occurrences over the past 40 years using a 3-month SPEI (SPEI3) provides an accurate representation of the response of water use efficiency (WUE) to intense seasonal droughts [7].
In-depth studies on the spatial and temporal variations in drought and their response to WUE can reveal the mechanisms between drought and the ecosystem carbon–water cycle. The response of vegetation WUE to drought varies significantly across time scales, ecosystems, vegetation types, and regions, and the effects of different degrees of drought on vegetation WUE also vary [8,9]. Some scholars have combined correlation and conjugate function analyses to quantitatively analyse the effects of drought stress on grasslands in Xinjiang from a probabilistic perspective, and have reported differences in the timing of grassland responses to drought in different climatic zones [10]. Vegetation can inhibit and self-adapt to drought, and vegetation growth is only affected after the end of water stress [11,12]. Owing to the differences in the physiological structure and growth environment of vegetation, the lag effect on the response time to drought varies across vegetation types [13,14]. Ji et al. analysed the lagged response of the global terrestrial ecosystem WUE to soil moisture drought and showed that drought has a lagged effect on the WUE of 70.87% of global vegetation [15].
Given the relative scarcity of water resources and the fragile vegetation ecosystems in arid zones, identifying strategies to improve the WUE of vegetation in arid zones while enhancing its resilience to drought remains essential. Previous studies have shown that the smaller the study area, the more accurate the analysis of WUE response to drought [16]. However, the relationship between WUE and drought under different habitat conditions in this region has not been well studied. Therefore, in this study, the Manas River Basin in Xinjiang, China, was selected as the study area, which is a typical arid zone ecosystem with complete ecosystems and diverse geomorphological types despite its small area. In this study, the vegetation WUE of the study area was calculated based on multi-source remote sensing data products from 2001 to 2020. The long-time series SPEI was calculated using precipitation and potential evapotranspiration data in the same period. The standardised anomaly index (SAI) was used to identify the drought events in the study area, and the Pearson’s correlation coefficient method was used to assess the cumulative lag effect of drought on WUE. The main objectives of this study were to (1) analyse the temporal and spatial characteristics of WUE and drought in the study area; (2) explore the temporal characteristics of the lagged response of different vegetation types to drought; and (3) evaluate the capacity of vegetation ecosystems to suppress and restore drought disturbances. These findings can help predict the response of ecosystems to drought changes in the Manas River Basin in Xinjiang, China, which can reduce the damage caused by drought disasters to food production and vegetation ecosystems in the study area.

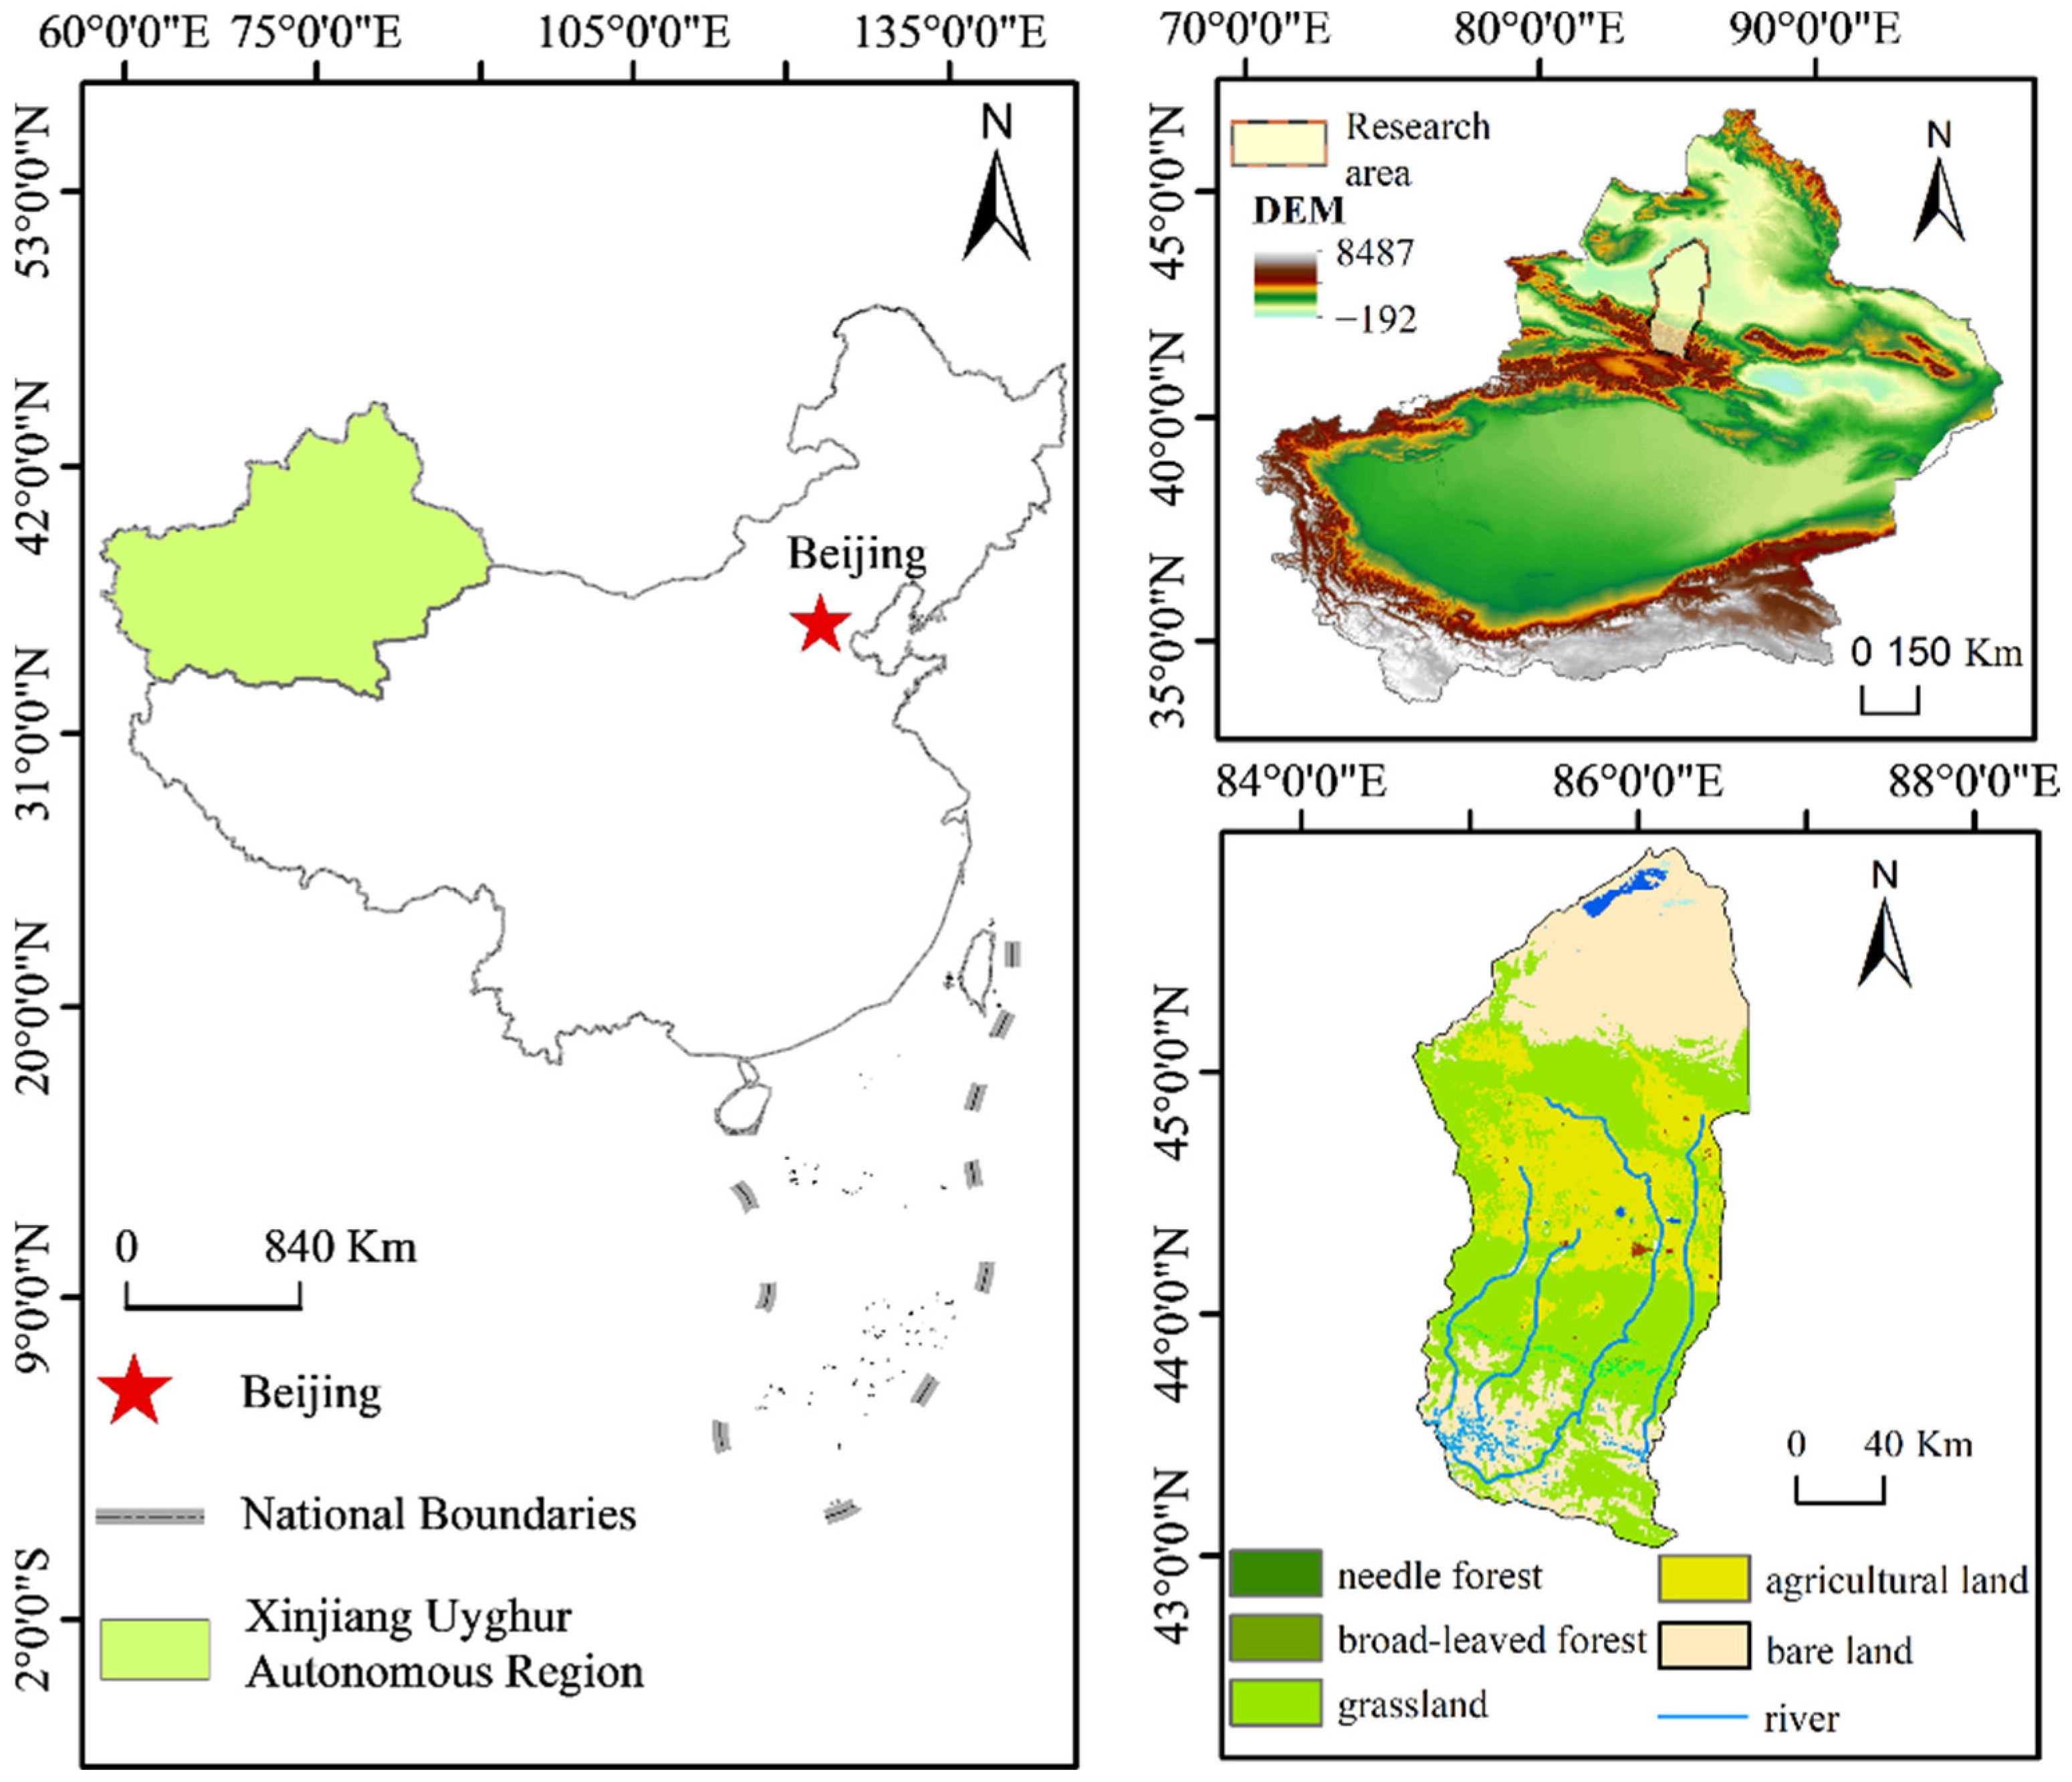
2. Overview of the Study Area

The Manas River Basin (43°04′–45°58′ N, 84°42′–86°42′ E) in Xinjiang, China, is situated on the south rim of the Junggar Basin and in the central section of the northern foothills of the Tianshan Mountains. The total area of the basin is approximately 3.40 × 10⁴ km2, making it the fourth largest irrigated agricultural area in China [17]. The geomorphology is complex, with the land being elevated in the southern region and lower in the northern region. The topography from south to north is mountainous, oasis, and desert, and the vegetation types are alpine sparse vegetation, woodland, plains steppe, crop, desert steppe, and desert. The study area is situated within the interior of an arid zone, far from the sea. The basin is arid, with little rainfall, high annual evaporation, extensive desert areas, and a typical continental arid climate zone [18]. Some studies have indicated that drought disasters occur more frequently in the Manas River Basin, with an average occurrence of one drought every 3 years [19]. Food production and ecological security in this region are constrained by drought and moisture. The frequency and severity of droughts in the study area decreased with climate change and enhanced the rational allocation and utilisation of water resources. The study area is illustrated in Figure 1.

3. Research Methodology

3.1. Data Sources and Preprocessing

The data used in this study included precipitation and potential evapotranspiration data for SPEI calculations with precipitation data from the National Earth System Science Data Centre (http://www.geodata.cn, accessed on 15 May 2023). The temporal resolution was monthly, with a spatial resolution of 1 km. Potential evapotranspiration data were obtained from MODIS products available on the NASA website (https://search.earthdata.nasa.gov, accessed on 16 May 2023) with monthly temporal and spatial resolutions of 500 m. To calculate the WUE of vegetation net primary productivity (NPP) and actual evapotranspiration (ET), data were obtained from MODIS products (https://search.earthdata.nasa.gov/, accessed on 6 June 2023) with a monthly temporal resolution and a spatial resolution of 500 m. The meteorological data were converted to the required format using MATLAB R2021b software (MathWorks, Natick, MA, USA). The gma tool based on the Pypi project (https://pypi.org/project/gma/, accessed on 16 May 2023) was used to calculate SPEI. The resulting index was then synthesised at seasonal scales using ArcGIS10.8 software (ESRI, Redlands, CA, USA), which facilitated tasks, such as projection transformation, cropping, and the elimination of outliers.

3.2. Research Methodology

3.2.1. Estimation of WUE

The monthly WUE for the study area from 2001 to 2020 was calculated by dividing the NPP by the ET for every raster and month, as follows:
WUE = NPP ET
where WUE is in g C/(mm·m2); NPP is in g C/m2; and ET is in mm.

3.2.2. SPEI Calculation and Classification

SPEI is an ideal indicator for monitoring and assessing drought [20]. The calculation procedure for SPEI involves the following steps. Initially, Dg was calculated [21]:
D g = P g P E T g
where Dg represents the total difference between monthly potential evapotranspiration and precipitation, Pg is the monthly precipitation, and PETg is the potential monthly evapotranspiration. The data series were then normalised, a generalised logistic distribution was fitted to the Dg series, and the cumulative probability densities were standardised to obtain the SPEI time-series data. SPEI values were classified into seven wet and dry classes [22] (Table 1).
SPEI encompasses multiple temporal scales. The SPEI value of the 12-month timescale can reflect the interannual occurrence of drought, whereas SPEI3 can reflect seasonal changes in dryness and wetness [23,24] and can, therefore, be used in the analysis of dry and wet trends in Xinjiang [25]. In this investigation, the SPEI values for spring, summer, autumn, and winter were determined by considering the cumulative SPEI values at 3-month timescales from March to May, June to August, September to November, and December to February of the following year. This approach was adopted to investigate spatiotemporal drought variations at the seasonal level. In addition, the cumulative SPEI values at timescales of 1, 3, 6, and 12 months were selected to analyse the effect of drought on vegetation WUE.

3.2.3. Drought Frequency

Drought frequency in the Manas River Basin, Xinjiang, China, was calculated for SPEI3 from 2001 to 2020. An SPEI value of ≤−0.5 indicates the manifestation of drought; the equation is as follows [26]:
F i = n N × 100 %
where Fi is the frequency of drought (%), n is the number of times a drought level of mild drought or higher was reached in the time series, and N is the number of time series. (The number of time series in this study is 20.)

3.2.4. Standardized Anomaly Index

The effect of drought on WUE was characterised using the standardised anomaly index (SAI) [27], as follows:
SAI FP ( n ) = FP ( n ) FP σ FP
where SAIFP(n) is the variation value of WUE for the nth year from 2001 to 2020 (n = 1, 2, 3, … 20), FP(n) is the WUE for the nth year, and FP and σ(FP) are the mean and standard deviation of WUE for the years 2001 to 2020, respectively.
The types of anomalies of WUE are as follows: normal (|SAI| ≤ 0.5), mild anomaly (0.5 < |SAI| ≤ 1), moderate anomaly (1 < |SAI| ≤ 1.5), severe anomaly (1.5 < |SAI| ≤ 2), and extreme anomaly (|SAI| > 2). The positive and negative values of SAI indicate the increase or decrease of WUE, respectively; the higher the absolute value, the more serious the anomaly.

3.2.5. Pearson’s Correlation Coefficient Method

To examine the cumulative delay caused by drought on WUE, we employed the Pearson’s correlation coefficient method to calculate the correlation coefficients between SPEI and the associated WUE variation values across four different timescales (1, 3, 6, and 12), thereby determining the SPEI timescale that correlates the strongest with the maximum correlation coefficient. The correlation coefficients passing the significance test were selected as the value of the intensity of the cumulative lag effect of drought on the impact of WUE [28,29], and the formula is as follows:
r i = corr ( SAI FP , SPEI i ) , 1 i 12
R max = max ( r i ) , 1 i 12
where i is the time scale, denoting the cumulative effect of the precipitation deficit up to month i (i = 1, 3, 6, 12), SPEIi denotes SPEI on a time scale of i months, SAIFP is the time series of monthly WUE variability values from 2001 to 2020, ri is Pearson’s correlation coefficient lagged at the i-month time scale, and Rmax is the maximum absolute value of ri.

3.2.6. Mutation Testing

Trend analyses of the SPEI and WUE anomaly indices in the study area were conducted using the Mann–Kendall (MK) trend test. In this context, a positive Z statistic signifies an upward trend, whereas a negative value suggests a downward trend. Z values exceeding 1.96 indicate that the observed change trend passed the significance test at a level of 0.05 [30].
The M–K mutation test was used to detect mutations in the time-series data. Specifically, the M–K mutation test was used to separately calculate the order columns of both the sequential and reverse-order time series. This analysis was performed based on the assumption that the time series were independently random; the forward Mann–Kendall test (UF) and backward Mann–Kendall test (UB) statistics were subsequently obtained. UF or UB values > 0 indicate that the data in the time series have an upward trend, whereas values < 0 indicate downward trends. The onset of the mutation was determined at the intersection of the UF and UB curves, with the intersection point falling between the critical lines. The following equations were used [31]:
s g n ( x j x i ) = 1 , x j x i > 0 0 , x j x i = 0 1 , x j x i < 0
S = i = 1 n 1 j = i + 1 n sgn ( x j x i )
VAR ( S ) = n ( n 1 ) ( 2 n + 5 ) i = 1 m t i t i 1 2 t i + 5 / 19
Z = S 1 V A R ( S ) , S > 0 0 , S = 0 S + 1 V A R ( S ) , s < 0
where n is the number of the time series, m the number of repetitive data points in the time series, and ti the number of repetitive data points in the i-th group.

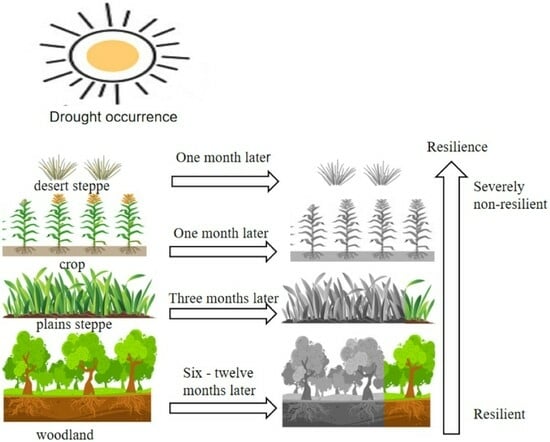
3.2.7. Resilience Analysis

Ecosystem resilience is the ability of an ecosystem to resist external disturbances (e.g., drought) and maintain its structure and function [32,33,34]. A previously defined index (Rd) was used [34]. The resilience of the Manas River Basin ecosystem to drought was quantified on an image-by-image metric basis, using the following equation:
R d = WUE d WUE m
where Rd is the ecosystem resilience index, WUEd is the WUE during a drought year, and WUEm is the mean annual WUE.
The values of Rd can be classified into four categories, as follows [34]: if Rd ≥ 1, the grid cell is considered resilient; if 0.9 < Rd < 1, the ecosystem is considered slightly inelastic; if Rd is between 0.8 and 0.9, the ecosystem is considered moderately inelastic; and if Rd < 0.8, the ecosystem is considered severely inelastic.

4. Results and Analyses

4.1. Characteristics of Spatial and Temporal Distributions of WUE

4.1.1. Temporal Distribution Characteristics of WUE

The temporal distribution of WUE in the study area was characterised using SAI. The changes in the SAI of WUE in the Manas River Basin, Xinjiang, China, showed minor fluctuations from 2001 to 2020 (Figure 2); however, they were relatively stable overall, although a drought year appeared every two years. The average value of the SAI of WUE was 1 < |SAI| ≤ 1.5 for the six years 2003, 2006, 2009, 2012, 2015, and 2018, which were typical drought moderate anomaly years (1 < |SAI| ≤ 1.5), and the mean value of SAI of WUE was −1.25. The drought severities in 2003, 2009, and 2012 were similar, and the mean value of SAI for their WUE was below −1.3. Compared with the above six drought-moderate-anomaly years, the mean value of SAI of WUE for the other 14 years was −0.24. The MK test of the SAI of WUE showed that the UF and UB curves intersected in 2003, 2004, 2005, and 2019, indicating that these were the years when the temporal trend of the SAI of WUE in the basin suddenly changed. Among them, the UF curve was >0 in 2001, 2004, 2005, and 2008, indicating that the SAI of WUE had an increasing trend; that is, WUE was in an abnormal situation. In the remaining years, the values, especially the UF value, were <0 in the period from 2009 to 2020, which indicates that the SAI of the WUE of the Manas River Basin showed a continuous decreasing trend during this period; that is, WUE was normal.

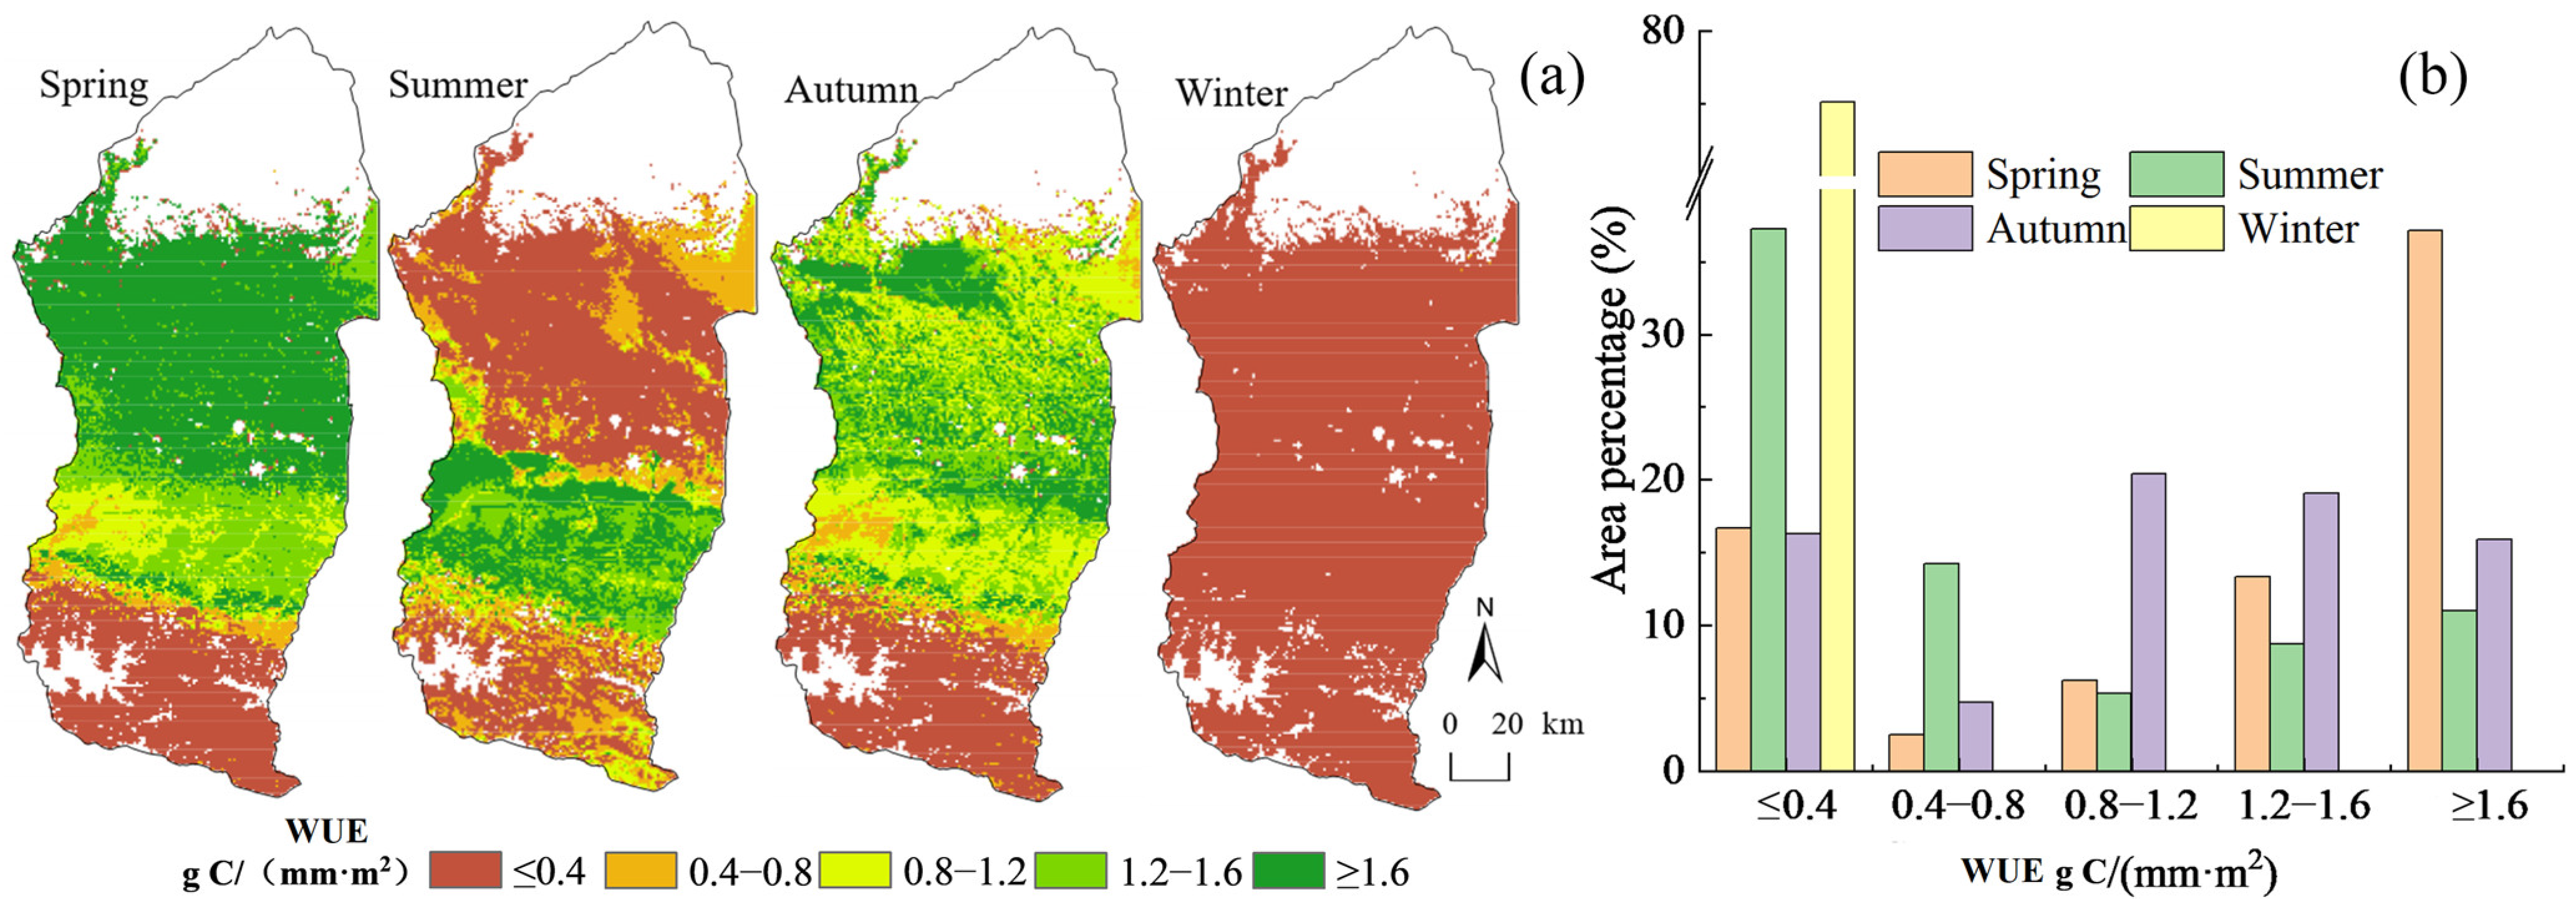
4.1.2. Spatial Distribution Characteristics of WUE

The mean values of vegetation WUE for different seasons in the study area from 2001 to 2020 showed significant spatial variability (Figure 3a), where the mean values of WUE during spring, summer, autumn, and winter were 1.38 g C/(mm·m2), 0.64 g C/(mm·m2), 1.16 g C/(mm·m2), and 0.04 g C/(mm·m2), respectively. Figure 1 and Figure 3 show that the WUE of grassland and woodland in the central and northern plains of the study area was higher in spring, of which those with a WUE > 1.6 g C/(mm·m2) accounted for approximately 37.17% of the total region. In summer, the WUE of grassland in the plains was the highest, with a WUE > 1.2 g C/(mm·m2) accounting for approximately 19.78% of the total area, followed by alpine sparse vegetation and desert grassland. In autumn, the spatial distribution of vegetation WUE in the study area showed a medium–high value, and the area with a WUE > 0.8 g C/(mm·m2) accounted for approximately 55.38% of the total area; in winter, WUE in the study area was generally at a low value.
Combined with the vegetation types, the highest WUE value of spring crops in the study area was 0.2 g C/(mm·m2), followed by coniferous forests at 0.16 g C/(mm·m2), while the average value of spring WUE for both broad-leaved forests and grasslands was 0.14 g C/(mm·m2); the average values of WUE of different vegetation types in summer, from largest to smallest, were for coniferous forests, broad-leaved forests, grasslands, and crops. The values were 0.17 g C/(mm·m2), 0.13 g C/(mm·m2), 0.08 g C/(mm·m2), and 0.01 g C/(mm·m2), respectively; in autumn, the WUE values of the other vegetation types did not significantly differ from each other, except for the slightly higher WUE mean value of crops, which was 0.14 g C/(mm·m2).

4.2. Characteristics of Spatial and Temporal Distributions of the Aridity Index

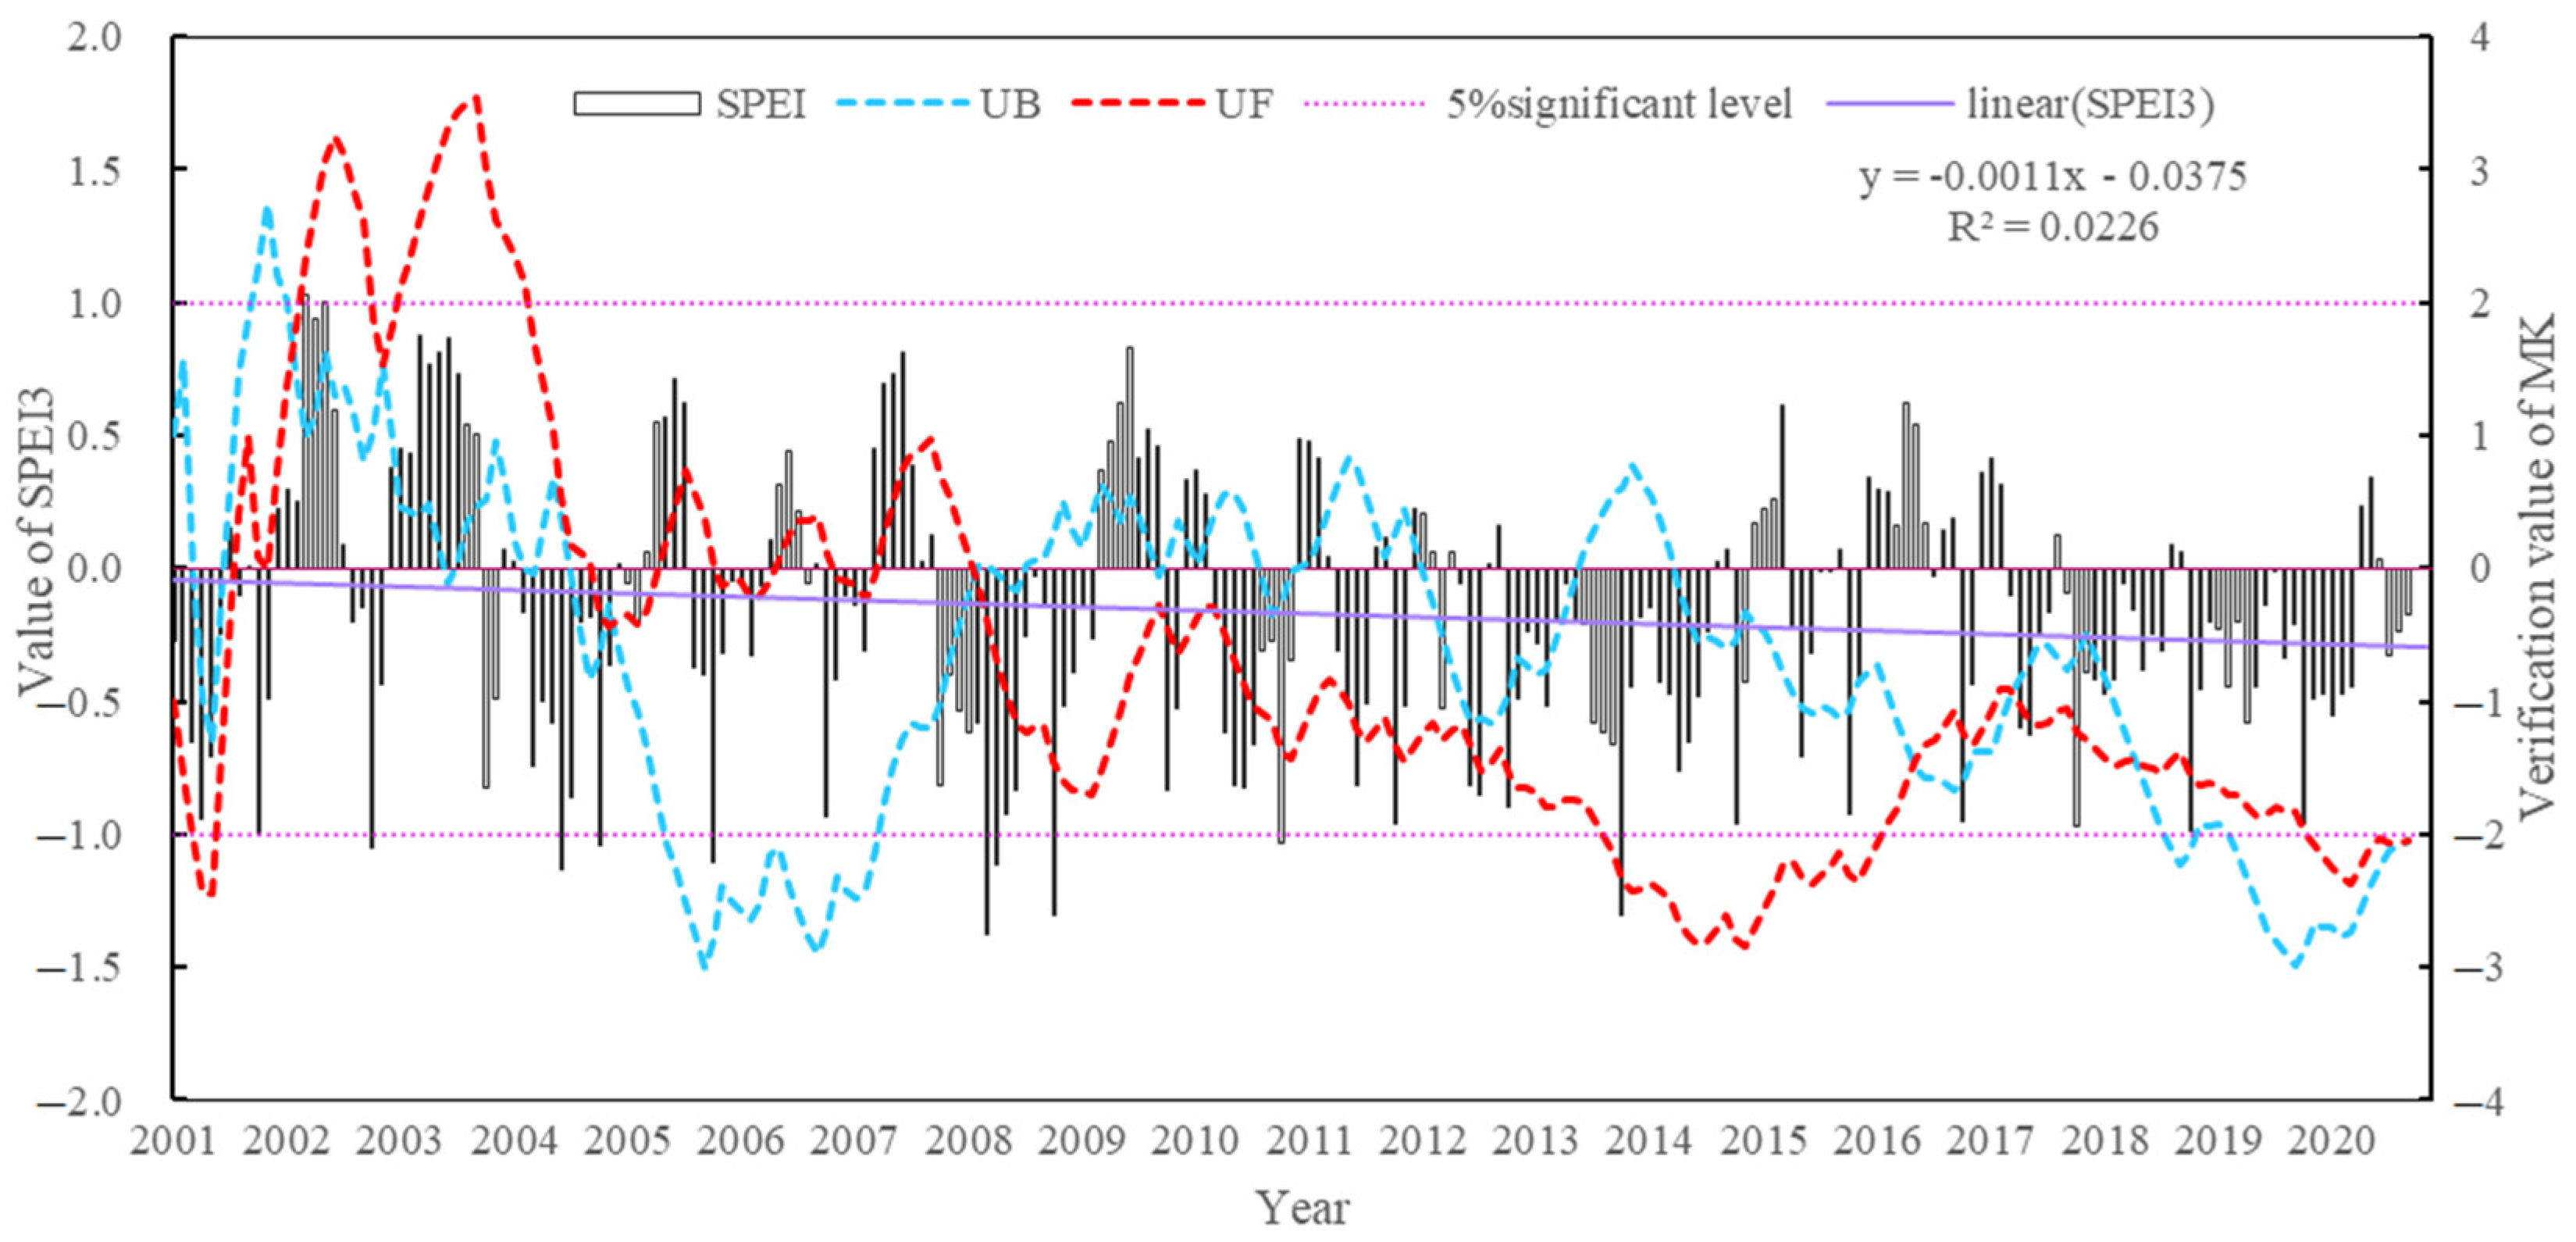
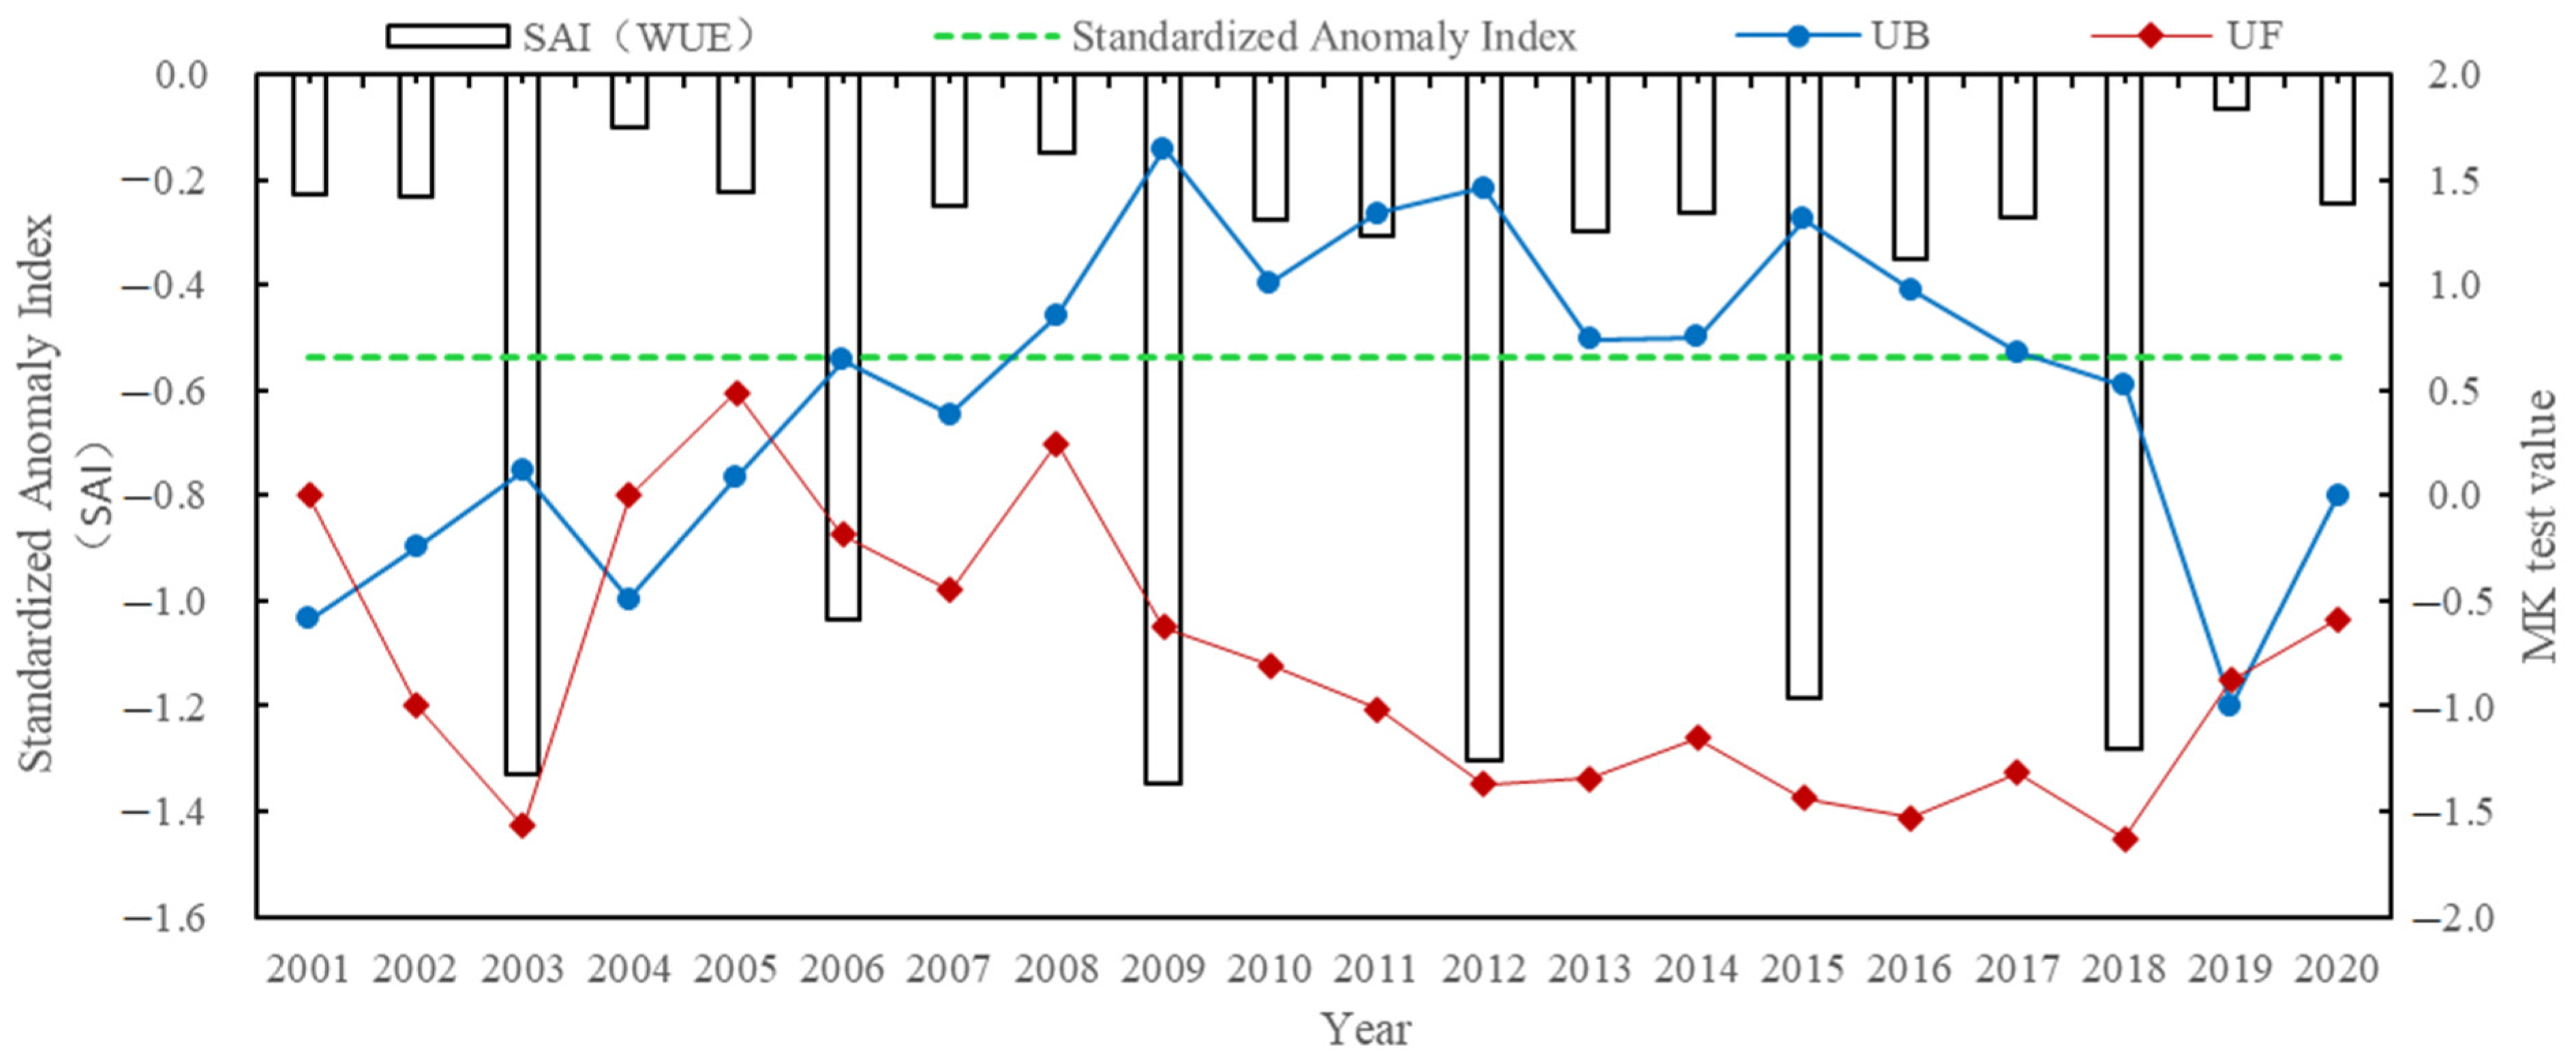
4.2.1. Temporal Distribution Characteristics of the Aridity Index

The MK mutation test was used to test the mutability of the SPEI3 series for the period 2001–2020 in the Manas River Basin, Xinjiang, China, as was the significance test of α = 0.05. As observed from the MK statistical curve for SPEI3 in the Manas River Basin, from 2001 to 2020 (Figure 4), linear SPEI3 showed a decreasing trend from 2001 to 2020 within the normal range of drought types, indicating that the Manas River Basin had a trend of aridification from 2001 to 2020 but was still at a normal drought level. The UF curves for 2002–2005 were all >0, indicating an increasing trend in the SPEI3 series during this period, while during 2015–2020, the UF values were all <0, indicating an increasing aridification trend in the Manas River Basin.
From 2008 to 2013, the UF curves did not exceed the critical line of 0.05 as SPEI3 was fluctuating, indicating that the drying and wetting trends in the Manas River Basin were not significant during this period. In 2015, the UF curve exceeded the significance level of 0.05, indicating that the SPEI3 of the Manas River Basin showed a significantly decreasing trend, whereas the degree of aridity increased. The UF and UB curves intersected during 2002, 2005, and 2008–2016, indicating that these were the time points at which the aridity trend of the basin suddenly changed.

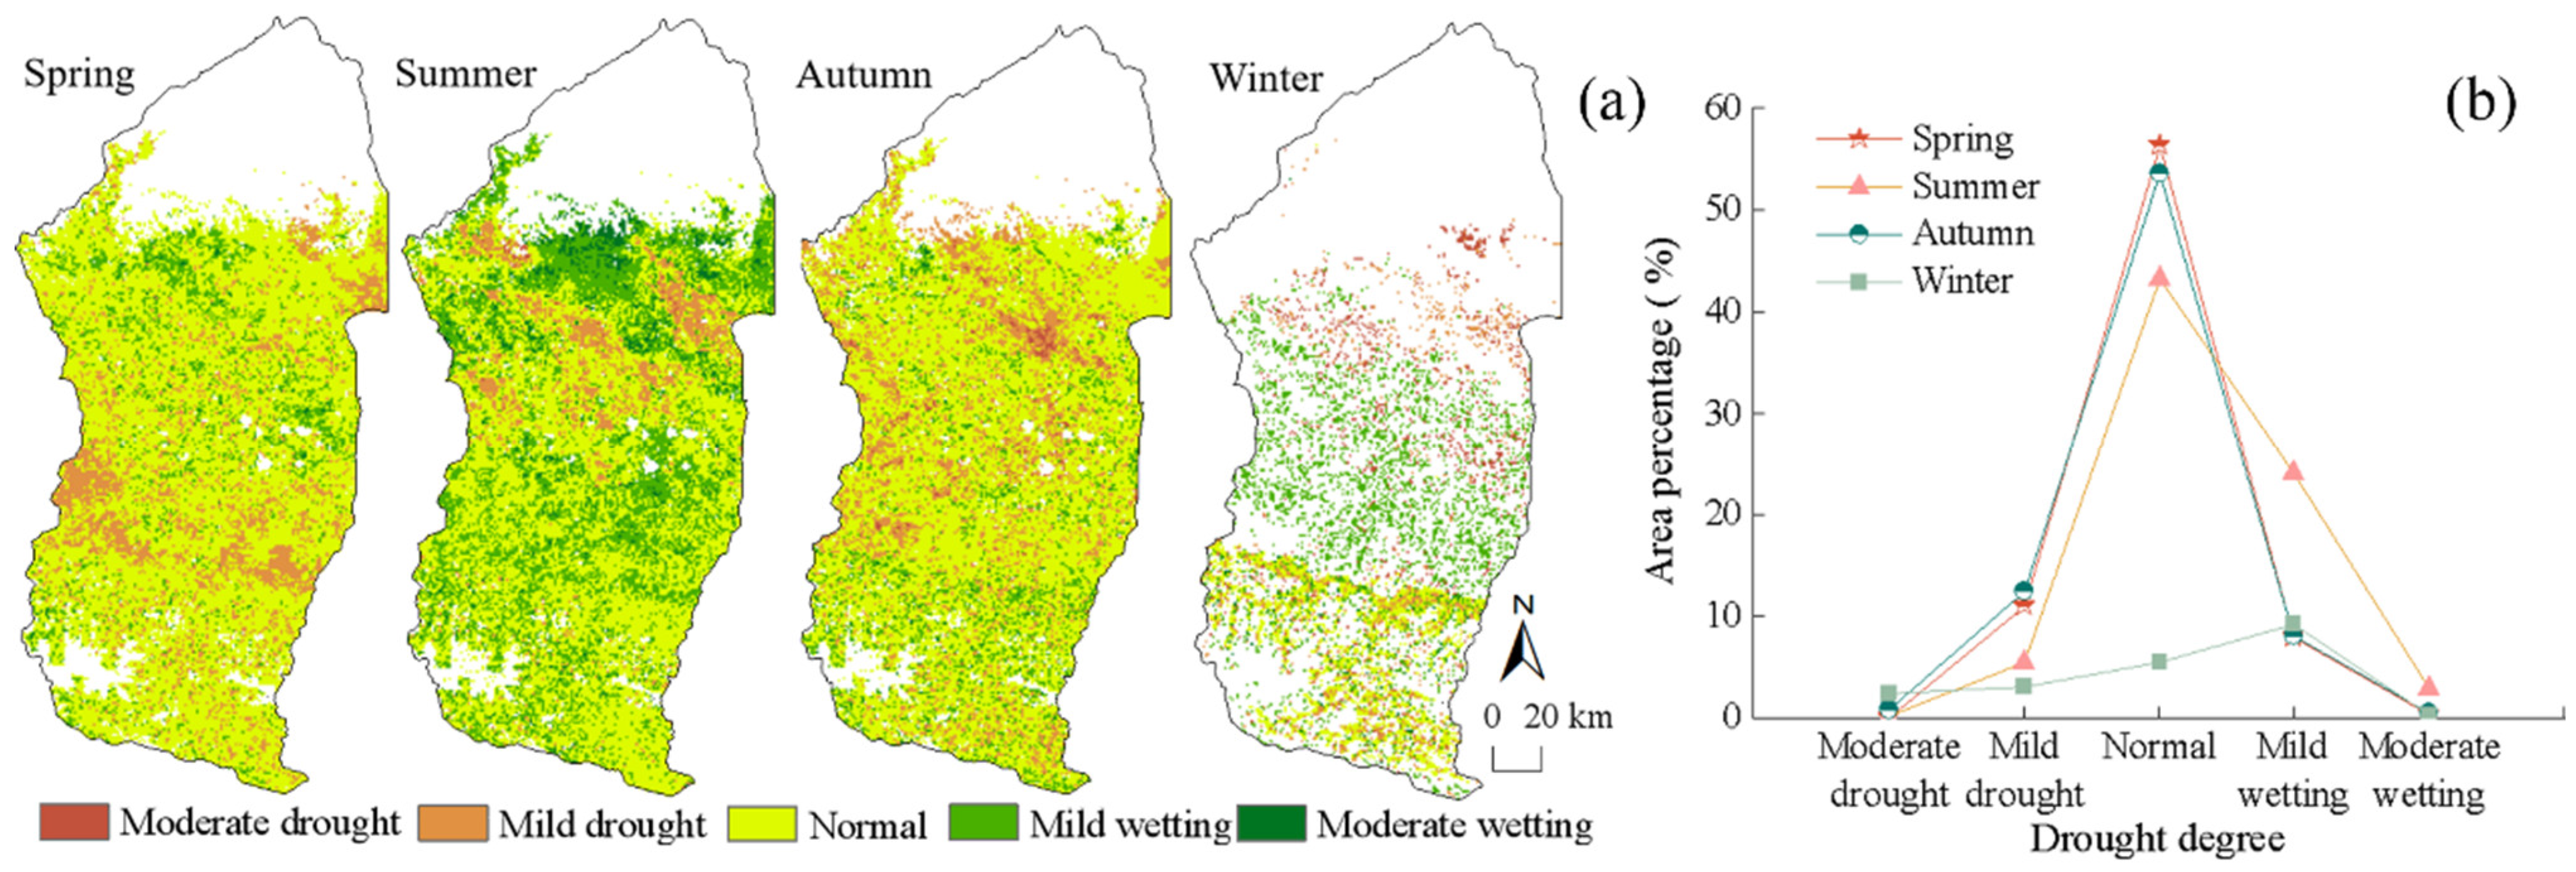
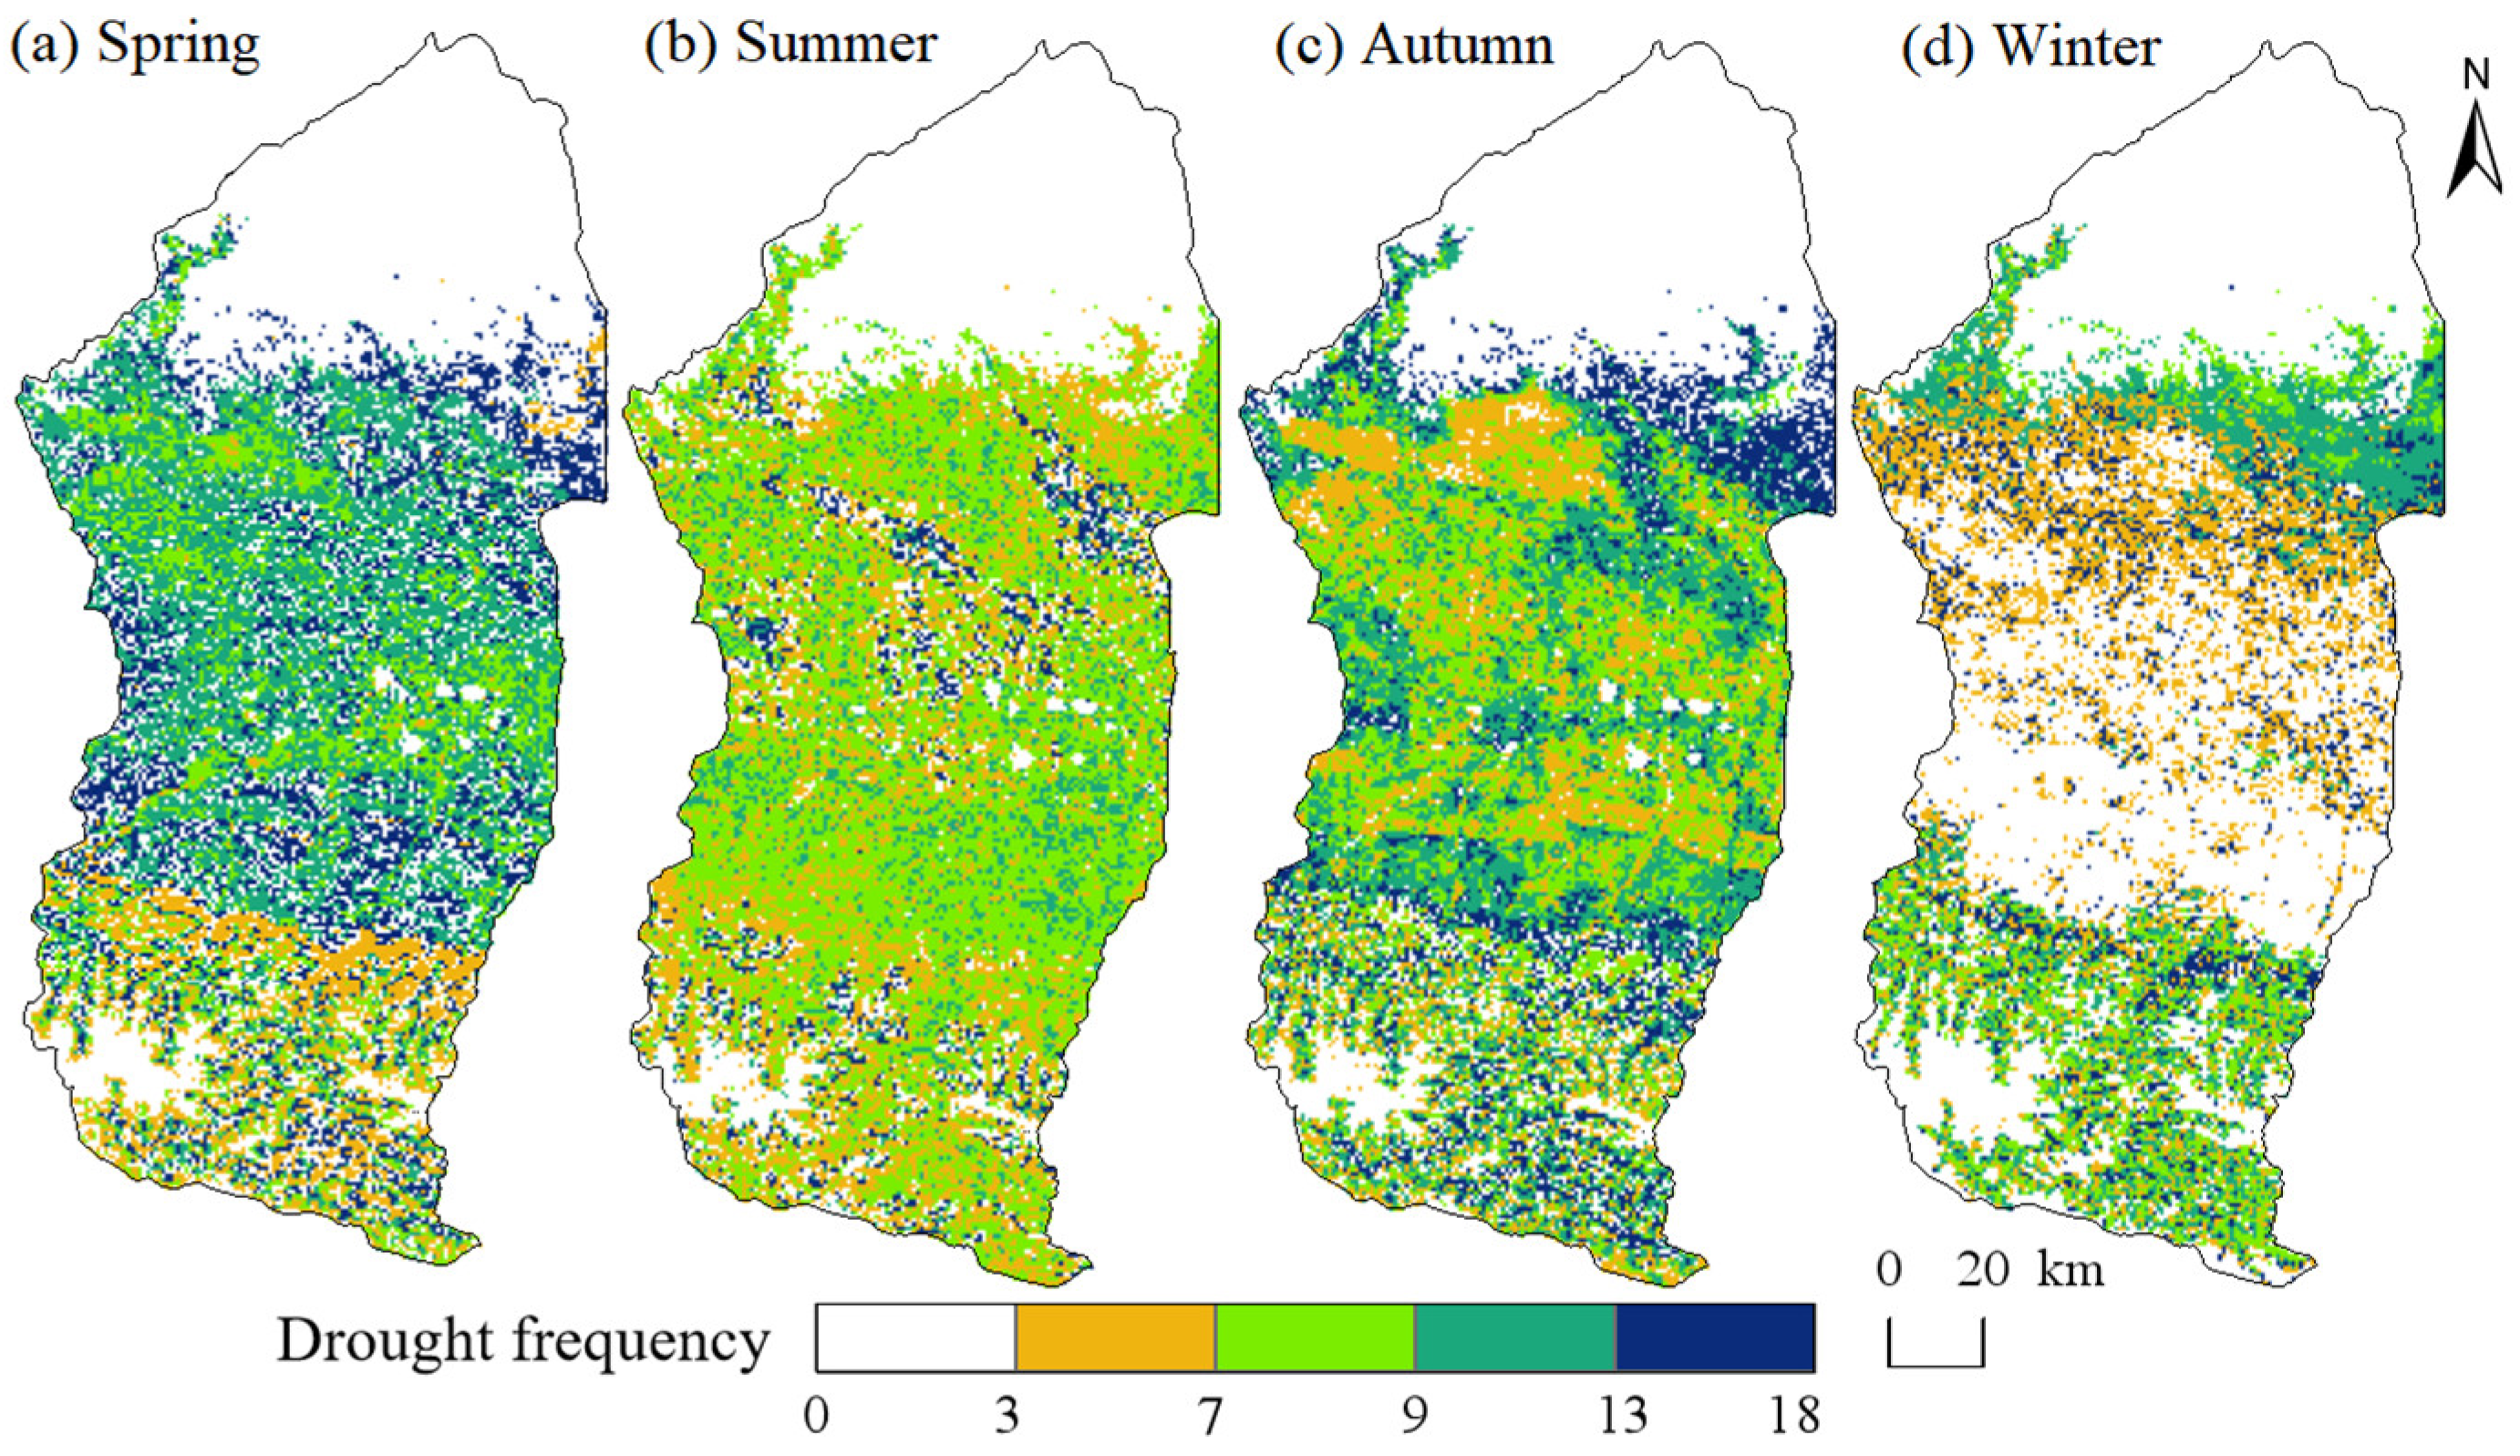
4.2.2. Spatial Distribution Characteristics of Drought Levels

The spatial distribution of the average SPEI in different seasons over the past 20 years in the Manas River Basin (Figure 5) showed that most of the Manas River Basin belonged to the normal or slightly humid type, with a small part of the area in the slightly arid type. Normal or slightly arid areas in spring were mainly distributed in the low mountainous areas; the normal area in spring accounted for 56.22% of the total watershed, whereas slightly arid areas accounted for 11.02%. SPEI3 was relatively high in summer, and slightly wet areas were mainly distributed in the grassland, accounting for 24.06% of the total watershed area. The slightly arid areas were primarily distributed in croplands, accounting for 5.43% of the total watershed area, and the other areas were normal. Other areas were normal and slightly wet, and the regional differences were not discernible. In autumn, most of the areas were normal, accounting for 53.50% of the total watershed. Drought and wet areas were distributed in all areas of the watershed, and the difference in distribution was not significant. In winter, the distribution of SPEI3 in the watershed showed apparent differences, with the desert area showing observable drought, the oasis area showing a wet type, and the high mountainous area showing normal and slightly wet types.
As shown by the area share of drought types in different seasons for the four vegetation types in the study area (Figure 6), the area share of different vegetation types corresponding to drought types in different seasons varied significantly. Crops in the spring, summer, and autumn seasons had a larger proportion of vegetation drought types, of which the area proportion of heavy drought in spring and summer was largest, accounting for 29.70% and 40.38%, respectively. The proportion of medium-drought areas in autumn was large at 33.78%, and the proportion of drought-free areas in winter was larger (32.45%). Grasslands in spring, with a larger proportion of drought-free areas, accounted for 91.38%. In summer, except for severe drought, the proportion of areas occupied by several other drought category types did not significantly differ, and the proportion of the area was >70%. In autumn, grasslands with severe drought had a large proportion (81.95%) of the area. In winter, grassland was dominated by slight drought at 89.20%, and the proportion of areas with no drought type was lower at 65.61%. Broad-leaved forests in the study area had a smaller area and a larger proportion of drought-free areas in winter. Among the four seasons, coniferous forests had a higher proportion of drought-free and mildly drought-free areas in spring (8.62% and 18.96%, respectively) and a higher proportion of drought-free areas in autumn (52.17%), whereas the area where drought occurred during the remaining seasons was relatively smaller. This indicates that coniferous forests are the least prone to drought among all vegetation types.
The frequency of droughts in most areas of the Manas River Basin, Xinjiang, China, exceeded seven times during different seasons from 2001 to 2020 (Figure 7). Among them, the frequency of drought occurrence in the alpine forest-dominated areas of the study area was low in spring, while the frequency of drought occurrence was high in other areas. Areas with more than nine times the drought frequency accounted for 50.76% of the total region (Table 2), which was mainly manifested in the grassland and crops in the oasis area. The difference in the frequency of drought occurrence in the entire basin during summer was insignificant, and the drought occurrence frequency was 7–13 times, accounting for approximately 58.85% of the total. The drought frequency of a small number of crops was 13–18 times. In autumn, the frequency of drought in crops was low, whereas the frequency of drought in other areas was high. In winter, the drought frequency in the study area was low and that in the oasis area was in the range of 0–7 times, accounting for approximately 72.25% of the total region. The drought frequency in alpine areas, which are dominated by woodlands and desert grasslands, was high. In conclusion, the frequency of drought during the vegetation-growing season in the study area was high, especially when the frequency of drought in grasslands was the highest, whereas vegetation with a low frequency of drought was dominated by woodlands.

4.3. WUE Response to Drought

4.3.1. Hysteresis Effects of WUE on Drought

In this study, Pearson’s correlation analysis was used to study the response of WUE-SAI to SPEI at various time scales. The time scale with the best correlation between the WUE-SAI and SPEI was 3 months, with a maximum correlation coefficient of 0.59, and the area of the 3-month scale image element with good correlation accounted for 64.0% of the total area of the watershed (Figure 8a). Among them, crops and grassland in the southern part of the watershed had better correlations; the time scale with the best correlation between SAI and SPEI was one month, with a maximum correlation of 0.38, and the area of 1-month scale pixels with good correlation accounted for 25.4% of the total watershed area. The maximum correlation at the 6-month scale was 0.31, the average correlation at the 12-month scale was the lowest, and the maximum correlation was only 0.27. The area of image elements with significant correlations at the 6- and 12-month scales was less than 1.0% of the total watershed area. In summary, the response of WUE to drought in the study area was most prominent at the 3-month scale.
Figure 8b shows the spatial distribution of time scales that passed the significance test (0.05), and most of the delay in the response of WUE to drought conditions in the Manas River Basin was observed during the 3-month timeframe, with large spatial differences in correlations between SAI and SPEI. The response of grassland to drought primarily exhibited 1- and 3-month time lags; the time scale of the lag effect of crops was mainly 3 months, and to a lesser extent, 1 month; woodland WUE had a longer lag response time to drought, generally reaching 6–12 months. There were large differences in the timescales of water-use efficiency to drought lag for different vegetation types.

4.3.2. WUE Resilience Response to Drought

Figure 9 shows the spatial distribution of the resilience of vegetation ecosystems to drought in the Manas River Basin from 2001 to 2020. This assessment gauges the inhibitory and restorative capacities of vegetation ecosystems against drought disturbances within the study area. Approximately 38.16% of the vegetated ecosystems in the Manas River Basin had drought resilience, mainly in cultivated land and grasslands in the central and southern parts of the basin. In contrast, approximately 22.61% of the study area showed serious non-recovery ability to drought occurrence, mainly distributed in cultivated land in the study area and the northern part of the watershed near the bare land, indicating that the vegetation ecosystems in these areas were fragile and highly affected by drought disturbance. Additionally, vegetation ecosystems in mountainous areas had the strongest ability to suppress and recover from drought, whereas desert grasslands had a weaker ability to recover from drought after its occurrence.
The mean values of the ecosystem resilience index Rd for coniferous forests, crops, and grasslands in the study area from 2001 to 2020 were all >1; that is, these vegetation types showed relatively high resilience and recovery capacity to drought, whereas broad-leaved forests showed slight resilience to drought, with an Rd ranging from 0.9 to 1 (Figure 9c). However, the standard deviation of resilience was larger for crops and grasslands, and greater variability in drought resistance capacity was observed. In conjunction with Figure 1, vegetation is more resilient to drought; the closer it is to the upper part of the watershed, and the closer it is to the bare land area, the less resilient it is to drought. Grasslands are found throughout the watershed; grasslands in the upper reaches, where water is more abundant, have good resilience, while grasslands in the lower reaches, where water is scarce, have poor resilience, suggesting that the resistance of all vegetation types to drought in the study area is dependent on the spatial distribution of water resources.

5. Discussion

5.1. Analysis of the Causes of Spatial and Temporal Drought Characteristics in the Study Area

Most of the Manas River Basin in Xinjiang, China, was normal or slightly wet between 2001 and 2020, and a few areas were under light and moderate drought (Figure 3). Grasslands are found throughout the watershed [35]. The southern mountainous areas of the Manas River Basin have good water resources in most parts of the basin due to recharge from alpine snow, ice melt, and groundwater. This study shows that different types of vegetation in the study area are more affected by drought, mainly because of differences in the physiological characteristics of vegetation during different growing seasons, such as soil nutrient content and surface moisture.
The drought frequency is higher in northern Xinjiang than in other regions owing to the influence of continental warm high pressure [35], which confirms that the frequency of seasonal droughts in this study area was relatively high. Our study area has a higher frequency of drought mainly in grasslands and a lower frequency of drought in forests, primarily because grasslands are shallow-rooted vegetation, and their growth conditions are strongly influenced by soil surface moisture. In contrast, forest floors have deeper root systems and are in the upper reaches of rivers with an adequate supply of deep soil moisture. Therefore, changes in soil surface moisture do not significantly affect this type of vegetation [6]. In contrast, crops in the study area showed the driest summer season, mainly because of high temperatures, high evaporation, shallow crop root systems, and long-term groundwater irrigation, resulting in a very fragile agroecosystem, which, in turn, resulted in a sensitive response of crops and weak tolerance to drought. The results of this study show that droughts occurred every three years in the study area during 2001–2020 (Figure 2), which is in good agreement with historical records [36,37]. Our findings serve as a theoretical foundation for devising vegetation water-use strategies and maximising WUE in the study area.

5.2. Differences in WUE Responses to Drought across Vegetation Types

Previous studies have suggested that the effect of drought on vegetation WUE exhibits a lag effect, typically ranging from one to four months, and is present in 70.87% of vegetated areas worldwide [38]. In this study, most of the vegetation WUE in the Manas River Basin of Xinjiang, China, responded to a drought lag on a 3-month scale. However, the effect of drought on the WUE of some grasslands in the study area occurred in the same month, whereas the length of the lag time to the drought effect reached three months for croplands in the plains and grasslands in the upper part of the watershed. Compared with grasslands, the lag time of woodland WUE to drought can reach 6–12 months [39]. The results of this study indicated that the average response time of woodlands to drought was from June to December. The response time of grasslands to drought is shorter than that of forests because the root system of grass is shallower than that of forests, and herbaceous plants with short root systems usually only obtain water from the surface soil [40,41]. The water storage capacity of herbaceous plants is weaker [42]; therefore, grassland WUE responds more rapidly to drought. The timescale of the lag effect of other vegetation types in this study was mainly a 3-month scale, whereas some were a 1-month scale, consistent with previous studies [43]. The moisture conditions within the study area have remained relatively stable for most of the last 20 years, resulting in a less significant average lag effect of WUE on drought for different vegetation types during the study period (Figure 8). This is consistent with a previous study showing that the lag effect of drought is not significant under normal moisture conditions [44].
Different geographical environments, vegetation characteristics, and soil conditions may lead to variations in drought resistance among ecosystems. As the altitude decreases from south to north in the Manas Basin, the topography and landscape are in the order of high mountains, oasis plains, and deserts. Moisture conditions decreased in the same order, and the resistance of vegetation to drought decreased with decreasing altitude. The southern mountain forest ecosystem in the study area had the strongest resistance to drought, showed a high buffering capacity, and was less affected by drought under moisture stress, which was consistent with previous findings [45]. This was mainly due to the deep forest root system and the presence of ample water and carbohydrates in the woody components of the forest. Mountainous areas are rich in snow, ice-melting water, and groundwater resources; therefore, forest ecosystems are highly resistant to drought [45,46]. The poor resilience of the desert grassland in the study area after drought is mainly attributed to its fragile ecological environment and poor soil, coupled with the lack of water resources and poor water storage capacity, which make it difficult to resume growth after drought. The Manas River Irrigation District is one of the major large-scale irrigation districts in China, and the implementation of agricultural interventions, such as irrigation systems, crop rotation, and fertiliser application, has affected the resilience of crops to drought in the study area to some extent. Furthermore, increased vegetation greenness owing to human activity may also be a reason for good crop resilience [47].

6. Conclusions

In this study, an SPEI dataset for the Manas River Basin, Xinjiang, China, from 2001 to 2020 was established using multi-source remote sensing data. In this study, we investigated the geographical and chronological prevalence of drought incidents and their effects on plant WUE. The findings of this study can be summarised as follows.
(1)
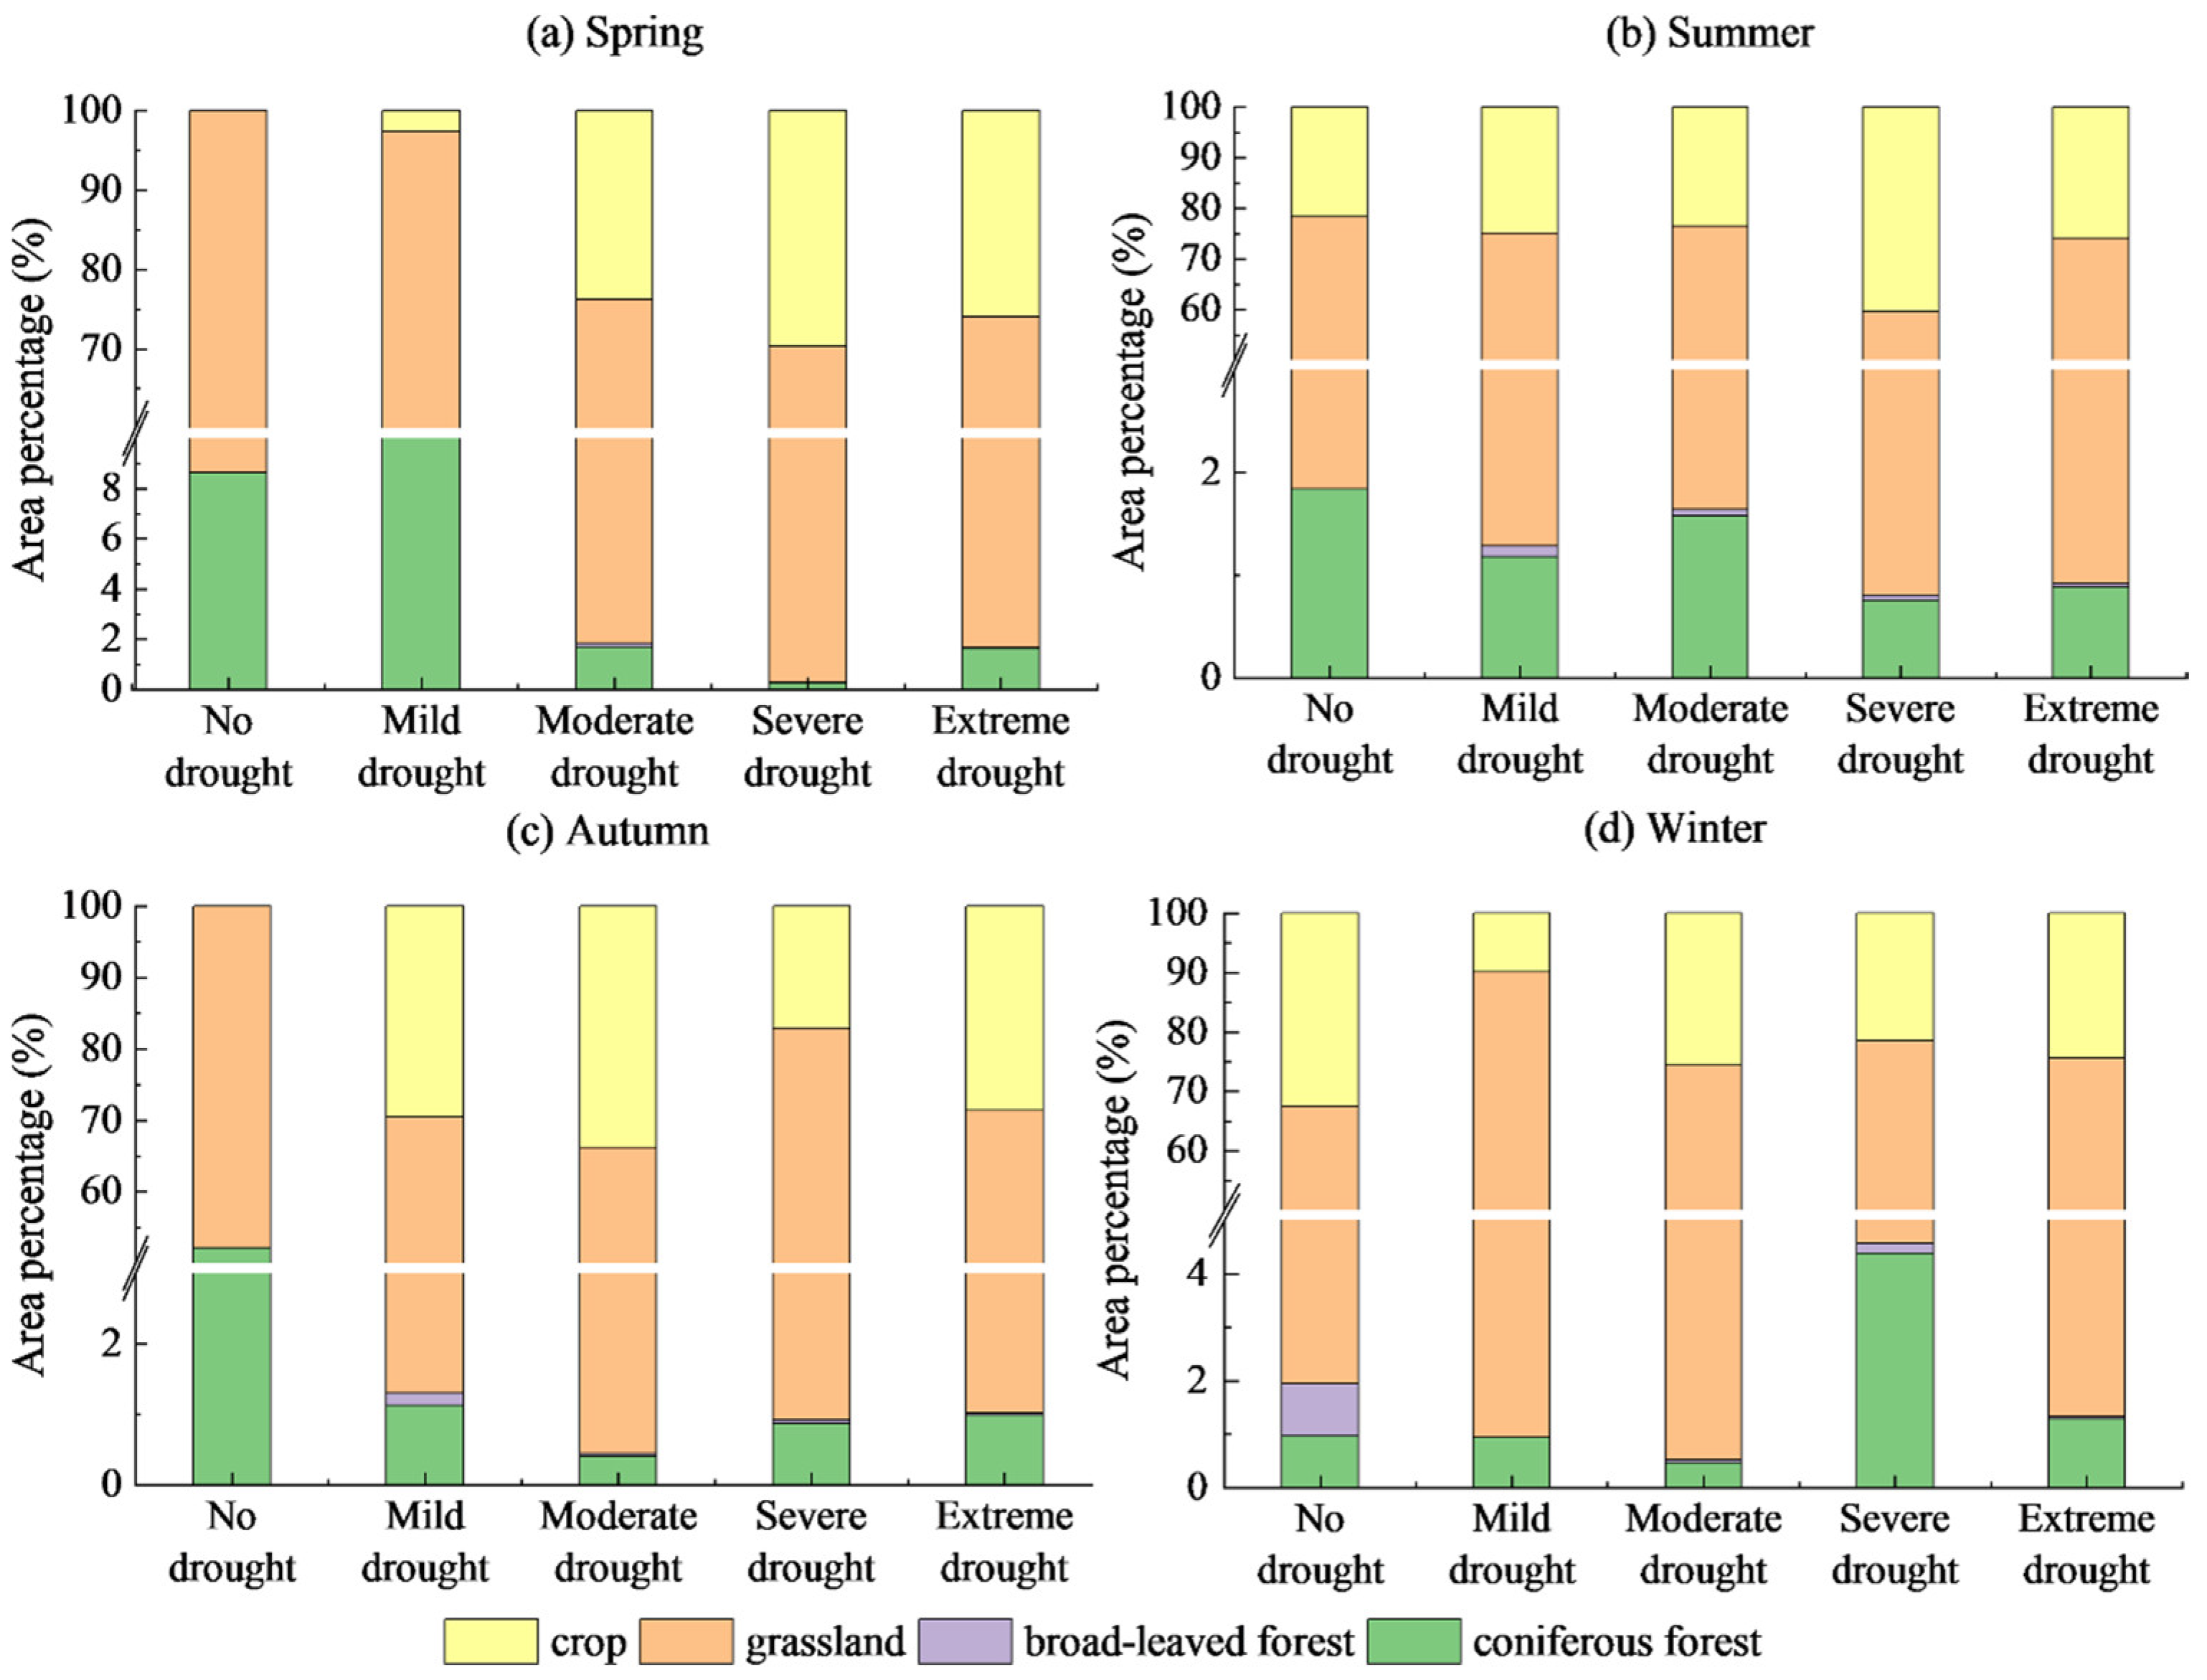
The Manas River Basin was at a normal drought level according to the drought index classification during the study period, and the drought trends changed abruptly in 2002, 2005, 2008, and 2016. In the seasonal average SPEI drought category over the past 20 years, most areas were in the normal or slightly wet category, and a few areas were in the slightly dry category. The seasonal drought frequency was relatively high, with most areas experiencing more than seven droughts. Drought occurred more frequently during the growing season for vegetation, particularly during the growing season for grasslands, and less frequently for woodlands.
(2)
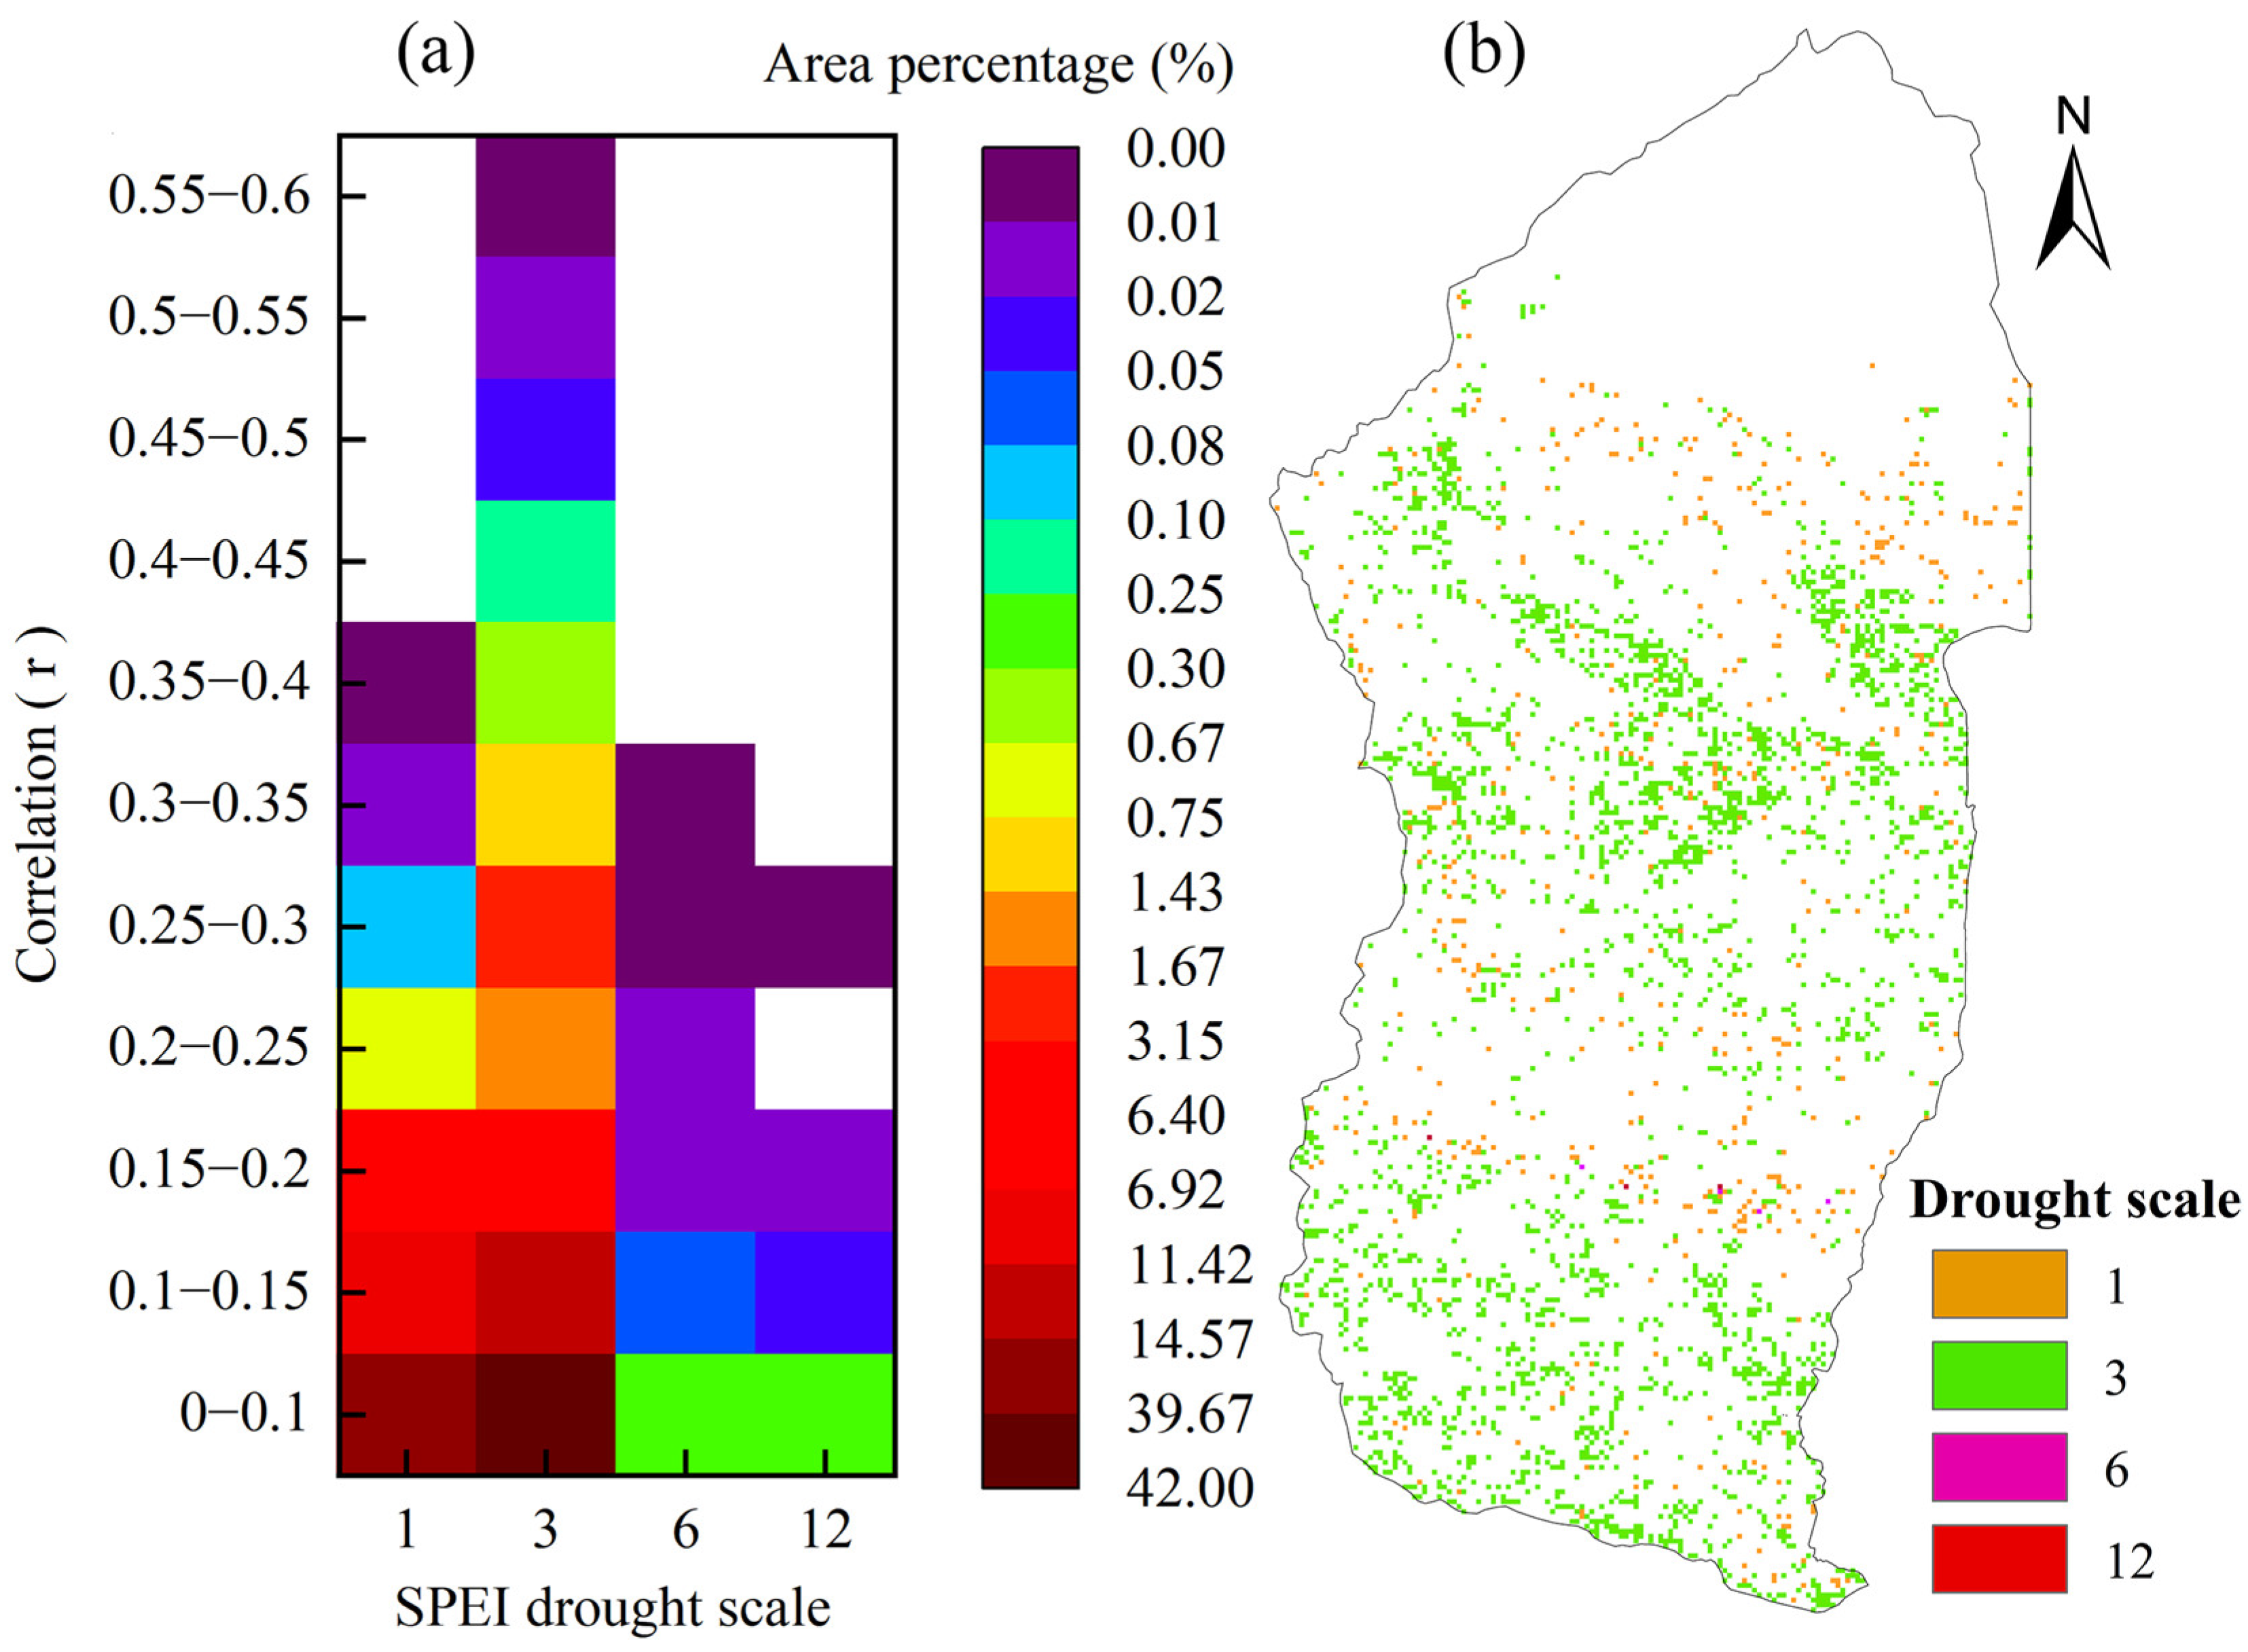
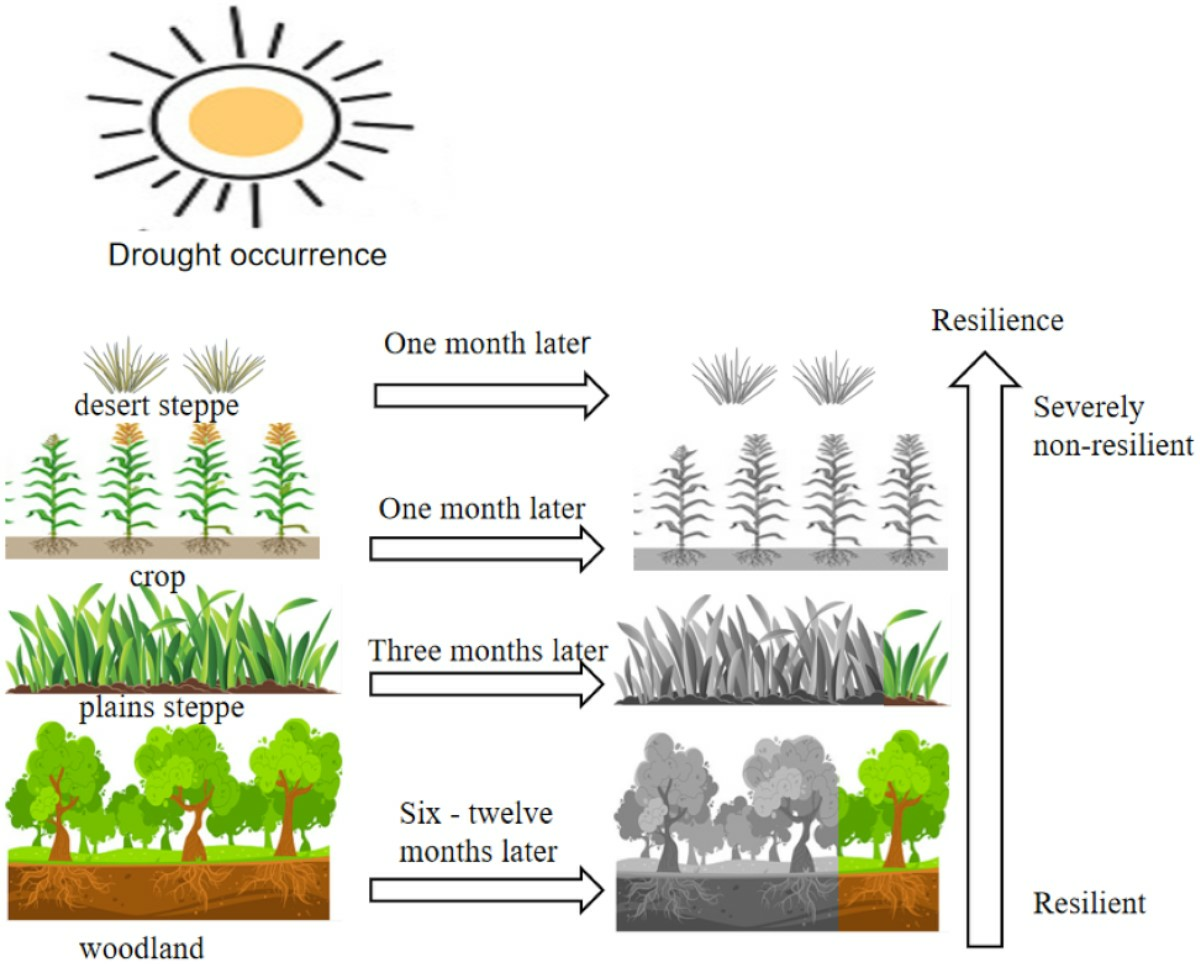
The vegetation WUE in the Xinjiang Manas Basin showed a significant lag to drought. The average lag time was three months, accounting for 64.0% of the total basin area. The effect of drought on grassland WUE generally occurred in the same month, whereas the length of the lag time for the effect on cropland and grassland WUE in the upper watershed reached 3 months, and the lag time of woodland WUE to drought reached 6–12 months. Forests with high biomass and well-developed root systems can store nutrients such as carbohydrates and have higher resistance to drought and WUE utilisation.
(3)
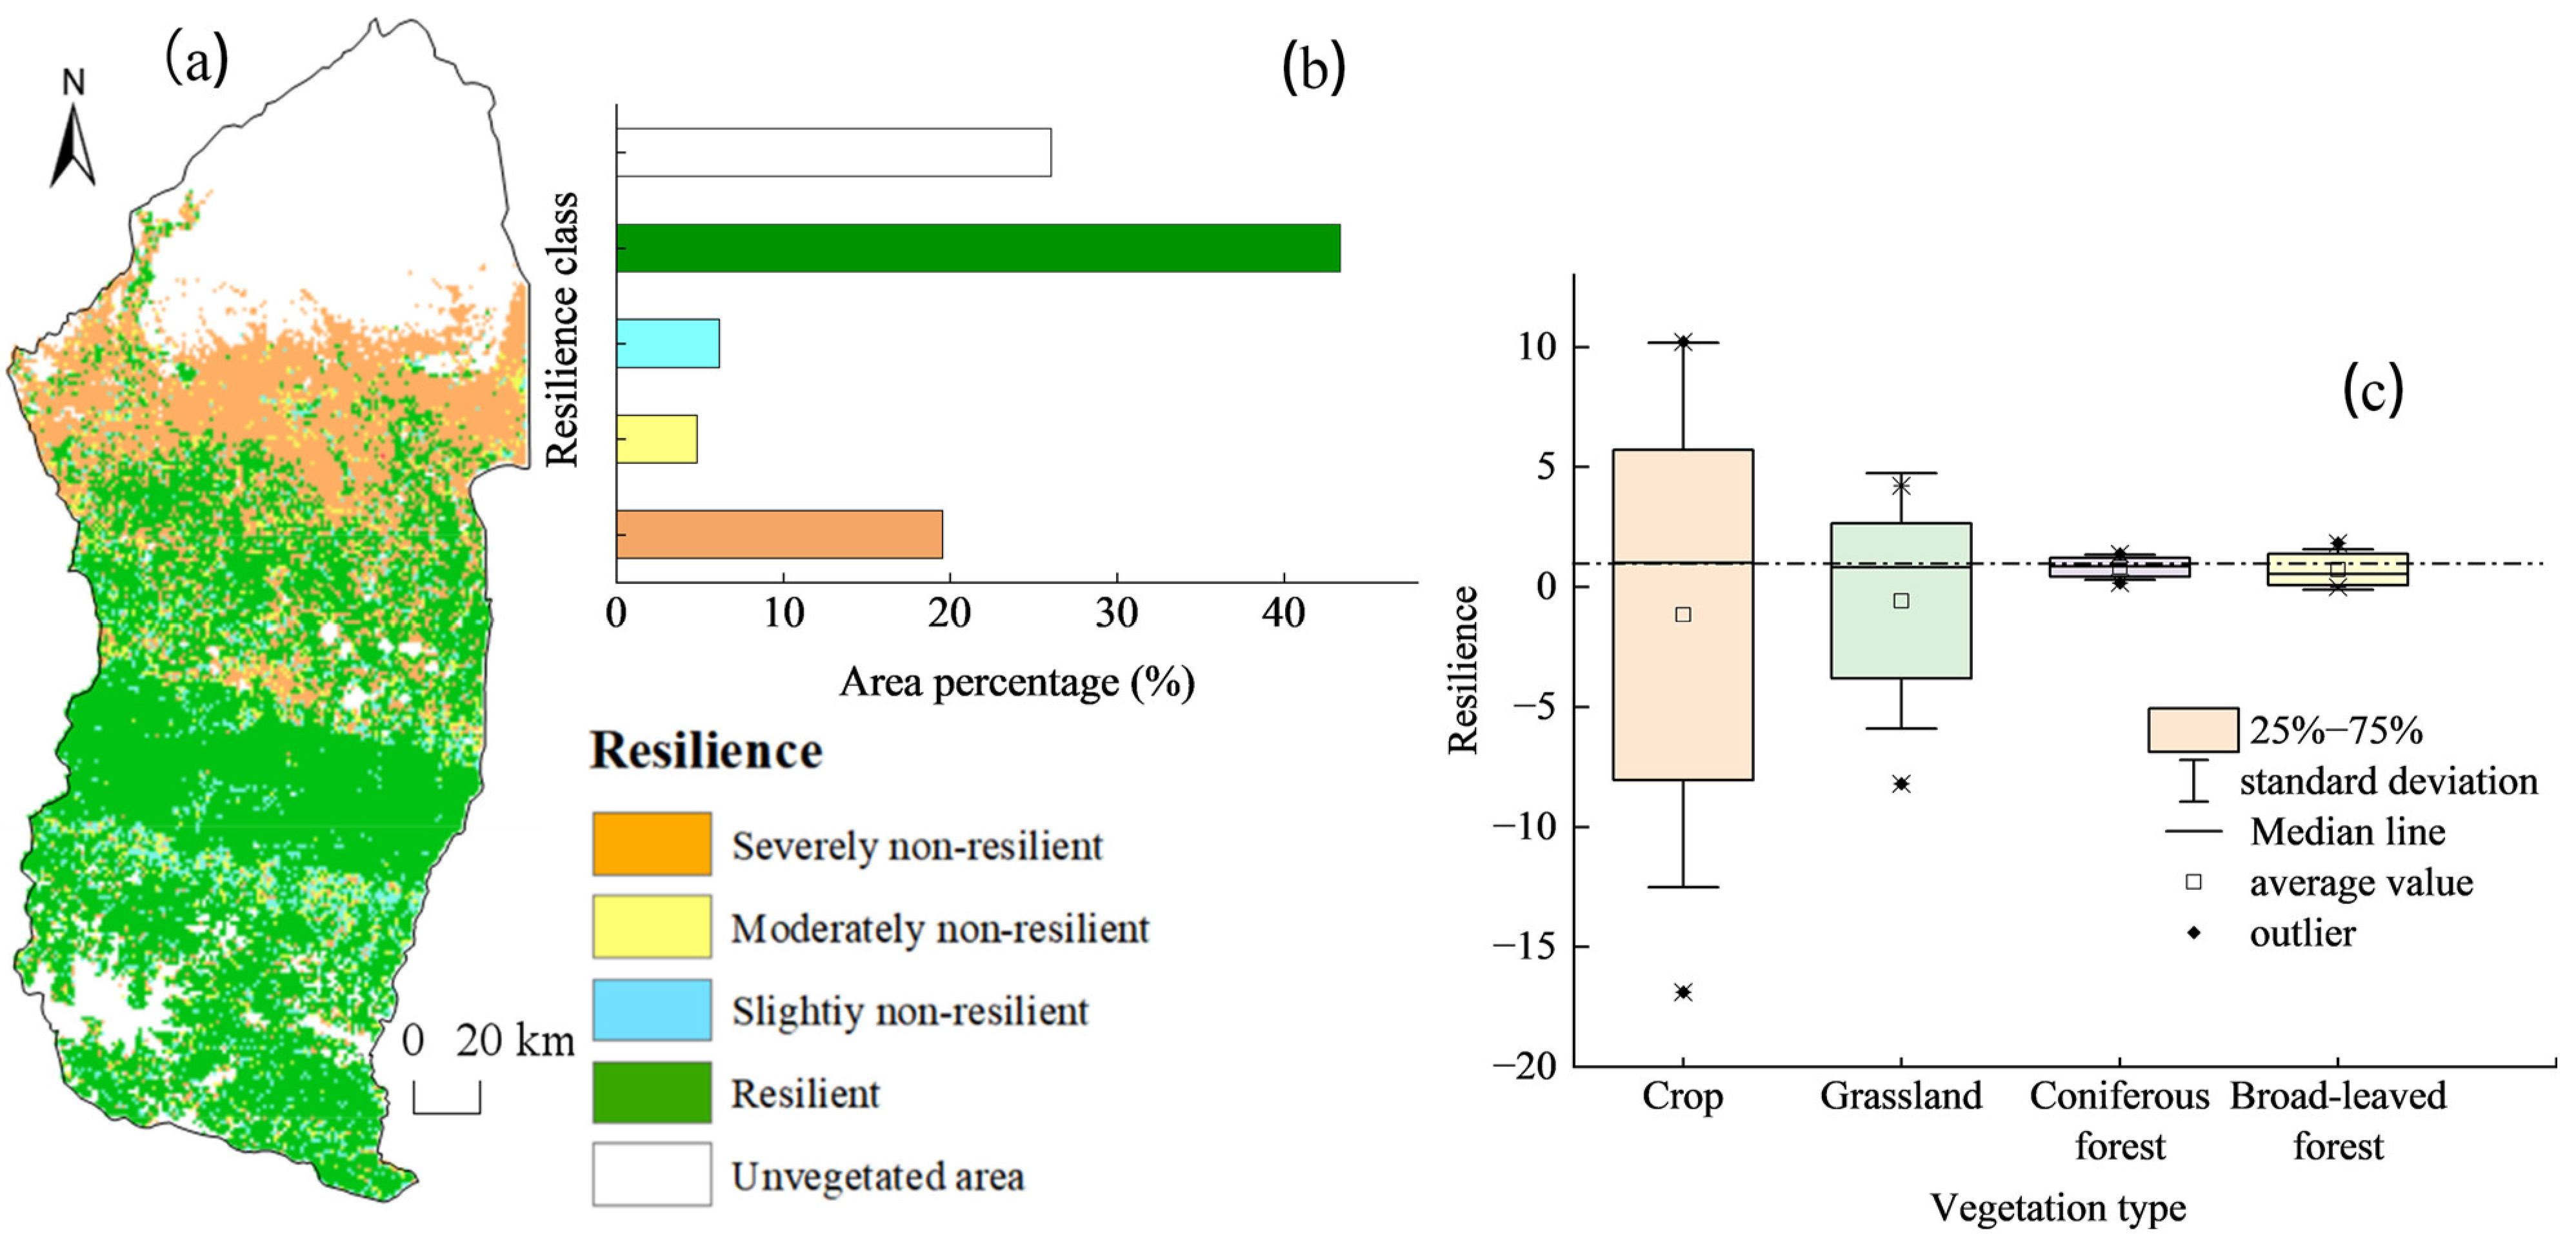
Approximately 38.16% of the regional vegetation ecosystems in the Manas River Basin exhibit drought resistance. Southern mountain ecosystems have the strongest resistance to drought, whereas the grasslands in the northern region, which depend on deserts, have weaker resistance. The closer the area was to the upper part of the basin, the more resilient the vegetation was to drought, and the closer the area was to bare land, the less resilient the vegetation. The resistance of vegetation to drought also depends on the complexity of the ecosystem and the spatial and temporal distribution of water resources.

Author Contributions

Conceptualization, J.K. and M.Z.; methodology, J.K.; software, J.K.; validation, Z.C. and S.Y.; formal analysis, M.Z.; investigation, M.Z.; resources, J.K.; data curation, C.X. and Z.C.; writing—original draft preparation, J.K.; writing—review and editing, M.Z.; visualization, J.K. and Z.C.; supervision, M.Z.; project administration, M.Z.; funding acquisition, M.Z. All authors have read and agreed to the published version of the manuscript.

Funding

This work was supported by the Natural Science Foundation of Xinjiang Uygur Autonomous Region (2023D01A49), the National Natural Science Foundation of China (42261013), and the Xinjiang Uygur Autonomous Region Key Laboratory Bidding Project (XJDX0909-2021-01).

Data Availability Statement

The codes and data used in this work are available from the corresponding author upon reasonable request.

Conflicts of Interest

The authors declare no conflicts of interest.

References

  1. Amar, G.; Mamtimin, A.; Wang, Y.; Wang, Y.; Gao, J.; Yang, F.; Song, M.; Aihaiti, A.; Wen, C.; Liu, J. Factors controlling and variations of CO2 fluxes during the growing season in Gurbantunggut Desert. Ecol. Indic. 2023, 154, 110708. [Google Scholar] [CrossRef]
  2. Guo, H.; Bao, A.; Liu, T.; Ndayisaba, F.; Jiang, L.; Zheng, G.; Chen, T.; De Maeyer, P. Determining variable weights for an Optimal Scaled Drought Condition Index (OSDCI): Evaluation in Central Asia. Remote Sens. Environ. 2019, 231, 111220. [Google Scholar] [CrossRef]
  3. Yu, H.; Zhang, Q.; Xu, C.-Y.; Du, J.; Sun, P.; Hu, P. Modified palmer drought severity index: Model improvement and application. Environ. Int. 2019, 130, 104951. [Google Scholar] [CrossRef] [PubMed]
  4. Li, C.; Adu, B.; Wu, J.; Qin, G.; Li, H.; Han, Y. Spatial and temporal variations of drought in Sichuan Province from 2001 to 2020 based on modified temperature vegetation dryness index (TVDI). Ecol. Indic. 2022, 139, 108883. [Google Scholar] [CrossRef]
  5. Yang, R.; Xing, B. Teleconnections of large-scale climate patterns to regional drought in mid-latitudes: A case study in Xinjiang, China. Atmosphere 2022, 13, 230. [Google Scholar] [CrossRef]
  6. Liu, Y.; Zheng, J.; Guan, J.; Han, W.; Liu, L. Concurrent and lagged effects of drought on grassland net primary productivity: A case study in Xinjiang, China. Front. Ecol. Evol. 2023, 11, 1131175. [Google Scholar] [CrossRef]
  7. Wang, M.; Ding, Z.; Wu, C.; Song, L.; Ma, M.; Yu, P.; Lu, B.; Tang, X. Divergent responses of ecosystem water-use efficiency to extreme seasonal droughts in Southwest China. Sci. Total. Environ. 2021, 760, 143427. [Google Scholar] [CrossRef]
  8. Zhao, T.; Zhang, Y.; Zhang, T.; Xu, M.; Zhu, J.; He, Y.; Yu, G. Drought occurrence and time-dominated variations in water use efficiency in an alpine meadow on the Tibetan Plateau. Ecohydrology 2021, 15, e2360. [Google Scholar] [CrossRef]
  9. Liu, P.; Zha, T.; Jia, X.; Black, T.A.; Jassal, R.S.; Ma, J.; Bai, Y.; Wu, Y. Different effects of spring and summer droughts on ecosystem carbon and water exchanges in a semiarid shrubland ecosystem in northwest China. Ecosystems 2019, 22, 1869–1885. [Google Scholar] [CrossRef]
  10. Han, W.; Guan, J.; Zheng, J.; Liu, Y.; Ju, X.; Liu, L.; Li, J.; Mao, X.; Li, C. Probabilistic assessment of drought stress vulnerability in grasslands of Xinjiang, China. Front. Plant Sci. 2023, 14, 1143863. [Google Scholar] [CrossRef]
  11. Li, Y.; Zhang, W.; Schwalm, C.R.; Gentine, P.; Smith, W.K.; Ciais, P.; Kimball, J.S.; Gazol, A.; Kannenberg, S.A.; Chen, A.; et al. Widespread spring phenology effects on drought recovery of Northern Hemisphere ecosystems. Nat. Clim. Chang. 2023, 13, 182–188. [Google Scholar] [CrossRef]
  12. Bai, Y.; Liu, M.; Guo, Q.; Wu, G.; Wang, W.; Li, S. Diverse responses of gross primary production and leaf area index to drought on the Mongolian Plateau. Sci. Total. Environ. 2023, 902, 166507. [Google Scholar] [CrossRef] [PubMed]
  13. Zhan, C.; Liang, C.; Zhao, L.; Jiang, S.; Niu, K.; Zhang, Y. Drought-related cumulative and time-lag effects on vegetation dynamics across the Yellow River Basin, China. Ecol. Indic. 2022, 143, 109409. [Google Scholar] [CrossRef]
  14. Ahmadi, B.; Moradkhani, H. Revisiting hydrological drought propagation and recovery considering water quantity and quality. Hydrol. Process. 2019, 33, 1492–1505. [Google Scholar] [CrossRef]
  15. Ji, Y.; Li, Y.; Yao, N.; Biswas, A.; Zou, Y.; Meng, Q.; Liu, F. The lagged effect and impact of soil moisture drought on terrestrial ecosystem water use efficiency. Ecol. Indic. 2021, 133, 108349. [Google Scholar] [CrossRef]
  16. Wang, W.; Li, J.; Qu, H.; Xing, W.; Zhou, C.; Tu, Y.; He, Z. Spatial and temporal drought characteristics in the Huanghuaihai Plain and its influence on cropland water use efficiency. Remote Sens. 2022, 14, 2381. [Google Scholar] [CrossRef]
  17. Li, J.J.; Luo, G.P.; Ding, J.L.; Xu, W.Q.; Zheng, S.L. Impacts of the progress of artificial irrigation and drainage technology on the change of cropland pattern In the Manas Basin of Xinjiang in the last 50a. J. Nat. Resour. 2016, 31, 570–582. [Google Scholar]
  18. Qin, J.L.; Xue, L.Q. Characteristics of spatial and temporal variation of vegetation and its spatial relationship with topographic factors In the Manas Basin of Xinjiang, Northwest Arid Zone. J. Ecol. Environ. 2020, 29, 2179–2188. [Google Scholar] [CrossRef]
  19. Chen, F.L.; Yang, K.; Cai, W.J.; Long, A.H.; He, X.L. esearch on hydrological aridity index based on gamlss model—A case study of Manas River Basin. Geogr. Publ. Res. 2021, 40, 2670–2683. [Google Scholar]
  20. Tirivarombo, S.; Osupile, D.; Eliasson, P. Drought monitoring and analysis: Standardised precipitation evapotranspiration index (SPEI) and standardised precipitation index (SPI). Phys. Chem. Earth Parts A/B/C 2018, 106, 1–10. [Google Scholar] [CrossRef]
  21. Zhang, H.; Zhang, X.L.; Li, J.J.; Wang, M.T.; Ma, Z.L. Characterisation of spatial and temporal variations of seasonal drought in the basin area of Sichuan Province based on SPEI. Agric. Res. Arid Reg. 2018, 36, 242–250+256. [Google Scholar]
  22. Zhao, H.; Yao, J.Q.; Li, X.G.; Tao, H. Characterisation of wet and dry climate change in Xinjiang. J. Sun Yat-Sen Univ. Nat. Sci. Ed. 2020, 5, 126–133. [Google Scholar] [CrossRef]
  23. Zhang, T.; Zhou, J.; Yu, P.; Li, J.; Kang, Y.; Zhang, B. Response of ecosystem gross primary productivity to drought in northern China based on multi-source remote sensing data. J. Hydrol. 2023, 616, 128808. [Google Scholar] [CrossRef]
  24. Huang, Y.F.; Ng, J.L.; Fung, K.F.; Weng, T.K.; AlDahoul, N.; Ahmed, A.N.; Sherif, M.; Chaplot, B.; Chong, K.L.; Elshafie, A. Space–time heterogeneity of drought characteristics in Sabah and Sarawak, East Malaysia: Implications for developing effective drought monitoring and mitigation strategies. Appl. Water Sci. 2023, 13, 1–25. [Google Scholar] [CrossRef]
  25. Zhao, H.; Li, X.; Eziz, M.; Yao, J.Q. Changes in the characteristics of dry-wet periods in Xinjiang, China based on the SPEI index. Atmósfera 2022, 35, 483–496. [Google Scholar]
  26. Abdurehman, A.; Mei, Z. Characterisation of drought change in Xinjiang based on SPEI. Anhui Agric. Sci. 2022, 50, 178–183. [Google Scholar]
  27. Liu, Y.B.; Wang, H.Q.; Ju, W.M. Characteristics of drought impact on forest productivity in Jiangxi Province. Nat. Hazards 2016, 25, 67–77. [Google Scholar] [CrossRef]
  28. Vicente-Serrano, S.M.; Gouveia, C.; Camarero, J.J.; Beguería, S.; Trigo, R.; López-Moreno, J.I.; Azorin-Molina, C.; Pasho, E.; Lorenzo-Lacruz, J.; Revuelto, J.; et al. Response of vegetation to drought time-scales across global land biomes. Proc. Natl. Acad. Sci. USA 2013, 110, 52–57. [Google Scholar] [CrossRef]
  29. Zhang, Q.; Kong, D.; Singh, V.P.; Shi, P. Response of vegetation to different time-scales drought across China: Spatiotemporal patterns, causes and implications. Glob. Planet. Chang. 2017, 152, 1–11. [Google Scholar] [CrossRef]
  30. Hamed, K.H. Trend detection in hydrologic data: The Mann–Kendall trend test under the scaling hypothesis. J. Hydrol. 2008, 349, 350–363. [Google Scholar] [CrossRef]
  31. Zhang, Q.; Chen, W. Ecosystem water use efficiency in the three-North Region of China based on long-term satellite data. Sustainability 2021, 13, 7977. [Google Scholar] [CrossRef]
  32. Sharma, A.; Goyal, M.K. District-level assessment of the ecohydrological resilience to hydroclimatic disturbances and its controlling factors in India. J. Hydrol. 2018, 564, 1048–1057. [Google Scholar] [CrossRef]
  33. Walker, B.; Holling, C.S.; Carpenter, S.R.; Kinzig, A. Resilience, adaptability and transformability in social-ecological systems. Ecol. Soc. 2004, 9, 5. [Google Scholar] [CrossRef]
  34. Sharma, A.; Goyal, M.K. Assessment of ecosystem resilience to hydroclimatic disturbances in India. Glob. Chang. Biol. 2018, 24, e432–e441. [Google Scholar] [CrossRef]
  35. Zhang, H.; Song, J.; Wang, G.; Wu, X.; Li, J. Spatiotemporal characteristic and forecast of drought in northern Xinjiang, China. Ecol. Indic. 2021, 127, 107712. [Google Scholar] [CrossRef]
  36. Yizhong, W. Xinjiang Uygur Autonomous Region Manas River Basin Water Conservancy Record; Shihezi Water Electr: Shihezi, China, 2002. [Google Scholar]
  37. Shi, Y.G. Chinese Meteorological Disaster Dictionary: Xinjiang Volume; Meteorological Publishing House: Beijing, China, 2006; pp. 138–152. [Google Scholar]
  38. Wei, X.; He, W.; Zhou, Y.; Ju, W.; Xiao, J.; Li, X.; Liu, Y.; Xu, S.; Bi, W.; Zhang, X.; et al. Global assessment of lagged and cumulative effects of drought on grassland gross primary production. Ecol. Indic. 2022, 136, 108646. [Google Scholar] [CrossRef]
  39. Wei, X.; He, W.; Zhou, Y.; Cheng, N.; Xiao, J.; Bi, W.; Liu, Y.; Sun, S.; Ju, W. Increased sensitivity of global vegetation productivity to drought over the recent three decades. J. Geophys. Res. Atmos. 2023, 128, e2022JD037504. [Google Scholar] [CrossRef]
  40. Fan, Y.; Miguez-Macho, G.; Jobbágy, E.G.; Jackson, R.B.; Otero-Casal, C. Hydrologic regulation of plant rooting depth. Proc. Natl. Acad. Sci. USA 2017, 114, 10572–10577. [Google Scholar] [CrossRef]
  41. Schwinning, S.; Sala, O.E. Hierarchy of responses to resource pulses in arid and semi-arid ecosystems. Oecologia 2004, 141, 211–220. [Google Scholar] [CrossRef]
  42. Craine, J.M.; Ocheltree, T.W.; Nippert, J.B.; Towne, E.G.; Skibbe, A.M.; Kembel, S.W.; Fargione, J.E. Global diversity of drought tolerance and grassland climate-change resilience. Nat. Clim. Chang. 2013, 3, 63–67. [Google Scholar] [CrossRef]
  43. Stocker, B.D.; Tumber-Dávila, S.J.; Konings, A.G.; Anderson, M.C.; Hain, C.; Jackson, R.B. Global patterns of water storage in the rooting zones of vegetation. Nat. Geosci. 2023, 16, 250–256. [Google Scholar] [CrossRef] [PubMed]
  44. Wu, Y.; Wang, W.; Li, W.; Zhao, S.; Wang, S.; Liu, T. Assessment of the spatiotemporal characteristics of vegetation water use efficiency in response to drought in Inner Mongolia, China. Environ. Sci. Pollut. Res. 2023, 30, 6345–6357. [Google Scholar] [CrossRef] [PubMed]
  45. Chen, Q.; Timmermans, J.; Wen, W.; van Bodegom, P.M. Ecosystems threatened by intensified drought with divergent vulnerability. Remote Sens. Environ. 2023, 289, 113512. [Google Scholar] [CrossRef]
  46. Liu, W.; Su, J.; Li, S.; Lang, X.; Huang, X. Non-structural carbohydrates regulated by season and species in the subtropical monsoon broad-leaved evergreen forest of Yunnan Province, China. Sci. Rep. 2018, 8, 1083. [Google Scholar] [CrossRef]
  47. Shi, S.; Yu, J.; Wang, F.; Wang, P.; Zhang, Y.; Jin, K. Quantitative contributions of climate change and human activities to vegetation changes over multiple time scales on the Loess Plateau. Sci. Total. Environ. 2021, 755, 142419. [Google Scholar] [CrossRef]
Figure 1. Overview of the location of the study area.
Forests 15 00114 g001
Figure 2. Characteristics of the temporal distribution of the standardised anomaly index (SAI) for WUE in the period 2001–2020.
Forests 15 00114 g002
Figure 3. (a) Seasonal spatial distribution of WUE in the Manas River Basin, Xinjiang, China, in the period 2001–2020. (b) Share of the area of WUE in different seasons.
Forests 15 00114 g003
Figure 4. Mann–Kendall (MK) statistics for the 3-month Standardized Precipitation Evapotranspiration Index (SPEI3) in the Manas River Basin, Xinjiang, China, in the period 2001–2020.
Forests 15 00114 g004
Figure 5. (a) Spatial distribution of seasonal-scale SPEI averages in the Manas River Basin from 2001 to 2020. (b) Percentage of areas with different seasonal drought ratings.
Forests 15 00114 g005
Figure 6. Ratio of area occupied by four vegetation types in different seasons in different drought classes in the Manas River Basin, 2001–2020.
Forests 15 00114 g006
Figure 7. Spatial distribution of drought frequency in different seasons in the Manas Basin of Xinjiang, 2001–2020.
Forests 15 00114 g007
Figure 8. (a) Correlation coefficients between water use efficiency (WUE)-standardised anomaly index (SAI) and corresponding time-scale SPEI at different monthly scales from 2001 to 2020. (b) Spatial distribution of SPEI at corresponding time scales.
Forests 15 00114 g008
Figure 9. (a) Spatial distribution and (b) area share of the resilience of different vegetation types to drought, 2001–2020. (c) Mean resilience of different vegetation types to drought.
Forests 15 00114 g009
Table 1. Standardised Precipitation Evapotranspiration Index (SPEI) classification.
Drought TypeModerate WetMild WetNormalMild DroughtModerate DroughtSevere DroughtExtreme Drought
SPEI value1.0–1.50.5–1.0−0.5–0.5−1.0–−0.5−1.5–−1.0−2.0–−1.5≤−2.0
Table 2. Proportion of total area corresponding to different drought frequencies for the four seasons between 2001 and 2020.
Drought FrequencyArea Proportion (%)
SpringSummerAutumnWinter
038.5128.0428.5953.60
30.591.341.741.26
74.837.5115.2217.39
95.3249.9621.004.97
1317.218.8922.3715.38
1833.554.2611.087.39
Disclaimer/Publisher’s Note: The statements, opinions and data contained in all publications are solely those of the individual author(s) and contributor(s) and not of MDPI and/or the editor(s). MDPI and/or the editor(s) disclaim responsibility for any injury to people or property resulting from any ideas, methods, instructions or products referred to in the content.

