Article

Quantifying the Spatiotemporal Variation of NPP of Different Land Cover Types and the Contribution of Its Associated Factors in the Songnen Plain

1
School of Geomatics and Prospecting Engineering, Jilin Jianzhu University, Changchun 130118, China
2
Jilin Province Natural Resources Remote Sensing Information Technology Innovation Laboratory, Changchun 130118, China
3
Jilin Geological Survey Institute, Changchun 130012, China
*
Author to whom correspondence should be addressed.
Forests 2023, 14(9), 1841; https://doi.org/10.3390/f14091841
Submission received: 8 August 2023 / Revised: 6 September 2023 / Accepted: 7 September 2023 / Published: 9 September 2023
(This article belongs to the Special Issue Application of Remote Sensing in Vegetation Dynamic and Ecology)

Abstract

:
Net primary productivity (NPP) of vegetation is considered an important indicator for ecological stability and is the main object for analyzing the factors influencing the terrestrial carbon cycle. Recent studies have made clear the changes in the NPP of vegetation and its influencing factors at various scales. However, the variations in NPP based on different land cover types under various natural conditions, along with their driving factors, remain not well understood. In this study, spatial overlay analysis was used to investigate the link among climatic, soil moisture (SM), and topographic parameters and NPP of various land cover types after analyzing the spatial and temporal trends of NPP in the Songnen Plain from 2001 to 2020. Additionally, the contribution of each influence factor to the NPP of different land cover types was calculated using the elastic net regression model. The elastic net regression model eliminates the multicollinearity among the influencing factors while maintaining the model stability, and the R2 of all lands is greater than 0.62, which can effectively quantify the contribution of each influencing factor to NPP. The results show a continuously increasing trend of the overall NPP in the research area over the selected 20 years, and NPP increased most significantly in forest land (FOR). Precipitation (PRE) and NPP showed high correlations in all the different land cover types, while the correlations between NPP and other influencing factors were significantly different. In addition, we found that perennials led to a more significant degree of NPP enhancement, and the effect of topographic conditions on NPP was mainly reflected in differences in moisture conditions due to surface runoff. From the results of the modeling calculations, the cumulative contribution of PRE to NPP ranks first in all land types and is the most vital influencing factor of NPP in the Songnen Plain. SM was an important influence, but the contribution of NPP was greater in land classes with shallow root systems. The results of the study revealed the positive transformation relationship of NPP among land cover types in ecologically fragile areas, which provides a reference for ecological restoration and rationalization of land use structure in zones such as intertwined agricultural and pastoral zones.

1. Introduction

Overwhelming anthropogenic CO2 emissions lead to aggravated global warming effects [1], frequent extreme climatic events and natural disasters, ecological environment deterioration [2,3], and natural resource depletion. Under such circumstances, maintaining the global carbon balance is an urgent necessity [4]. The Paris Agreement was officially adopted at the 21st session of the United Nations Climate Change Conference in response to issues arising from carbon imbalance. The objectives of the document lie in the carbon sink capacity enhancement of global ecosystems and anthropogenic carbon emission counteraction via carbon sequestration of plants [5,6,7]. Net primary productivity (NPP) is the total amount of organic matter accumulated by plants per unit of time and space, serving as the energy taken up by plants for growth and reproduction [8,9]. It is also a direct indicator of carbon sequestration capacity and the changes in the ecological environment [10]. In this sense, studying the spatiotemporal distribution and dynamics of vegetation NPP and its driving forces is of great significance to achieve ecosystem restructuring and stability, thus attracting wide interest from researchers [11].
In traditional ecological studies, the field-testing methods for estimating vegetation NPP include direct harvesting techniques, photosynthesis measurement, and CO2 measurement [12,13]. Although these methods can provide accurate raw data, they are not readily adopted over large areas due to deficiencies such as poor timeliness, limitations in the range scale by the number and distribution of observation stations, and irrecoverable vegetation depletion [14]. With the rapid development of aerospace and remote sensing technology, remote sensing imagery data have gradually become an important means for monitoring terrestrial ecological environments due to their recording characteristics of long-term, macroscopic, and periodic monitoring [15,16]. In this sense, the range limitation of field-testing methods can be solved by establishing estimation models with the combination of remote sensing data, providing a fast and effective way to monitor large-scale vegetation NPP [14,17,18]. The vegetation NPP estimation models can be broadly classified into statistical, parametric, and process models [19,20,21]. These three types of models were established sequentially from perspectives of climate, light energy utilization, and biogeochemical cycles, and the effective calculation at a global scale was achieved by combining remote sensing data of WorldView, Landsat, MODIS, and NOAA [22,23]. For example, the National Aeronautics and Space Administration (NASA) MOD17 product uses the BIOME-BGC model to simulate global vegetation NPP by quantifying the effective range of biomes and climate-induced shifts and distinguishing total vegetation production and autotrophic respiration processes, thereby avoiding the complexity of canopy micrometeorology and carbon balance theory [24,25,26]. These datasets have been validated and applied in investigations in different regions of the world. Researchers have obtained numerous results globally and locally by revealing the trends of NPP through modeling methods [27,28,29].
In the context of global climate change, owing to differences in characteristics such as geographical location, ecosystems have different responses to changes in temperature (TEM) and hydrological conditions depending on the region [30,31,32,33]. This distinct feature restricts the carbon sequestration potential of vegetation, resulting in large differences in the response of terrestrial NPP to climate change worldwide. Over the past 20 years, the global NPP generally displayed an increasing trend with significant improvements in tropical rainforests in Africa [34], subtropical regions [35], and the alpine Tibetan Plateau in China [36]. In contrast, the vegetation NPP monitored in Southeast Asia [37], western Amazonian tropical rainforests [37], temperate desert-steppe in Inner Mongolia of China [38], and semi-dry grasslands in Australia showed a decreasing trend [39]. Gang et al. found that the main changes in grassland NPP were positively correlated with precipitation (PRE) after comparing the analyses of grassland NPP in China, North America, Europe, and Australia from 1981 to 2010 [10]. Zhou et al. proposed that potential natural vegetation NPP in China was influenced by topographic factors [40]. Liu et al. observed a significantly increasing trend of vegetation NPP on the Tibetan Plateau from 2000 to 2020, with a growth rate of 1.67 gC·m−2·a−1, mainly due to a warming and humidifying climate [41]. After studying the vegetation NPP of the Yellow River Basin between 2000 and 2015, Zhang et al. commented that the vegetation NPP of the basin had regional differences and was significantly influenced by climatic factors, urbanization, and human activities such as land restoration [42].
From the previous literature, it can be concluded that the influencing factors of terrestrial vegetation NPP are complex and may be affected by climate warming and humidification, droughts and floods, topographic evolution, and changes in land use types such as urbanization or reforestation due to human activities. The natural conditions in various regions are significantly different, leading to differences in the main factors of NPP changes. The effects of climate and topography on the variations brought by NPP at different temporal and spatial scales have been extensively studied in general [43,44,45,46,47,48]. Meteorological, topographic, and soil moisture (SM) conditions vary greatly under different land cover types and have significant effects on vegetation CO2 uptake efficiency, and the land cover types will affect the NPP variability. In this sense, clarifying the spatial and temporal trends and drivers of NPP under various land cover types can help understand the roles of different land types in the carbon cycle of terrestrial ecosystems.
The Songnen Plain of China is chosen as the research area in this paper. This area is a typical agro-pastoral transition zone, with a fragile ecological environment and severe vegetation degradation with a long-term contradiction in the coordinated development of agricultural and pastoral land. Discussion on the spatiotemporal variations in NPP and its driving factors according to varying land cover types is of great practical significance for ecological pattern adjustment and sustainable development of Songnen Plain [49,50]. The objectives of this study are as follows: (1) to detect differences in spatiotemporal variations of net primary productivity (NPP) among different land cover types; (2) to compare the sensitivity of NPP to influencing factors across different land cover types; (3) to quantify the contributions of influencing factors to NPP and determine the primary driving factors for different land use types. The main contribution of this study lies in exploring the spatiotemporal variations and driving mechanisms of NPP in different land types of the Songnen Plain from a more comprehensive perspective, considering factors such as photosynthesis, water stress, and terrain differences. This research provides a basis for decision-makers to implement targeted land use adjustments and environmental restoration measures.

2. Materials and Methods
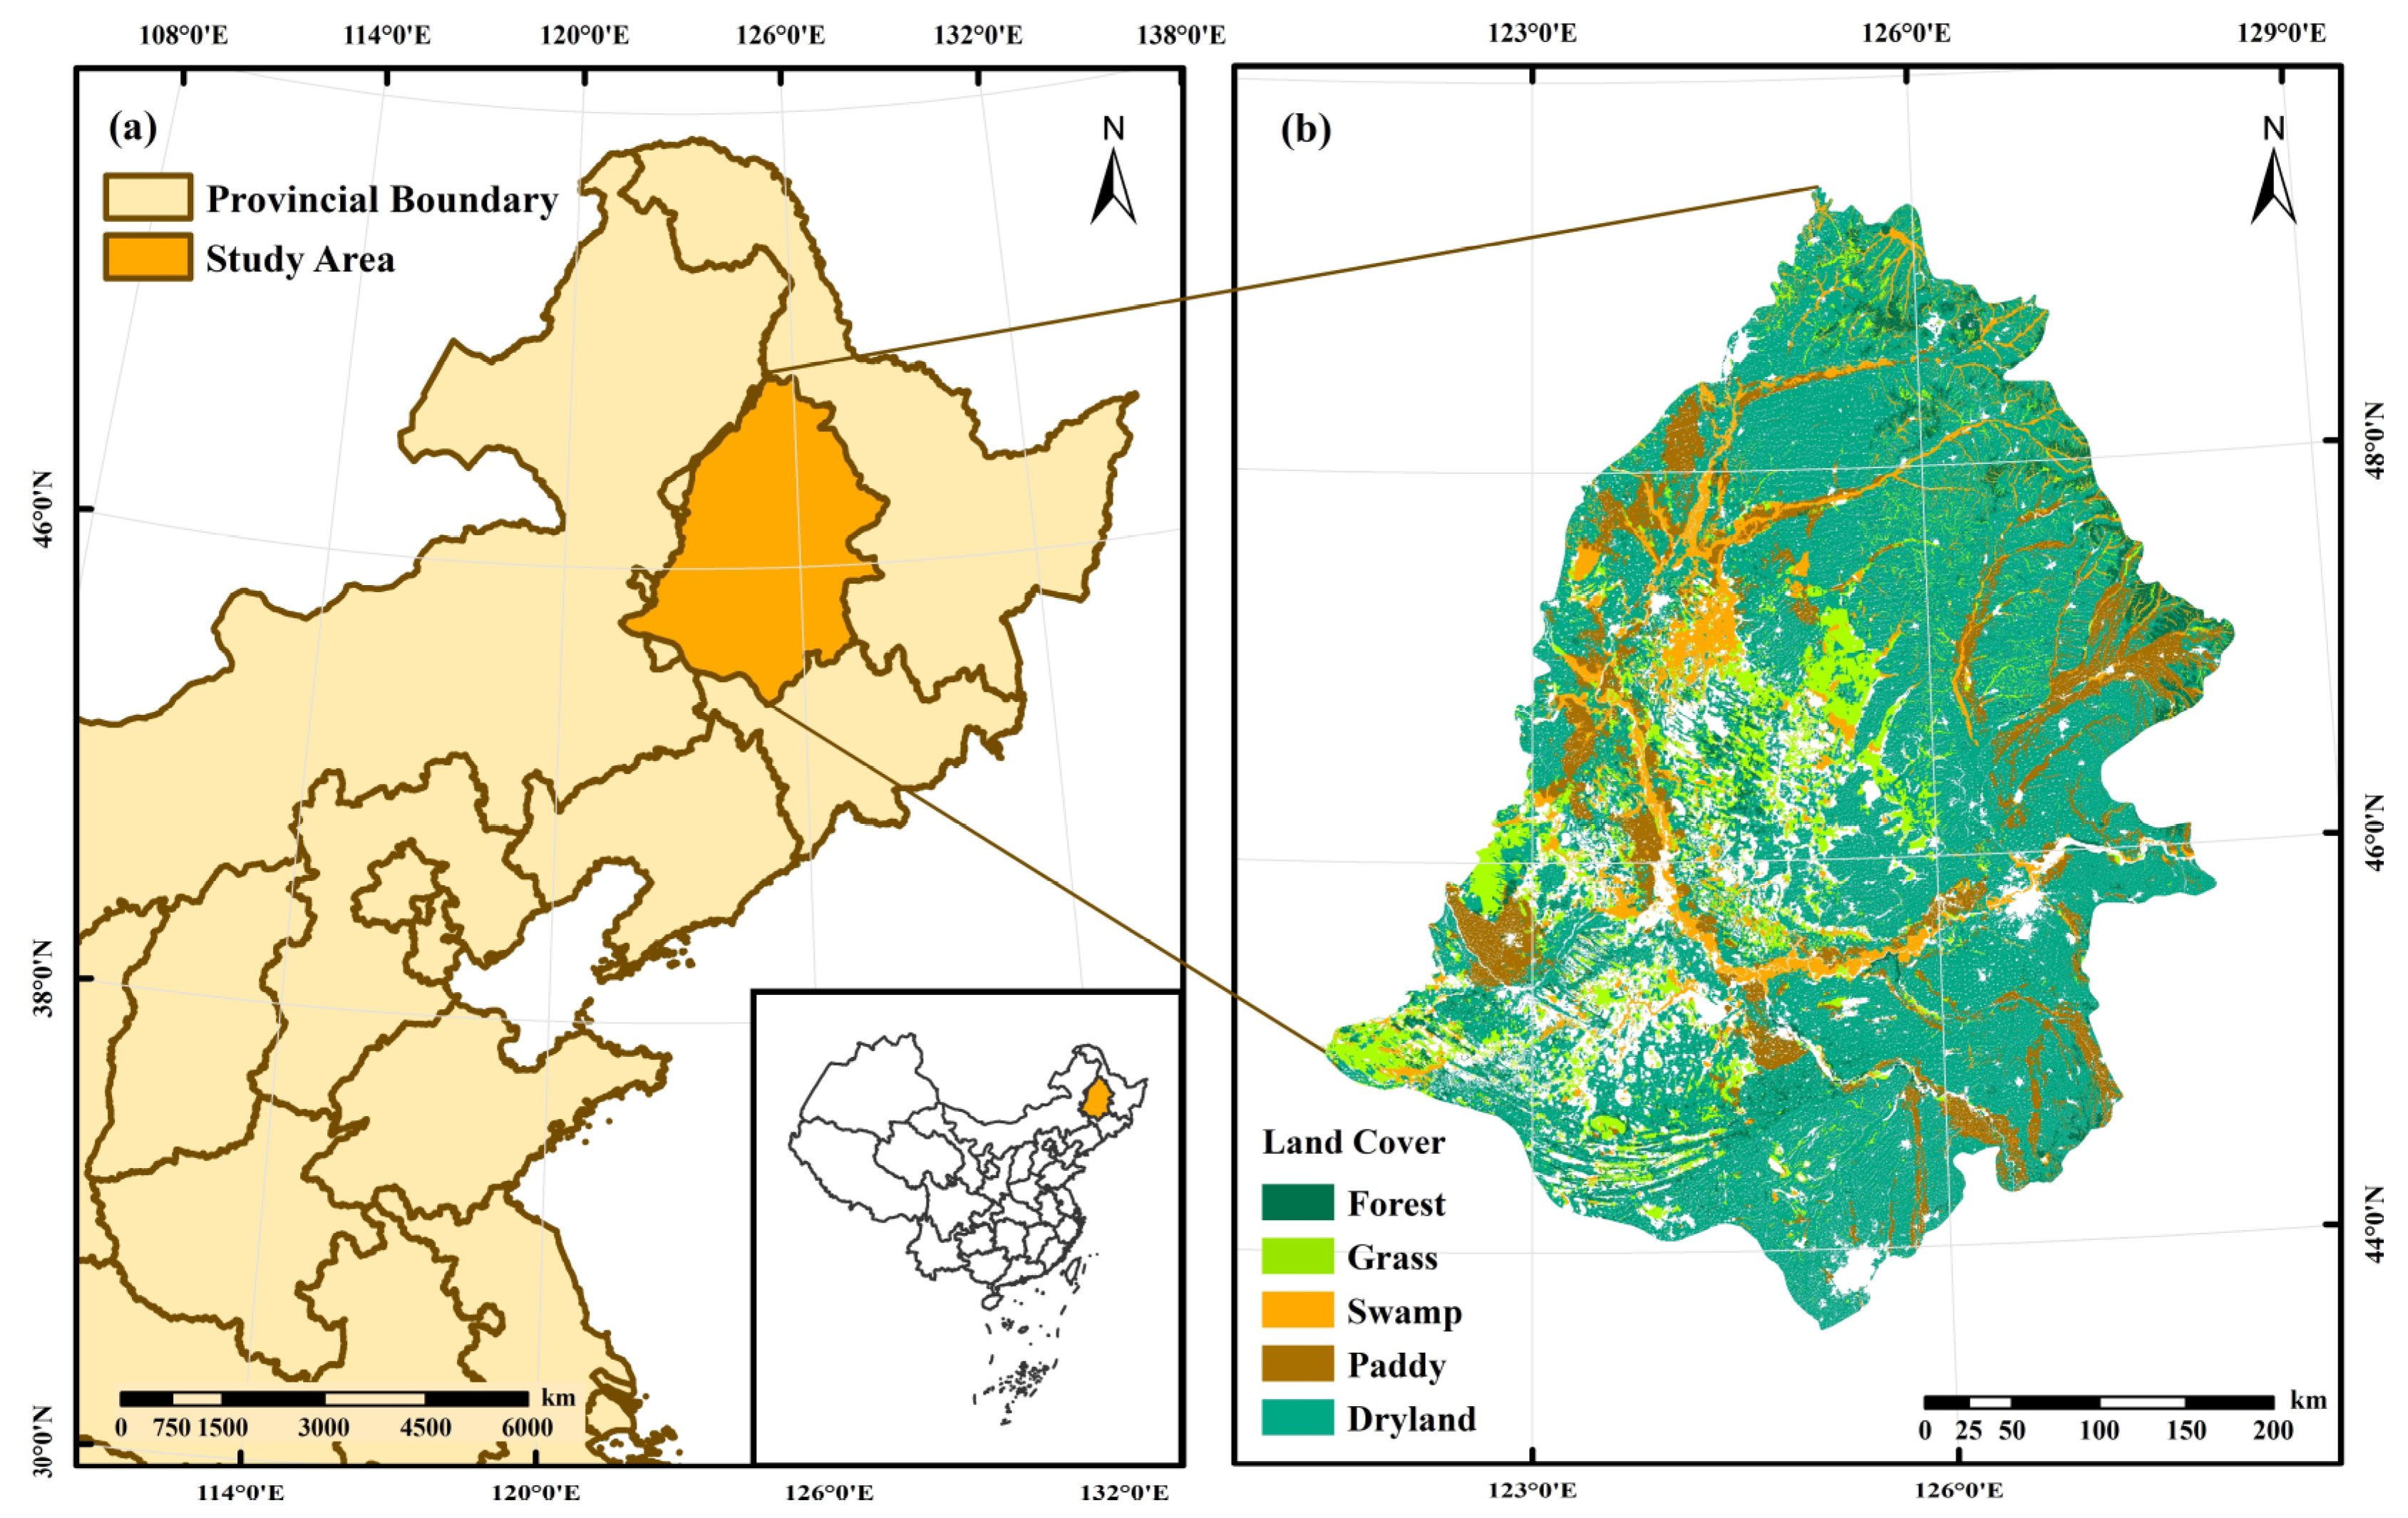
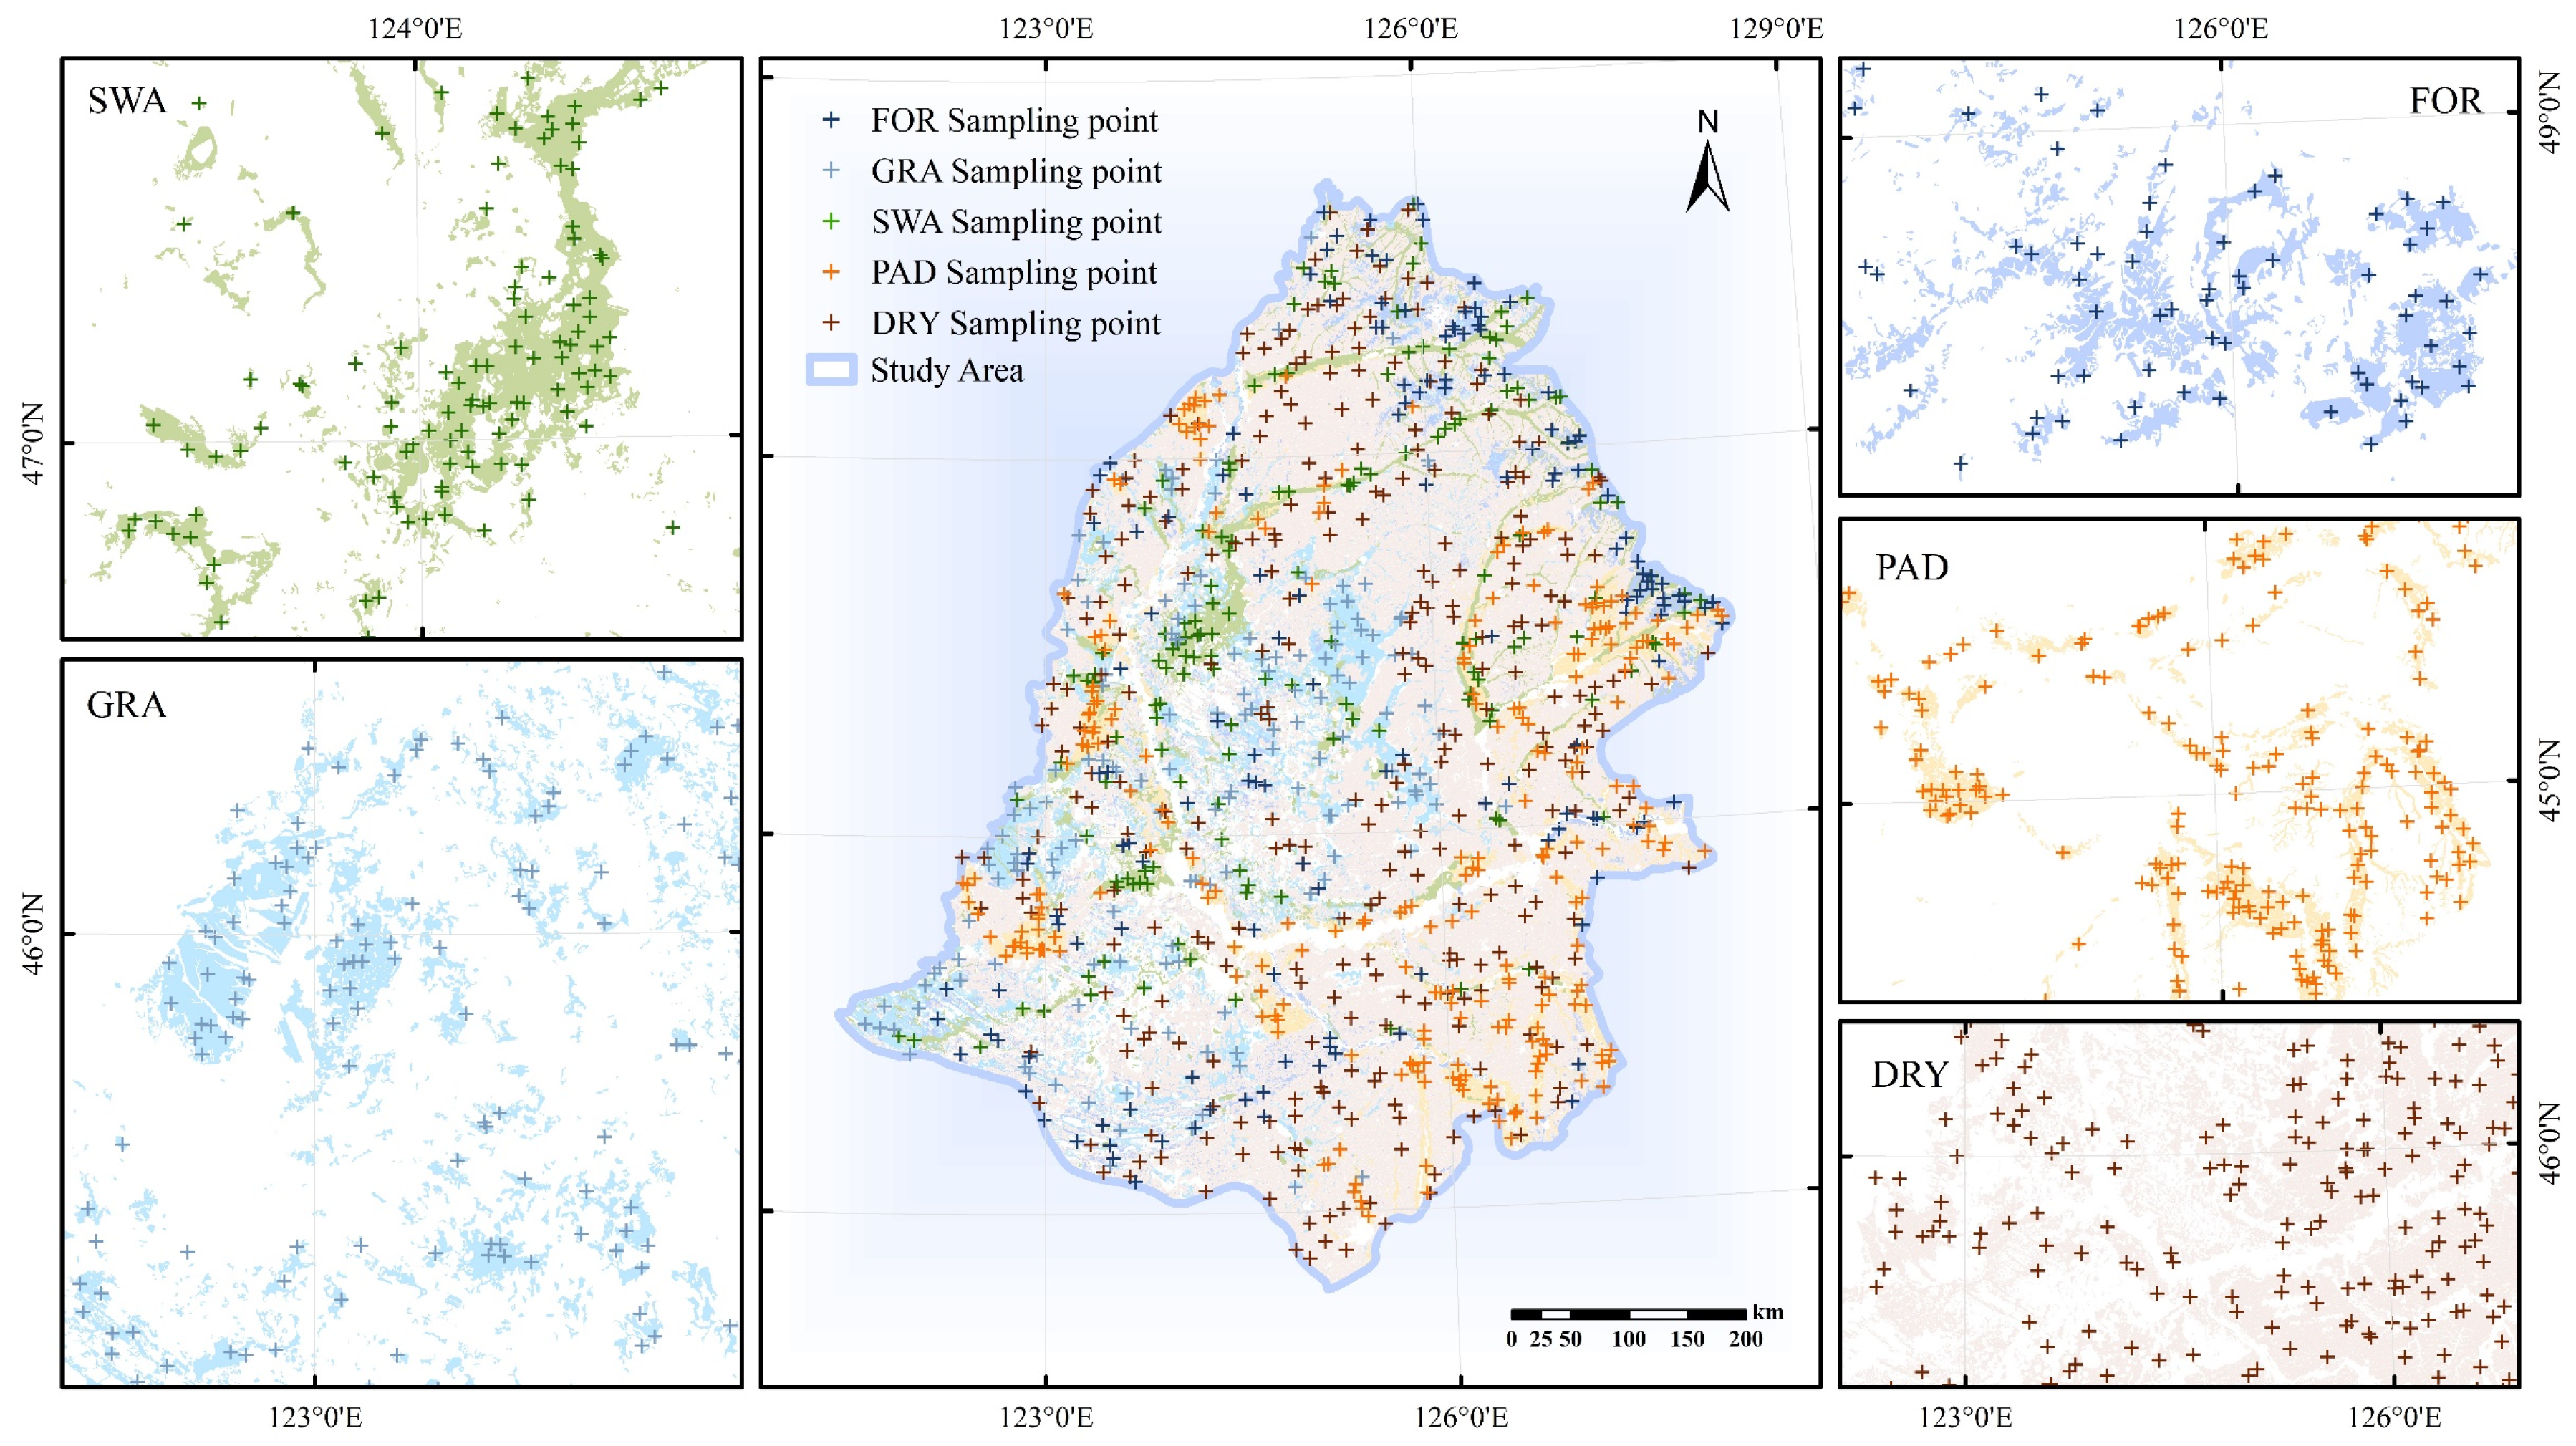
With the differences in water stress caused by climate change, photosynthesis, and vegetation growth environment brought by geomorphology as the perspective, we select the MOD17A3HGF product as the data source to analyze the spatial and temporal variation characteristics of NPP under various land cover types in the study area and to probe into the influencing factors. Specifically, this study first analyzed the spatial and temporal variation characteristics of NPP for different land cover types from 2001 to 2020. Secondly, the correlation between NPP and various land cover types considering factors such as TEM, PRE, sunshine hours (SUN), evaporation (EVA), slope, and SM was found. Finally, a driving force model was built based on the elastic net algorithm quantitative analysis of the contributions of various influencing factors to NPP, the main driving factors of NPP under different coverage types were clarified, and the transformation relationship of NPP among different land classes was found (Figure 1).

2.1. Study Area

The Songnen Plain (43°36′–49°26′ N, 121°21′–128°18′ E) is located among the Daxing’an and Xiaoxing’an Mountains, the Changbai Mountain Range, and the Song-Liao Watershed in northeastern China, with a total area of about 187,000 km2, mainly formed by the alluvial deposits of the Songhua and Nenjiang rivers (Figure 2). The Songnen Plain can be divided into three geomorphic units: the eastern uplifted area, the western plateau area, and the alluvial plain area. The piedmont plateaus are distributed to the east, north, and west, with elevations ranging from about 180 to 300 m. The alluvial plain area, on the other hand, has elevations ranging from 110 to 180 m, with a flat and expansive topography. The study area is located in a semi-arid and semi-humid transition zone at high latitudes in the eastern part of the Asian continent, with a typical continental monsoon climate characterized by distinct seasons, high temperature and rain in summer, cold and dry climate in winter, and short and rapid temperature changes in the two transitional seasons of spring and autumn [51]. The annual average temperature gradually increases from north to south, and the temperature contour shows a clear dimensional zonal distribution; the annual precipitation is 400–600 mm, gradually decreasing from east to west; the period from June to August is the flood season, with concentrated and extreme rainfall (60%–80% of the annual precipitation) [52]. It serves as an important black soil area, wetland concentrated distribution area, and commercial grain base in China.

2.2. Data Sources

The dataset used in this study is shown in Table 1.

2.2.1. NPP Data

The vegetation NPP data were obtained from the NASA EOS/MODIS dataset of MOD17 NPP products for 2001–2020 (https://lpdaac.usgs.gov/ (accessed on 7 August 2023)). The temporal resolution is 8 days and annual synthetics, and the spatial resolution is 500 m. MOD17A3HGF version 6.0 is an improvement of MOD17A3 based on the BIOME-BGC and light energy utilization models [27,53,54,55]. NPP values were simulated using the new Biome specified Parameters Look-Up Table (BPLUT) and the latest version of the Global Modeling and Assimilation Office (GMAO) daily meteorological data, further improving N P P estimation accuracy. It integrates a light use efficiency logic to estimate the gross primary productivity equation using remotely sensed vegetation information and a maintenance and growth respiration module to derive the N P P equation.
G P P = L U E max × f T min × f v p d × 0.45 × S W r a d × F P A R
N P P = G P P R M R G
where G P P denotes the gross primary productivity, L U E max is the maximum light use efficiency, regulated by f T min and f v p d , to address water stress ( T min ) and vapor pressure deficit (VPD) caused by low temperature. S W r a d stands for the short-wave solar radiation load, 45% of which is for photosynthetic activity. F P A R represents the percentage of absorbed photosynthetically active radiation. R M is used by vegetation to maintain its respiration and is estimated from the leaf area index (LAI) [56,57], climate data, and biome-specific parameters. R G indicates the energy cost of organic compounds fixed by vegetation for its growth respiration, calculated as a function of the maximum annual LAI. According to the calculation principle, the land types with low vegetation cover lack the conditions to form NPP, and those with vegetation cover were selected as the study object in combination with the land use situation of the Songnen Plain.

2.2.2. Land Cover Data

This paper utilizes the Landsat series of remote sensing data from the United States Geological Survey (USGS) Earth Explorer (https://earthexplorer.usgs.gov/ (accessed on 7 August 2023)). Landsat-based remote sensing data were used to extract information on land cover types. The data comprise two types: Landsat 7 ETM (2001–2013) and Landsat 8 OLI (2014–2020). Remote sensing images with consistent high vegetation coverage during the period from June to September each year and with cloud cover below 5% were selected. Orthogonal signal correction, layer overlay, sharpening, etc. were performed on the extracted images. By combining the characteristics of MOD17 data with the actual distribution in the Songnen Plain area using the land cover data classification system, the land cover types were classified into five types: forest land (FOR), grassland (GRA), swamp (SWA), dry land (DRY), and paddy field (PAD). Dry land refers to cultivated land without irrigation facilities, primarily relying on natural precipitation to grow drought-resistant crops. Based on the characteristics of colors and textures presented in the images, the remote sensing automatic classification markers of different ground cover types were established. Based on a geographical information system platform and by using the automated classification method, major land cover data in the Songnen Plain were obtained (Figure 2b, taking 2020 as an example).

2.2.3. Influencing Factor Data

To further explore the factors affecting the spatial and temporal variations in NPP, TEM, PRE, SM, slope, and elevation were selected as the influencing factors of NPP. Meteorological data were obtained from the National Meteorological Information Center of China (http://www.nmic.cn/ (accessed on 7 August 2023)), involving PRE (mm), TEM (°C), SUN (h), and EVA (mm) for 40 meteorological stations in and around the Songnen Plain from 2001 to 2020. SM information was acquired from the National Oceanic and Atmospheric Administration of the United States (http://www.esrl.noaa.gov/psd/data/gridded/data.cpcsoil.html (accessed on 7 August 2023)) using a global observed PRE- and TEM-driven land surface process model. The spatial resolution is 0.5° × 0.5°, the temporal resolution is at monthly and annual scales, and the vertical layer is 1 layer (0–160 cm). The information has a long time series and a good simulation of the seasonal and interannual variability characteristics of SM. The considered terrain feature data were collected from NASA Earthdata (https://search.earthdata.nasa.gov/ (accessed on 7 August 2023)), which provides 30 m spatial resolution digital elevation model (DEM) data covering land globally. The considered terrain feature data mainly include two types: elevation data and slope data. According to the spatial resolution of the NPP data, all influencing factors are uniformly resampled to 500 m after pre-processing, such as projection transformation, spatial interpolation, clipping, and shearing. All the influencing factor data were resampled to a uniform resolution of 500 m.

2.3. Methods

2.3.1. Trend Analysis

In this study, the variation trend of NPP by pixels was analyzed using the Theil–Sen median. The Theil–Sen median is a robust non-parametric statistical method for trend calculation, which is insensitive to outliers and requires limited priori information on measurement errors [58]. Compared with Sen’s slope method commonly used in previous studies, the Theil–Sen median can more effectively avoid the influence of outliers when there are fewer sample points [59,60]. The above equation is:
K = M e d i a n N P P j N P P i j i ( 1 < i < j < n )
where K —slope, N P P j and N P P i —the annual average values of NPP in years i and j . When K < 0, it means that NPP has a decreasing trend during the study period, and when K > 0, it means that NPP has an increasing trend during the study period.

2.3.2. Significance Test

The Mann–Kendall test is a non-parametric test that can effectively avoid the effects of missing data and outliers on the results. It is usually used to test the significance of trends in long time series and has been widely used in meteorological, hydrological, and vegetation studies [61,62,63]. Its calculation method is as follows:
Assuming that N P P = N P P 1 , N P P 2 , , N P P n is a time series variable, the test statistic Z is calculated as:
Z = S 1 V a r ( S ) , ( S > 0 ) 0 ,           ( S = 0 ) S + 1 V a r ( S ) , ( S < 0 )
S = i = 1 n 1 j = i + 1 n sgn ( N P P j N P P i )
sgn ( N P P j N P P i ) = 1 , N P P j N P P i > 0 0 , N P P j N P P i = 0 1 , N P P j N P P i < 0
V a r ( s ) = n ( n 1 ) ( 2 n + 5 ) / 18
where n is the study period (20 years: 2001–2020), N P P j and N P P i are the sequence numbers of pixels, α is the confidence level, and Z 1 α / 2 is the standard normal variance. When Z Z 1 α / 2 , the α confidence level is set at 0.01, 0.05, and 0.1 to indicate that the trend of change passed the significance test [64].

2.3.3. Correlation Analysis

Pearson correlation coefficients (PCCs) were utilized in Matlab 9.1.0 R2016b to calculate the correlation coefficients of NPP with each meteorological factor and each image of soil water. Pearson correlation analysis is suitable for detecting the presence of a correlation between two continuous variables [65]. The equations are as follows:
R = i = 1 n x i x ¯ y i y ¯ i = 1 n x i x ¯ 2 i = 1 n y i y ¯ 2
where n is the study period (2001–2020, 20 years) and i is the number of years; x i , y i are the values of the two variables x , y in year i ; x ¯ , y ¯ are the average values of the two factors in year n .

2.3.4. Elastic Net Regression

The variable selection method of elastic net was first proposed by Zou and Hastie in 2005 [66]. The basic principle is to control the model learning process by adding a restriction term to the minimization loss function to prevent data overfitting when dealing with data with linear relationships [67]. The commonly used regularization methods are L 1 regularization and L 2 regularization. L 1 regularization (lasso regression) enhances the generalization ability of the model by adding an L 1 penalty to the coefficients, making it possible to perform both continuous compression and automatic selection of variables, which can make the coefficients of some features smaller. L 2 regularization (ridge regression) prevents the problem of overfitting by finding the minimum of the loss function, and can deal well with the parameter estimation problem in the presence of multicollinearity in the independent variables, but does not refine the model and usually retains all predictor variables in the model. In contrast, elastic net regression is a combination of L 1 regularization and L 2 regularization, which essentially gives up the unbiasedness and partial accuracy of the least squares method and seeks a less effective but more realistic regression process, mainly by adding a penalty term to the loss function, so that the model can both feature selection to avoid data redundancy and achieve overfitting prevention while the model is stable. The mathematical expression of the elastic net regression theory model is defined as follows:
y = β ^ 0 + β ^ 1 x 1 + β ^ 2 x 2 + + β ^ k x k + ε
where x represents each influencing factor leading to NPP change, y represents the percentage of NPP change per unit area, β ^ represents the model regression coefficient, and ε represents the random error of modeling. Based on the least squares principle, the elastic net regression minimization objective function can be solved by adding the L 1 and L 2 regularization ideas, and its specific mathematical expressions are defined as follows:
The L 1 regularization term is:
L 1 = λ ρ w 1
The L 2 regularization term is:
L 2 = λ 1 ρ 2 w 2 2
The loss function is:
J = i = 1 N y i w T x i 2 + λ ρ w 1 + λ 1 ρ 2 w 2 2
The expression of the regression coefficient is:
β ^ = arg min 1 2 i = 1 N y i w T x i 2 + λ ρ w 1 + λ 1 ρ 2 w 2 2
where x i , y i is the sampled data, x i is the feature vector, y i is the corresponding dependent variable, w is the feature weight vector, λ is the penalization factor, ρ is the elasticity factor. ρ can regulate the proportion of lasso regression and ridge regression. When ρ = 0 the above equation becomes lasso regression, when ρ = 1 the above equation becomes ridge regression. In this paper, the trial-and-error method is used to calculate the parameters λ and ρ , which take values in the interval of 0.01–0.99. The results showed that the loss function J is minimized when λ = 0.30 and ρ = 0.45.

3. Results

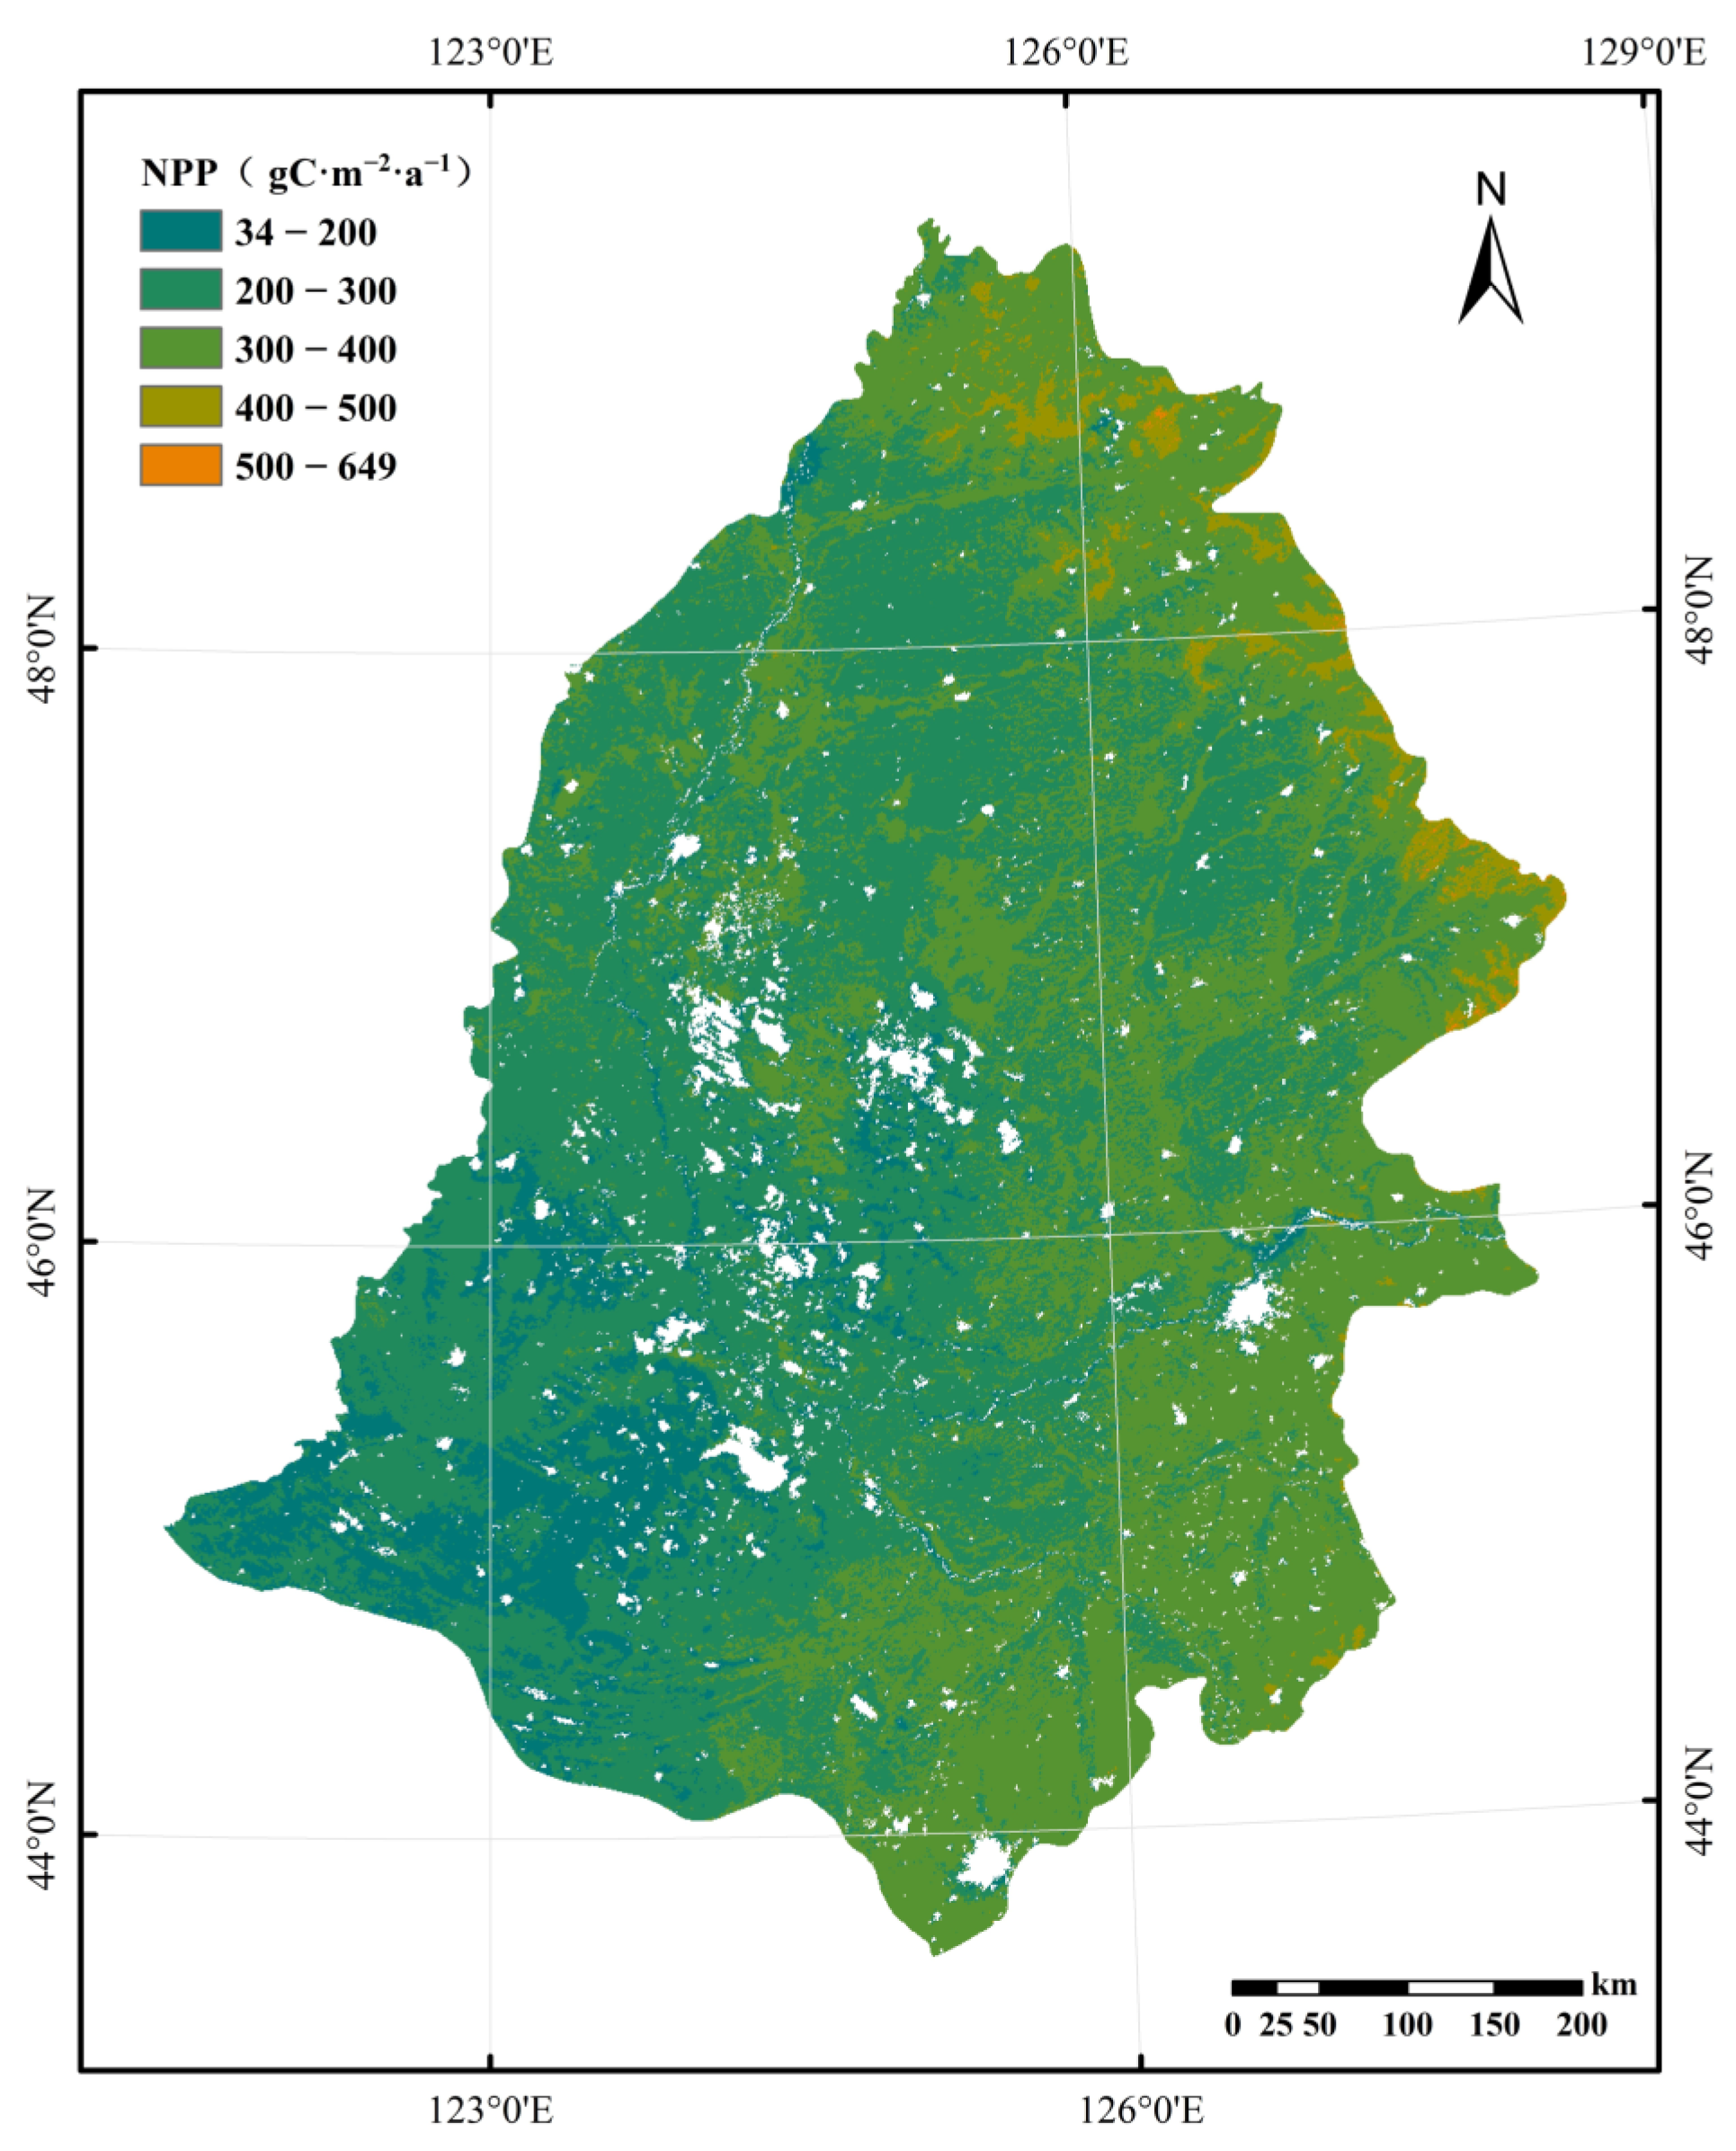
3.1. Spatial–Temporal Variations of NPP in the Songnen Plain

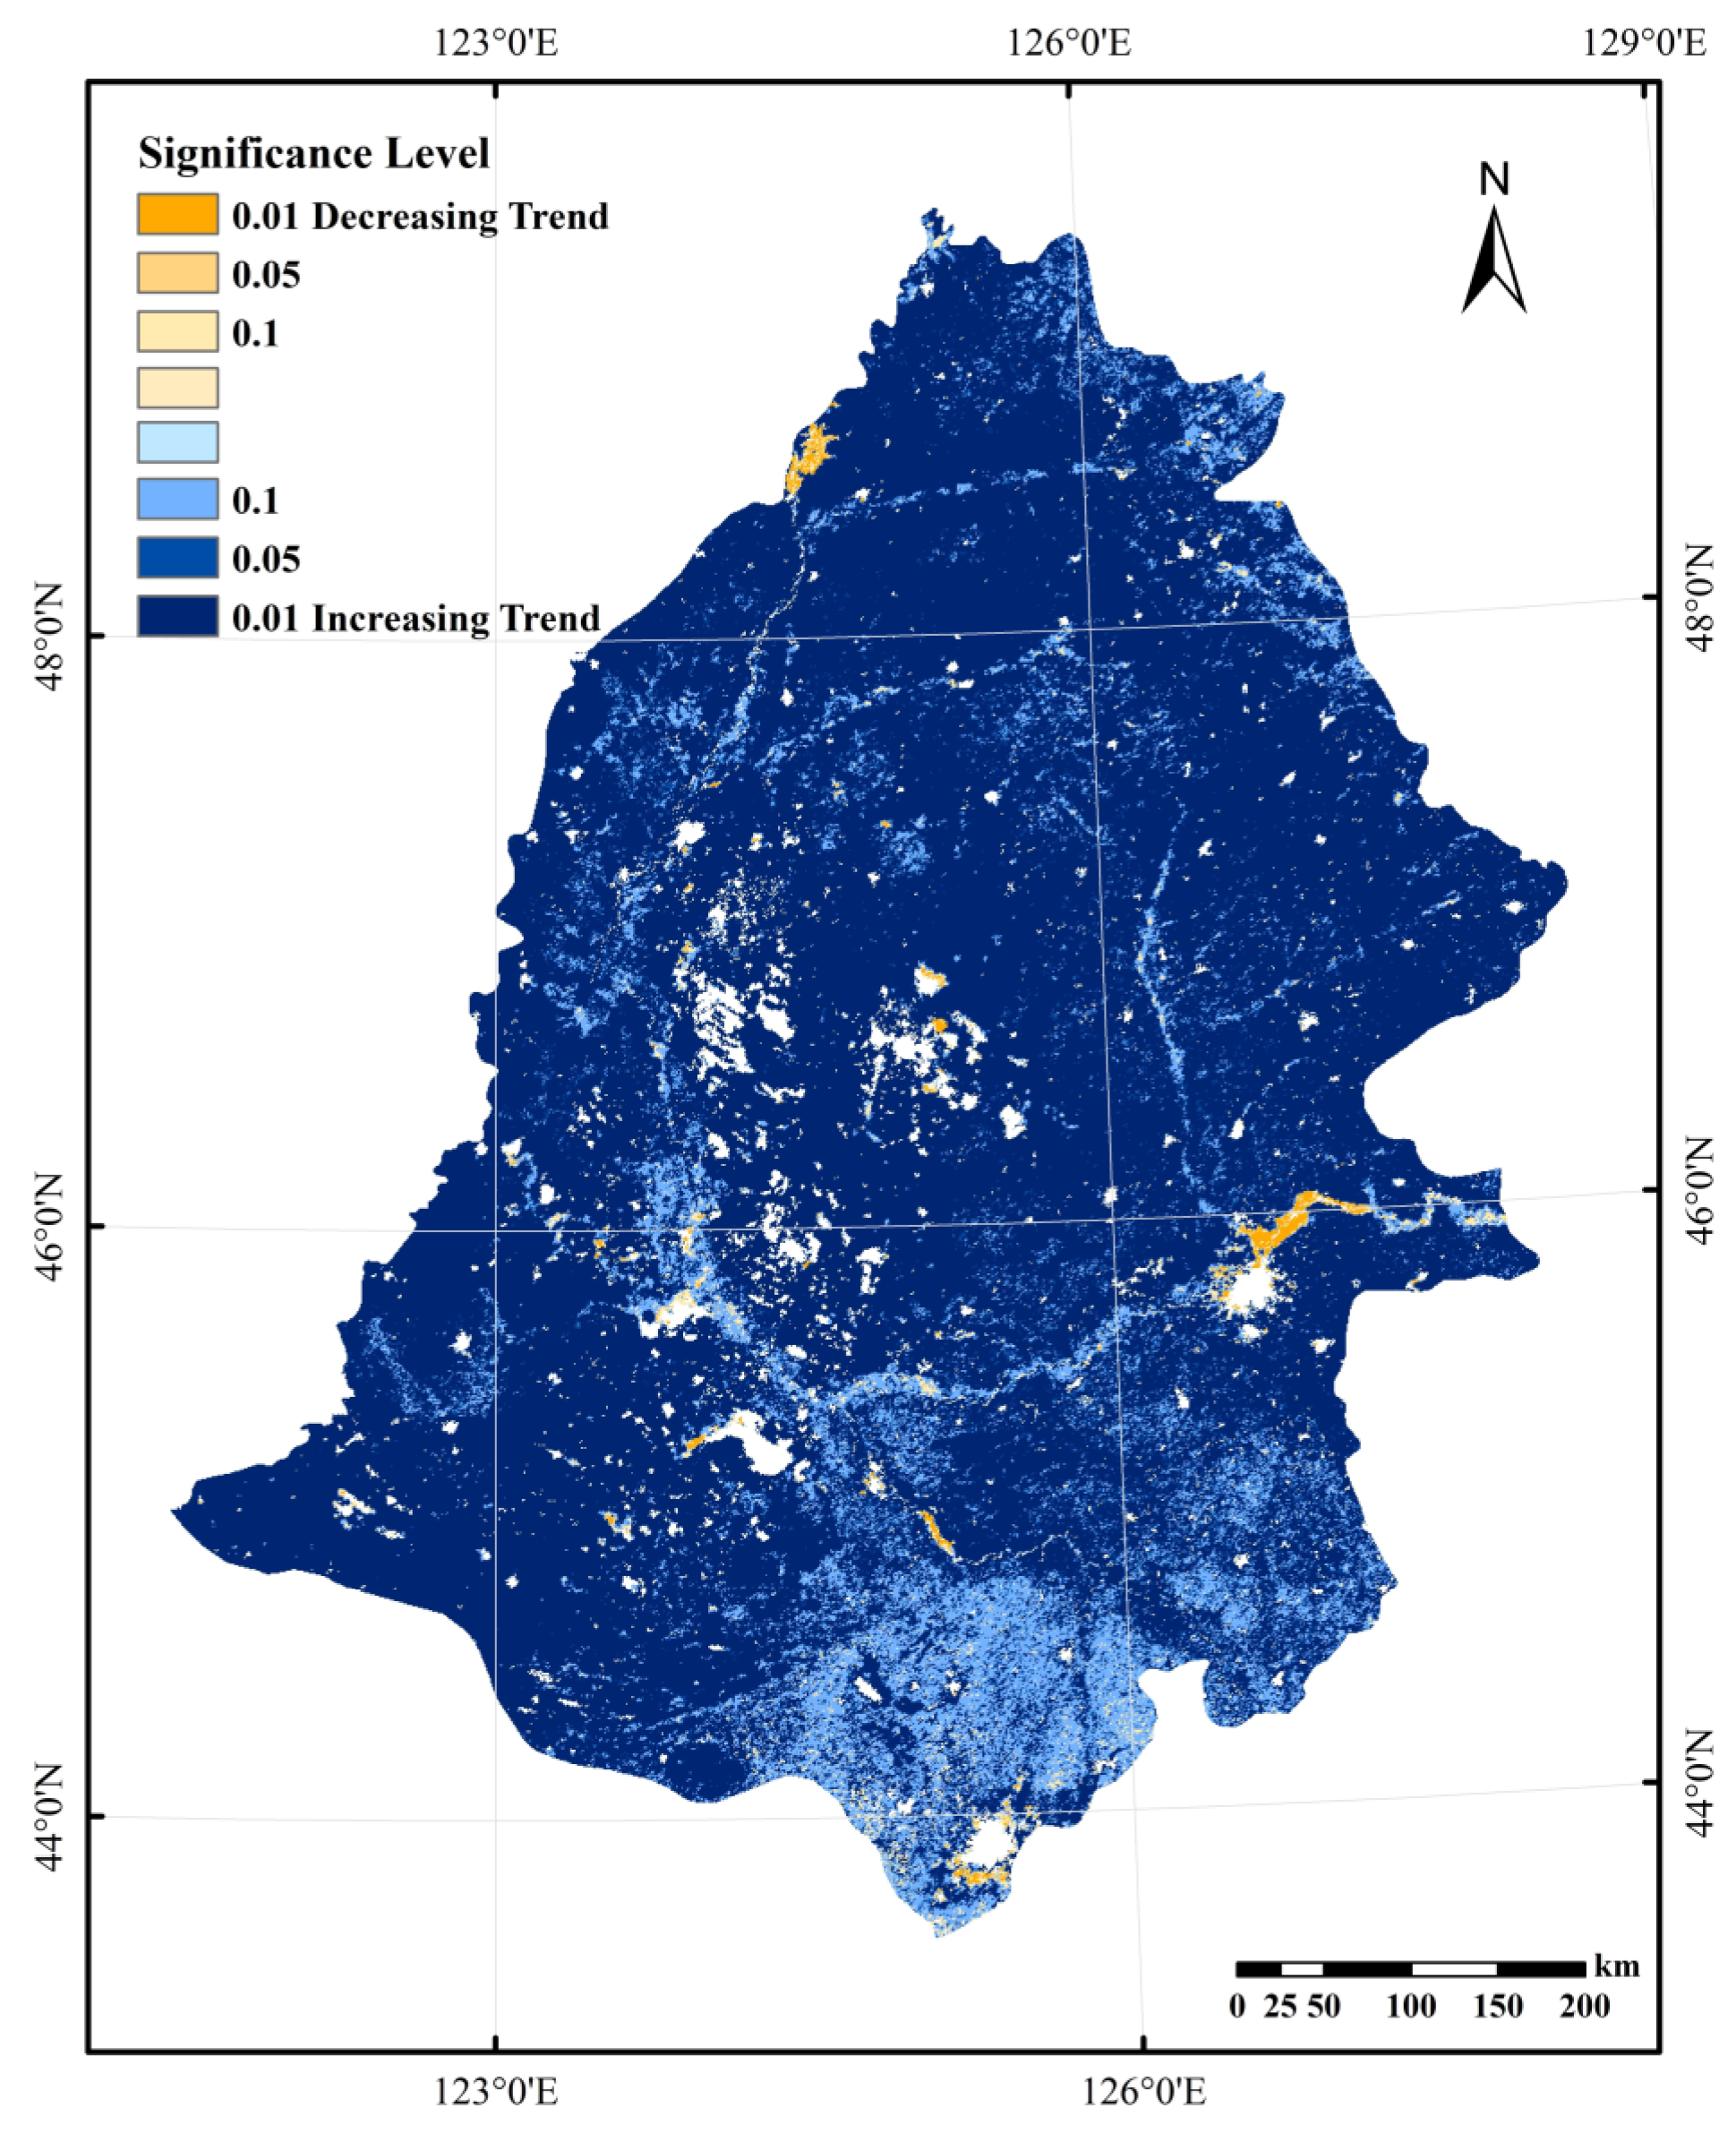
3.1.1. Characteristics of Interannual Variability

Using the MOD17 data of Songnen Plain from 2001 to 2020, the characteristics of annual mean NPP were statistically analyzed, the NPP range was divided into five levels equidistantly according to the distribution of NPP values, and the distribution of each interval was analyzed. It was demonstrated that the spatial distribution of NPP varied significantly in the study area, showing an increasing trend from southwest to northeast (Figure 3). The average value of NPP in the unit pixel is between 34.32 and 649.01 gC·m−2·a−1. The NPP low-value area (34.32–300 gC·m−2·a−1) accounts for 58.22% of the total area, mainly concentrated in the southwestern central part of the study area. The NPP high-value area (400–649 gC·m−2·a−1) occupies only 2.27% of the total area, centered in the northeastern part.
To investigate the temporal variation characteristics of NPP for various land cover types, this study conducted an overlay analysis of national vegetation coverage data and land use data. NPP was sorted by type of land cover, and the arithmetic mean NPP within each land cover category per year was calculated. Figure 4 shows the interannual variation trends of NPP on FOR, GRA, SWA, DRY, and PAD from 2001 to 2020. It can be seen that the annual mean values of NPP differ significantly among the five land cover types, with FOR having the largest value (364.02 gC·m−2·a−1) and the rest being DRY (312.66 gC·m−2·a−1), PAD (304.79 gC·m−2·a−1), and SWA (304.14 gC·m−2·a−1) sequentially. The lowest annual mean NPP is found in the GRA area, only 280.78 gC·m−2·a−1. The temporal changing characteristics of NPP for various land cover types show a consistently increasing trend, with the peak occurring in 2014. Among them, the most significant increasing trend of NPP is observed in the FOR region with a growth rate of 8.47 gC·m−2·a−1, and the slowest growth of NPP is seen in the DRY region with a growth rate of 5.47 gC·m−2·a−1.
To examine the spatial variation of NPP, MOD17 data from 2001 to 2020 in the Songnen Plain were employed, the trends of NPP were analyzed using the Theil–Sen median, and the significance of these trends was tested using the Mann–Kendall trend test. α is defined as the level of the significance test. α = 0.1, 0.05, and 0.01 correspond to Z 1.645, 1.96, and 2.576, indicating that the study series pass 90%, 95%, and 99% confidence tests of significance, respectively. Z 1.645 suggests that the study series do not pass the significance test with a 90% confidence level. The spatial distribution trends of NPP from 2001 to 2020 (Figure 5) show that 98.46% of the study area has an increasing trend of NPP, and only 1.53% exhibits a decreasing trend, concentrated in the eastern and northwestern part of the study area. Notably, 83.96% of the region with an upward trend in NPP passes the significance test level of α = 0.01, showing a highly significant upward trend.

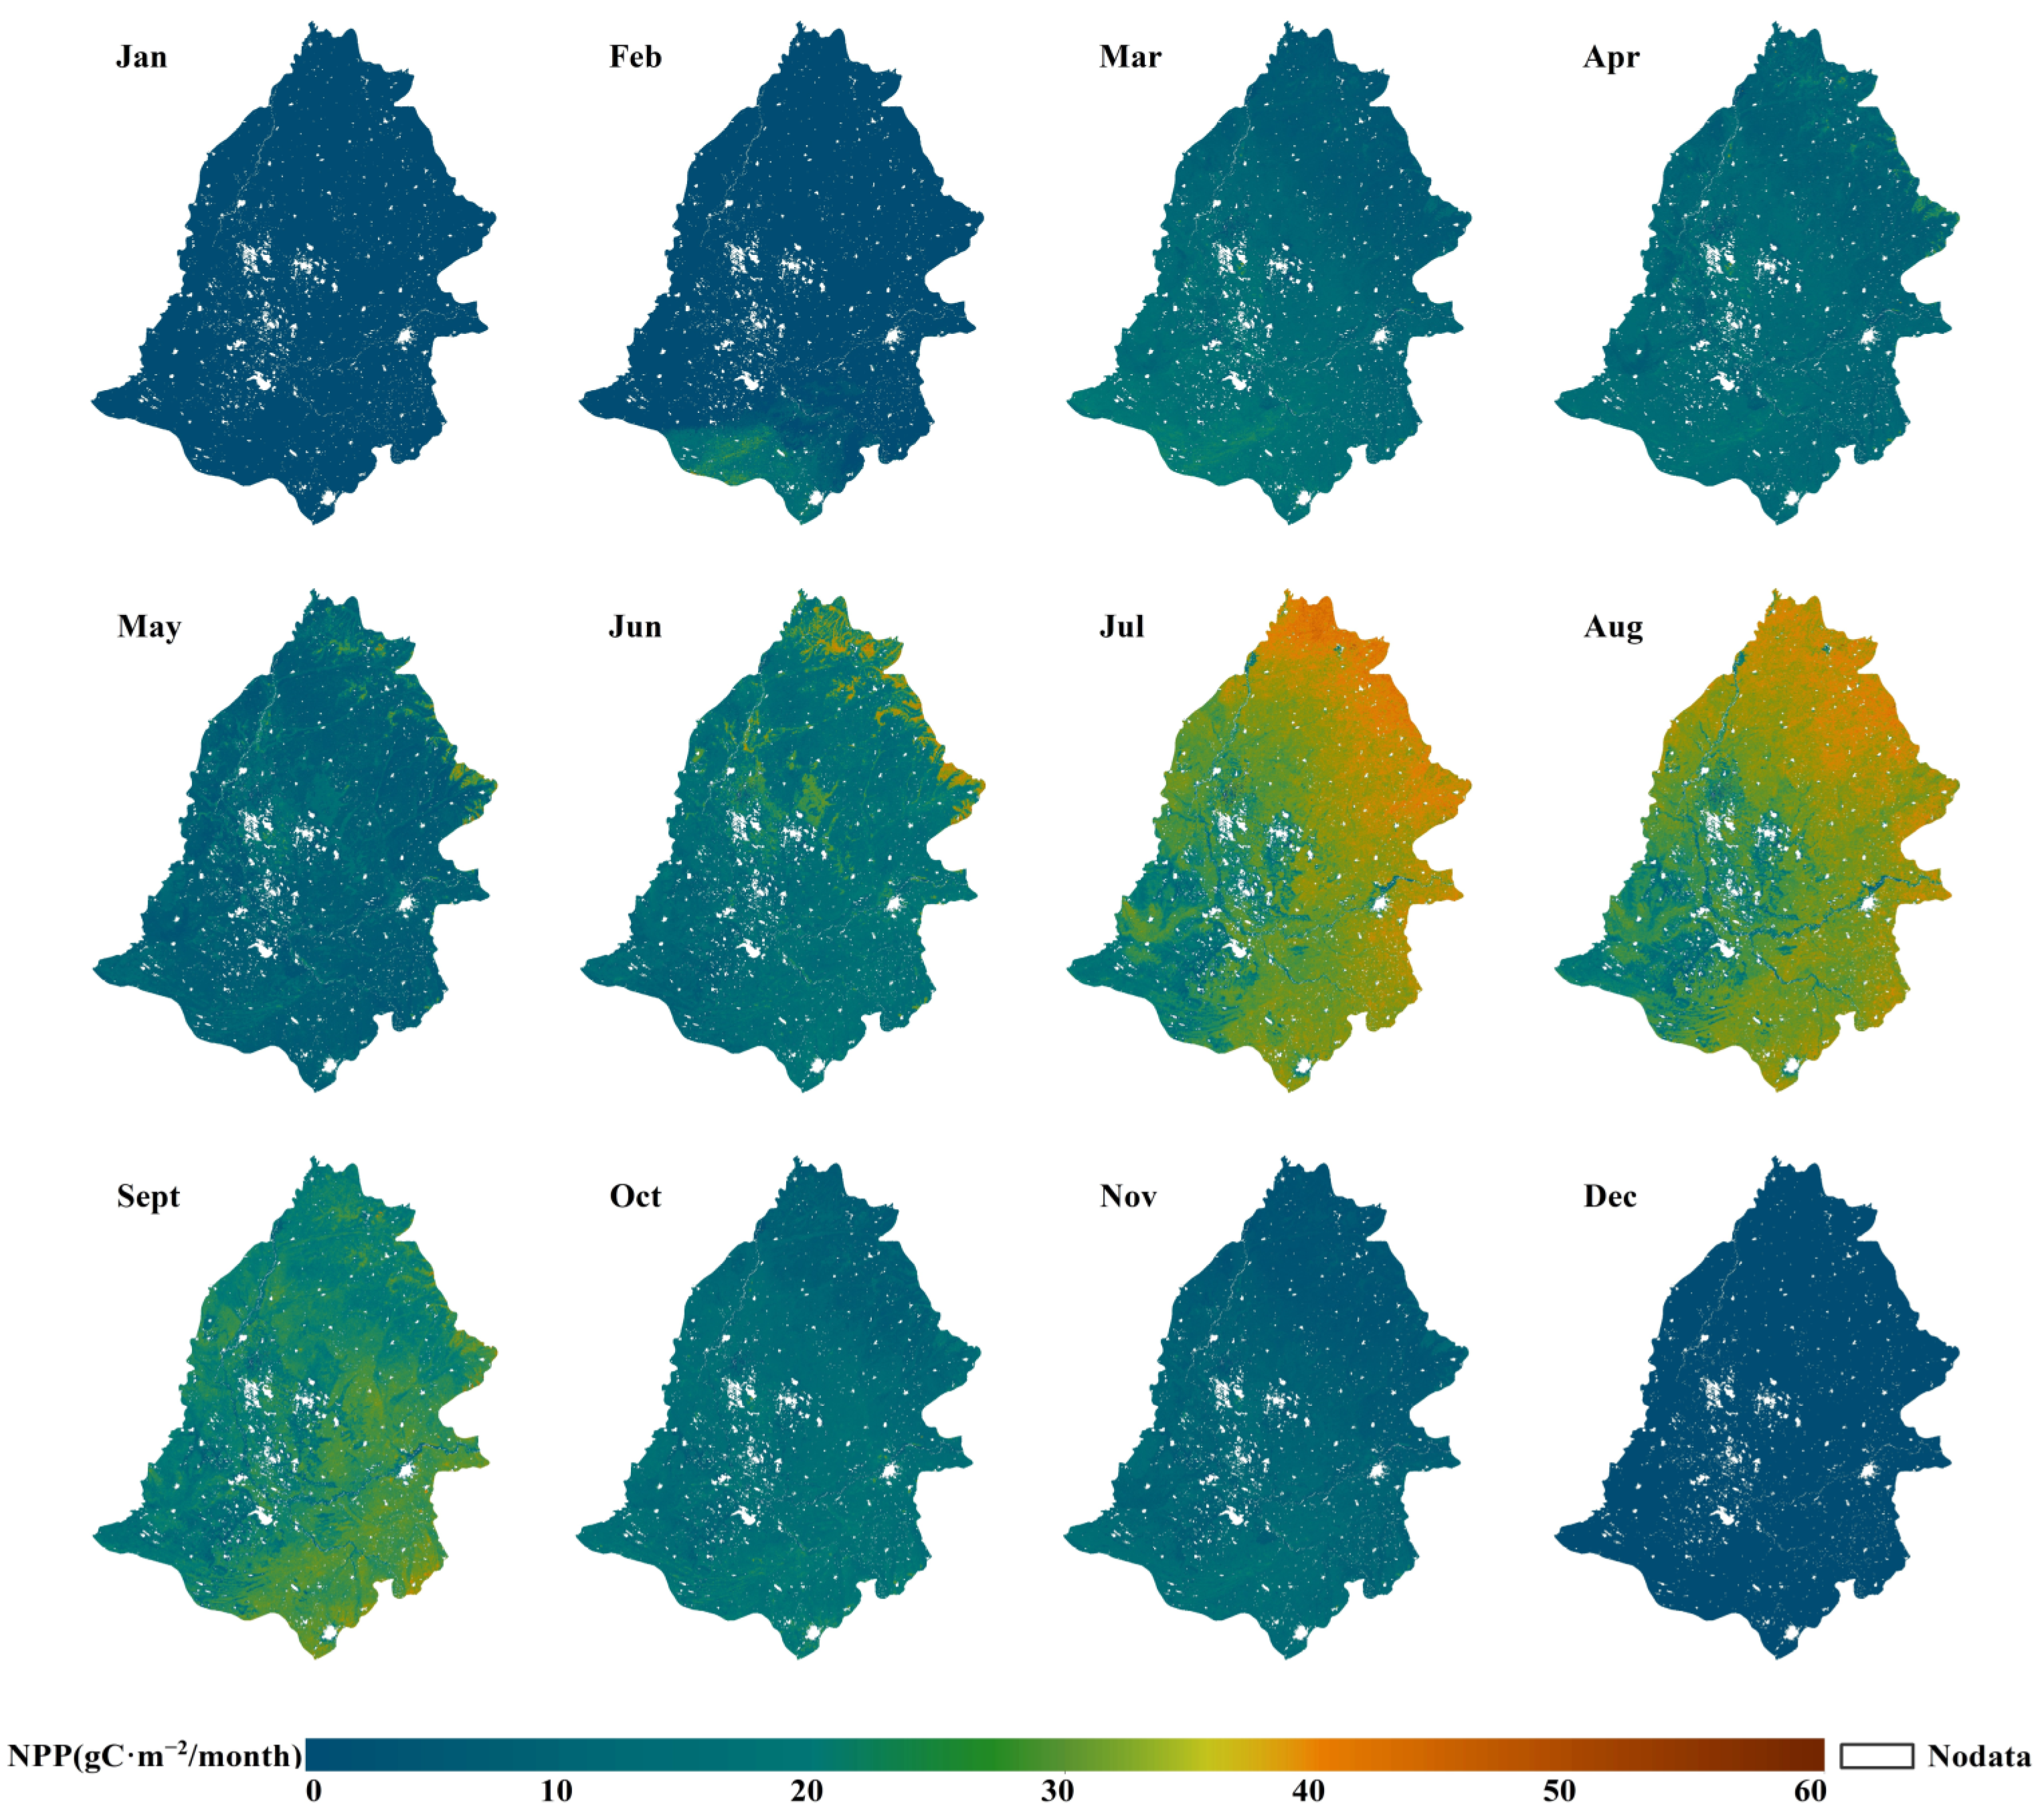
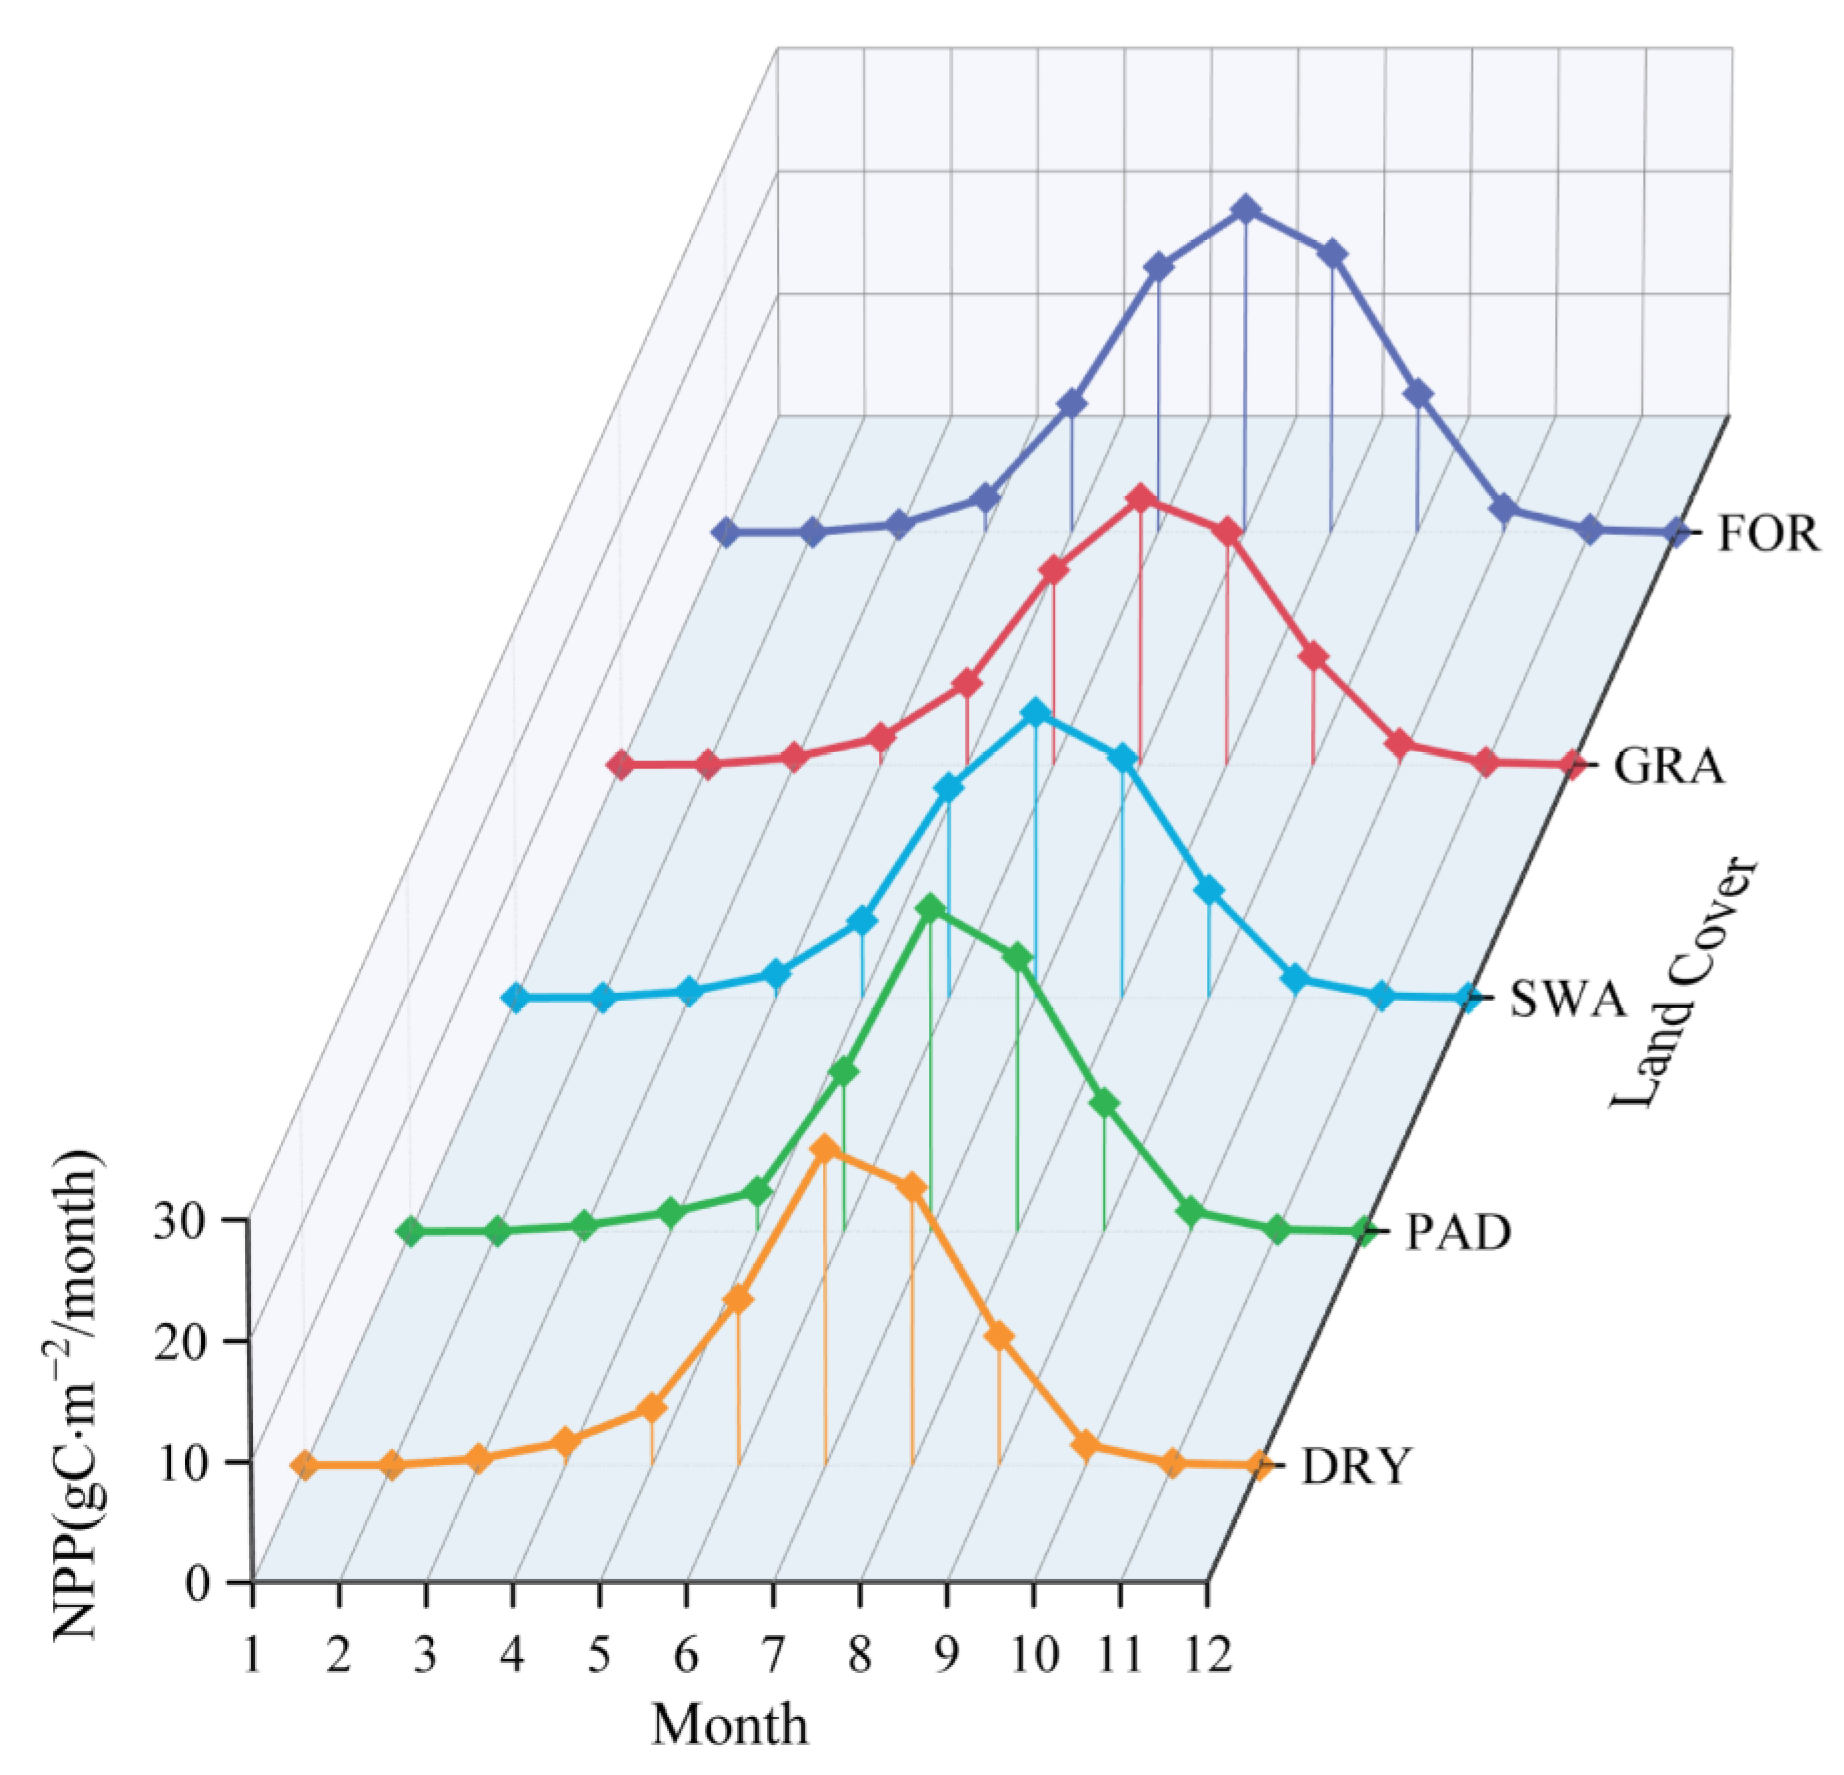
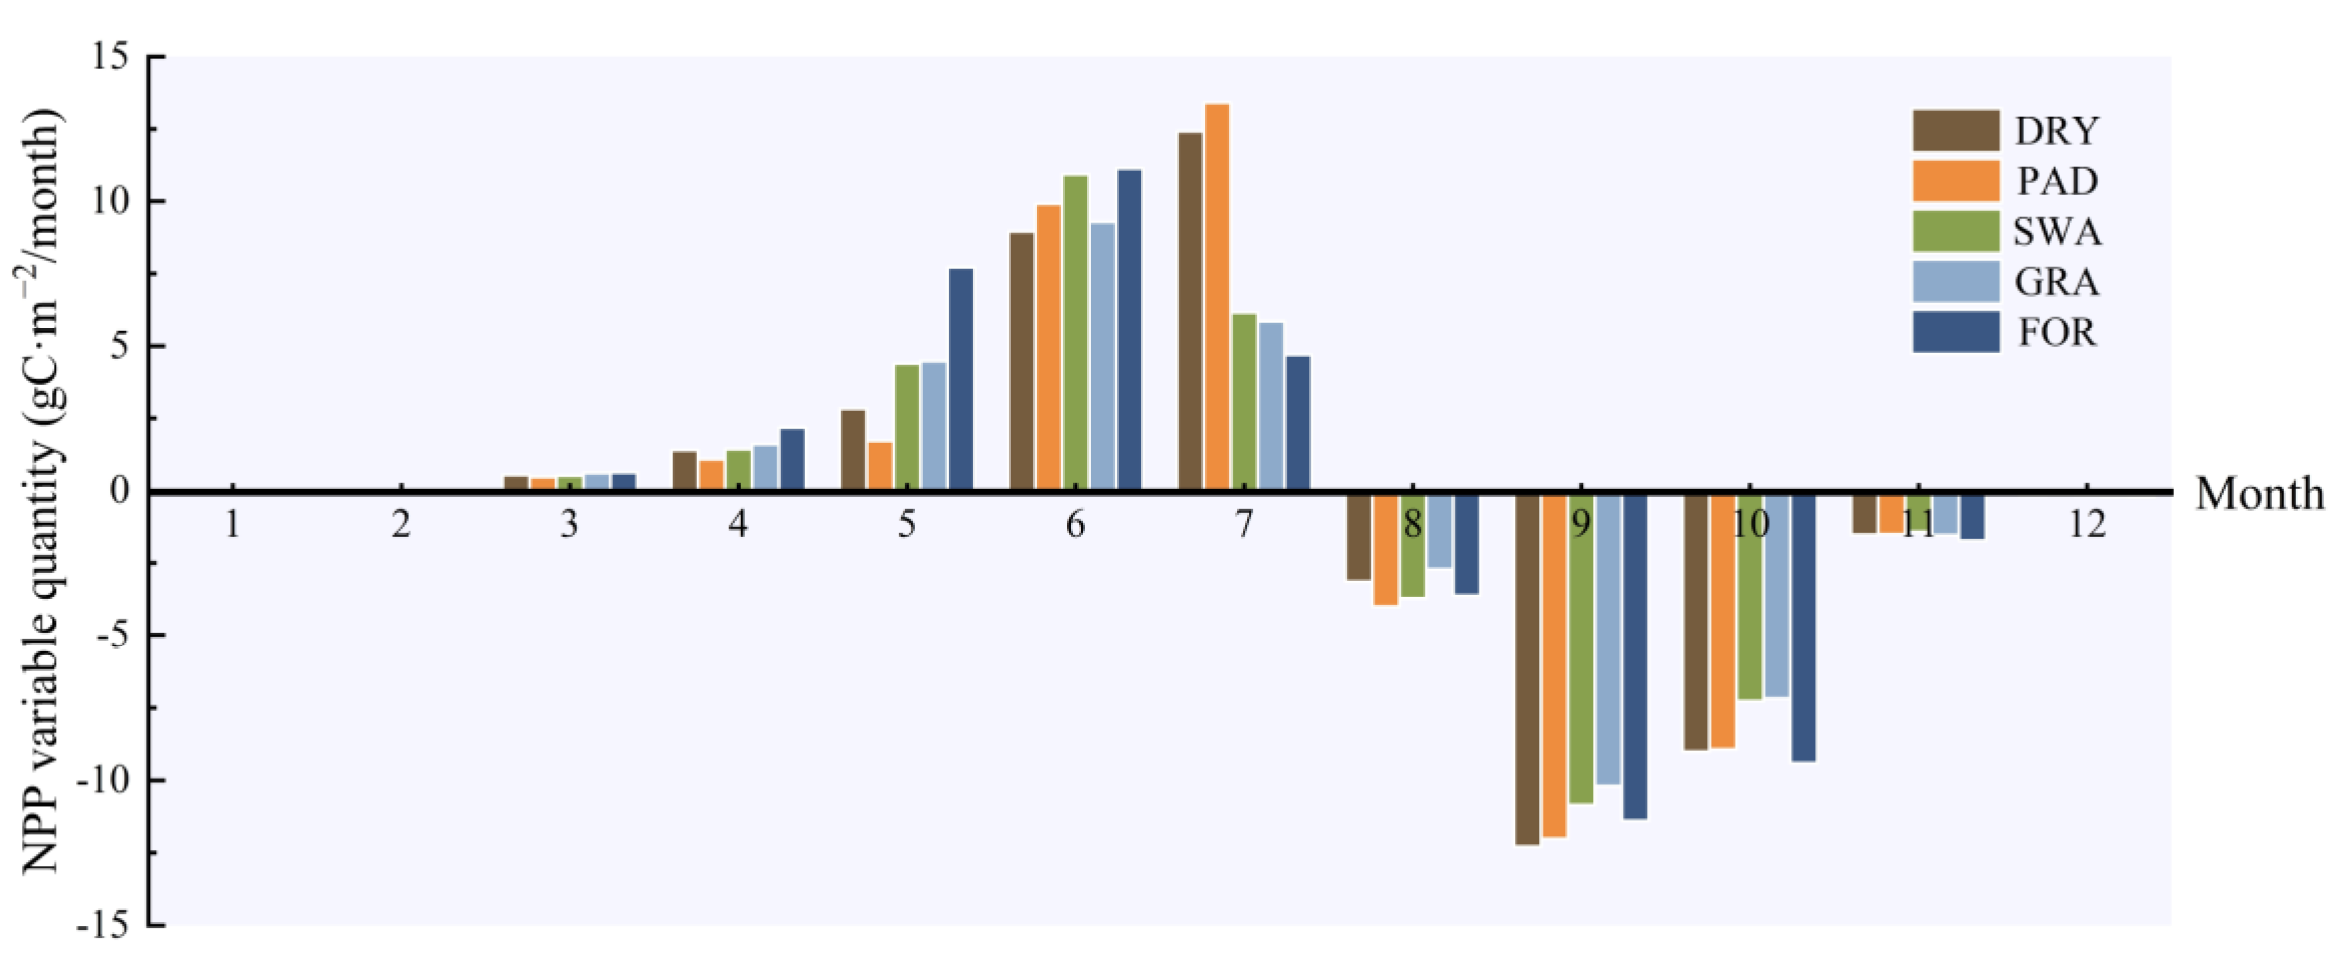
3.1.2. Monthly Variation Characteristics

Based on the MOD17 data from 2001 to 2020, the spatial distribution of monthly mean NPP over a 20-year period in the Songnen Plain was studied (Figure 6). The results showed that there were significant differences in the spatial distribution of NPP from January to December. The NPP values for January and December are the lowest monthly values throughout the year, both being 0 gC·m−2/month. From February, only the southwestern fringe of the Songnen Plain demonstrated a slight NPP growth. By March, the NPP values increased over a large area, with high values still concentrated in the southwestern part. A gradual transition from high NPP areas to the center and the northeast started in April. The high values in May and June were maintained in the central and northeastern margins. Significant increases are observed in July and August, exhibiting a trend of higher values in the northeast and lower values in the southwest. Among these, July reaches the highest NPP value for the entire year. The high-value areas shifted from north to south during September and November and finally returned to the southwest in November.
To analyze the monthly NPP trends of various land cover types in the Songnen Plain from 2001 to 2020, the NPP values of different land covers in each month in this period and the variation value were measured. Figure 7 shows the variation trends of NPP for each land cover type. The peaks of all land types occurred in July, among which PAD reached the highest value of 26.61 gC·m−2/month, 4.78 gC·m−2/month higher than the lowest value of GRA in the same period. Although the trends of the variation characteristics were similar among the land classes, the monthly NPP increments vary significantly among different land cover types (Figure 8). The growth of FOR from January to June remained the highest, with the most prominent increase in May. It was only in June that a significant increase was seen in the other four land types, and all land types showed a significant increase in the volume of changes, all exceeding 7.5 gC·m−2/month. In July, PAD and DRY continued to grow with significant growth. PAD reached the highest growth of 13.41 gC·m−2/month for the year, and other land types sustained momentum with a slower growth trend than June. The number of changes in land types decreased from August to December, with all falling rapidly in September and October, among which DRY declined most significantly to −12.28 gC·m−2/month in September.

3.2. Correlation Analysis of NPP Influencing Factors

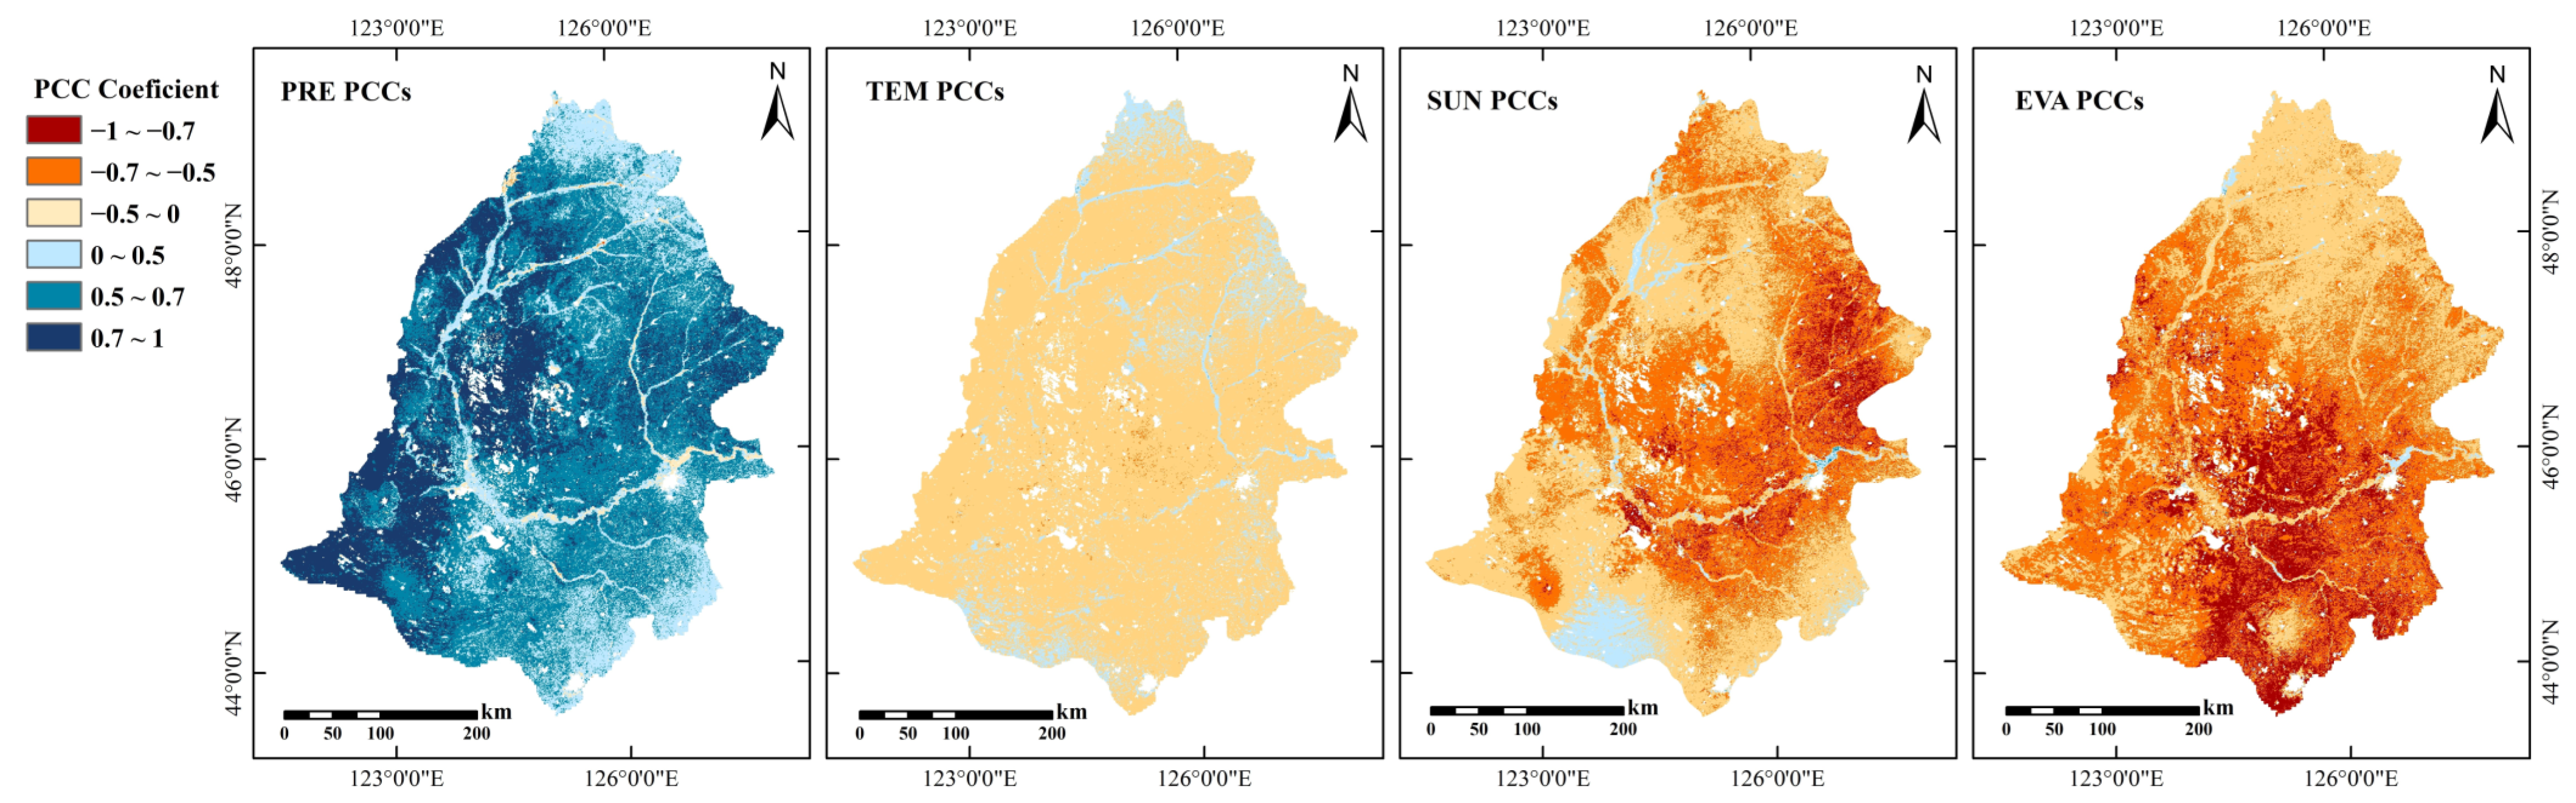
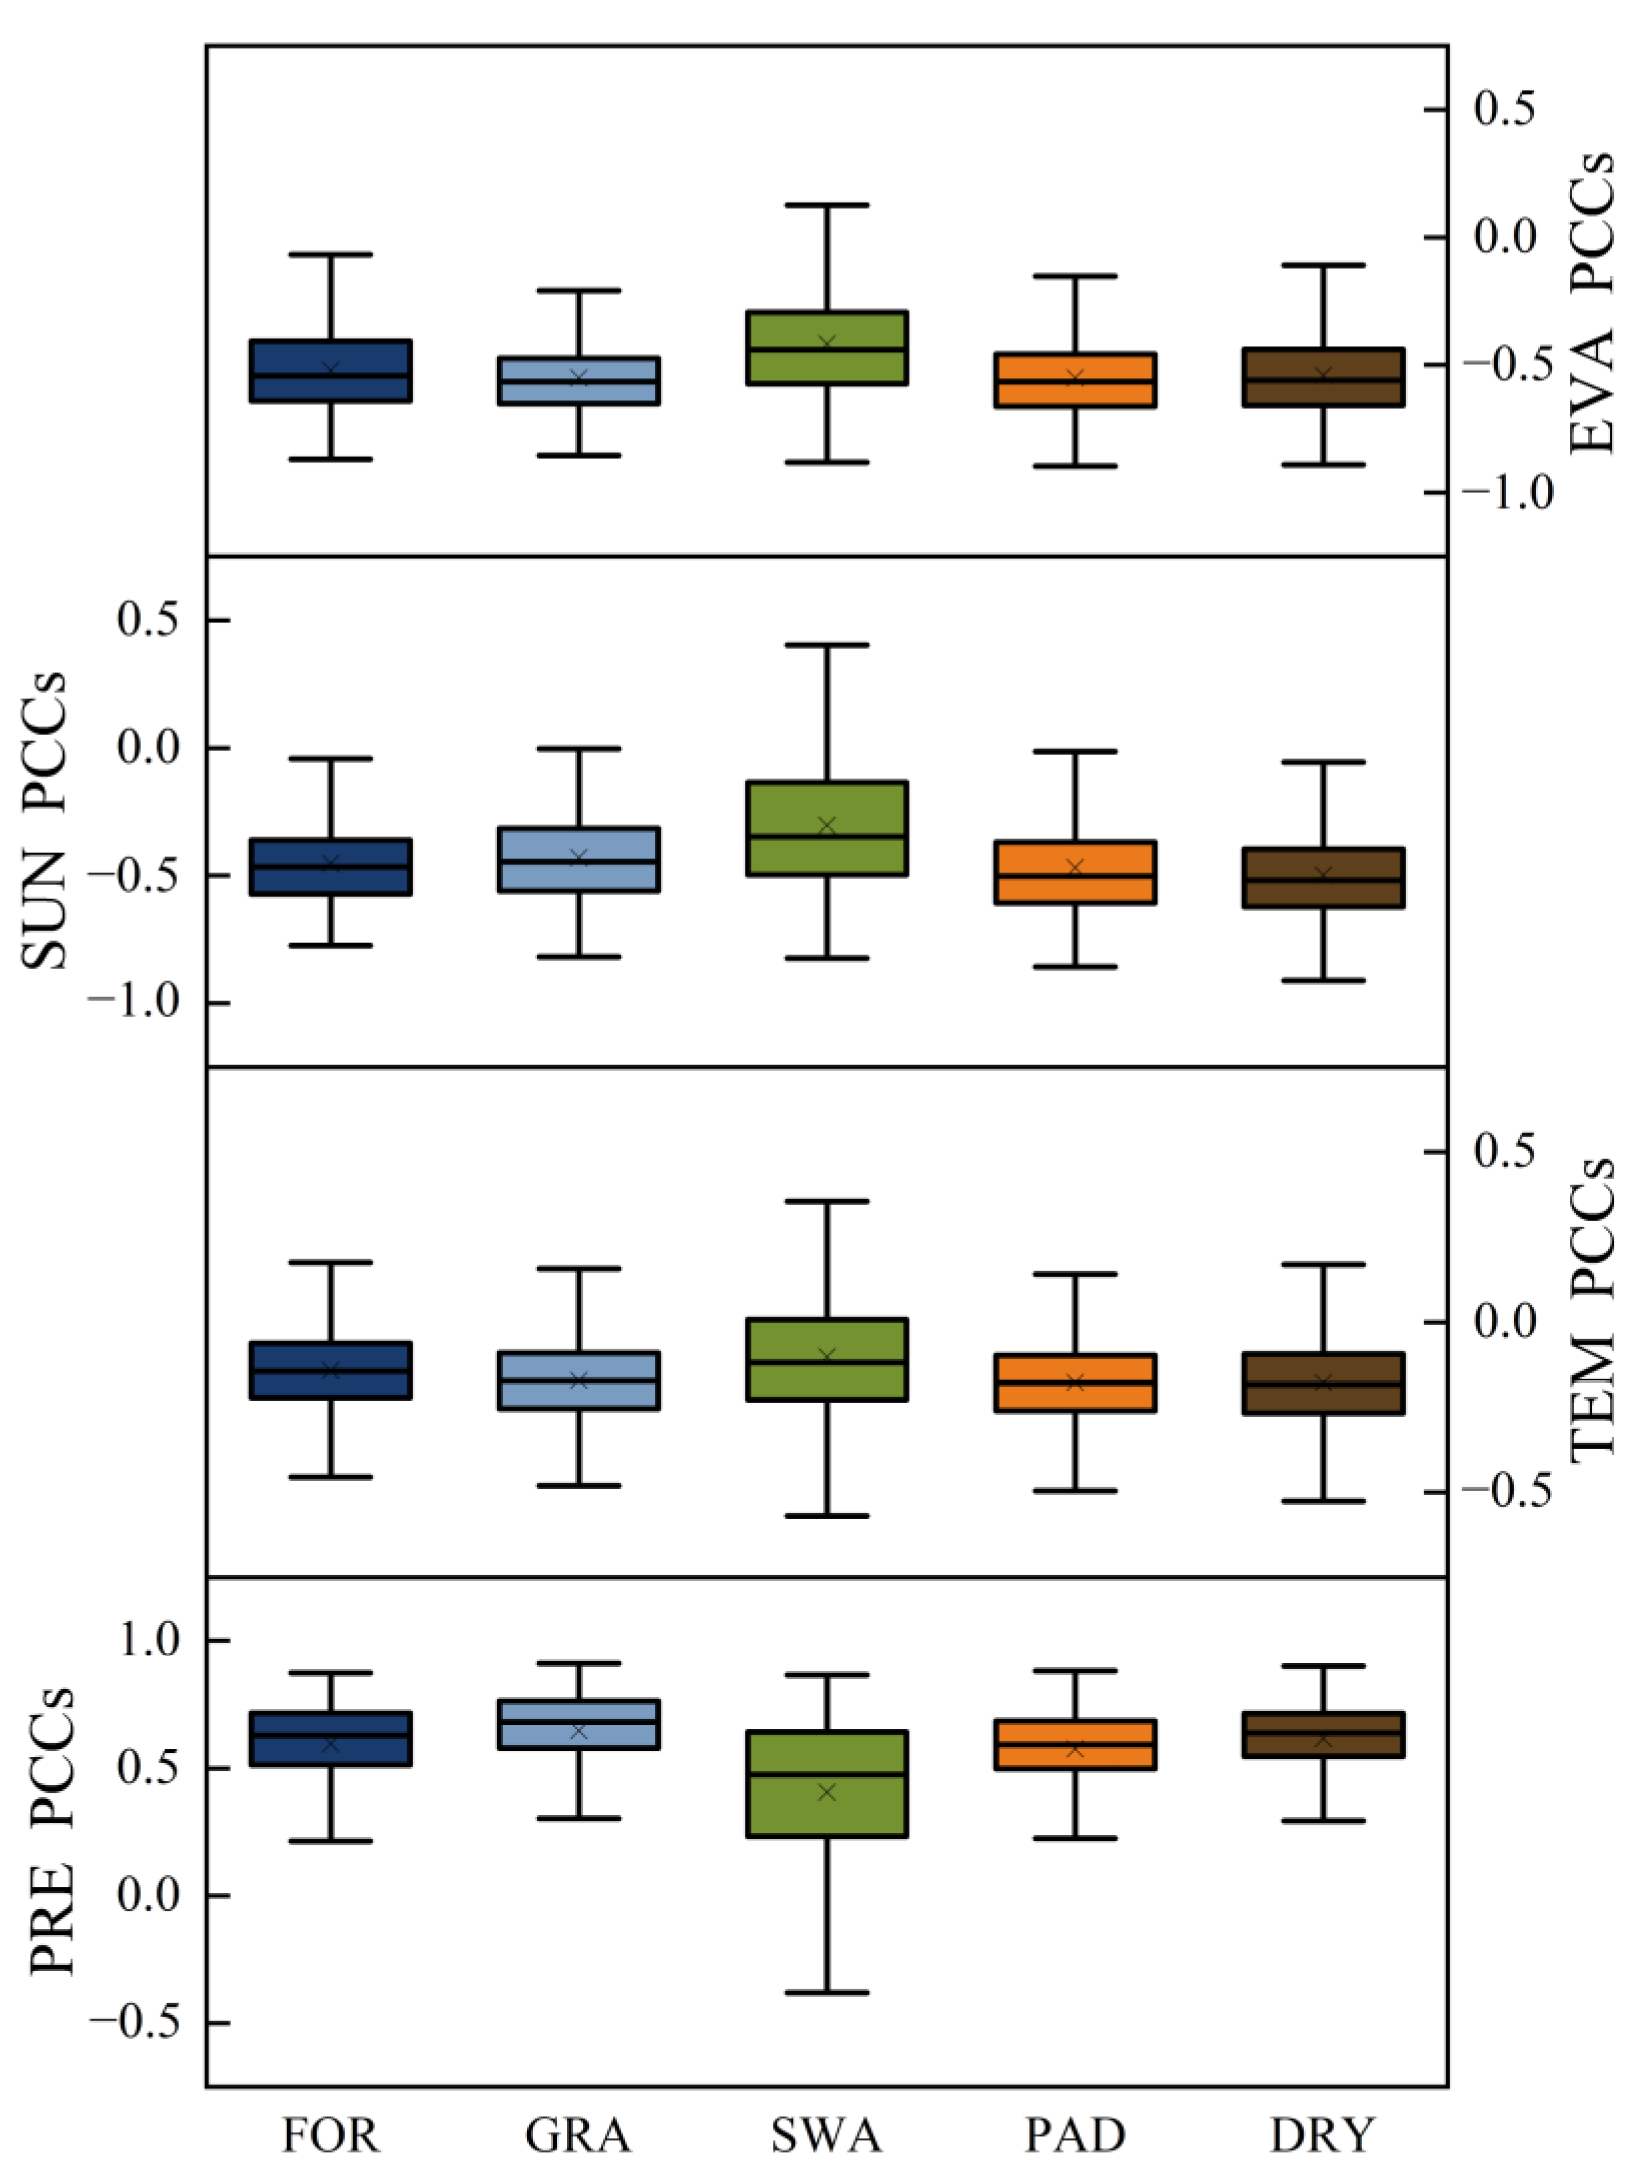
3.2.1. Correlation Analysis of Meteorological Factors

Meteorological elements, as crucial environmental factors, influence various aspects of the ecosystem. Suitable TEM is essential for vegetation to absorb CO2. Under extreme TEM conditions, the growth of plants is significantly hindered, and their ability to photosynthesize and perform vital biological processes is greatly diminished. PRE also directly affects vegetation growth and carbon sequestration. Sufficient SUN is necessary for photosynthesis. EVA indirectly affects vegetation carbon sequestration by impacting atmospheric water vapor pressure, thus making plants regulate their stomatal size to avoid water vapor pressure deficit, which may limit NPP. Adequate PRE and SUN, along with appropriate TEM and EVA, will exert a positive effect on NPP. To investigate the impact of meteorological factors on NPP, Pearson’s correlation coefficients (PCCs) between annual NPP and TEM, PRE, SUN, and EVA were calculated based on MOD17 data and annual raster data of meteorological factors in the Songnen Plain using ArcGIS 10.6 software platform (Figure 9). A positive correlation between NPP and PRE was observed, which was more pronounced in the west and less in the northeast and southeast. PCC > 0.7 indicates a significant positive correlation, and the zone where the correlation was significantly positive accounted for 26.97% of the study area. The absolute values of Pearson’s correlation coefficients between NPP and TEM were all below 0.5, indicating the correlations were weak. The positive correlation regions accounted for 11.68% and were primarily located in the northeast and southwest of the study area. NPP was negatively correlated with SUN, and the regions where the correlation was significant (PCCs < −0.7) covered 6.36% of the Songnen Plain and were mainly concentrated in the central and eastern parts. NPP was negatively correlated with EVA, and the regions with significant correlation (PCCs < −0.7) covered 16.51% of the Songnen Plain and were mainly concentrated in the southern central part.
To investigate the correlation between NPP and meteorological factors in different land cover types, the PCCs were calculated separately for each land type, relating the two variables (Figure 10). The PCCs of NPP and PRE in FOR, GRA, PAD, and DRY were 0.21–0.91, indicating a strong positive correlation. The most significant positive correlation was found in the case of GRA, with the mean of PCCs being 0.65. Average absolute values of PCCs for NPP and TEM corresponding to all land cover types are below 0.2, indicating weak correlation. The PCCs between NPP and SUN for all land cover types show a negative correlation in over 75% of the regions. NPP was significantly and negatively correlated with EVA in all cases of land cover types. The average PCCs for NPP and EVA were less than −0.52, except in the case of SWA.

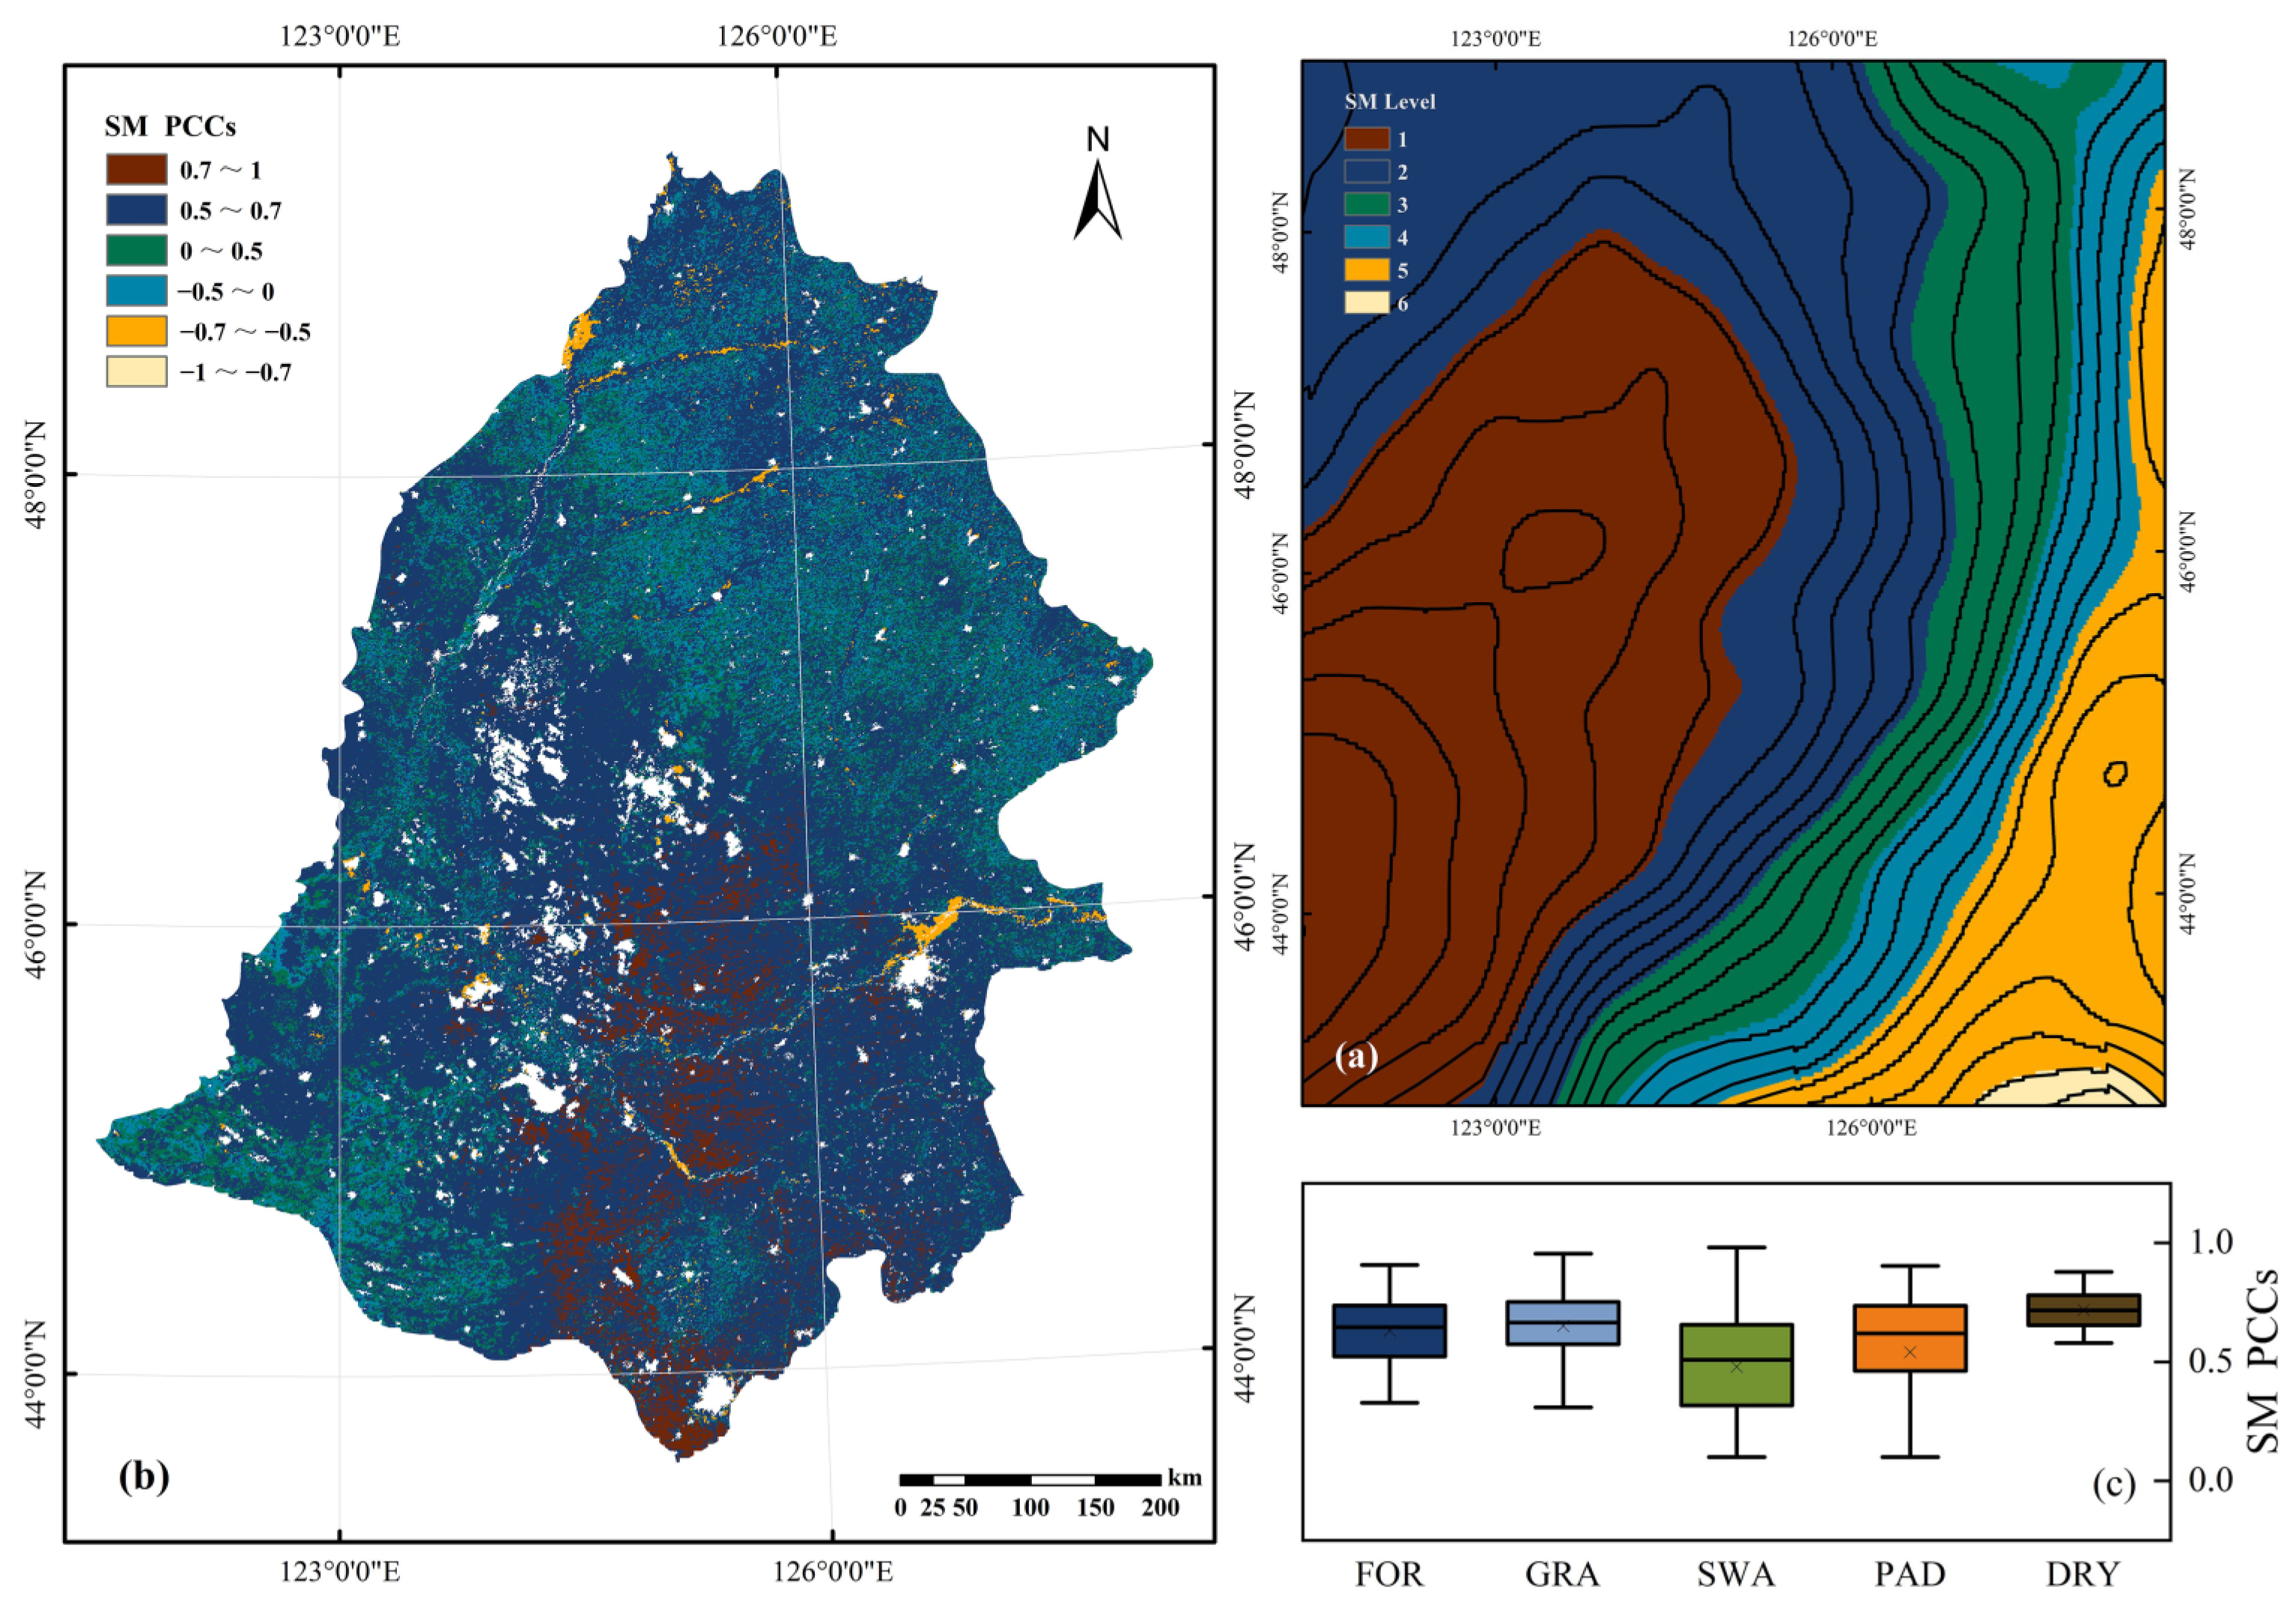
3.2.2. Correlation Analysis of SM

SM is directly related to the dynamics of plant photosynthesis and respiration. It is a water resource that can be directly used by vegetation for growth. SM is influenced by solar radiation and therefore displays longitudinal zonation in the study area, as shown in Figure 11a, which is equidistantly divided into six classes according to the distribution of SM value domains (176.54–463.89 mm). To explore the effect of SM on NPP, PCCs were calculated for each image element using the GIS platform. The results indicate that NPP and SM are mainly positively correlated (Figure 11b), and the positively correlated regions account for 59.32% of the total area of the Songnen Plain (0.5 < PCCs < 0.7). The significantly positively correlated (0.7 < PCCs < 1) areas are mainly concentrated in the central and southern parts of the study area, accounting for 14.73% of the total area. The regions with weak correlation (−0.5 < PCCs < 0.5) are mainly concentrated in the northeastern and southwestern parts of the study area, accounting for 22.93% of the total area. Incorporating the land cover distribution in the Songnen Plain, a statistical analysis was performed on the PCCs between NPP and SM for each land cover type. The results indicate that there is a significant correlation between NPP and SM in the PAD dataset (Figure 11c), with PCCs in more than 75% of the study area exceeding 0.65. The mean of PCCs in the case of DRY was the maximum (0.73). However, the average of PCCs between NPP and SM was only about 0.55 in the case of SWA with more adequate SM, showing a relatively weak correlation. In the cases of FOR, GRA, and PAD, the mean value of PCCs was greater than 0.63, despite their wide range.

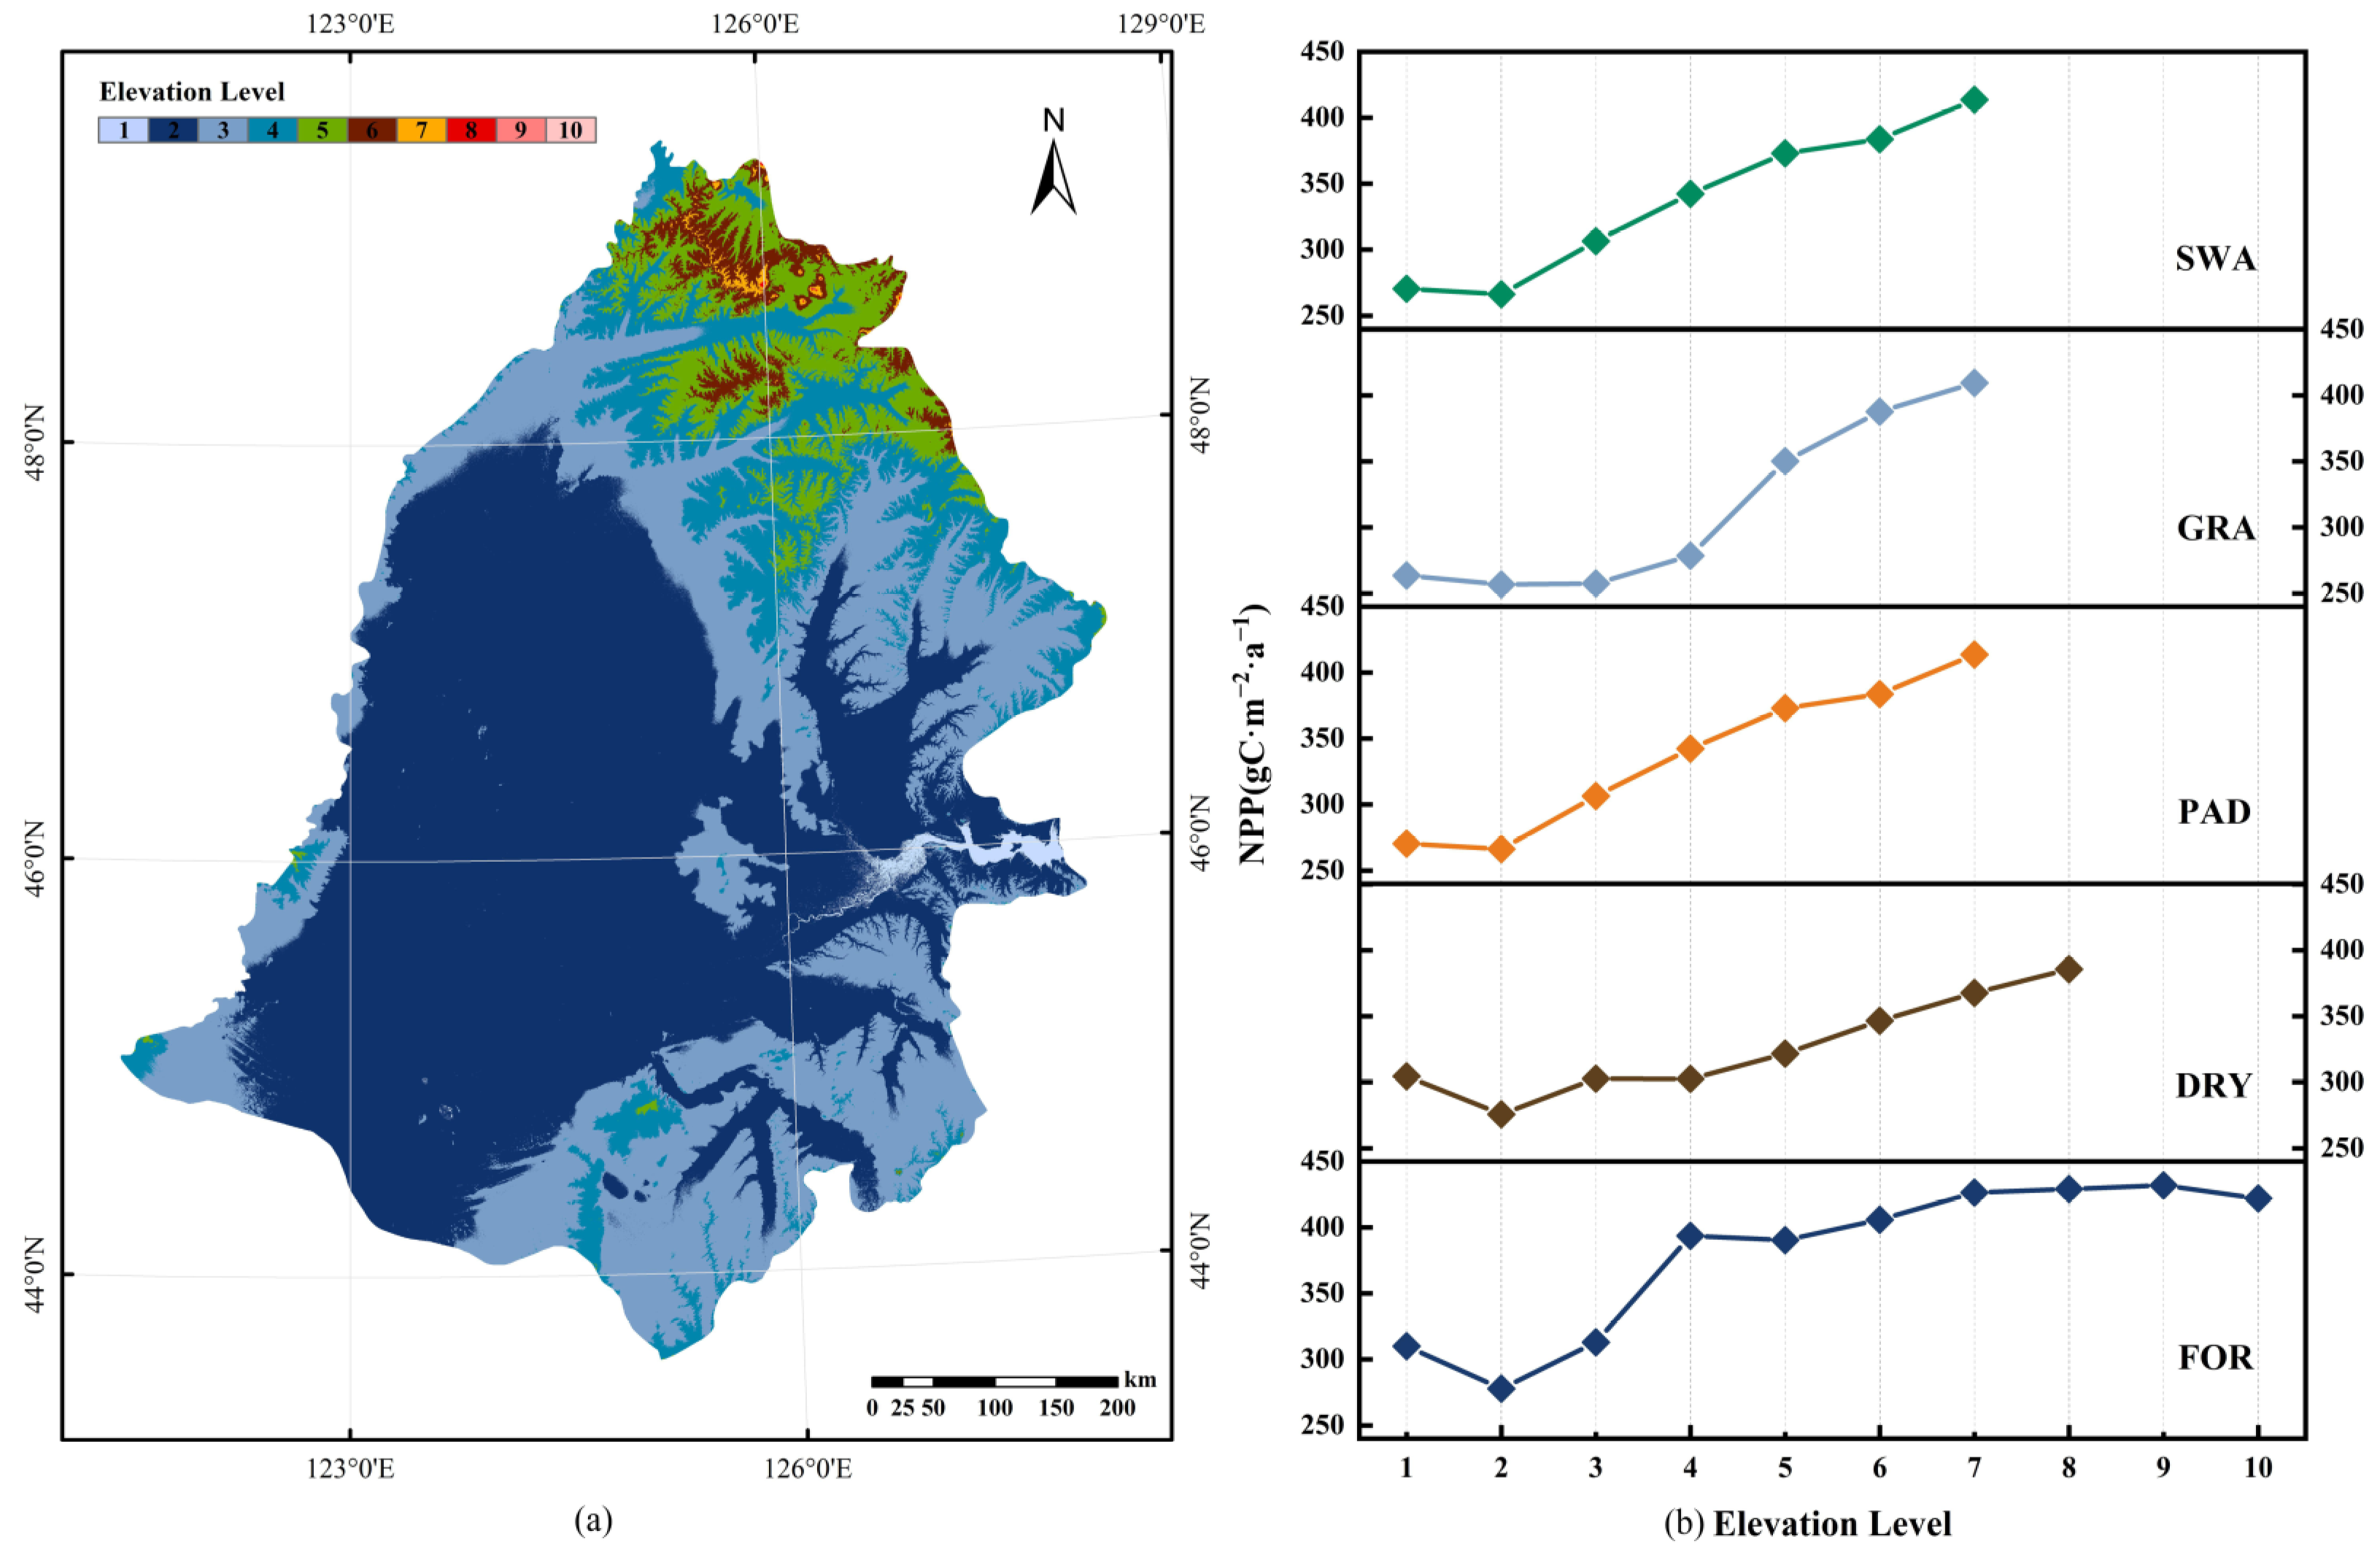
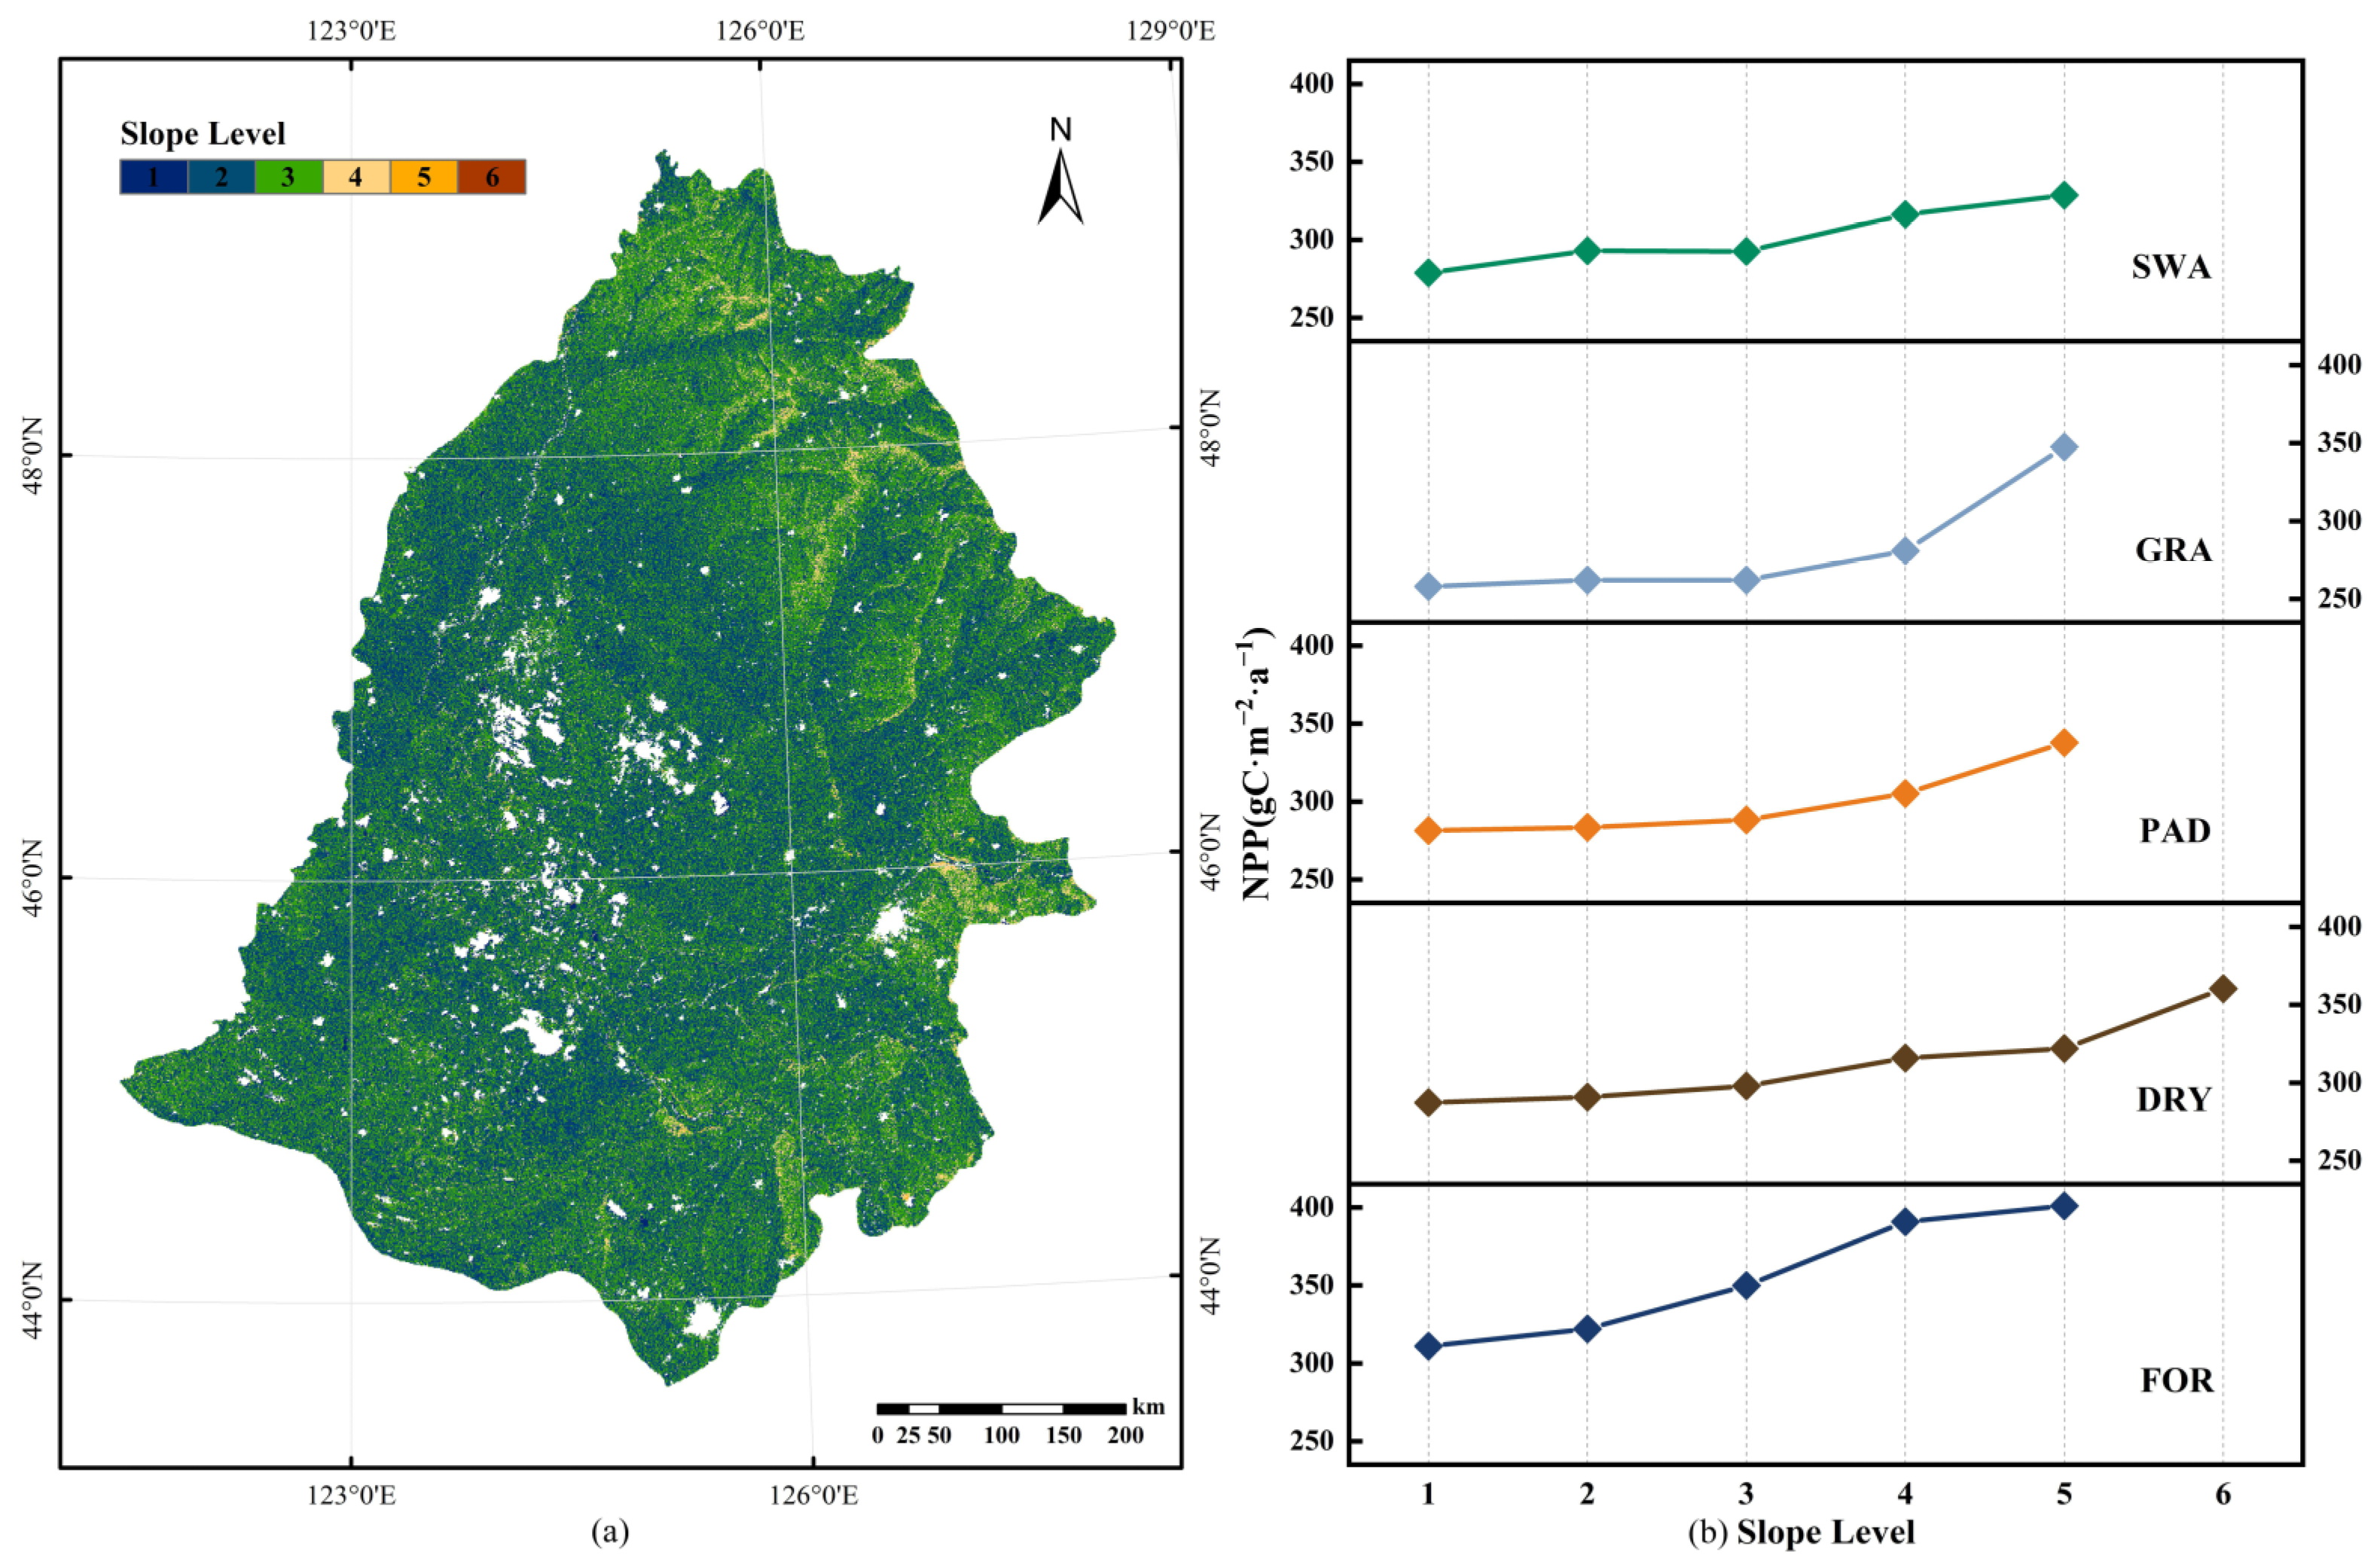
3.2.3. Correlation Analysis of Topographic Factors

Elevation and slope, as fundamental characteristics reflecting the terrain, closely influence the types of vegetation, development of root systems, and the distribution of plant communities. Topographic factors affect NPP by impacting vegetation growth and thus altering vegetation carbon cycle efficiency. Elevation differences can lead to diurnal temperature variations, which affect chlorophyll decomposition, light availability and photosynthetic activity and ultimately influence the carbon sequestration efficiency of vegetation. As shown in Figure 12a, the ASTER DEM data were used to produce an elevation distribution map of the Songnen Plain, from which it can be seen that the terrain slopes from the east and northeast toward the low plains, with gentle undulating hills in the east and wave-like undulations in the southeast. According to the elevation distribution characteristics of Songnen Plain, the elevation is divided into 10 levels with an interval of 50 m. Based on the land cover distribution in the Songnen Plain, after conducting statistical analysis, the mean NPP was calculated for each land cover type within each elevation range. As shown in Figure 12b, the impact of elevation on each land cover type is quite similar, with NPP showing a rising trend with increasing elevation. In the case of FOR, the NPP tends to level off after the elevation reaches 270 m, which indicates that the effect of elevation weakens when it exceeds 270 m. At the elevation of 120–170 m, a slight decrease in NPP is observed across all land types. Within this range, the predominant landform is plains, which account for 52.25% of the entire Songnen Plain and exhibit the lowest NPP. The low NPP may be due to the gentle topography of plains surrounded by hills on three sides. Specifically, natural precipitation may be insufficient; water from high places will pool, leading to poor drainage conditions.
The spatial differences in slope will accelerate soil water loss and create water stress on vegetation. To cope with the water deficit, plants will close their stomata to avoid excessive water consumption by transpiration, but this will lead to CO2 uptake reduction and NPP decline. The slope distribution map of the Songnen Plain was produced based on ASTER DEM data and is shown in Figure 13a. The slope of the Songnen Plain is classified into six levels (0–0.5°, 0.5–2°, 2–5°, 5–15°, 15–35°, 35–55°) according to the classification criteria of landform slope set by the International Geographical Union. The average NPP of different land cover types was calculated at different slopes. As shown in Figure 13b, the effect of slope on NPP shows a similar pattern across different categories. When the slope is below 15°, most land types exhibit small changes in NPP, and their NPP gradually stabilizes with the increasing slope; however, FOR has a large NPP increase between slope of 5 and 15°. When the slope is above 15°, there is a significant improvement in the NPP of GRA; the NPP of DRY only increases significantly at 35–55°. The reason for the significant NPP increases is as follows. In an area with a higher slope, the runoff is faster, and salt accumulation is reduced. This provides a favorable condition for vegetation growth, exerting a positive effect on NPP.

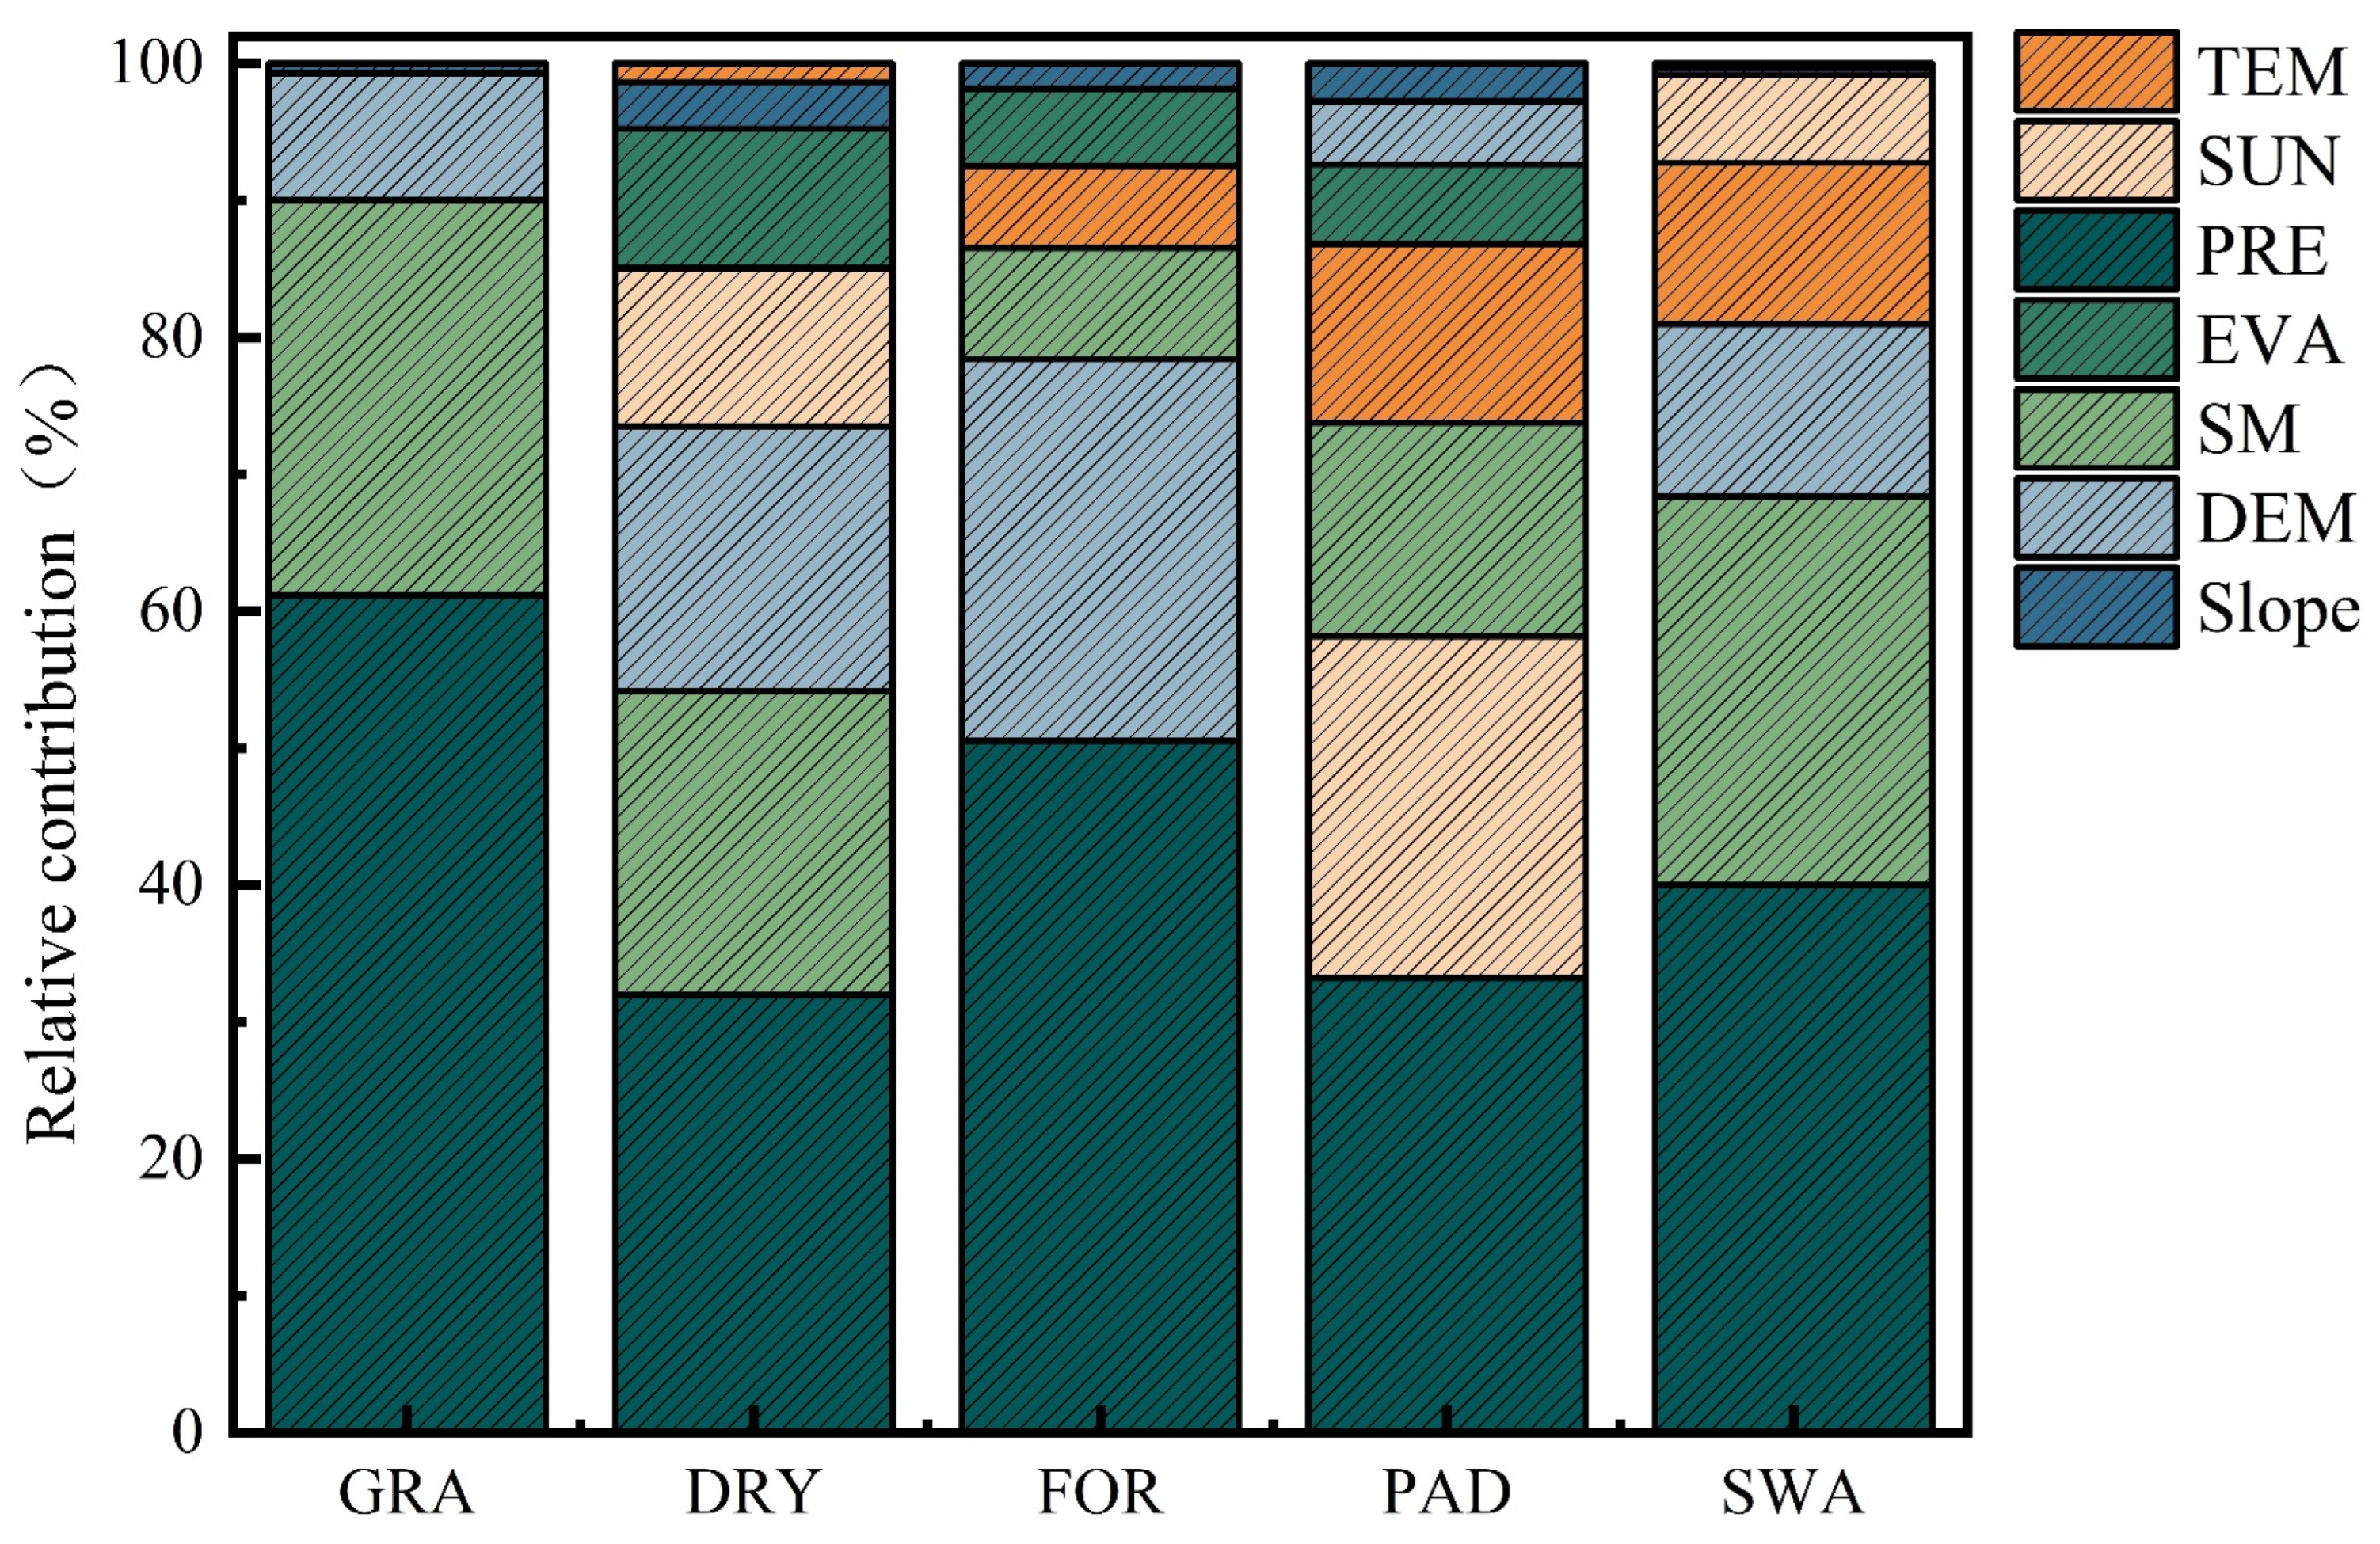
3.3. The Relative Contribution Rate of Influencing Factors

To investigate the correlation between NPP and its influence factors in various land cover types in the Songnen Plain, this study constructed a multisource spatial dataset based on annual data of NPP (gC·m−2·a−1), PRE (mm), TEM (°C), SUN (h), EVA (mm), SM (mm), DEM (m), and slope (°) in the study area from 2001 to 2020; spatially balanced sampling was conducted for land cover types at an interval of 5 km (Figure 14, taking 2001 as an example).
These influencing factors exhibit strong autocorrelation in the modeling process. In this case, linear regression may lead to overfitting, and coefficients of the independent variables in the regression equation cannot accurately represent the actual significance of the influencing factors. Therefore, it is necessary to diagnose the covariance of each influencing factor before constructing the regression model. The variance inflation factor (VIF) is often used as a criterion for covariance diagnosis, with a VIF greater than 10 indicating severe multicollinearity. Covariance diagnosis (Figure 15) showed that the VIFs of PRE and SM were greater than 10, and the multicollinearity was severe. To reduce the disturbance of multiple covariates of independent variables, this study conducted elastic net regression analysis for reliable regression results at the cost of excluding some information.
The elastic net regression analysis (Figure 15, Table 2) shows that the multicollinearity among the influencing factors was significantly attenuated (VIF < 10), and the model coefficient of determination (R2) exceeded 0.6 for all land cover types. DEM and PRE had a positive effect on NPP for all land cover types, while TEM had a negative effect on NPP across all land cover types. SUN had a significant negative effect on NPP of DRY and PAD and a weak positive effect on NPP in other land cover types; SM and slope only had a negative effect on NPP in SWA and exerted a positive effect on NPP in other land cover types. EVA only had a negative effect on NPP in FOR.
To analyze the degree of influence of these factors on NPP, we calculated their relative contribution to NPP in the cases of various land cover types based on the results of elastic net regression analysis. As can be seen in Figure 16, the cumulative contribution of PRE to NPP ranked first in all land cover types, reaching 61.2% and 50.6% in GRA and FOR, respectively; and therefore, PRE is the most significant influencing factor of NPP. The cumulative contributions of PRE, SM, and DEM were close to 100% in GRA and more than 70% in FOR, SWA, and DRY, making them dominant influencing factors in most of the land types in the Songnen Plain. The contribution of DEM in FOR exceeded that of SM. In the case of DEM, its contribution in FOR was the highest (27.9%) among the five land types, possibly because of the most comprehensive distribution of FOR in all classes of DEM.
From the quantitative calculation results of the elastic net model, it can be seen that PRE, SM, and DEM are the most important determinants of NPP changes in the Songnen Plain. Among them, PRE and SM, which influence water availability, show interannual variation. Their driving characteristic on NPP is different from that of DEM with long-term stability. Therefore, interannual trends of PRE and SM in the Songnen Plain from 2001 to 2020 were analyzed (Figure 17). Based on the analysis results, the changes in NPP from 2001 to 2020 were divided into three periods, namely, the period of significant increase, the period of continuous increase, and the period of stable increase. The first period spans from 2001 to 2005, during which NPP rose most significantly, with an average growth rate of 26.34%. The reason is that in this period, both PRE and SM showed a significant increase, alleviating water stress. During the second period, which extends from 2006 to 2014, NPP showed continuous and stable growth with an average growth rate of 11.21%, but the increase was slowed down. PRE still showed an increasing trend, but SM gradually stabilized, indicating that PRE played a dominant role in driving the observed increase in NPP. In the third period spanning from 2015 to 2020, the NPP values stabilized above 380 gC·m−2·a−1 and the growth rate gradually stabilized with an average of 9.96%. PRE showed the most significant increase among the three periods, but SM gradually decreased. Despite the decreasing trend in SM, the joint influence of PRE and SM still contributed to an upward trend in NPP. However, the magnitude of the increase was not as pronounced as that in the first two periods.
To more intuitively reflect the relationship between NPP variation and land use transformation, NPP statistics were conducted for the regions that experienced interconversion between different land types from 2001 to 2020. The results showed (Figure 18) that the GRA maintenance region exhibited the most significant growth of NPP per unit area (154.33 gC·m−2·a−1), followed by the GRA to SWA conversion region (148.87 gC·m−2·a−1). The SWA to FOR conversion region exhibited the lowest growth in NPP growth per unit area (14.97 gC·m−2·a−1). These results indicated that the interconversion among land types affects NPP increase.

4. Discussion

4.1. Analysis of the NPP Impact Factors

In summary, NPP variations in the Songnen Plain were influenced by changes in PRE and SM, with PRE exerting a more significant effect. Previous research results have indicated that TEM is the primary limiting factor for NPP in humid to semi-humid regions, while PRE is the primary limiting factor for NPP in arid to semi-arid regions [68]. Since the study area is characterized by a temperate monsoon climate and a semi-arid environment, the vegetation is susceptible to moisture shortage, making moisture stress a main constraint of vegetation NPP increase in this area. These findings were consistent with the research results in other areas of the Northeast Plain of China, such as the Sanjiang Plain and the Liaohe River Basin [69,70]. In contrast to previous studies that solely considered the relationship between precipitation and NPP in climate analysis [29], we have discussed the combined effects of precipitation and soil moisture from the perspective of water stress. Overall, the moisture conditions in the Songnen Plain show an increasing trend, indicating improved growth conditions for vegetation within this region. Additionally, the Songnen Plain exhibits a weaker correlation with temperature, suggesting that the impact of global warming on this region may not be severe to a significant extent. However, it is worth noting that this consideration is primarily at an annual scale. At a monthly scale, due to the relatively cold climate in the northeastern region, global warming might advance the vegetation’s growing season.

4.2. NPP Variation Trend Analysis in Different Land Use Types

The influence of land use type changes on NPP in the Songnen Plain cannot be ignored. The area of each land type in the Songnen Plain was measured by the land use transition matrix to clarify the relationship between land use types and NPP from 2001 to 2020. In 2001, the main land use types were DRY, GRA, and FOR, with DRY accounting for the highest proportion of 58%, GRA accounting for 16%, and FOR accounting for 9%; in 2020, the main land types changed to DRY, GRA, and PAD, with DRY accounting for 64%, still ranking first, and GRA and PAD both accounting for 9%. From 2001 to 2020, only the area of cultivated land such as DRY and PAD increased, by 18,304.02 km2, while the area of the other vegetation-covered land types decreased, and the overall area of land covered by vegetation shrank by 5662.12 km2. The change in land use type over the 20 years also had a significant effect on the NPP of the Songnen Plain. As can be seen in Figure 4, the average NPP values of all five land types exhibited a significant increasing trend from 2001 to 2020. Among them, FOR exhibited the most significant NPP increase and consistently maintained the highest NPP level, far higher than the values of other land types. GRA also exhibited a large NPP increase, but the overall level was the lowest among the five land cover types. The NPP levels in DRY, PAD, and SWA remained relatively stable from 2009–2014, but in other time intervals, significant fluctuations were observed.
As shown in Figure 18, the order of land type conversions, from low to high in terms of their contribution to NPP increase, is as follows: GRA, DRY, PAD, SWA, FOR. Preserving the continuity of land use patterns such as FOR, GRA, and PAD has a more positive effect on the NPP growth in the Songnen Plain than transforming them to other patterns. The NPP value of FOR was the most stable and significantly higher than that of other land types, suggesting that forest protection is a direct means of maintaining a stable growth of NPP in the study area. The growth of NPP in GRA was also significant, indicating that maintaining the stability of grassland areas could also drive the overall NPP up. Therefore, we concluded that perennials can lead to a more significant net productivity increase. In addition, as the Songnen Plain is an important base for commercial food, it is difficult to restrict the cultivation of arable land under the current “Red line” policy for food security, but the growth of interregional NPP can be maintained through the conversion of DRY to PAD. In this sense, gradually transforming farming methods and increasing the proportion of PAD among arable lands may further improve ecological stability while maintaining food production in the Songnen Plain.

5. Conclusions

The NPP in various land cover types varies by environmental influencing factors. The study concluded that (1) NPP in the Songnen Plain increased at a rate of 19.87 gC·m−2·a−1 from 2001 to 2020, and in terms of spatial distribution, the NPP values were generally higher in the northeast region and lower in the southwest region. The increase in NPP in FOR was the most significant among all land use classes from 2001–2020. (2) Although the correlation between NPP and influence factors varied with land cover type, the cumulative contribution of PRE to NPP ranks first in all land types and is the most vital influencing factor of NPP in the Songnen Plain. SM as an important influence, but the contribution of NPP was greater in land classes with shallow root systems. (3) Land type transformation also impacts NPP. The most significant growth of NPP per unit area was found in the GRA maintenance area, which was 154.33 gC·m−2·a−1. Preserving the continuity of land use patterns such as FOR, GRA, and PAD has a more positive effect on the NPP growth in the Songnen Plain than transforming them to other patterns. This was followed by 148.87 gC·m−2·a−1 in the GRA to SWA conversion area, the lowest growth occurred in the SWA to FOR conversion area, and perennials led to a more significant degree of NPP enhancement.
Decision-makers should adopt targeted ecological restoration strategies for each land cover type. Despite the findings of this study, which underscore the significance of comprehensively considering the variations in meteorological and topographical factors among different land cover types when assessing the contribution of influencing factors to NPP, certain limitations arise due to the diverse ecological and climatic conditions in different regions. Moreover, the study lacks consideration of time lag issues. Future research will thus delve into further studying NPP changes in the Songnen Plain, focusing on the perspective of water stress.

Author Contributions

Conceptualization, N.L. and J.L.; methodology, R.J.; validation, S.L.; investigation X.L.; writing—original draft preparation, N.L. and J.L.; writing—review and editing, N.L. and J.L. All authors have read and agreed to the published version of the manuscript.

Funding

This research was funded by the Science and Technology Development Project of Jilin Province (20210203016SF), the Natural Science Foundation of Jilin Province (20230101373JC), and the Science and Technology Research Planning Project of Education Department of Jilin Province (JJKH20220290KJ and JJKH20210269KJ).

Data Availability Statement

Data are available upon reasonable request from the corresponding author.

Acknowledgments

We are most grateful to the anonymous reviewers and the editors for their critical and constructive reviews of this manuscript.

Conflicts of Interest

The authors declare no conflict of interest.

References

  1. Al-Ghussain, L. Global warming: Review on driving forces and mitigation. Environ. Prog. Sustain. Energy 2019, 38, 13–21. [Google Scholar] [CrossRef]
  2. Haque, U.; da Silva, P.F.; Devoli, G.; Pilz, J.; Zhao, B.X.; Khaloua, A.; Wilopo, W.; Andersen, P.; Lu, P.; Lee, J.; et al. The human cost of global warming: Deadly landslides and their triggers (1995–2014). Sci. Total Environ. 2019, 682, 673–684. [Google Scholar] [CrossRef] [PubMed]
  3. Alfieri, L.; Bisselink, B.; Dottori, F.; Naumann, G.; de Roo, A.; Salamon, P.; Wyser, K.; Feyen, L. Global projections of river flood risk in a warmer world. Earths Future 2017, 5, 171–182. [Google Scholar] [CrossRef]
  4. Yang, Y.H.; Shi, Y.; Sun, W.J.; Chang, J.F.; Zhu, J.X.; Chen, L.Y.; Wang, X.; Guo, Y.P.; Zhang, H.T.; Yu, L.F.; et al. Terrestrial carbon sinks in China and around the world and their contribution to carbon neutrality. Sci. China-Life Sci. 2022, 65, 861–895. [Google Scholar] [CrossRef]
  5. Le Quere, C.; Andrew, R.M.; Friedlingstein, P.; Sitch, S.; Hauck, J.; Pongratz, J.; Pickers, P.A.; Korsbakken, J.I.; Peters, G.P.; Canadell, J.G.; et al. Global Carbon Budget 2018. Earth Syst. Sci. Data 2018, 10, 2141–2194. [Google Scholar] [CrossRef]
  6. Hansen, J.; Kharecha, P.; Sato, M.; Masson-Delmotte, V.; Ackerman, F.; Beerling, D.J.; Hearty, P.J.; Hoegh-Guldberg, O.; Hsu, S.L.; Parmesan, C.; et al. Assessing “Dangerous Climate Change”: Required Reduction of Carbon Emissions to Protect Young People, Future Generations and Nature. PLoS ONE 2013, 8, 26. [Google Scholar] [CrossRef]
  7. Rogelj, J.; den Elzen, M.; Hohne, N.; Fransen, T.; Fekete, H.; Winkler, H.; Chaeffer, R.S.; Ha, F.; Riahi, K.; Meinshausen, M. Paris Agreement climate proposals need a boost to keep warming well below 2 degrees C. Nature 2016, 534, 631–639. [Google Scholar] [CrossRef]
  8. Piao, S.L.; Tan, K.; Nan, H.J.; Ciais, P.; Fang, J.Y.; Wang, T.; Vuichard, N.; Zhu, B.A. Impacts of climate and CO2 changes on the vegetation growth and carbon balance of Qinghai-Tibetan grasslands over the past five decades. Glob. Planet. chang. 2012, 98–99, 73–80. [Google Scholar] [CrossRef]
  9. Field, C.B.; Behrenfeld, M.J.; Randerson, J.T.; Falkowski, P. Primary production of the biosphere: Integrating terrestrial and oceanic components. Science 1998, 281, 237–240. [Google Scholar] [CrossRef] [PubMed]
  10. Gang, C.; Zhou, W.; Wang, Z.; Chen, Y.; Li, J.; Chen, J.; Qi, J.; Odeh, I.; Groisman, P.Y. Comparative Assessment of Grassland NPP Dynamics in Response to Climate Change in China, North America, Europe and Australia from 1981 to 2010. J. Agron. Crop Sci. 2015, 201, 57–68. [Google Scholar] [CrossRef]
  11. White, A.; Cannell, M.G.R.; Friend, A.D. Climate change impacts on ecosystems and the terrestrial carbon sink: A new assessment. Glob. Environ. chang.-Human Policy Dimens. 1999, 9, S21–S30. [Google Scholar] [CrossRef]
  12. Rueda, C.V.; Baldi, G.; Verón, S.R.; Jobbágy, E.G. Apropiación humana de la producción primaria en el Chaco Seco. Ecol. Austral 2013, 23, 44–54. [Google Scholar] [CrossRef]
  13. Guanter, L.; Zhang, Y.G.; Jung, M.; Joiner, J.; Voigt, M.; Berry, J.A.; Frankenberg, C.; Huete, A.R.; Zarco-Tejada, P.; Lee, J.E.; et al. Global and time-resolved monitoring of crop photosynthesis with chlorophyll fluorescence. Proc. Natl. Acad. Sci. USA 2014, 111, E1327–E1333. [Google Scholar] [CrossRef] [PubMed]
  14. Smith, W.K.; Reed, S.C.; Cleveland, C.C.; Ballantyne, A.P.; Anderegg, W.R.L.; Wieder, W.R.; Liu, Y.Y.; Running, S.W. Large divergence of satellite and Earth system model estimates of global terrestrial CO2 fertilization. Nat. Clim. chang. 2016, 6, 306–310. [Google Scholar] [CrossRef]
  15. Piao, S.L.; Wang, X.H.; Park, T.; Chen, C.; Lian, X.; He, Y.; Bjerke, J.W.; Chen, A.P.; Ciais, P.; Tommervik, H.; et al. Characteristics, drivers and feedbacks of global greening. Nat. Rev. Earth Environ. 2020, 1, 14–27. [Google Scholar] [CrossRef]
  16. Fassnacht, F.E.; Latifi, H.; Sterenczak, K.; Modzelewska, A.; Lefsky, M.; Waser, L.T.; Straub, C.; Ghosh, A. Review of studies on tree species classification from remotely sensed data. Remote Sens. Environ. 2016, 186, 64–87. [Google Scholar] [CrossRef]
  17. Wang, Y.B.; Wang, X.; Tan, K.; Chen, Y.; Xu, K.L. Estimation of Maize Yield in Yitong County Based on Multi-source Remote Sensing Data from 2007 to 2017. In Proceedings of the 10th International Workshop on the Analysis of Multitemporal Remote Sensing Images (MultiTemp), Shanghai, China, 5–7 August 2019. [Google Scholar]
  18. He, L.M.; Chen, J.M.; Pan, Y.D.; Birdsey, R.; Kattge, J. Relationships between net primary productivity and forest stand age in U.S. forests. Glob. Biogeochem. Cycle 2012, 26, 19. [Google Scholar] [CrossRef]
  19. Clark, D.A.; Brown, S.; Kicklighter, D.W.; Chambers, J.Q.; Thomlinson, J.R.; Ni, J.; Holland, E.A. Net primary production in tropical forests: An evaluation and synthesis of existing field data. Ecol. Appl. 2001, 11, 371–384. [Google Scholar] [CrossRef]
  20. Buyantuyev, A.; Wu, J. Urbanization alters spatiotemporal patterns of ecosystem primary production: A case study of the Phoenix metropolitan region, USA. J. Arid. Environ. 2009, 73, 512–520. [Google Scholar] [CrossRef]
  21. Gower, S.T.; Kucharik, C.J.; Norman, J.M. Direct and indirect estimation of leaf area index, f(APAR), and net primary production of terrestrial ecosystems. Remote Sens. Environ. 1999, 70, 29–51. [Google Scholar] [CrossRef]
  22. Rafique, R.; Zhao, F.; de Jong, R.; Zeng, N.; Asrar, G.R. Global and Regional Variability and Change in Terrestrial Ecosystems Net Primary Production and NDVI: A Model-Data Comparison. Remote Sens. 2016, 8, 16. [Google Scholar] [CrossRef]
  23. Simova, I.; Storch, D. The enigma of terrestrial primary productivity: Measurements, models, scales and the diversity-productivity relationship. Ecography 2017, 40, 14. [Google Scholar] [CrossRef]
  24. Cramer, W.; Kicklighter, D.W.; Bondeau, A.; Moore, B.; Churkina, G.; Nemry, B.; Ruimy, A.; Schloss, A.L.; Participants Potsdam, N.P.P.M.I. Comparing global models of terrestrial net primary productivity (NPP): Overview and key results. Glob. chang. Biol. 1999, 5, 1–15. [Google Scholar] [CrossRef]
  25. Thornton, P.E.; Law, B.E.; Gholz, H.L.; Clark, K.L.; Falge, E.; Ellsworth, D.S.; Golstein, A.H.; Monson, R.K.; Hollinger, D.; Falk, M.; et al. Modeling and measuring the effects of disturbance history and climate on carbon and water budgets in evergreen needleleaf forests. Agric. For. Meteorol. 2002, 113, 185–222. [Google Scholar] [CrossRef]
  26. Jia, X.X.; Shao, M.A.; Yu, D.X.; Zhang, Y.; Binley, A. Spatial variations in soil-water carrying capacity of three typical revegetation species on the Loess Plateau, China. Agric. Ecosyst. Environ. 2019, 273, 25–35. [Google Scholar] [CrossRef]
  27. Fensholt, R.; Sandholt, I.; Rasmussen, M.S.; Stisen, S.; Diouf, A. Evaluation of satellite based primary production modelling in the semi-arid Sahel. Remote Sens. Environ. 2006, 105, 173–188. [Google Scholar] [CrossRef]
  28. Robinson, N.P.; Allred, B.W.; Smith, W.K.; Jones, M.O.; Moreno, A.; Erickson, T.A.; Naugle, D.E.; Running, S.W. Terrestrial primary production for the conterminous United States derived from Landsat 30 m and MODIS 250 m. Remote Sens. Ecol. Conserv. 2018, 4, 264–280. [Google Scholar] [CrossRef]
  29. Wei, X.D.; Yang, J.; Luo, P.P.; Lin, L.G.; Lin, K.L.; Guan, J.M. Assessment of the variation and influencing factors of vegetation NPP and carbon sink capacity under different natural conditions. Ecol. Indic. 2022, 138, 15. [Google Scholar] [CrossRef]
  30. Peng, S.S.; Piao, S.L.; Ciais, P.; Myneni, R.B.; Chen, A.P.; Chevallier, F.; Dolman, A.J.; Janssens, I.A.; Penuelas, J.; Zhang, G.X.; et al. Asymmetric effects of daytime and night-time warming on Northern Hemisphere vegetation. Nature 2013, 501, 88–92. [Google Scholar] [CrossRef]
  31. Devi, N.; Hagedorn, F.; Moiseev, P.; Bugmann, H.; Shiyatov, S.; Mazepa, V.; Rigling, A. Expanding forests and changing growth forms of Siberian larch at the Polar Urals treeline during the 20th century. Glob. chang. Biol. 2008, 14, 1581–1591. [Google Scholar] [CrossRef]
  32. Pecl, G.T.; Araujo, M.B.; Bell, J.D.; Blanchard, J.; Bonebrake, T.C.; Chen, I.C.; Clark, T.D.; Colwell, R.K.; Danielsen, F.; Evengard, B.; et al. Biodiversity redistribution under climate change: Impacts on ecosystems and human well-being. Science 2017, 355, 9. [Google Scholar] [CrossRef] [PubMed]
  33. Xie, L.; Wang, H.W.; Liu, S.H. The ecosystem service values simulation and driving force analysis based on land use/land cover: A case study in inland rivers in arid areas of the Aksu River Basin, China. Ecol. Indic. 2022, 138, 16. [Google Scholar] [CrossRef]
  34. Ugbaje, S.U.; Odeh, I.O.A.; Bishop, T.F.A.; Li, J.L. Assessing the spatio-temporal variability of vegetation productivity in Africa: Quantifying the relative roles of climate variability and human activities. Int. J. Digit. Earth 2017, 10, 879–900. [Google Scholar] [CrossRef]
  35. Wang, N.; Huang, M.; Gu, F.X.; Yan, H.M.; Wang, S.Q.; He, H.L.; Wang, Z.S.; Sun, X.Y.; Xu, W.T.; Yang, F.T.; et al. Diagnosing Phosphorus Limitation in Subtropical Forests in China under Climate Warming. Sustainability 2019, 11, 2202. [Google Scholar] [CrossRef]
  36. Shen, X.J.; Liu, Y.W.; Zhang, J.Q.; Wang, Y.J.; Ma, R.; Liu, B.H.; Lu, X.G.; Jiang, M. Asymmetric Impacts of Diurnal Warming on Vegetation Carbon Sequestration of Marshes in the Qinghai Tibet Plateau. Glob. Biogeochem. Cycle 2022, 36, 13. [Google Scholar] [CrossRef]
  37. Wang, J.M.; Li, W.; Ciais, P.; Ballantyne, A.; Goll, D.; Huang, X.M.; Zhao, Z.; Zhu, L. Changes in Biomass Turnover Times in Tropical Forests and Their Environmental Drivers From 2001 to 2012. Earths Future 2021, 9, 1–18. [Google Scholar] [CrossRef]
  38. Zhang, G.G.; Li, X.D.; Kang, Y.M.; Han, G.D.; Hongmei; Sakurai, K. Spatiotemporal variability of net primary production over the past half century in Inner Mongolia grassland of China. J. Food Agric. Environ. 2012, 10, 1168–1173. [Google Scholar]
  39. Friend, A.D.; Lucht, W.; Rademacher, T.T.; Keribin, R.; Betts, R.; Cadule, P.; Ciais, P.; Clark, D.B.; Dankers, R.; Falloon, P.D.; et al. Carbon residence time dominates uncertainty in terrestrial vegetation responses to future climate and atmospheric CO2. Proc. Natl. Acad. Sci. USA 2014, 111, 3280–3285. [Google Scholar] [CrossRef]
  40. Zhou, Y.Y.; Yue, D.X.; Li, C.; Mu, X.L.; Guo, J.J. Identifying the spatial drivers of net primary productivity: A case study in the Bailong River Basin, China. Glob. Ecol. Conserv. 2021, 28, e01685. [Google Scholar] [CrossRef]
  41. Liu, J.; Ji, Y.-H.; Zhou, G.-S.; Zhou, L.; Lyu, X.-M.; Zhou, M.-Z. Temporal and spatial variations of net primary productivity (NPP) and its climate driving effect in the Qinghai-Tibet Plateau, China from 2000 to 2020. Yingyong Shengtai Xuebao 2022, 33, 1533–1538. [Google Scholar] [CrossRef]
  42. Zhang, F.; Hu, X.S.; Zhang, J.; Li, C.Y.; Zhang, Y.P.; Li, X.L. Change in Alpine Grassland NPP in Response to Climate Variation and Human Activities in the Yellow River Source Zone from 2000 to 2020. Sustainability 2022, 14, 8790. [Google Scholar] [CrossRef]
  43. Wu, Z.T.; Dijkstra, P.; Koch, G.W.; Penuelas, J.; Hungate, B.A. Responses of terrestrial ecosystems to temperature and precipitation change: A meta-analysis of experimental manipulation. Glob. chang. Biol. 2011, 17, 927–942. [Google Scholar] [CrossRef]
  44. Ge, W.Y.; Deng, L.Q.; Wang, F.; Han, J.Q. Quantifying the contributions of human activities and climate change to vegetation net primary productivity dynamics in China from 2001 to 2016. Sci. Total Environ. 2021, 773, 145648. [Google Scholar] [CrossRef]
  45. Chen, Y.Z.; Feng, X.M.; Tian, H.Q.; Wu, X.T.; Gao, Z.; Feng, Y.; Piao, S.L.; Lv, N.; Pan, N.Q.; Fu, B.J. Accelerated increase in vegetation carbon sequestration in China after 2010: A turning point resulting from climate and human interaction. Glob. chang. Biol. 2021, 27, 5848–5864. [Google Scholar] [CrossRef] [PubMed]
  46. Cramer, W.; Bondeau, A.; Woodward, F.I.; Prentice, I.C.; Betts, R.A.; Brovkin, V.; Cox, P.M.; Fisher, V.; Foley, J.A.; Friend, A.D.; et al. Global response of terrestrial ecosystem structure and function to CO2 and climate change: Results from six dynamic global vegetation models. Glob. chang. Biol. 2001, 7, 357–373. [Google Scholar] [CrossRef]
  47. Li, H.; Zhang, H.Y.; Li, Q.X.; Zhao, J.J.; Guo, X.Y.; Ying, H.; Deng, G.R.; Wu, R.H.; Wang, S.L. Vegetation Productivity Dynamics in Response to Climate Change and Human Activities under Different Topography and Land Cover in Northeast China. Remote Sens. 2021, 13, 975. [Google Scholar] [CrossRef]
  48. Song, L.Y.; Li, M.Y.; Xu, H.; Guo, Y.; Wang, Z.; Li, Y.C.; Wu, X.J.; Feng, L.C.; Chen, J.; Lu, X.; et al. Spatiotemporal variation and driving factors of vegetation net primary productivity in a typical karst area in China from 2000 to 2010. Ecol. Indic. 2021, 132, 108280. [Google Scholar] [CrossRef]
  49. Huang, L.H.; Liu, Y.; Ferreira, J.F.S.; Wang, M.M.; Na, J.; Huang, J.N.; Liang, Z.W. Long-term combined effects of tillage and rice cultivation with phosphogypsum or farmyard manure on the concentration of salts, minerals, and heavy metals of saline-sodic paddy fields in Northeast China. Soil Tillage Res. 2022, 215, 105222. [Google Scholar] [CrossRef]
  50. An, Y.; Gao, Y.; Tong, S.Z.; Liu, B. Morphological and Physiological Traits Related to the Response and Adaption of Bolboschoenus planiculmis Seedlings Grown Under Salt-Alkaline Stress Conditions. Front. Plant Sci. 2021, 12, 567782. [Google Scholar] [CrossRef]
  51. Wang, L.; Seki, K.; Miyazaki, T.; Ishihama, Y. The causes of soil alkalinization in the Songnen Plain of Northeast China. Paddy Water Environ. 2009, 7, 259–270. [Google Scholar] [CrossRef]
  52. Yang, F.; An, F.H.; Ma, H.Y.; Wang, Z.C.; Zhou, X.; Liu, Z.J. Variations on Soil Salinity and Sodicity and Its Driving Factors Analysis under Microtopography in Different Hydrological Conditions. Water 2016, 8, 227. [Google Scholar] [CrossRef]
  53. Li, D.-k.; Fan, J.-z.; Wang, J. Variation characteristics of vegetation net primary productivity in Shaanxi Province based on MO17A3. Shengtaixue Zazhi 2011, 30, 2776–2782. [Google Scholar]
  54. Guo, B.; Zang, W.Q.; Yang, F.; Han, B.M.; Chen, S.T.; Liu, Y.; Yang, X.; He, T.L.; Chen, X.; Liu, C.T.; et al. Spatial and temporal change patterns of net primary productivity and its response to climate change in the Qinghai-Tibet Plateau of China from 2000 to 2015. J. Arid. Land 2020, 12, 1–17. [Google Scholar] [CrossRef]
  55. Chen, S.T.; Guo, B.; Zhang, R.; Zang, W.Q.; Wei, C.X.; Wu, H.W.; Yang, X.; Zhen, X.Y.; Li, X.; Zhang, D.F.; et al. Quantitatively determine the dominant driving factors of the spatial-temporal changes of vegetation NPP in the Hengduan Mountain area during 2000–2015. J. Mt. Sci. 2021, 18, 427–445. [Google Scholar] [CrossRef]
  56. Myneni, R.B.; Hoffman, S.; Knyazikhin, Y.; Privette, J.L.; Glassy, J.; Tian, Y.; Wang, Y.; Song, X.; Zhang, Y.; Smith, G.R.; et al. Global products of vegetation leaf area and fraction absorbed PAR from year one of MODIS data. Remote Sens. Environ. 2002, 83, 214–231. [Google Scholar] [CrossRef]
  57. Ryan, M.G. Effects Of Climate Change On Plant Respiration. Ecol. Appl. 1991, 1, 157–167. [Google Scholar] [CrossRef] [PubMed]
  58. Fernandes, R.; Leblanc, S.G. Parametric (modified least squares) and non-parametric (Theil-Sen) linear regressions for predicting biophysical parameters in the presence of measurement errors. Remote Sens. Environ. 2005, 95, 303–316. [Google Scholar] [CrossRef]
  59. Jiang, W.G.; Yuan, L.H.; Wang, W.J.; Cao, R.; Zhang, Y.F.; Shen, W.M. Spatio-temporal analysis of vegetation variation in the Yellow River Basin. Ecol. Indic. 2015, 51, 117–126. [Google Scholar] [CrossRef]
  60. Liu, Y.; Li, Y.; Li, S.C.; Motesharrei, S. Spatial and Temporal Patterns of Global NDVI Trends: Correlations with Climate and Human Factors. Remote Sens. 2015, 7, 13233–13250. [Google Scholar] [CrossRef]
  61. Gocic, M.; Trajkovic, S. Analysis of changes in meteorological variables using Mann-Kendall and Sen’s slope estimator statistical tests in Serbia. Glob. Planet. chang. 2013, 100, 172–182. [Google Scholar] [CrossRef]
  62. Hamed, K.H. Trend detection in hydrologic data: The Mann-Kendall trend test under the scaling hypothesis. J. Hydrol. 2008, 349, 350–363. [Google Scholar] [CrossRef]
  63. de Jong, R.; de Bruin, S.; de Wit, A.; Schaepman, M.E.; Dent, D.L. Analysis of monotonic greening and browning trends from global NDVI time-series. Remote Sens. Environ. 2011, 115, 692–702. [Google Scholar] [CrossRef]
  64. Tabari, H.; Talaee, P.H. Temporal variability of precipitation over Iran: 1966–2005. J. Hydrol. 2011, 396, 313–320. [Google Scholar] [CrossRef]
  65. Schober, P.; Boer, C.; Schwarte, L.A. Correlation Coefficients: Appropriate Use and Interpretation. Anesth. Analg. 2018, 126, 1763–1768. [Google Scholar] [CrossRef] [PubMed]
  66. Zou, H.; Hastie, T. Regularization and variable selection via the elastic net. J. R. Stat. Soc. Ser. B-Stat. Methodol. 2005, 67, 301–320. [Google Scholar] [CrossRef]
  67. He, L.J.; Chen, Y.M.; Zhong, C.M.; Wu, K.S. Granular Elastic Network Regression with Stochastic Gradient Descent. Mathematics 2022, 10, 2628. [Google Scholar] [CrossRef]
  68. Fang, X.; Zhang, C.; Wang, Q.; Chen, X.; Ding, J.L.; Karamage, F. Isolating and Quantifying the Effects of Climate and CO2 Changes (1980–2014) on the Net Primary Productivity in Arid and Semiarid China. Forests 2017, 8, 60. [Google Scholar] [CrossRef]
  69. Zhang, Z.S.; Craft, C.B.; Xue, Z.S.; Tong, S.Z.; Lu, X.G. Regulating effects of climate, net primary productivity, and nitrogen on carbon sequestration rates in temperate wetlands, Northeast China. Ecol. Indic. 2016, 70, 114–124. [Google Scholar] [CrossRef]
  70. Zhao, G.-S.; Wang, J.-B.; Fan, W.-Y.; Ying, T.-Y. Vegetation net primary productivity in Northeast China in 2000–2008: Simulation and seasonal change. Yingyong Shengtai Xuebao 2011, 22, 621–630. [Google Scholar]
Figure 1. Technology Roadmap for Temporal and Spatial Variations in Net primary productivity (NPP) of Different Land Cover Types in the Songnen Plain and Quantifying Relevant Contributing Factors.
Forests 14 01841 g001
Figure 2. The geographic location of the Songnen Plain, China: (a) geographical map of the Songnen Plain; (b) geographical distribution of Songnen Plain major land cover.
Forests 14 01841 g002
Figure 3. Spatial distribution of NPP in the Songnen Plain.
Forests 14 01841 g003
Figure 4. NPP interannual variation of different land cover types from 2001 to 2020.
Forests 14 01841 g004
Figure 5. Spatial distribution diagram of NPP variation trend in the Songnen Plain.
Forests 14 01841 g005
Figure 6. Spatial distribution diagram of monthly NPP in the Songnen Plain.
Forests 14 01841 g006
Figure 7. The monthly NPP trends for different land cover types.
Forests 14 01841 g007
Figure 8. The monthly NPP increments for different land cover types.
Forests 14 01841 g008
Figure 9. The distribution of the correlation coefficients (PCCs) between NPP and meteorological factors precipitation (PRE), temperature (TEM), sunshine hours (SUN), and evaporation (EVA).
Forests 14 01841 g009
Figure 10. Boxplots of PCCs between NPP and meteorological factors in each land cover type.
Forests 14 01841 g010
Figure 11. (a) Soil moisture (SM) distribution contour. (b) The distribution of PCCs for NPP and SM. (c) Boxplot of PCCs between NPP and SM in different cases of land cover types.
Forests 14 01841 g011
Figure 12. (a) Spatial Distribution of elevation in the Songnen Plain. (b) The mean NPP for each land cover type within each elevation level.
Forests 14 01841 g012
Figure 13. (a) Spatial Distribution of slope in the Songnen Plain. (b) The mean NPP for each land cover type within each slope level.
Forests 14 01841 g013
Figure 14. Spatially balanced sampling points in each land cover type.
Forests 14 01841 g014
Figure 15. Variance inflation factors (VIFs) of influencing factors in each land cover: (a) the collinearity diagnosis result; (b) VIFs after elastic net regression.
Forests 14 01841 g015
Figure 16. Contribution of each impact factor of NPP in the Songnen Plain in each land cover type.
Forests 14 01841 g016
Figure 17. Interannual variations of NPP and its primary drivers in the Songnen Plain.
Forests 14 01841 g017
Figure 18. NPP growth transfer matrix of different land covers in the Songnen Plain from 2001 to 2020.
Forests 14 01841 g018
Table 1. Data Source Information Table.
Data TypeData NameTemporal ResolutionSpatial
Resolution
Data SourceYearNote
NPP dataMOD17A3HGF8-day and annual synthetics500 mhttps://lpdaac.usgs.gov/ (accessed on 7 August 2023)2001–2020
Land cover dataLandsat 7 ETM16-day30 mhttps://earthexplorer.usgs.gov/ (accessed on 7 August 2023)2001–2013All land cover data are derived from data with cloud cover less than 5% from Jun to Sept
Landsat 8 OLI16-day30 m2014–2020
Meteorological dataChina Surface Meteorological Observation Historical Data SetMonthly-http://www.nmic.cn/ (accessed on 7 August 2023)2001–2020Meteorological data include PRE (mm), TEM (°C), SUN (h), and EVA (mm) for 40 meteorological stations in and around the Songnen Plain
Soil moisture dataCPC Soil Moisture V2Monthly0.5° × 0.5°http://www.esrl.noaa.gov/psd/data/gridded/data.cpcsoil.html (accessed on 7 August 2023)2001–2020
Terrain dataNASADEM-30 mhttps://search.earthdata.nasa.gov/ (accessed on 7 August 2023)-
Table 2. Elastic net regression analysis results.
Land CoverGRADRYFORPADSWA
Factors
R20.620.640.660.650.65
PRE0.6120.3200.5060.3330.400
TEM−0.002−0.013−0.059−0.131−0.118
SUN0.003−0.1160.004−0.2500.064
EVA0.0070.102−0.0560.0580.003
SM0.2890.2220.0810.156−0.284
DEM0.0930.1930.2790.0460.126
Slope0.0070.0340.0180.028−0.005
Disclaimer/Publisher’s Note: The statements, opinions and data contained in all publications are solely those of the individual author(s) and contributor(s) and not of MDPI and/or the editor(s). MDPI and/or the editor(s) disclaim responsibility for any injury to people or property resulting from any ideas, methods, instructions or products referred to in the content.

