Article

Mutant Bisexual and Wild Male Flowers Were Compared by Integrated Proteome and Transcriptome Analyses to Provide Insight into the Sex Conversion of Idesia polycarpa Maxim

1
College of Forestry, Henan Agricultural University, Zhengzhou 450002, China
2
Henan Academy of Forestry, Zhengzhou 450003, China
*
Author to whom correspondence should be addressed.
Forests 2023, 14(9), 1737; https://doi.org/10.3390/f14091737
Submission received: 19 July 2023 / Revised: 12 August 2023 / Accepted: 24 August 2023 / Published: 28 August 2023
(This article belongs to the Special Issue Advances in Tree Germplasm Innovation and High-Efficiency Propagation)

Abstract

:
Idesia polycarpa is a dioecious tree; in field surveys, there are rare sex conversions in I. polycarpa individuals with bisexual flowers. To identify the molecular mechanisms underlying sex conversion in this species, an integrative analysis of the proteome and transcriptome profiles of I. polycarpa male and bisexual flowers at key developmental stages was conducted in this study using isobaric tags for relative and absolute quantification and RNA-seq technology. A total of 15,003 proteins were identified; the differentially expressed proteins (DEPs) were enriched in metabolic pathways, biosynthesis of secondary metabolites, and flavonoid metabolism pathways in all comparison groups. A total of 290,442 unigenes were obtained; these were compared with seven databases, revealing 196,366 annotated unigenes. In general, the expression of proteins and genes tended to be positively correlated, with Spearman correlation coefficients in the ranges of 0.152–0.262 (all genes and all proteins) and 0.497–0.778 (DEPs and DEGs). The integrative analysis of DEPs and DEGs between male and bisexual flowers revealed that the most significantly enriched pathways were flavonoid pathways, metabolic pathways, and the biosynthesis of secondary metabolites. Finally, four co-expressed proteins and transcripts and one gene associated with the flavonoid biosynthesis pathway were screened out. The proteins identified were p-coumaroyl shikimate 3′-hydroxylase, and shikimate/quinate hydroxycinnamoyl transferase, and the gene was caffeoyl-CoA O-methyltransferase. The analysis has revealed key potential proteins and genes involved in sex conversion at the molecular level and has provided a basis for future investigations of artificial regulation of sex differentiation in I. polycarpa.

1. Introduction

Idesia polycarpa Maxim is a broadleaf tree native to East Asia; the species is widely distributed across China [1,2]. Previous studies of I. polycarpa have focused on cultivation techniques, nutritional components, and medicinal uses. As an economically important tree species, I. polycarpa fruits are used to produce edible oil as well as being a source of biodiesel fuel [3,4,5]. In addition to being an excellent oil-bearing tree, I. polycarpa is also a potential source of traditional medicine [6,7]. I. polycarpa is a dioecious tree, and thus, the flowers are mostly female or male, but some I. polycarpa individual plants possess bisexual flowers (Figure 1). In field surveys, both bisexual and male flowers have been found within individual I. polycarpa trees as well as trees only with bisexual flowers. In addition, our previous observational research on I. polycarpa flowers revealed that the formation of unisexual male flowers was the result of the abortion of the ovule at an early stage of development [2]. The bisexual flowers of I. polycarpa are similar to male flowers except for a perfectly formed ovule, and both the stamens and carpels are normal. The accepted view is that all dioecious species have evolved from bisexual ancestors [8,9]. Under this view, the bisexual flower is a floral bud variant; in other words, I. polycarpa trees with bisexual flowers have undergone sex conversion. Therefore, the modes of sexuality of individual plants with partial or total sex conversion are andromonoecy and bisexuality, respectively. No study of I. polycarpa sex conversion has been reported to date, and thus, the mechanism of mutant bisexual flowers arising from I. polycarpa plants remains unknown.
Proteome and transcriptome technologies are important tools for analyzing gene expression at the post-transcriptional level.Since the gene regulation system is dynamic and overwhelmingly complex, multi-omics integrative analyses are more appropriate for understanding the molecular mechanisms of specific biological reactions than single omics [10,11]. The isobaric tags for relative and absolute quantification (ITRAQ) quantitative proteome analysis technology can quantify proteins with high accuracy and is thus a powerful method of proteome profiling for biological processes [12]. The integrative analysis of proteome and transcriptome data has become an effective method of identifying the potential proteins or genes involved in specific biological processes, thus serving as a powerful tool, especially for non-model plants [13]. High-throughput sequencing technologies, including RNA-seq and ITRAQ-based proteomics, may provide a promising way for addressing genes of non-model organisms for which the entire genome has not been characterized. In recent years, integrative studies employing proteomic and transcriptomic analyses have been conducted on higher plants, including Citrus suavissima [14], Morus atropurpurea [15], Camellia sinensis [16], Zea mays [17], Chimonanthus praecox [18], Camellia oleifera [19], and Liriodendron sino-americanum [20]. There is still a lack of proteomic and transcriptomic information concerning I. polycarpa sex conversion. To identify candidate proteins or genes involved during the critical developmental stages of I. polycarpa male and bisexual flowers, in this study, we performed an integrative analysis of the ITRAQ-based proteomic and RNA-seq transcriptomic profiles of the male and bisexual flowers at chosen key developmental stages. Cytological observations of I. polycarpa male and bisexual flowers during the flowers’ sex differentiation were made to detect the critical stage when ovule abortion of male flowers occurs; we then analyzed the proteomic and transcriptomic profiles of I. polycarpa male and bisexual flowers to identify the proteins and genes related to the most enriched pathways.
Flavonoid metabolism is an important branch of phenylpropanoid metabolism. Flavonoids are plant phenolic compounds belonging to a group of secondary metabolites that play important roles in diverse biological processes in plants [21]. Flavonoids approximate to include over 6000 compounds that are mainly divided into six subclasses: Flavones, flavanones, flavonols, flavanols, isoflavones, and anthocyanidins [22]. The molecular structure of flavonoids consists of a basic C6 –C3–C6 skeleton derived from three C2 units and a phenylpropanoid (C6–C3). As a class of low-molecular-weight phenolic compounds, flavonoid chemical diversity depends on structural substitution patterns in their C6–C3–C6 rings [23,24]. Most of the flavonoids share the same upstream precursors and enzymes, including chalcone synthase (CHS), chalcone isomerase (CHI), flavanone-3-hydroxylase (F3H), flavonoid-3′-hydroxylase (F3′H), and flavonoid-3′5′-hydroxylase (F3′5′H) [25,26,27,28]. Each type of flavonoid undergoes modifications such as acylation, methylation, hydroxylation, glucosylation, and acylation, resulting in an enormous diversity of flavonoids. Flavonoids play a key role in various biological processes, including an indispensable role in plant sexual reproduction. Many plants accumulate flavonoids in anthers and pistils [29,30,31,32,33]. Genes controlling sex differentiation have been identified, and their functions appear to be conserved in higher plants. However, the reason for the emergence of bisexual variant flowers in I. polycarpa remains unclear, and the underlying molecular mechanisms of I. polycarpa sex conversion remain poorly understood. This study aimed to identify the enriched pathways, key genes, and proteins involved in the sex conversion of I. polycarpa bisexual variant flowers, and to provide new options for artificially regulating the sex conversion and hence the flowering and fruiting of I. polycarpa.

2. Materials and Methods

2.1. Plant Materials

This study was conducted in 2019 on 5-year-old I. polycarpa male and bisexual trees with a similar growing status free of diseases and pests. The I. polycarpa male and bisexual trees were planted at the Key Laboratory of Forest Resources Cultivation in the Central Plains of the National Forestry Administration (112°42′114°14′ E, and 34°16′34°58′ N), College of Forestry, Henan Agricultural University, Zhengzhou, China. The male and bisexual flowers were sampled every 5 days from March to late April. After the male and bisexual flowers were collected, each flower sample was divided into three parts for microscopic observation, proteome sequencing, and transcriptome sequencing. The flowers for microscopic observation were fixed in FAA 50, and the remaining material used for proteome sequencing and transcriptome sequencing was immediately frozen in liquid nitrogen in the field and then stored at −80 °C until use. Three biological replicates were set up for each sample.

2.2. Cytological Study

In the cytological study, the anatomical structures of I. polycarpa bisexual and male flowers were examined during the sex differentiation process (March 2019 to late April 2019). The bisexual and male flowers were fixed in FAA 50 for 24 h, dehydrated by a normal ethyl alcohol series, and then infiltrated and embedded in paraffin at 60 °C following standard protocols. The embedded materials were sectioned at 7 μm and then stained with safranin/fast green. The digital image scanner technique and the “Case Viewer” digital image processing software were chosen to analyze the anatomical structure of the flowers. In a previous study [2], morphological and cytological examinations of I. polycarpa bisexual, male, and female flowers were conducted. Furthermore, the unisexual male and female flowers are type I flowers, and the ovule primordia abortion of I. polycarpa male flowers occurs at sexual organ abortion stage 1 [34], i.e., in bisexual flowers with a functional ovule. For the cytological study, we aimed to detect the critical stage at which the ovule of male flowers is aborted and then focus on two stages, i.e., before and after the ovule abortion in male flowers, and the same two developmental stages in bisexual flowers. The samples used for ITRAQ and RNA-seq analyses were collected from the same stages of bisexual and male flowers, according to the paraffin sectioning results.

2.3. Protein Identification and Quantification

Based on the paraffin sectioning results, four samples (bisexual flowers (HA, HB), and male flowers (MA, MB)) were used for protein extraction, each sample having three biological replicates. We set HA vs. MA, HB vs. MB, MB vs. MA, and HB vs. HA as comparison groups. The ITRAQ technology was used for proteome analysis [12], and the ITRAQ analysis was conducted at the Beijing Genomics Institute (BGI) (www.genomics.cn, accessed on 19 November 2019, BGI, Shenzhen, China). In brief, the total protein of I. polycarpa flowers was obtained based on the TCA/acetone precipitation method, and the Bradford and SDS-PAGE methods were used for quality assessment of the total extracted protein concentration. Protein was digested by Trypsin Gold (Promega, Madison, WI, USA) with a ratio of protein:trypsin = 40:1 at 37 °C overnight. After protein digestion, the resulting peptides of each sample were labeled by ITRAQ reagent 8-plex labeling tags according to the manufacturer’s instructions [35]. The labeled peptide analysis was performed on a Shimadzu LC-20AB HPLC pump system for fractionation, followed by HPLC-MS/MS (high-performance liquid chromatography with tandem mass spectrometry (Thermo Fisher Scientific, Waltham, USA) analysis to separate and detect the peptides [36]. The tandem mass (MS/MS) spectra data were converted into MGF format files by the Proteome Discoverer software (version 2.1). All MGF files were searched by the MASCOT server (version: 2.3.02, Matrix Science, London, UK) against the GO and KEGG databases to identify proteins [37]. The parameter settings of MASCOT are listed in Table 1. False discovery rate (FDR) was used in multiple testing corrections for adjusting the p-values of each gene to Q-values [38,39,40]. Identification of peptides used the criterion of peptide-level FDR less than 1% [41]. ITRAQ quantification was applied by BGI’s automated software IQuant (version 2.0.1) [42] to quantify the peptides being labeled by isobaric tags. The IQuant is integrated with the Mascot Peroclator [37]. Only unique peptides were chosen to quantify proteins, and the quantification of proteins employed only the peptides with reporter ions. The significance threshold for differentially expressed proteins (DEPs) was set to fold change (FC) ≥ 1.2 or ≤ 0.83 and a Q-value (adjusted p-value) ≤ 0.05 in single replicates. A Q-value near 0 indicates that the results are credible. The final set of DEPs was defined in at least two replicates.

2.4. mRNA Library Construction, Sequencing and Quantification

For the transcriptome analysis, samples of bisexual (Ha, Hb) and male flowers (Ma, Mb) were chosen according to the paraffin sectioning results. HA/Ha occurring in the same sample allowed easier processing of the proteomics (HA) and transcriptomics (Ha) data, and this was similar for HB/Hb, MA/Ma, and MB/Mb. Total RNA was extracted and sequenced using gene de novo technology at the Beijing Genomics Institute (www.genomics.cn, accessed on 19 November 2019, BGI, Shenzhen, China). Each sample was performed in three biological replicates, and a total of 12 cDNA libraries of bisexual and male flowers (Ha, Hb, Ma, and Mb) were generated and sequenced using the BGISEQ-500 NGS (the next-generation sequencing) Platform (BGI-Shenzhen, China) [43] that was developed by BGI. The BGISEQ-500 Platform using DNA NanoBalls (DNBs) technology [44] was used for library construction, and combinational probe-anchor synthesis (cPAS) was used for sequencing. Briefly, the total RNA of each tissue was extracted by ethanol precipitation and the CTAB-PBIOZOL reagent according to the manufacturer’s instructions; in addition, the total RNA was qualified with an Agilent 2100 bioanalyzer (Thermo Fisher Scientific, Waltham, USA). The extracted poly (A) mRNA was purified using oligo(dT)-attached magnetic beads, followed by breaking into short pieces using fragmentation buffer, and the obtained short fragments were reverse transcribed to first-strand cDNA using random hexamer primers, after which a second-strand cDNA was synthesized. The cDNA was repaired at the 5′ end to obtain a blunt end, and poly(A) tails were added at the 3′ end. The double-stranded DNA fragments were subjected to heat treatment for denaturation and ligated to oligo sequence adapters to obtain single-strand circular DNA (ssCir DNA) for PCR amplification and the construction of an ssCir DNA sequencing library. The final ssCir DNA library was then sequenced on the BGISEQ-500 platform according to the manufacturer’s protocol.
The total raw data were filtered with SOAPnuke software (v1.5.2) to remove reads containing sequencing adaptors, reads with poly N, and low-quality reads [45]. After obtaining the high-quality FASTQ format clean reads, the total clean reads were used for subsequent bioinformatic analysis. Given the absence of the entire genome of I. polycarpa, the de novo strategy was chosen to assemble clean reads into transcripts [46]. The Trinity (v2.0.6) program was employed to assemble contigs [47], and Tgicl (v2.0.6) was used to eliminate redundant data to obtain the final unigenes [40]. The assembled transcripts were used for further bioinformatic expression analysis, and the clean reads were aligned to the reference coding gene set by Bowtie2 (v2.2.5) [48]. For quantitative analysis of RNA-seq data, all matched reads/fragments were normalized and calculated according to the value of fragments per kilobase of transcripts per million mapped fragments (FPKM) using RSEM software (version: 1.2.12) [49]. In this study, the statistical package DESeq2 (v1.4.5) was chosen to identify differentially expressed unigenes (DEGs) [50]. The thresholds of significant DEGs were FC (fold change) ≥ 2 or ≤0.5 and FDR ≤ 0.05. The final DEGs were defined in at least two replicates.

2.5. Bioinformatic Analysis

The ITRAQ-based mass spectrometry proteomics raw dataset has been uploaded to the ProteomeXchange (http://www.proteomexchange.org/, accessed on 14 March 2023) [51], and the mRNA clean dataset has been uploaded to the database of the NCBI Sequence Read Archive (SRA, https://www.ncbi.nlm.nih.gov/sra/, accessed on 23 March 2023). The NT, NR, SwissProt, GO, KEGG, KOG, and Pfam databases were chosen to obtain the functional annotations of proteins and genes using the Basic Local Alignment Search Tool (BlAST, v2.2.23) software [52]. The Gene Ontology (GO) database is a major internationally standardized functional classification database of gene functions across all species [53]. The Kyoto Encyclopedia of Genes and Genomes (KEGG) is a major online public database listing known biochemical pathways. The KEGG pathway database is a collection of manually drawn pathway maps featuring wiring diagrams of molecular interactions, reactions, and relations [54]. In this study, KEGG pathway annotation and GO categorization were performed to obtain the enriched biological pathways [55]. The hypergeometric test was used to test the significance of enriched pathways within proteins and genes [56], with the threshold set at Q-value (adjusted p-value) ≤ 0.05. All identified proteins and genes were annotated and loaded into Blast2GO (v2.5.0) for GO annotation [57] against the GO database (http://www.geneontology.org/, accessed on 21 December 2019). The DEPs and DEGs in FASTA format sequences were blasted against the KEGG database (http://www.kegg.jp/, accessed on 21 December 2019) to retrieve their KOs and enriched pathways. The significance level for pathways and terms was a threshold Q-value ≤ 0.05. Venn diagrams were chosen to identify the DEPs and DEGs set in various comparison groups. In addition, since proteome and transcriptome data reflect gene expression at two different levels, a correlation analysis of the two omics helps explore the regulation of gene expression [10,13]. Correlation analysis was conducted to identify the enriched items at the two omics levels, and Spearman correlation coefficients were calculated [58,59]. In addition, the DEPs and DEGs were mapped to the KEGG and GO databases to obtain common enriched pathway information.

2.6. qRT-PCR Analysis

To validate the reliability of the RNA−seq analysis results, nine flavonoids with biosynthesis-related DEGs were selected for qRT−PCR analysis. Gene primers were designed by Primer Premier 5.0 online software. The UBA80 (primer sequence (5′–3′): F:AAGACCTACACCAAGCCGAA, R:CTCCGCACTCAGCATTAGGACA) was chosen as an internal control gene for normalization [60]. Total mRNA was reverse transcribed to cDNA using the M-MuLV First Strand cDNA Synthesis Kit (Sangon Biotech, China) according to the manufacturer’s instructions, then subjected to qRT-PCR using SYBRTM Select Master Mix on an ABI 7500 real-time PCR system (Thermo Fisher Scientific, Waltham, MA, USA). The qRT−PCR amplification conditions were as follows: 95 °C for 2 min; 40 PCR cycles of 20 s at 95 °C, 30 s at 58 °C, and 30 s at 72 °C. Each sample was performed in three biological and three technical replicates. Relative gene expression levels were calculated using the 2−∆∆Ct method [61]. The sequences of primers are listed in Supplementary Table S1.

3. Results

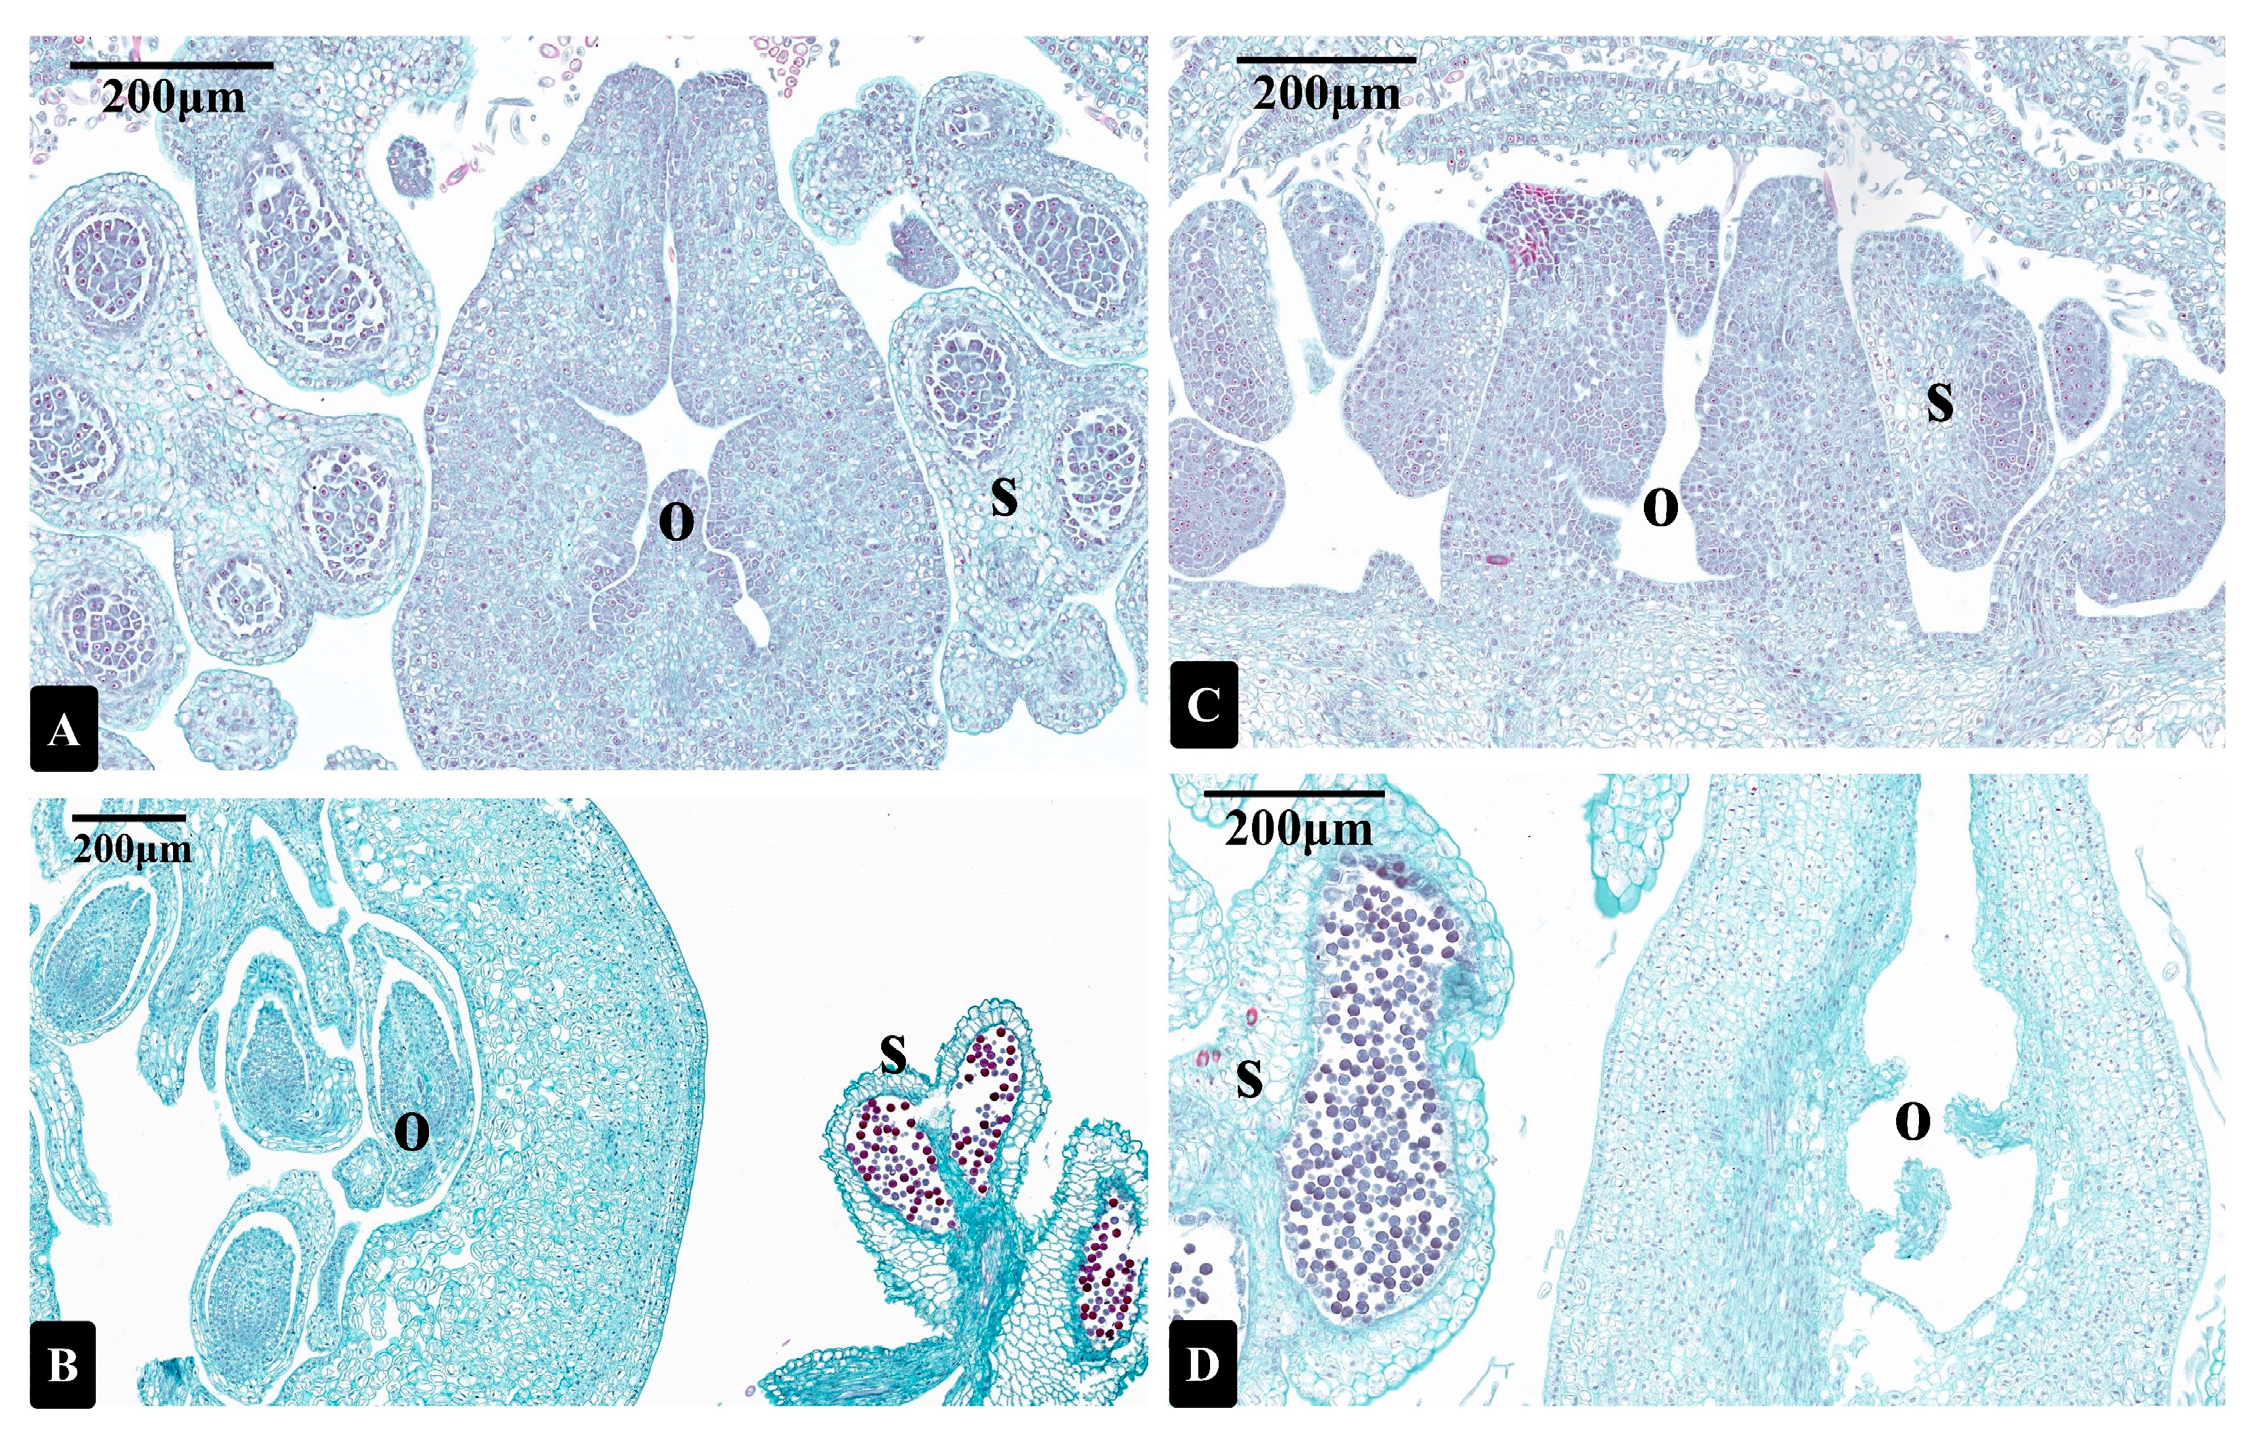
3.1. Photomicrographs of Longitudinal Sections of I. polycarpa Male and Bisexual Flowers

According to our previous study on the anatomy of I. polycarpa flowers [2], the male and bisexual flowers of I. polycarpa have the same anatomical structure at the initial differentiation stage, and then differences begin to appear due to the arrest of the development of heterosexual reproductive organs. During the gynoecium differentiation period of unisexual male flowers, the ovule primordia are aborted during the early carpel differentiation stage, while the bisexual flowers develop functional pistils and stamens. The male and bisexual flowers of I. polycarpa both have ovule primordia at the beginning of floral differentiation (Figure 2A,C); differences emerge between the two types during the later differentiation period. The ovule cells of the male flowers stop developing after the ovule primordia initiation; aborted ovules appear small, shrinking into a mass of subcellular components and failing to develop into seeds (Figure 2D), while the developing ovules of bisexual flowers remain plump and can develop into viable seeds (Figure 2B). Therefore, according to the results of I. polycarpa male and bisexual flowers’ anatomical structure, the critical stages of sex differentiation of the two sexual types of flowers were chosen: Male (Ma/MA; Mb/MB) and bisexual flowers (Ha/HA; Hb/HB). Figure 2 shows examples of Ma/MA before the ovule abortion of male flowers (Figure 2C), Mb/MB after the ovule abortion of male flowers (Figure 2D), Ha/HA (Figure 2A) at the same stage as Ma/MA, and Hb/HB (Figure 2B) at the same stage of Mb/MB. An integrative analysis of the proteome (MA, MB, HA, HB) and transcriptome (Ma, Mb, Ha, Hb) profiles of I. polycarpa male and bisexual flowers at chosen key developmental stages was conducted according to the paraffin sectioning results. MA/Ma indicates the same sample: MA for proteome, Ma for transcriptome, and similar for MB/Mb, HA/Ha, and HB/Hb.

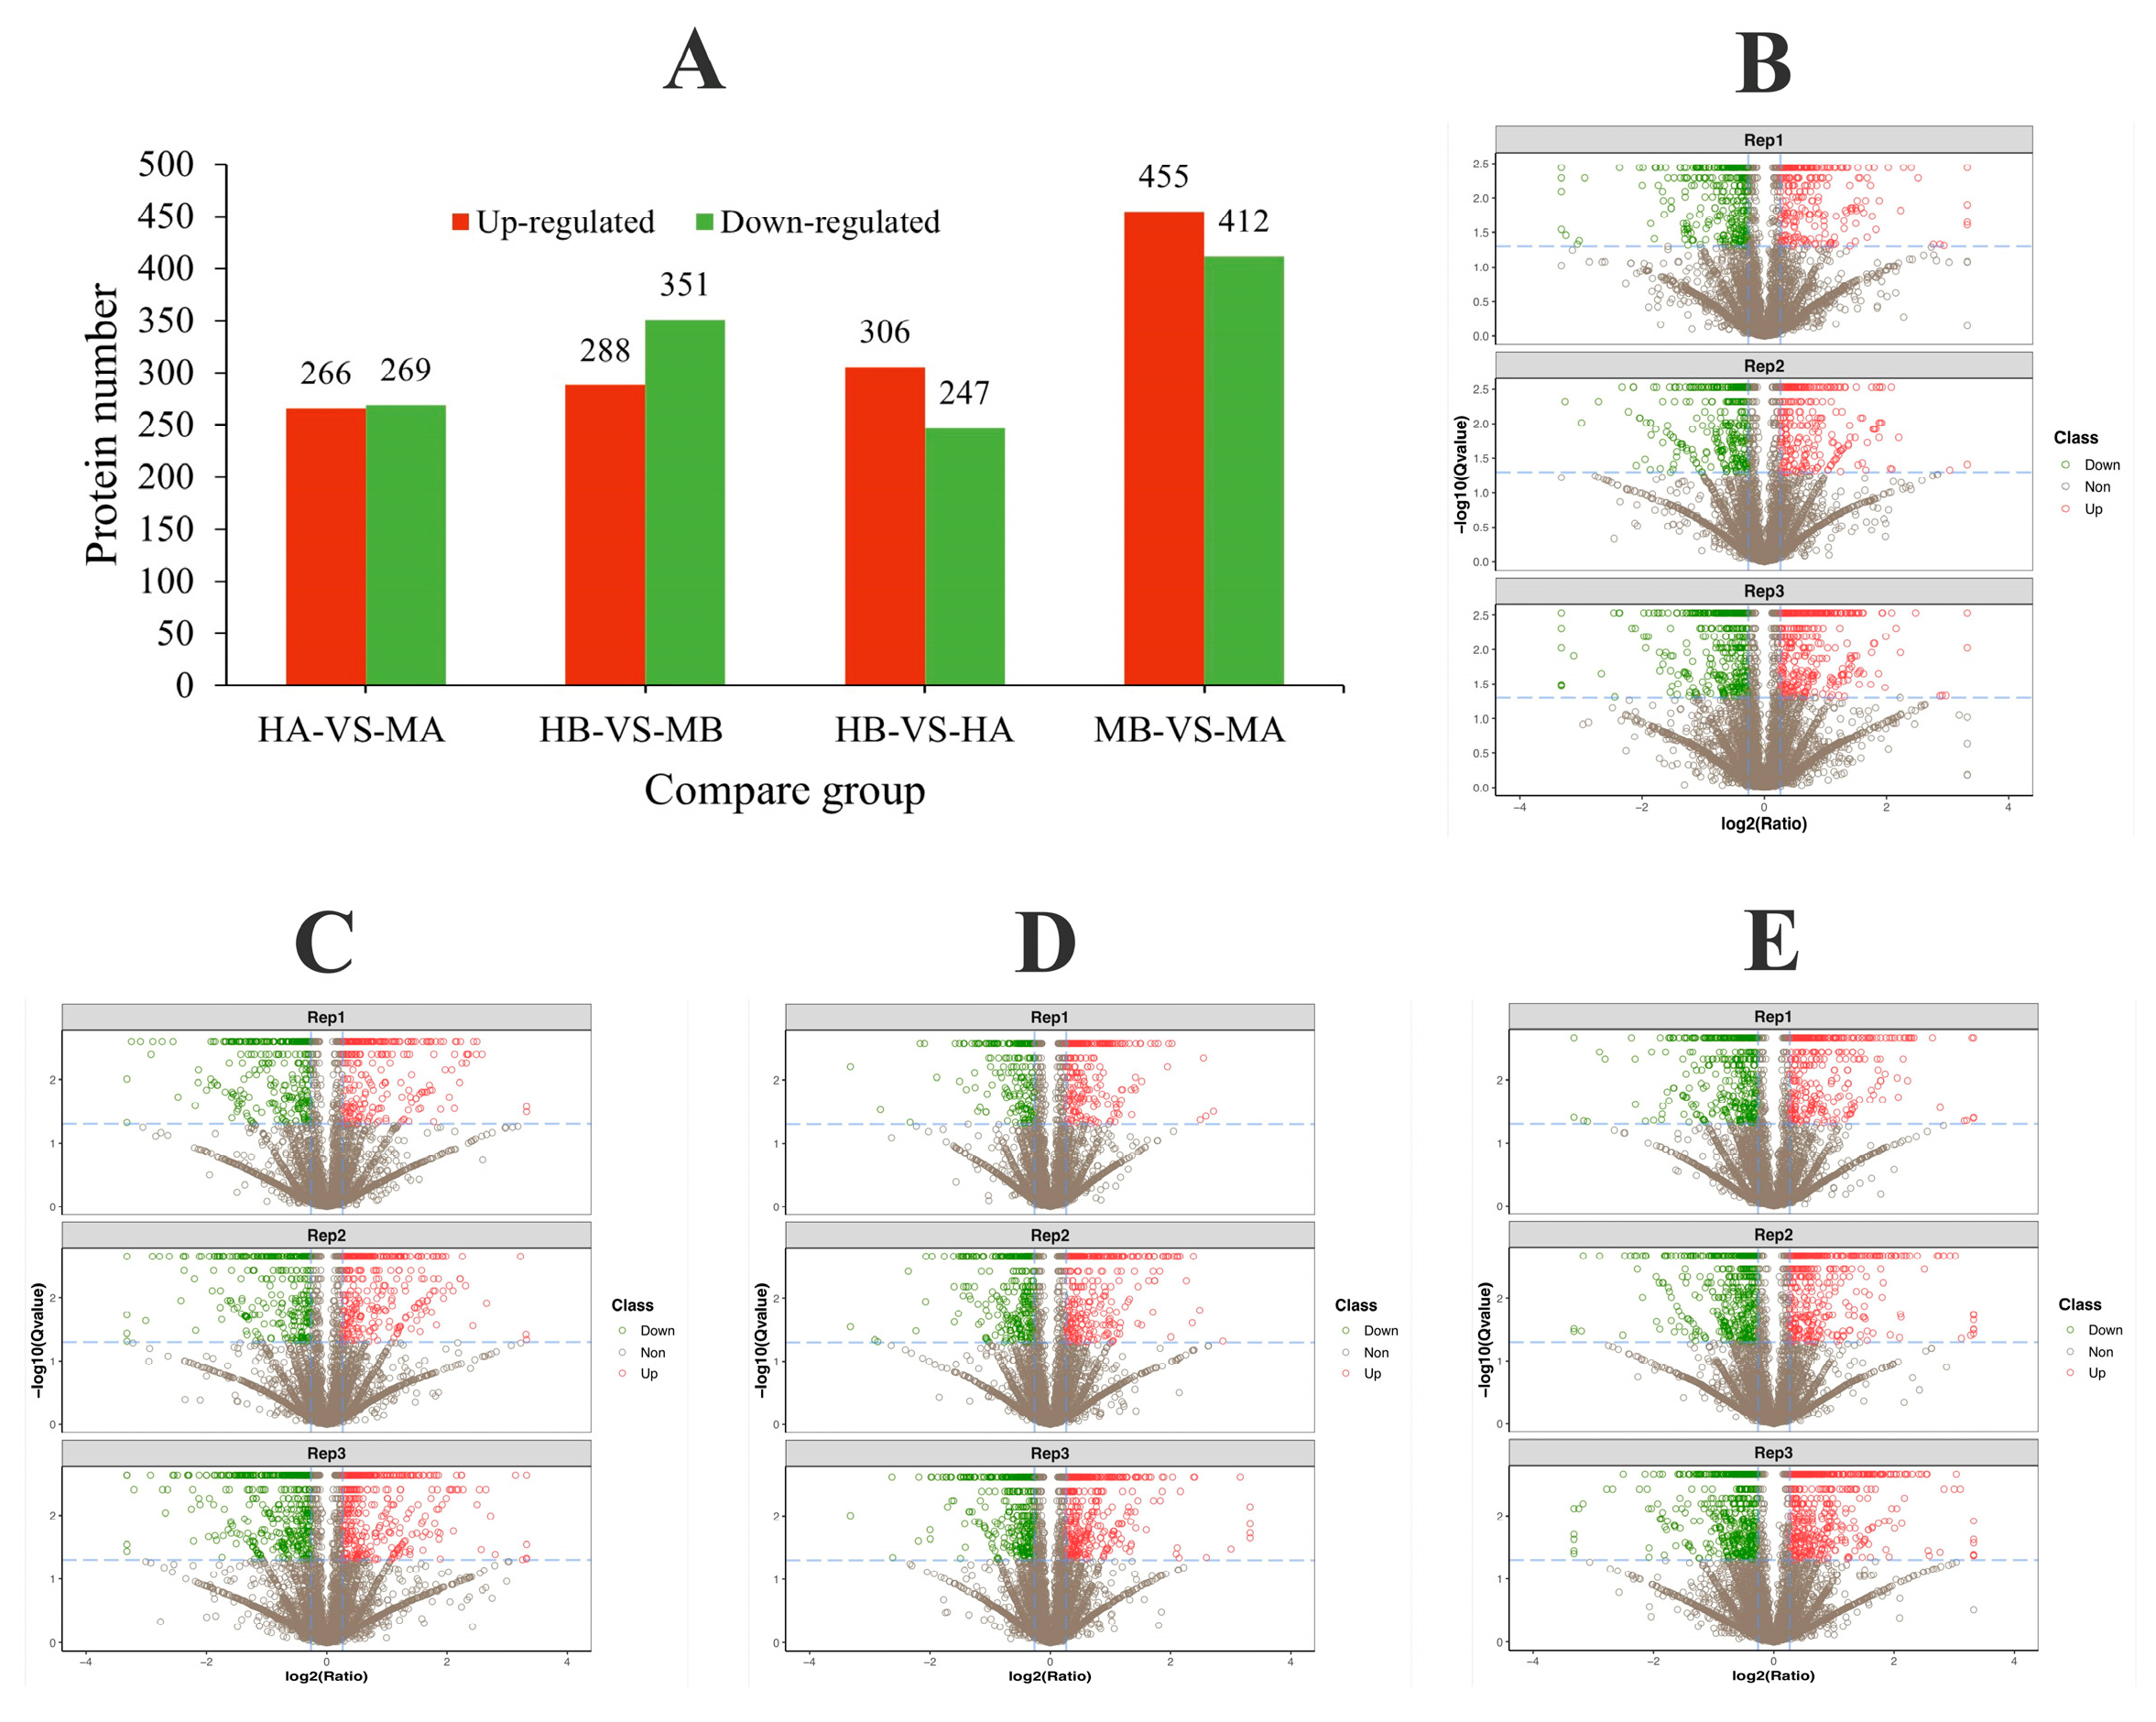
3.2. The ITRAQ Proteomic Analysis and Identification of DEPs

In this project, a proteomics analysis of two chosen key developmental stages of I. polycarpa male and bisexual flowers was performed to examine the potential molecular mechanisms of sex conversion in I. polycarpa flowers. A total of 2,820,532 mass spectra were collected from this study, of which 338,069 mapped to the database (Table 2). More than 920,000 mass spectra were collected from each replicate in this study; by eliminating low-scoring spectra, 111,497, 115,434, and 111,138 spectra were collected from three replicates. A total of 15,003 proteins were identified in I. polycarpa flower samples (Table 2). A total of 6051 proteins were common to the three replicates, and 5532 proteins were uniquely identified in one replicate (Figure S1A). More than half of all proteins were identified with at least two unique peptides in this study (Figure S1B), indicating the high reliability of the data. Based on ITRAQ quantitative proteomics, the differential expression analysis showed that the numbers of DEPs in the HA vs. MA, HB vs. MB, MB vs. MA, and HB vs. HA comparison groups all exceeded 500 (Figure 3A). The numbers of downregulated DEPs in the HA vs. MA and HB vs. MB comparison groups were both greater than the numbers of upregulated DEPs, while the numbers of downregulated DEPs in the HB vs. HA and MB vs. MA comparison groups were less than the numbers of upregulated DEPs (Figure 3A). The volcano plots of the DEPs in the four comparison groups (Figure 3B–E) indicated that the biological replicates of the same sample were highly correlated.

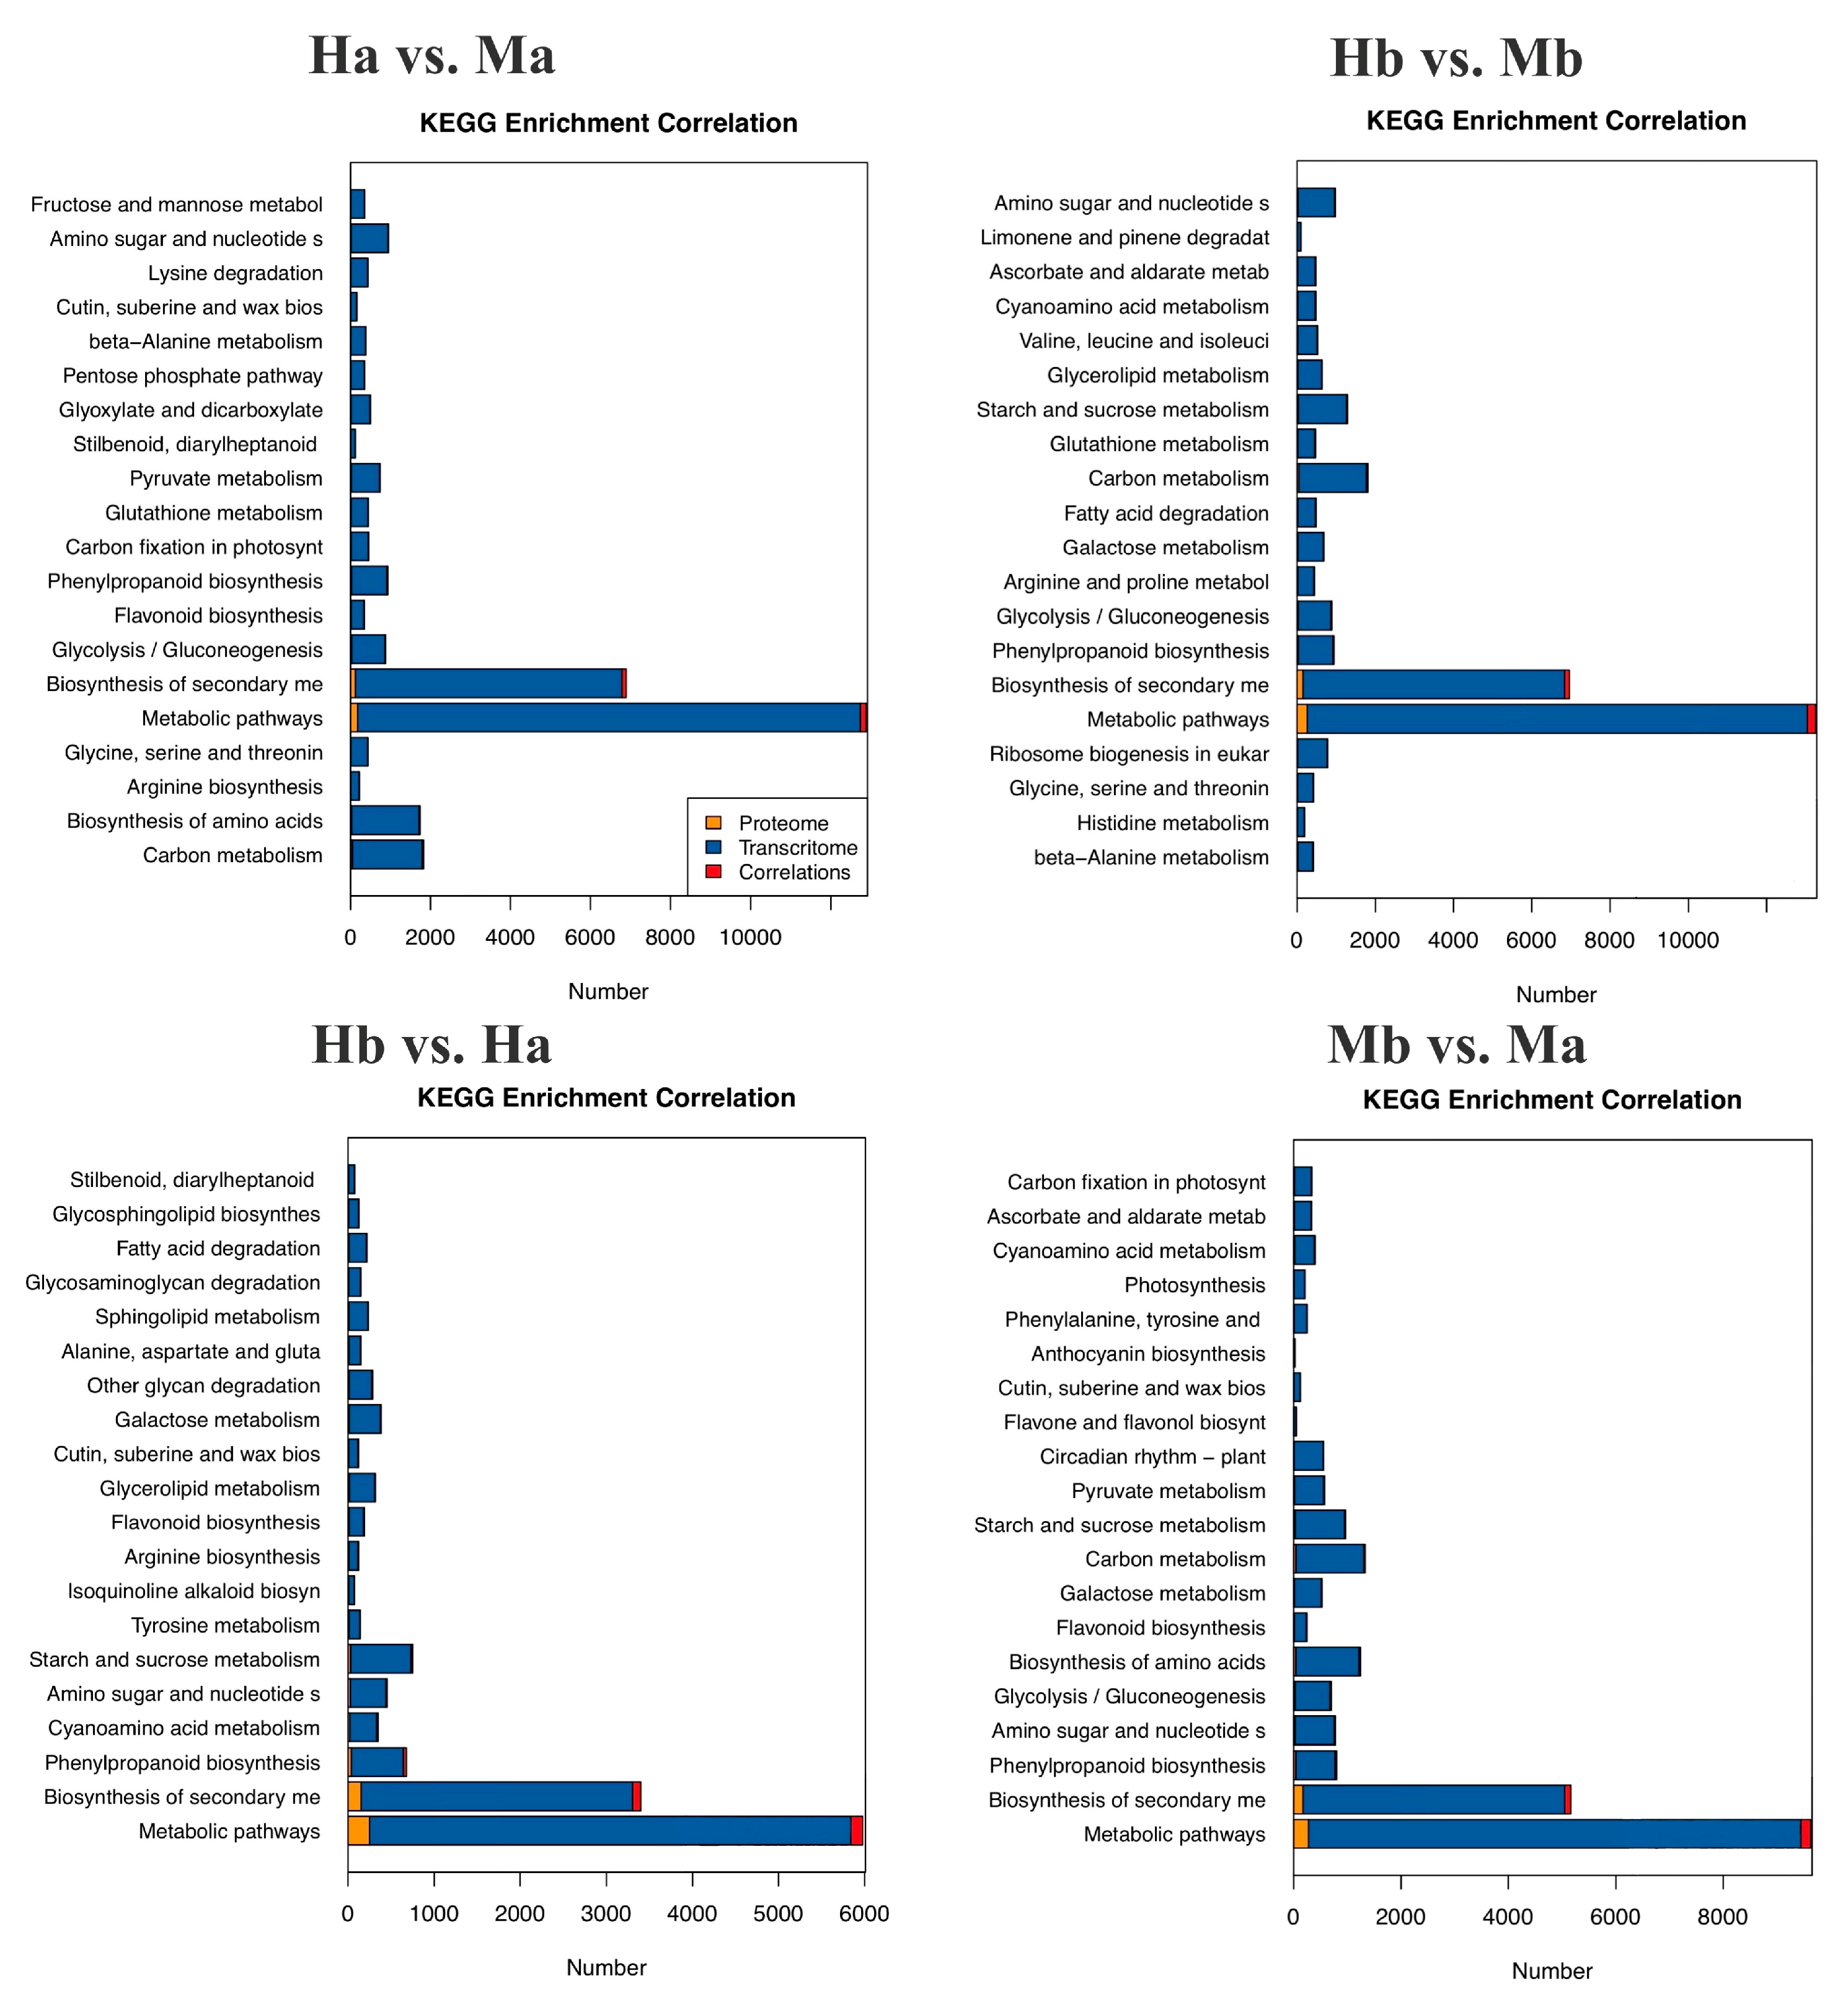
3.3. KEGG and GO Enrichment Analyses of DEPs

KEGG and GO analyses were conducted to classify and annotate DEPs, and GO enrichment analysis was chosen to classify the DEPs of I. polycarpa male and bisexual flowers. A bar graph of GO classifications is shown in Figure S2. The representative enriched GO terms of DEPs were cellular process and metabolic process within the category of biological process. In the cellular component category, most of the proteins were involved in the cell and cell part, and in the molecular function category, most were enriched in catalytic activity and binding, indicating that the DEPs were involved in metabolic process in the cellular part. To further reveal the enriched pathways of DEPs of I. polycarpa male and bisexual flowers, the top 20 KEGG pathways in the four comparison groups were identified (Figure S3). The common enriched pathways among the groups were metabolic pathways (Ko01100), biosynthesis of secondary metabolites (Ko01110), carbon metabolism (Ko01200), phenylpropanoid biosynthesis (Ko00940), and flavonoid biosynthesis (Ko00941). In addition, pathway analysis revealed that the DEPs were enriched in amino sugar and nucleotide sugar metabolism (Ko00520), ascorbate and aldarate metabolism (Ko00053), other glycan degradation (Ko00511), arginine and proline metabolism (Ko00330), and tryptophan metabolism (Ko00380). The KEGG-enriched pathways involved in metabolic pathways (Ko01100) and phenylalanine-related pathways (Ko00940, Ko00941) are consistent with the GO-based enrichment categories. The results of KEGG and GO enrichment analyses of DEPs revealed that the most widely enriched pathways were both related to the biosynthesis of secondary metabolites, especially phenylpropanoid biosynthesis (Ko00940) and flavonoid biosynthesis (Ko00941).

3.4. Results of RNA-seq Assembly and Unigenes Annotation

With three replicates for each sample (Ma, Mb, Ha, and Hb), a total of 12 cDNA libraries from I. polycarpa male and bisexual flowers were constructed and sequenced. The samples used for ITRAQ and RNA-seq analysis were collected from the same stages of male and bisexual flowers. After quality control and low-quality data screening, a total of 78.84 Gb of clean reads were retained, ranging from 6.46 to 6.76 Gb for each sample (Table 3). The total clean reads were assembled into 290,442 unigenes by using Trinity de novo assembly software. The mean GC content of unigenes was 40.48% (Table 3). The results of de novo assembly unigene statistics are listed in Table S2, including total number, total length, mean length, N50, N70, and N90 of unigenes (the N50, N70, and N90 sizes 50%, 70%, and 90% of the bases of the genome contained in contigs or longer, respectively). The unigenes had an average length of 1260 bp, and the N50, N70, and N90 sizes were 2259 bp, 1545 bp, and 509 bp, respectively. The PCA plot of the identified transcripts of 12 samples of I. polycarpa male and bisexual flowers at different developmental stages showed that these were strongly correlated, indicating that the experiment had good reliability (Figure S4). Figure S5 summarizes the overall statistics of all unigenes, and the length distribution of all assembled unigenes is shown in Figure S5A. In summary, 164,125 (56.51%), 186,788 (64.31%), 121,447 (41.81%), 127,956 (44.06%), 127,579 (43.93%), 122,436 (42.16%), and 131,140 (45.15%) unigenes were annotated in the NR, NT, SwissProt, KEGG, KOG, Pfam, and GO databases, respectively (Figure S5B). Plant species with homologous unigene sequences with I. polycarpa included Populus trichocarpa (44%), Populus alba (18%), Populus euphratica (17%), Salix brachista (9%), and Hevea brasiliensis (1%) (Figure S5C). In this study, we compared all assembly unigenes against the KOG database to identify the unigenes’ functions. A total of 127,579 unigenes were allocated into 25 KOG classifications, and the top five categories were “General function prediction only” (25,613, 20%), “signal transduction mechanisms” (14,305, 11%), “posttranslational modification, protein turnover, chaperones” (10,649, 9%), “transcription” (9217, 7%), and “carbohydrate transport and metabolism” (5444, 4%) (Figure S5D).

3.5. The Enriched GO Terms and KEGG Pathways of Unigenes

The GO classification was chosen to describe gene function in three categories, i.e., biological process, cellular component, and molecular function. A total of 131,140 unigenes were categorized into 43 GO functional subclasses (Figure S6). In the biological process, the largest number of genes was in the GO “cellular process”; in the cellular component, “cellular anatomical entity” was the most representative category; and “binding” and “catalytic activity” were highly correlated in molecular function. In this study, 127,956 unigenes were assigned to the KEGG database (Figure S6). The most highly correlated pathways were “Carbohydrate metabolism” (10,817), “Translation” (10,184), “Folding, sorting and degradation” (8078), “Signal transduction” (6582), and “Amino acid metabolism” (5584).

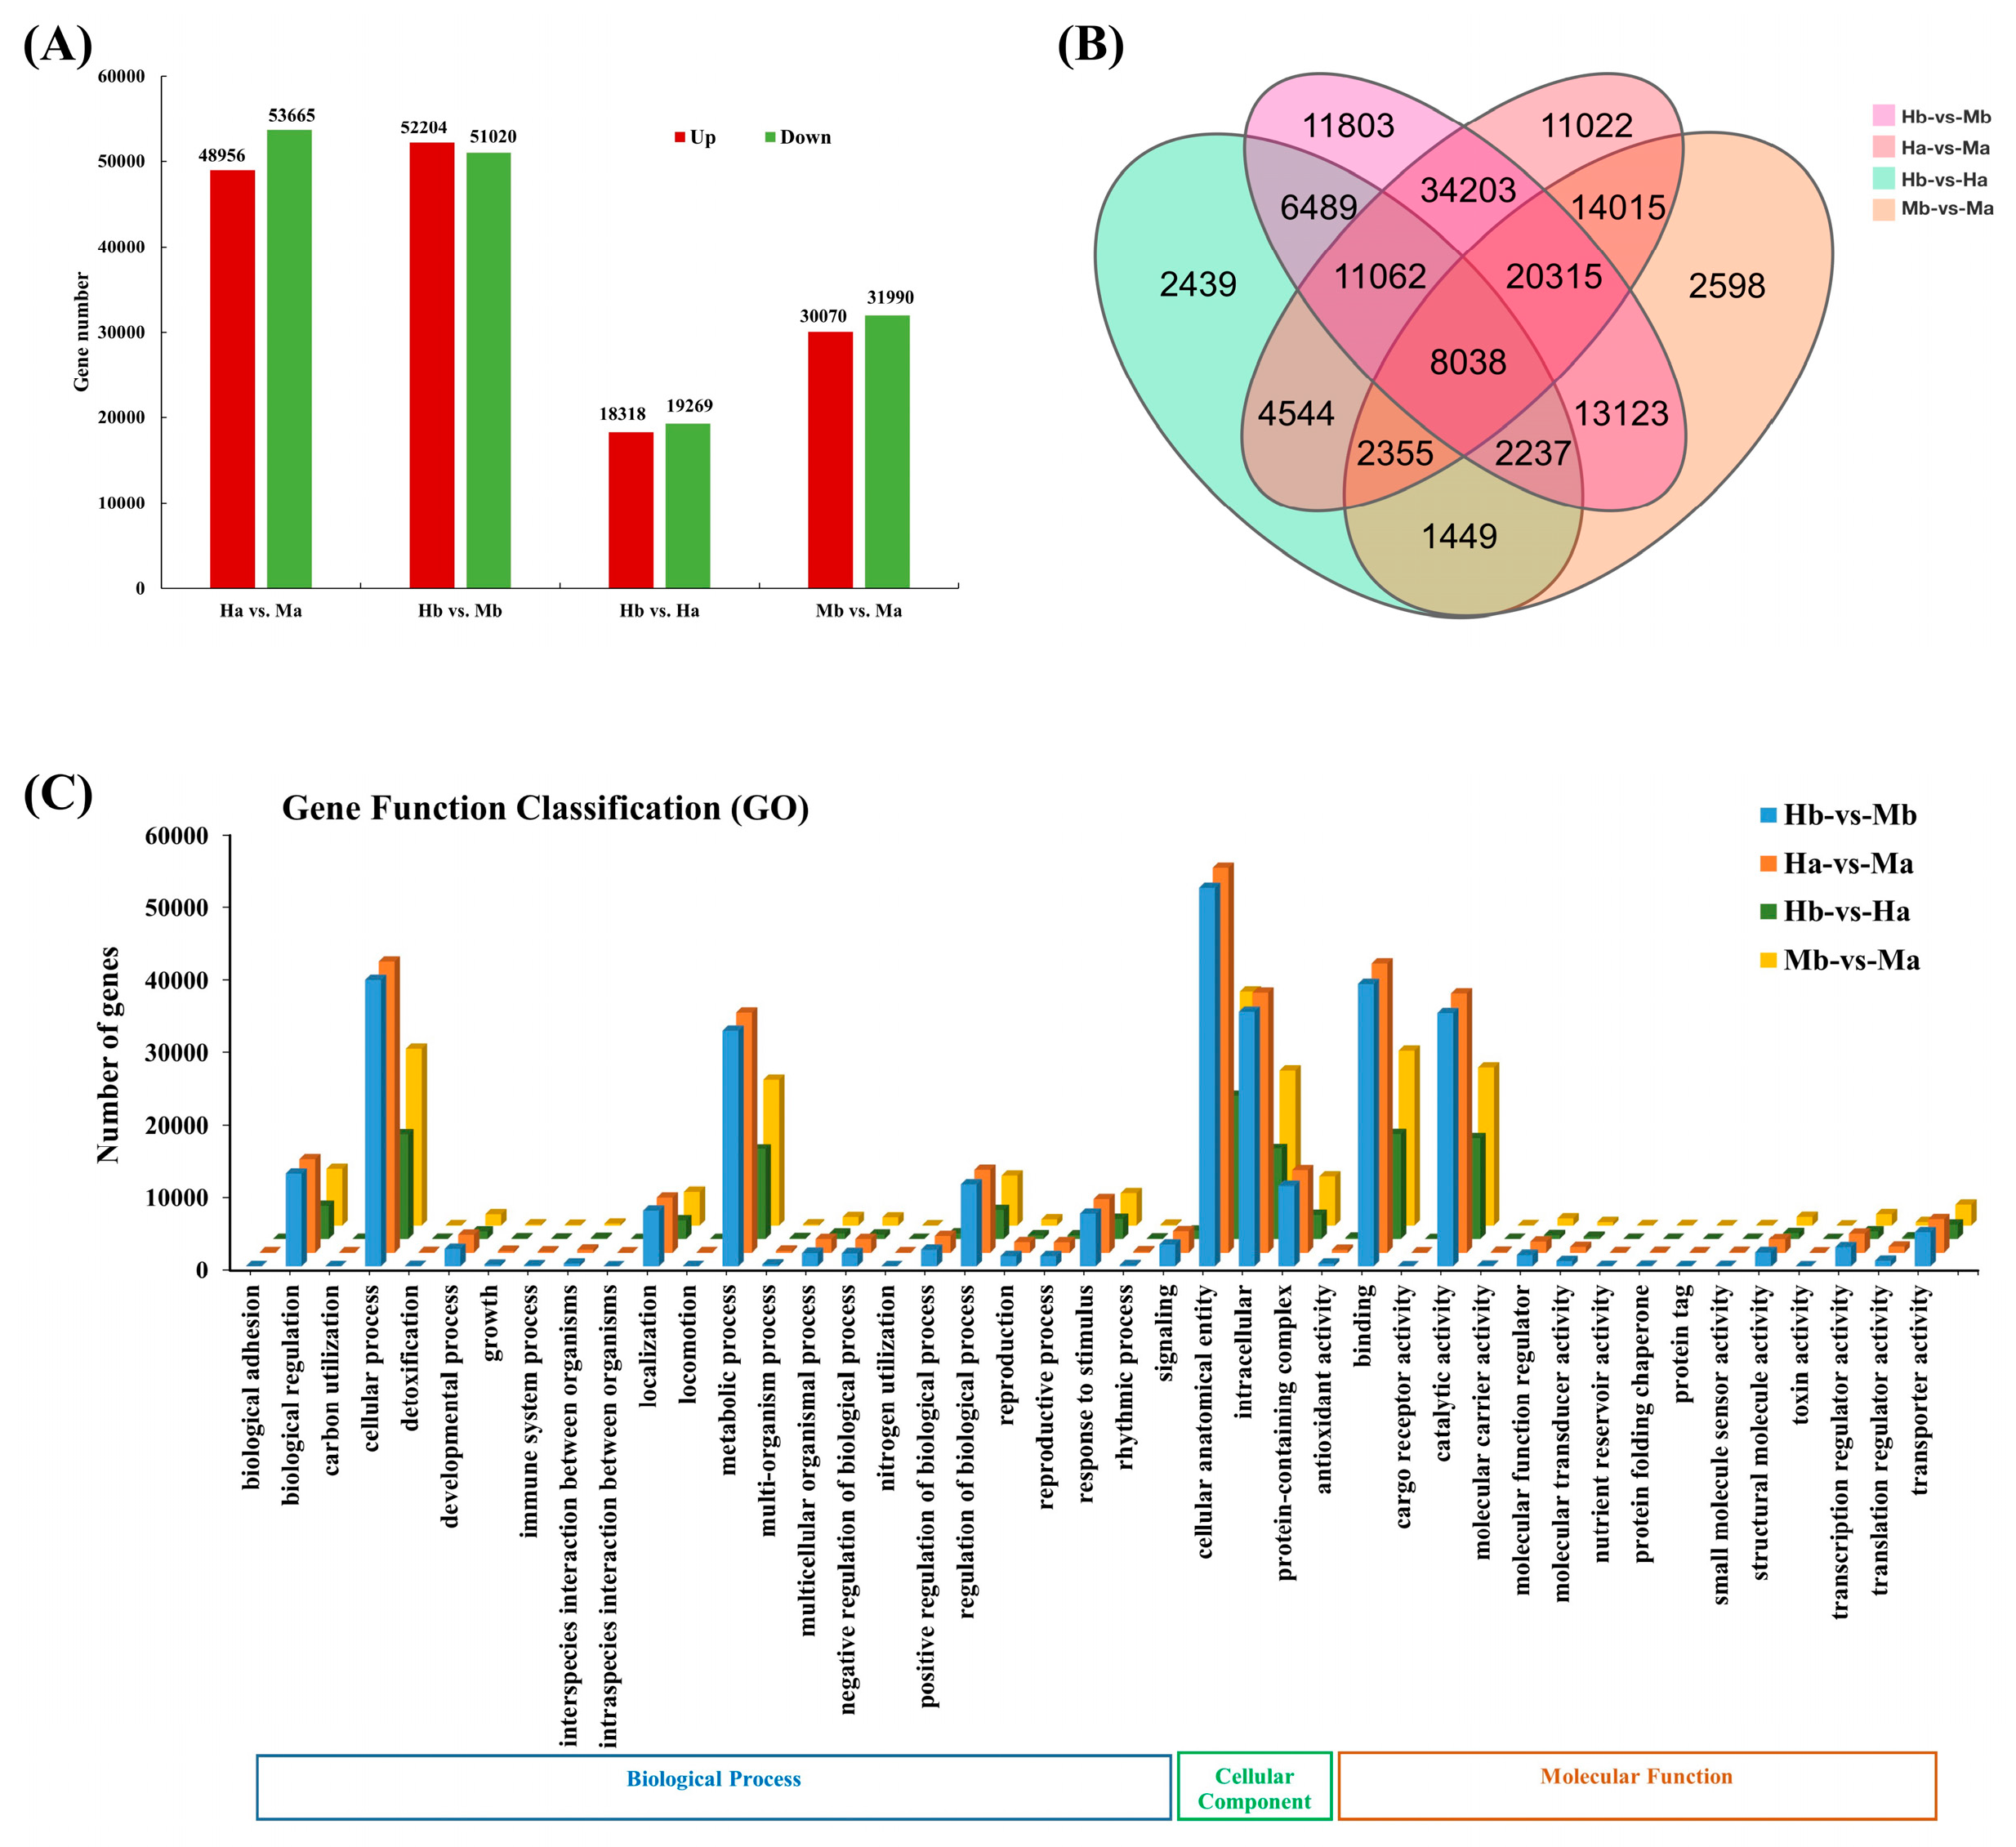
3.6. Identification and Enrichment Analysis of DEGs

We next identified the DEGs between male and bisexual flowers. The significant DEGs were selected through the thresholds of FC ≥ 2 or ≤0.5 and FDR ≤ 0.05. A total of 105,554 significant DEGs were identified among the four comparison groups (Hb vs. Mb, Ha vs. Ma, Hb vs. Ha, and Mb vs. Ma). Based on our analysis, the respective numbers of DEGs were 103,224, 102,621, 37,587, and 62,060 (Figure 4A). In Hb vs. Mb, 52,204 upregulated and 51,020 downregulated genes were identified. In Ha vs. Ma, there were 48,956 upregulated and 53,665 downregulated genes. In Mb vs. Ma, 30,070 upregulated and 31,990 downregulated genes were identified. The comparison Hb vs. Ha showed the least number of DEGs, with 18,318 upregulated and 19,269 downregulated genes. A Venn diagram was used to compare the four groups (Figure 4B). In detail, 11,803, 11,022, 2439, and 2598 DEGs were unique to Hb vs. Mb, Ha vs. Ma, Hb vs. Ha, and Mb vs. Ma, respectively, and a total of 8038 DEGs were common to all four comparison groups. The GO classifications of DEGs in the four comparison groups (Figure 4C) showed that in the molecular function category, the DEGs of the four groups were all addressed to the terms of binding and catalytic activity. According to the biological process analysis, the DEGs were involved in the cellular process and metabolic processes. For the cellular component GO terms, all DEGs were involved in cellular anatomical entity and intracellular terms. To further identify the biological functions of I. polycarpa DEGs, all DEGs from male and bisexual flowers were then subjected to KEGG pathway enrichment analysis. Totals of 102,621, 103,224, 37,587, and 62,060 DEGs were allocated to KEGG pathways in Ha vs. Ma, Hb vs. Mb, Hb vs. Ha, and Mb vs. Ma, respectively. The most enriched KEGG pathways of DEGs in each comparison group are shown in Figure S7. The ribosome (Ko03010) pathway was significantly enriched in all comparison groups, indicating that the biological functions of I. polycarpa DEGs are primarily associated with genetic information processing and translation. The cysteine and methionine metabolism (Ko03015) pathway was significantly enriched in DEGs in the Ha vs. Ma comparison group.

3.7. Correlation Analysis of the Proteome and Transcriptome Data

The proteome and transcriptome data reflect gene expression at two different levels. The Spearman correlations were calculated for all expression data at the protein and mRNA levels. The correlation analysis results for the proteome and transcriptome data are shown in Table S3. Spearman correlation coefficients for protein and mRNA were in the range of 0.152–0.262 at the quantitative level (Figure S8). There was a weak positive correlation between all proteins and all genes. The Spearman correlation coefficients for DEPs and DEGs were in the range of 0.497–0.778 (Figure S9), indicating extensive posttranslational and transcriptional regulation. The numbers of correlated genes and proteins at quantification and different expression levels are listed in Table S4. More than 93% of all identified proteins were covered by the transcriptome data at the quantitative level. The analysis of the protein and mRNA information with the same significantly differential expression trend is helpful in confirming the sequencing results. The Spearman correlation coefficients of the same trend in DEPs and DEGs were 0.805–0.891 (Figure S10). DEPs and DEGs with the same trend were remarkably well correlated, indicating that the transcriptome data were reliable.
An integrative analysis of the proteome and transcriptome profiles of I. polycarpa male and bisexual flowers at chosen key developmental stages was conducted. The KEGG enrichment correlation analysis of transcriptome and proteome analysis (Figure 5) showed that the metabolic pathways (Ko01100), biosynthesis of secondary metabolic (Ko01110), and flavonoid biosynthesis (Ko00941) pathways were significantly enriched at two omics levels. The top 10 annotated KEGG pathways of correlated DEPs and DEGs are shown in Table S5. The most significantly enriched KEGG pathways were RNA transport (Ko03013), metabolic pathways (Ko01100), biosynthesis of secondary metabolites (Ko01110), carbon metabolism (Ko01200), phenylpropanoid biosynthesis (Ko00940), and flavonoid biosynthesis (Ko00941). Among the DEGs of male and bisexual flowers, the most enriched pathways were circadian rhythm (Ko04712), mRNA surveillance pathway (Ko03015), phenylpropanoid biosynthesis (Ko00940), RNA transport (Ko03013), and flavonoid biosynthesis (Ko00941) (Figure S7); the common enriched pathways of DEPs among the 4 compare groups were metabolic pathways (Ko01100), biosynthesis of secondary metabolites (Ko01110), carbon metabolism (Ko01200), phenylpropanoid biosynthesis (Ko00940), and flavonoid biosynthesis (Ko00941) (Figure S3). The flavonoid biosynthesis pathway is an important downstream branch of phenylpropanoid biosynthesis. Based on the enriched pathways of DEPs and DEGs and the correlation analysis, the most significantly enriched flavonoid biosynthesis (Ko00941) pathway was examined. A possible flavonoid metabolism pathway during I. polycarpa flower development is shown in Figure 6. Flavonoids are produced from the phenylpropanoid pathway under the action of different enzymes. In I. polycarpa, the direct precursor of flavonoid biosynthesis is cinnamoyl-CoA. The CYP73A enzyme acts on cinnamoyl-CoA to generate p-coumaroyl-CoA. P-coumaroyl-CoA, under the catalysis of chalcone synthase (CHS), is used to form chalcones, and the chalcones, such as naringenin, are isomerized into flavanones by chalcone isomerase (CHI). Naringenin, under the action of flavanone 3-hydroxylase (F3H), flavonol synthase (FLS), anthocyanin synthase (ANS), and other enzymes, is converted into flavonols and other flavonoids. P-coumaroyl shikimate 3′-hydroxylase (C3′H) converts p-coumaroyl-CoA into caffeoyl quinic acid; shikimate/quinate hydroxycinnamoyl transferase (HCT) acts on caffeoyl quinic acid to synthesize caffeoyl-CoA; and caffeoyl-CoA O-methyltransferase (CCoAOMT) catalyzes the substrates of caffeoyl-CoA into feruloyl-CoA. Isoflavone synthase (IFS) is an important enzyme in the isoflavonoid branch of the flavonoid pathway. IFS catalyzes the formation of isoflavanone, and the isoflavanone under the action of 2-hydroxyisoflavanone dehydratase (HIDH), isoflavone 2′-hydroxylase (I2′H), isoflavone 7-O-glucosyltransferase (IF7GT), and isoflavone 7-O-glucoside-6″-O-malonyltransferase (IF7MAT) results in the synthesis of isoflavonoids (Figure 6).
When a given protein was expressed at the transcriptome level, it was considered to be correlated. Specifically, the correlated DEPs and mRNAs of the four comparative analyses were all involved in the flavonoid pathway. Finally, based on the proteome dataset, transcriptome profiles, correlation analysis of the two omics, and the flavonoid biosynthesis pathway (Figure 6), a total of four co-expressed DEPs and transcripts and one gene associated with the flavonoid biosynthesis pathway were screened: p-coumaroyl shikimate 3′-hydroxylase (C3′H), shikimate/quinate hydroxycinnamoyl transferase (HCT), and caffeoyl-CoA O-methyltransferase (CCoAOMT). We identified the candidate unigenes and proteins related to the most enriched flavonoid biosynthesis (Ko00941) pathways. The histograms of genes and correlated DEPs and DEGs related to flavonoid metabolism in I. polycarpa are shown in Figure S11. The abundance changes in correlated DEPs and mRNA in the four comparison groups are shown in Figure S11A,B; and abundance changes in DEGs are shown in Figure S11C. The four candidate co-expressed proteins and transcripts are listed below: HCT-Gene.91931::CL7303.Contig2_All::g.91931::m.91931_Protein, HCT-Gene.91930::CL7303.Contig1_All::g.91930::m.91930_Protein, and HCT-Gene.134502::CL16485.Contig1_All::g.134502::m.134502_Protein, C3′H-Gene.75456::CL5417.Contig5_All::g.75456::m.75456_Protein; the one gene is CCoAOMT-CL8671.Contig2_All.

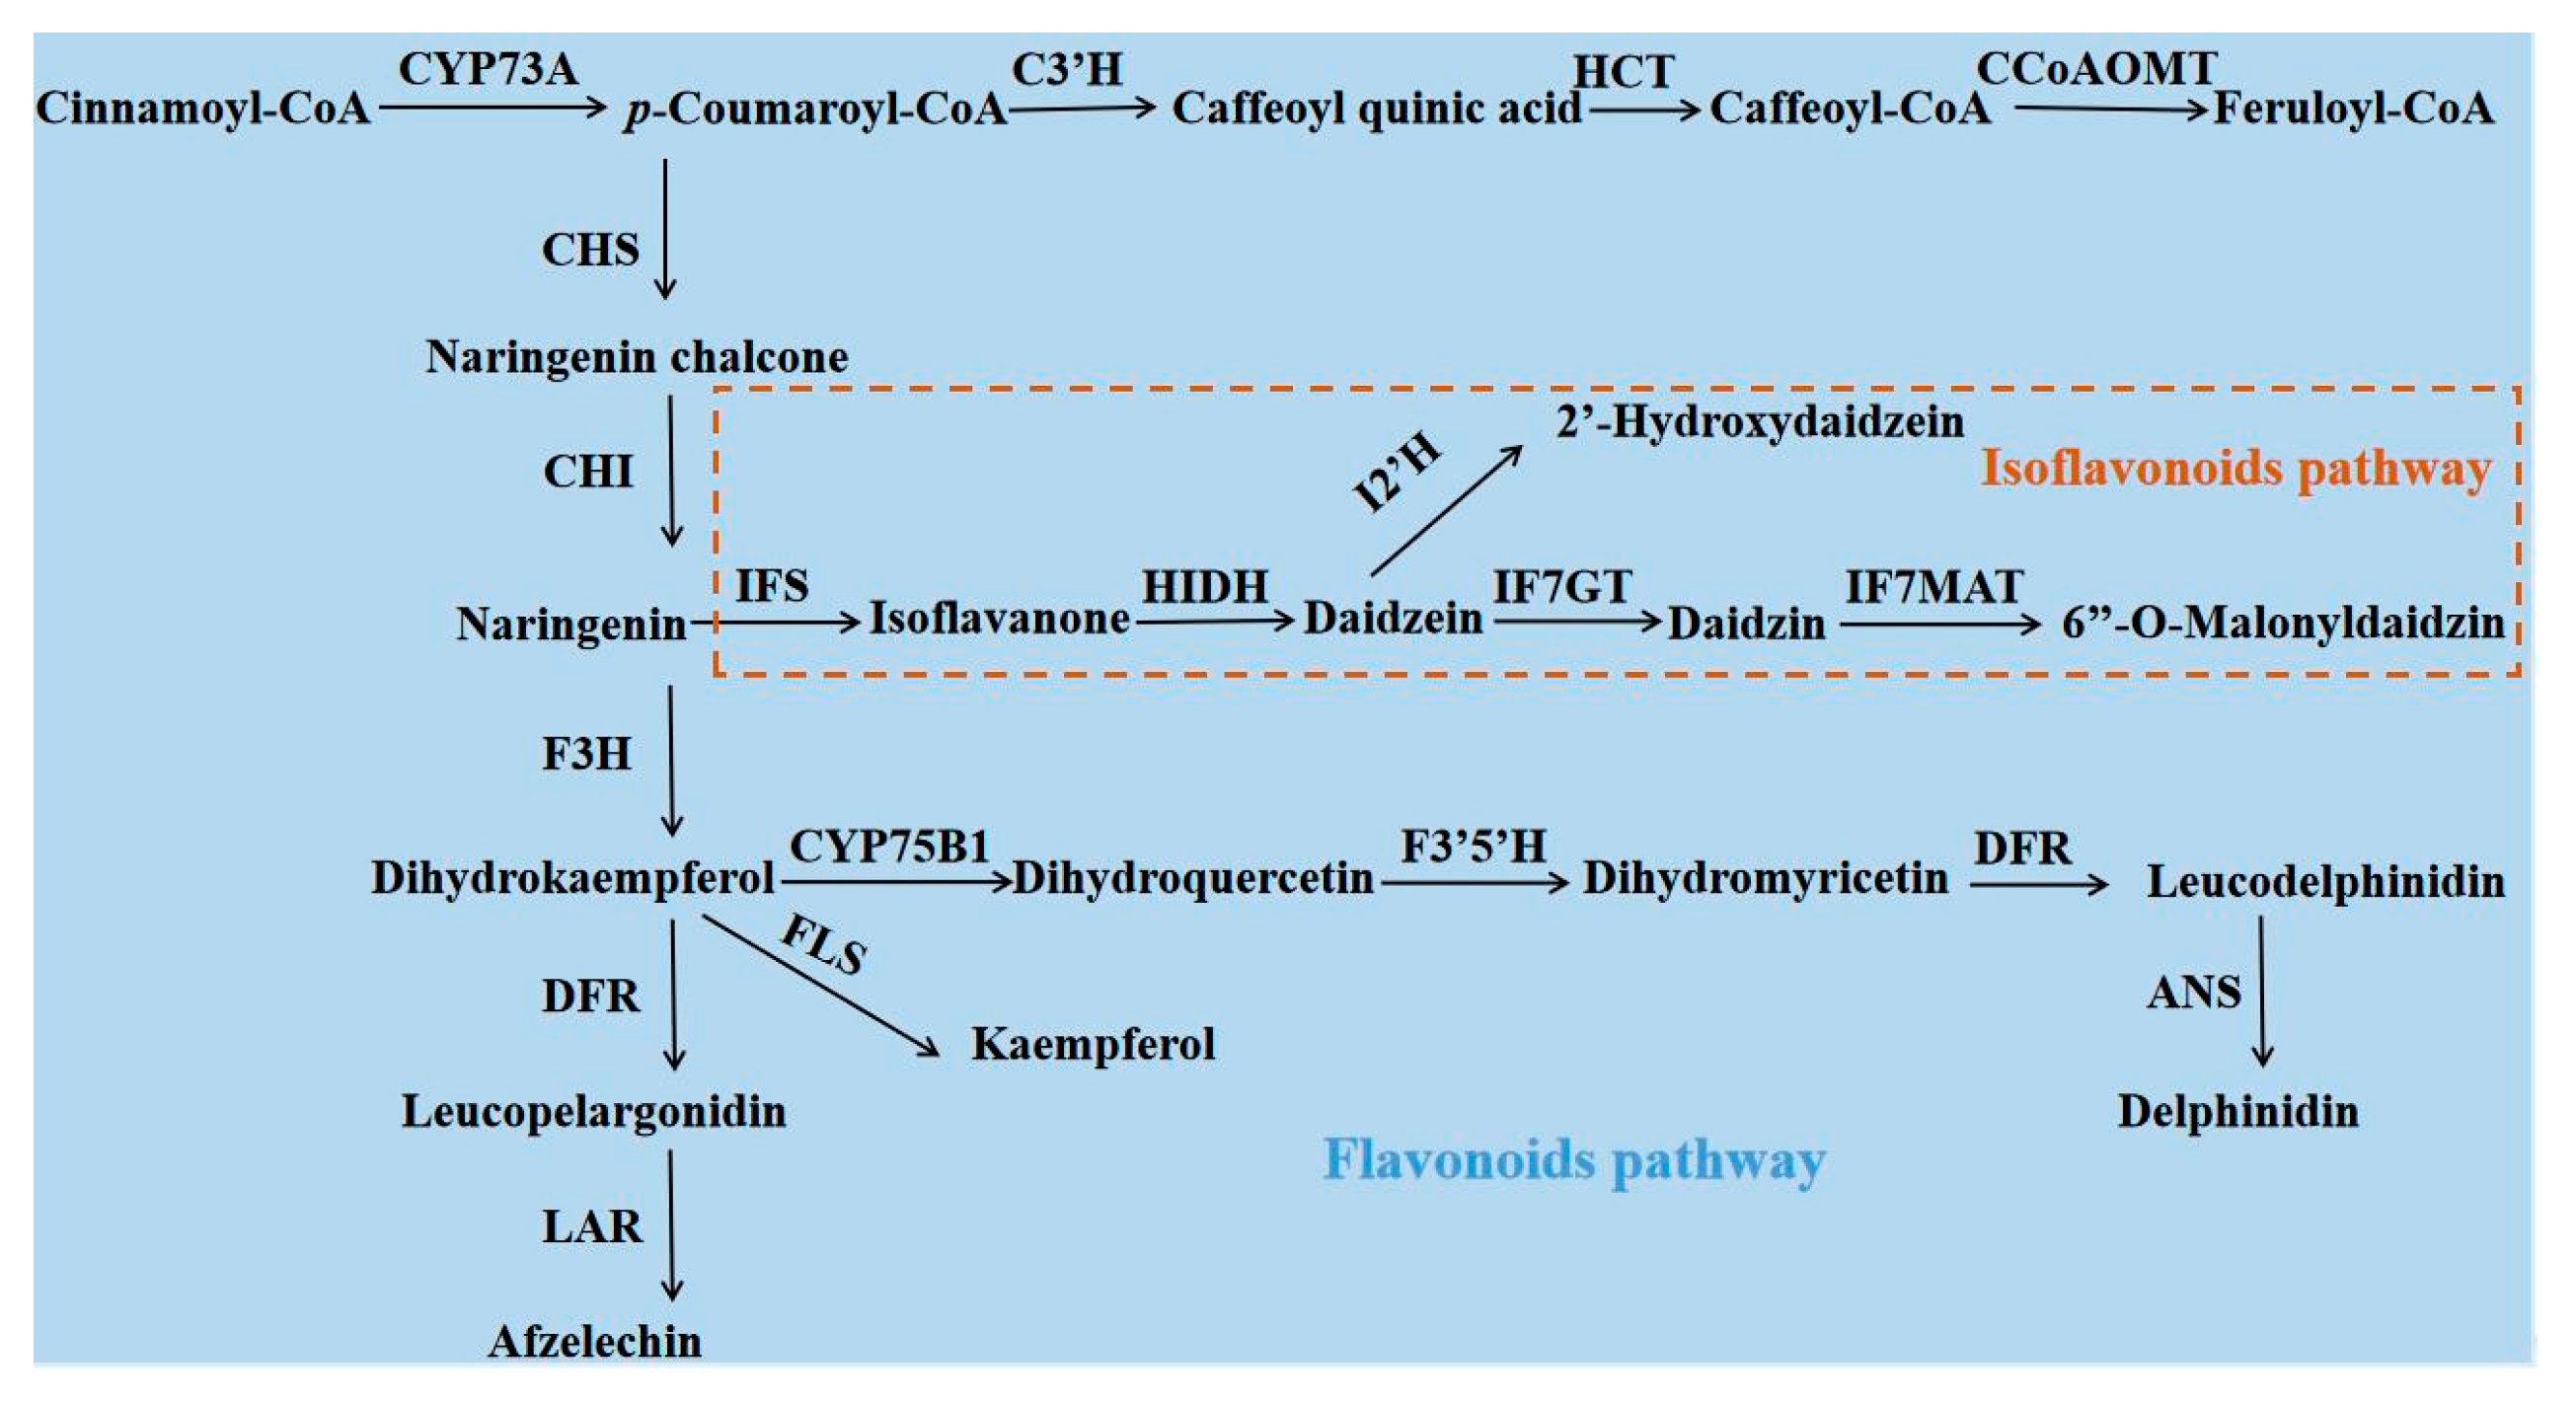
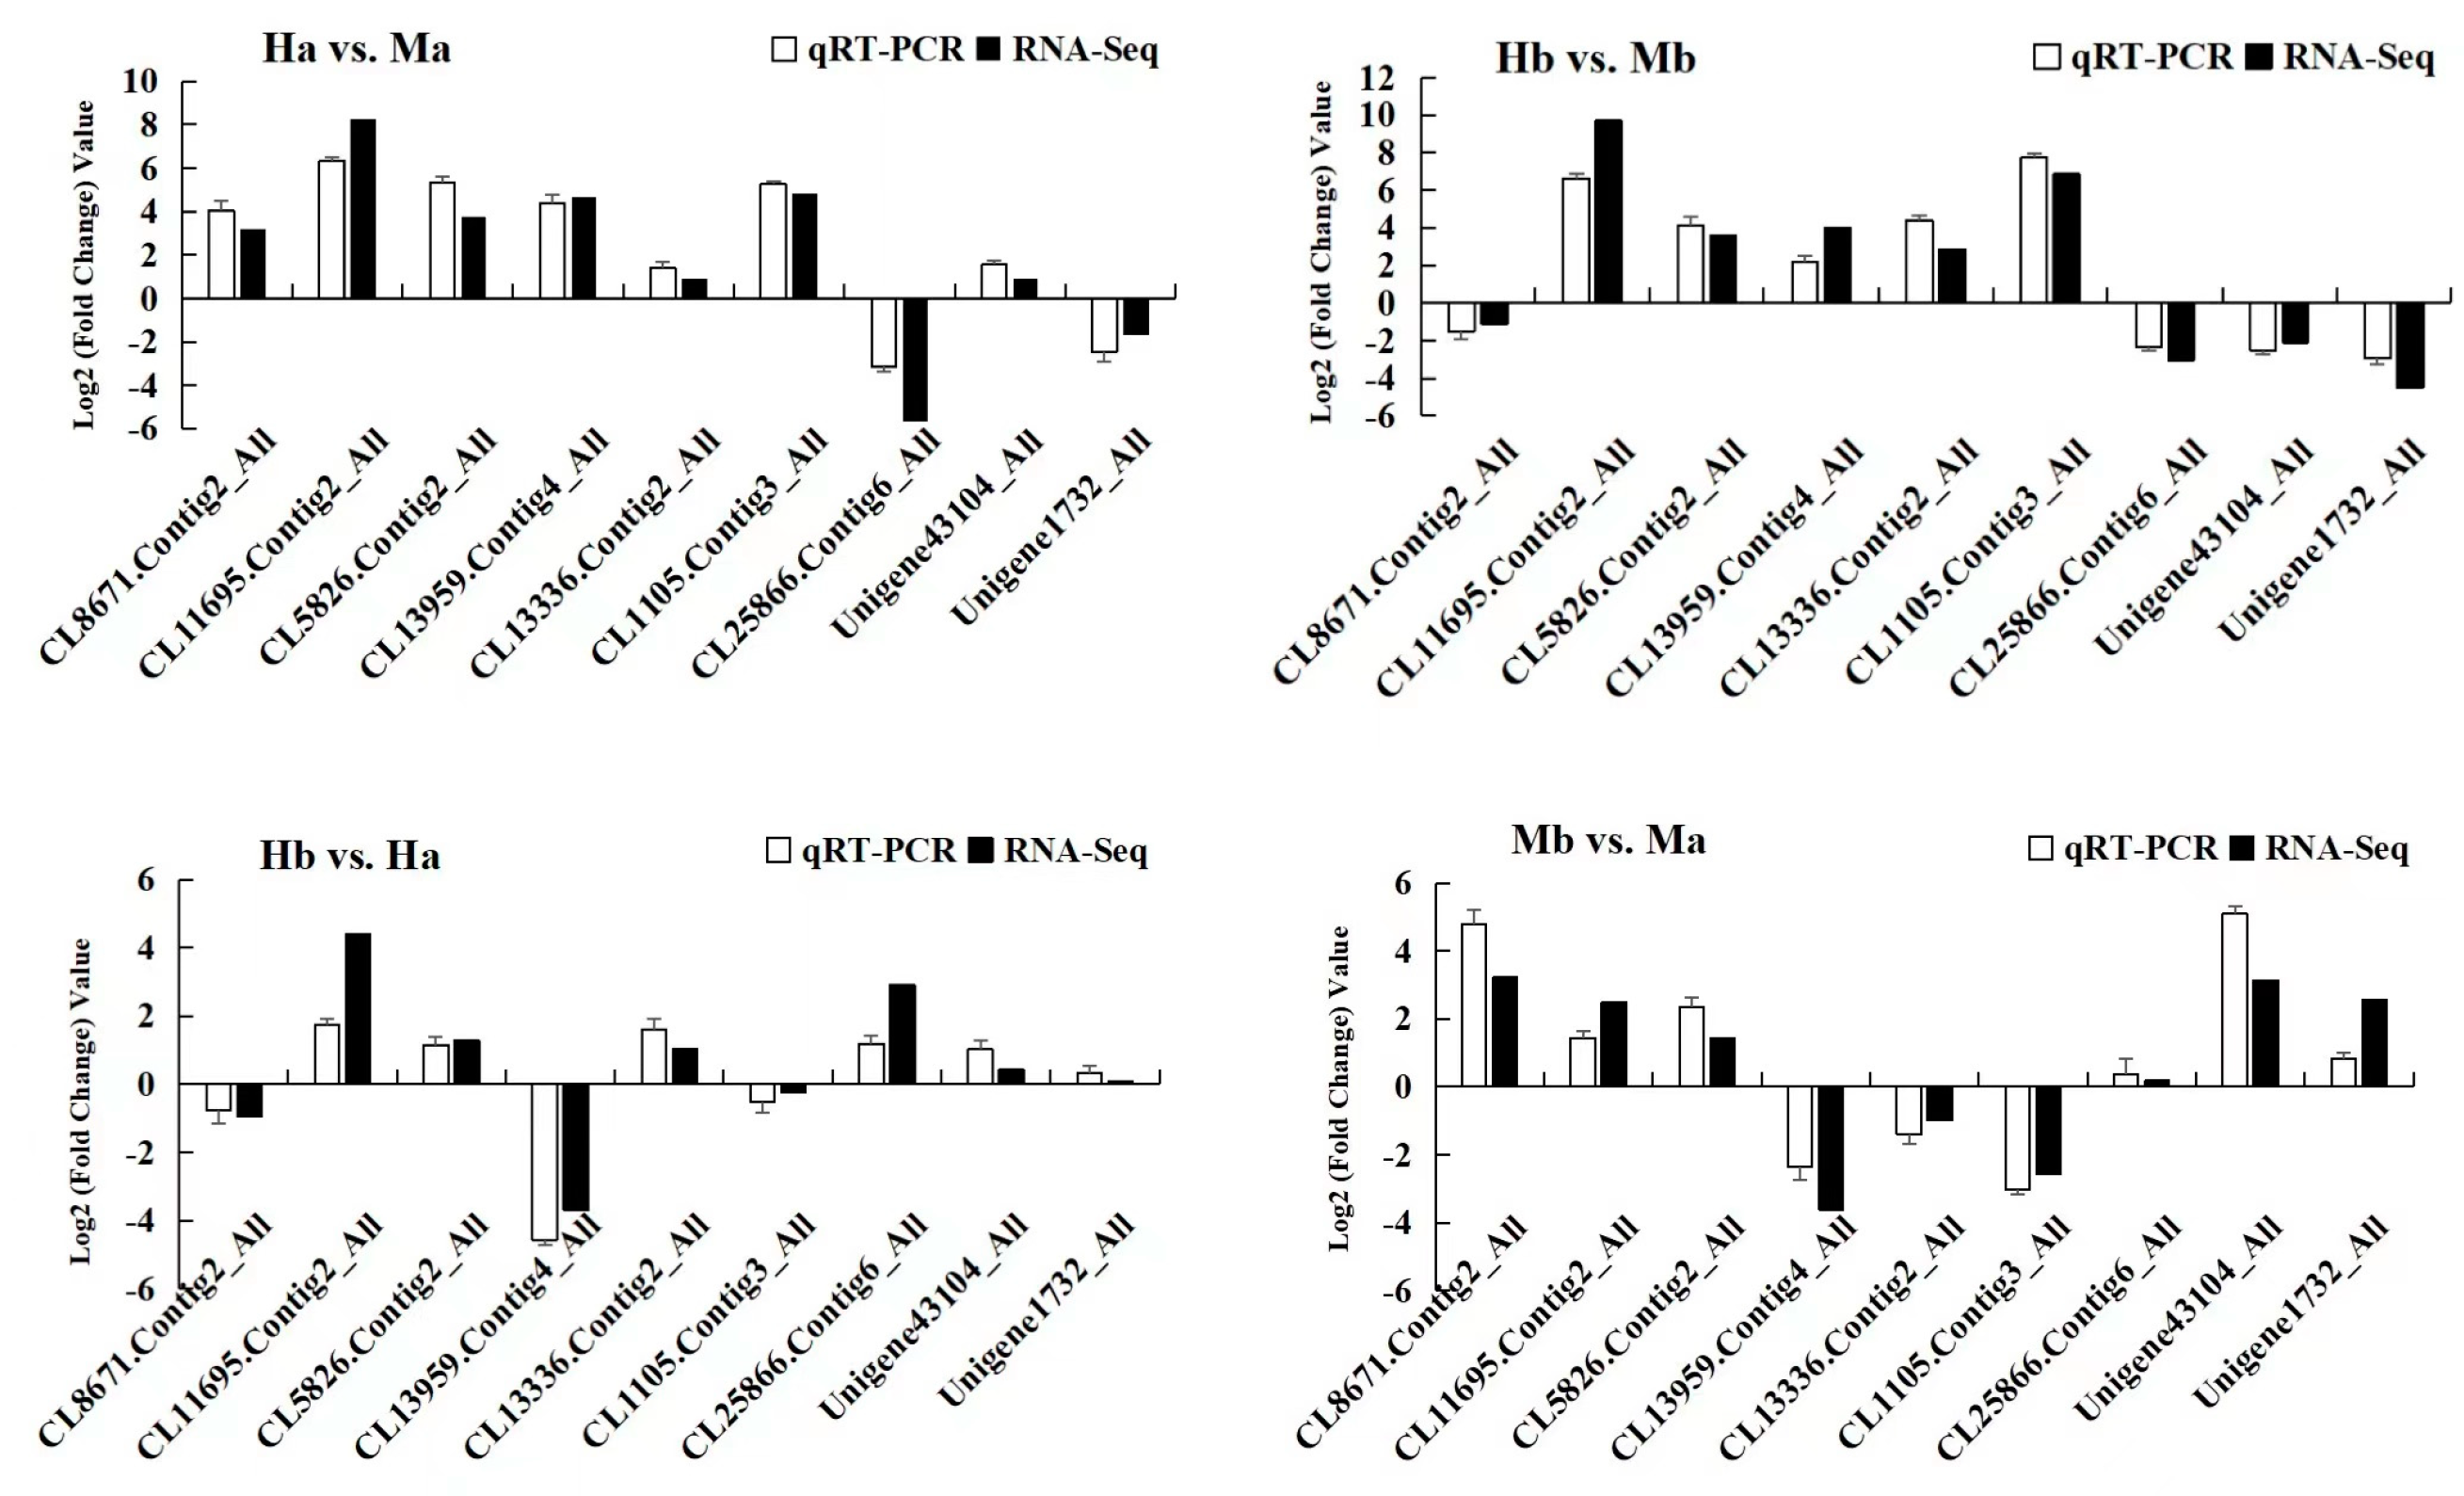
3.8. qRT-PCR Analysis of Flavonoids Biosynthesis-Related Genes

The expression patterns of the nine candidate genes involved in flavonoid biosynthesis were verified using qRT-PCR; these verified genes included CCoAOMT, HCT, ANS, PGT1, CHS, and CHI. (Figure 7). The log2 (fold change) values of the chosen genes showed that the expression patterns of the 9 DEGs based on qRT-PCR were similar to the trends revealed by RNA−seq data in the four comparison groups. Overall, the RNA−seq datasets constructed in this study were reasonable and reliable.

4. Discussion

4.1. Evolutionary Factors Associated with I. polycarpa Sex Conversion

In angiosperms, dioecious species are relatively uncommon. Bisexual variant plants are very rare among dioecious species; their frequency was lower than 0.1% in a field survey of 41 dioecious species [62,63]. Some dioecious trees also have localized sex conversion or total sex conversion; such trees are considered critically dioecious. Our previous study demonstrated that some of the I. polycarpa trees produced bisexual flowers [2]. A similar phenomenon has been observed in other dioecious species [64,65,66]. In a field survey, there was a small branch of one male Ginkgo (Ginkgo biloba) tree that produced viable seeds [67], and one branch of the male Pistacia palaestina (Pistacia palaestina Boiss.) plant bore rare fruits [63]. Diospyros egrettarum is dioecious, but some bisexual plants in Mauritius could produce viable seeds [68]. Papaya (Carica papaya) is a trioecious tree with male (XY), bisexual (XYh), and female (XX) sex types controlled by sex chromosomes. The bisexual papaya arose due to domestication in Mesoamerica, according to the sequence of Yh and Y chromosomes [65,66]. The wild Vitis species are dioecious, but bisexual flowers have been described in the grapevine (Vitis vinifera subspec. vinifera cultivars) [64]. Evolutionarily speaking, it was conscious selection that caused the transition from wild dioecious types of papaya and grapevine to hermaphroditic cultivars.
The majority of angiosperm species have bisexual flowers. One widespread view states that all unisexual flowers have evolved via 900–5000 transitions from bisexual ancestors [69,70,71,72]. The two-factor model (or two-step model) for the evolution of dioecy from bisexual ancestors has received wide support [73,74]. In the first step, a male sterility mutation arises, creating females; in the second step, a female-sterility mutation arises, creating males (dioecy, total female-sterility mutation) or less female-function males (subdioecy, partial female-sterility mutation). Eventually, the sexual system becomes dioecious [8,75,76]. In our field observations, there were some I. polycarpa trees with bisexual flowers, trees that had both male and bisexual flowers on one individual tree, and some whole trees with bisexual flowers. From our previous study of I. polycarpa trees [2] via field observations and the two-step model, a hypothetical model for the emergence of I. polycarpa bisexual flowers can be proposed. We suppose that the I. polycarpa trees evolved from bisexuality to dioecy via the gynodioecy pathway [8,77,78]. The first step created females in bisexual populations, and thus, there were individual female and bisexual plants. Then, in the second step, there was the maintenance of males via a mutation of small effect causing partial female sterility mutation, i.e., not a total female-sterility mutation. Ultimately, most of the trees were male or female, but there still existed bisexual and andromonoecious individual plants; in other words, the I. polycarpa dioecious trees probably evolved through the subdioecy pathway through a partial or total female-sterility mutation. In subdioecy or dioecy, the females are relatively constant in their sex expression, and it is the polleniferous plants (bisexuals and males) that are variable, similar to other subdioecious species [79,80]. It is often observed that in subdioecious species, the males are more variable than the females; this is similar to the situation seen in I. polycarpa populations. From an evolutionary point of view, this phenomenon suggests that perhaps the separation of sexes in I. polycarpa is not yet complete.
The sex conversion of plants is a highly coordinated and complex process of morphogenesis related to the expression of a series of genes; the process is influenced by internal and external elements, including physiological, epigenetic, and environmental factors [81,82]. However, the reason for the emergence of bisexual variants in I. polycarpa is still unclear, and the underlying molecular mechanisms of I. polycarpa sex conversion remain poorly understood. It is unknown whether the formation of bisexual flowers is controlled by internal gene mutations or by external environmental factors. The principles that underlie the transition from male flowers to bisexuals have not been investigated; hence, further investigation and analysis of the sex conversion in Idesia polycarpa Maxim are required. The main purpose of this study was to identify the enriched pathways, potential key genes, and proteins involved in I. polycarpa sex conversion, with the goals of providing a basis for investigation of I. polycarpa sex conversion and further understanding of breeding system evolution in angiosperms. Therefore, understanding the factors that control ovule development in I. polycarpa bisexual flowers is important from both an economic and evolutionary point of view. The results of this study may provide a basis for further investigation of artificial regulation of sex differentiation via promoting the bisexual flowering of I. polycarpa male trees. This would facilitate future breeding programs and also contribute to future work concerning sex conversion in seed plants.

4.2. Integrated Proteome and Transcriptome Analysis of Male and Bisexual Flowers

Integrative analysis using multi-omics is more helpful in deeply exploring the molecular mechanisms of complex gene expression processes in plant species without a published reference genome. Generally, it is not easy to identify key potential proteins or genes involved in the specific biological process in non-model plants, but high-throughput sequencing technology has greatly facilitated transcriptomic and proteomic studies of many plant species without a reference genome [11]. In this study, we investigated the protein and mRNA expression of I. polycarpa male and bisexual flowers at key stages. There are many proteins and genes with unknown functions that may reveal the potentially complex regulatory mechanisms involved in I. polycarpa sex conversion. The present study aimed to summarize the enriched pathways, potential key genes, and proteins involved in I. polycarpa sex conversion. The correlations between protein and mRNA were in the range of 0.152–0.262, indicating a weakly positive correlation between proteomic and transcriptomic datasets. Most studies have reported that the correlation between protein and mRNA abundance is not very high [83,84] because of the correlations between mRNA and protein depend on biological factors and can be influenced by technical biases [85]. Nevertheless, the proteomic and transcriptomic datasets constructed in this study were reasonable and reliable.
Flavonoids have various functions, playing multiple roles in plant growth, development, and defense processes. Flavonoids also play indispensable roles in plant sexual reproduction [14,86]. This study presents a comprehensive analysis of proteome and transcriptome data from I. polycarpa bisexual and male flowers. The flavonoid pathway was significantly enriched in the correlated DEPs and mRNA levels in the KEGG analysis, and thus the results suggest that the flavonoid pathway potentially has important biological functions in the sex conversion of I. polycarpa. It has been reported that flavonoids are essential for flower development and fertility in some plant species [30,31,33]. Currently, nothing is known about the role of flavonoids in the ovule fertility of I. polycarpa. Figure 6 presents a possible flavonoid metabolism pathway during I. polycarpa flower development, where the co-expressed DEPs and transcripts are enriched in the “C3′H-HCT-CCoAOMT” branch of the flavonoid pathway, in which p-coumaroyl shikimate 3′-hydroxylase (C3′H) converts p-coumaroyl-CoA into caffeoyl quinic acid; shikimate/quinate hydroxycinnamoyl transferase (HCT) acts on caffeoyl quinic acid to synthesize caffeoyl-CoA; and caffeoyl-CoA O-methyltransferase (CCoAOMT) catalyzes the substrates of caffeoyl-CoA into the synthesis of feruloyl-CoA. O-methyltransferase (OMT) enzymes can be divided into two categories: Caffeic acid O-methyltransferase (COMT) and caffeoyl Co-enzyme A O-methyltransferase (CCoAOMT). It has been reported that the CCoAOMT (AtCCoAOMT7) identified in Arabidopsis thaliana controls flavonoid methylation activity [87]. In other plant species, the OMT enzymes from Citrus reticulata (CrOMT1) [88], Vitis vinifera (VvAOMT) [89], Solanum lycopersicum (SlAnthOMT) [90], and Paeonia suffruticosa cv. “Gunpohden” (PsAOMT) [91] were consistent with the AtCCoAOMT7 methylation function in Arabidopsis thaliana, indicating that OMT-like enzymes have a conserved function in flavonoid methylation. The CCoAOMT of I. polycarpa bisexual flowers was significantly downregulated in the Ha vs. Hb comparison group (Figure S11), indicating that the CCoAOMT expression level in bisexual flowers was higher in the late differentiation stage (Hb) than in the early stage (Ha); in contrast, the CCoAOMT was significantly upregulated in the Ma vs. Mb comparison group (Figure S11). The expression level of the CCoAOMT after the ovule abortion in male flowers (Mb) was lower than that in the stage before the ovule abortion in male flowers (Ma). The expression of the CCoAOMT in male flowers was different from that in bisexual flowers. The CCoAOMT was significantly downregulated in the Mb vs. Hb comparison group (Figure S11); bisexual flowers at the Hb stage had functional ovules and stamens (Figure 2B), while male flowers at the Mb stage had aborted ovules and functional stamens (Figure 2D). The CCoAOMT expression level in bisexual flowers at the Hb stage was higher than in male flowers at the Mb stage. It has been speculated that the CCoAOMT enzyme may have a positive regulatory effect on ovule development during the sexual differentiation of bisexual flowers. In summary, the CCoAOMT may also have a flavonoid methylation function in I. polycarpa. The formation of bisexual flowers in andromonoecious and bisexual plants may be affected by the methylation of the CCoAOMT. However, the contribution of flavonoid methylation to I. polycarpa sex conversion is still unclear, and thus, further research on the CCoAOMT in I. polycarpa is necessary. We conclude that CCoAOMT is responsible for the flavonoid methylation in I. polycarpa and that this plays an important role in the ovule development of I. polycarpa.
The HcHCT gene is highly expressed in Hibiscus cannabinus flowers [92,93]. The expression level of GhHCT in Gossypium hirsutum ovules is high, and the expression level of GbHCT13 in flower ovules of Gossypium barbadense is also highly expressed, suggesting that GhHCT and GbHCT13 may be involved in ovule development [94]. The expression levels of the three homologous HCT enzymes were consistent among the four I. polycarpa comparison groups; all three of the correlated HCT proteins had similar expression levels (Figure S11). The HCT was downregulated in the HB vs. HA comparison group of I. polycarpa bisexual flowers. In contrast, the HCT was upregulated in the MB vs. MA comparison group of male flowers, and the expression levels of HCT between male and bisexual flowers showed the opposite pattern. Accordingly, the same expression trend with HCT was found for C3′H (Figure S11), a protein included in the “C3′H-HCT-CCoAOMT” branch of the flavonoid pathway. The annotated C3′H and HCT may have important roles in I. polycarpa ovule development. The present study comprises mRNA and protein information for I. polycarpa male and bisexual flowers at the molecular level, thereby providing a foundation for further investigation of gene function linked with flavonoid pathways. The enrichment of the flavonoid pathway and potential key proteins and genes have been described in this study; nevertheless, the molecular mechanism underlying sex conversion is complex and remains to be fully understood. The results provide novel insights into the role of the flavonoid pathway in I. polycarpa sex conversion, thus offering new ideas concerning the roles of flavonoids in ovule development. This study will further provide new possibilities for utilizing the bisexual I. polycarpa germplasm resources.

5. Conclusions

In summary, the integrative analysis of the proteome and transcriptome profiles of I. polycarpa male and bisexual flowers at key developmental stages revealed that the most significantly enriched pathways were flavonoid pathways. Finally, four co-expressed proteins and transcripts and one gene associated with the flavonoid biosynthesis pathway were screened out. The proteins identified were p-coumaroyl shikimate 3′-hydroxylase, and shikimate/quinate hydroxycinnamoyl transferase, and the gene was caffeoyl-CoA O-methyltransferase. The analysis has revealed key potential proteins and genes involved in sex conversion at the molecular level and has provided a basis for future investigations of artificial regulation of sex differentiation in I. polycarpa.

Supplementary Materials

The following supporting information can be downloaded at: https://www.mdpi.com/article/10.3390/f14091737/s1, Table S1. Primers used in the qRT-PCR analysis. Table S2. De novo output statistics for 12 samples. Table S3. Parameters for correlation analysis. Table S4. Numbers of correlated genes and proteins at quantification and differential expression levels. Table S5. Top 10 annotated KEGG pathways of correlated DEPs and DEGs. Figure S1. Identification and analysis of the proteome in male and bisexual flowers. Figure S2. GO enrichment of DEPs. Figure S3. The top 20 significantly enriched KEGG pathways of DEPs. Figure S4. PCA plot of identified transcripts of 12 samples. Figure S5. The statistics of I. polycarpa unigenes generated using RNA-seq data. Figure S6. The enriched GO terms and KEGG pathways of unigenes. Figure S7. The KEGG pathway enrichment analysis of DEGs. Figure S8. The Spearman correlation diagrams of all quantitative genes and proteins. Figure S9. The correlation diagram for DEGs and DEPs. Figure S10. Correlation diagram of proteins and genes with the same expression change trend. Figure S11. Histograms of DEGs and correlated DEPs and mRNA related to flavonoid pathway in I. polycarpa male and bisexual flowers.

Author Contributions

Software, X.G., S.L., S.Y. and H.L.; Resources, L.F.; Writing—review & editing, H.W., Z.L. (Zhi Li) and Y.W.; Supervision, Q.C. and Z.L. (Zhen Liu). All authors have read and agreed to the published version of the manuscript.

Funding

This work is supported by the investigation and collection of new germplasm bank of edible oil tree species (The grant number: 2019FY100802).

Data Availability Statement

The mRNA clean dataset of this article has been uploaded to the database of NCBI Sequence Read Archive (SRA, https://www.ncbi.nlm.nih.gov/sra/, accessed on 23 March 2023) with the accession number PRJNA941009. We deposited our ITRAQ-based mass spectrometry proteomics dataset to the ProteomeXchange (http://www.proteomexchange.org/, accessed on 14 March 2023) database, all proteomics data can be accessed with the dataset identifier PXD040854.

Acknowledgments

Resources, Lisha Fang; software, Xiaodong Geng, Shunfu Li, Shunyang Yao and Huiyun Li; supervision, Qifei Cai and Zhen Liu; writing–review and editing, Huimin Wang, Zhi Li and Yanmei Wang. All authors contributed and approved the manuscript. We acknowledge funding from the investigation and collection of new germplasm bank of edible oil tree species (The grant number: 2019FY100802).

Conflicts of Interest

The authors declare that they have no competing interest.

References

  1. Rana, S.; Liu, Z. Study on the pattern of vegetative growth in young dioecious trees of Idesia polycarpa maxim. Trees 2021, 35, 69–80. [Google Scholar] [CrossRef]
  2. Wang, H.; Rana, S.; Li, Z.; Geng, X.; Wang, Y.; Cai, Q.; Li, S.; Sun, J.; Liu, Z. Morphological and anatomical changes during floral bud development of the trioecious Idesia polycarpa Maxim. Rev. Bras. Bot. 2022, 45, 679–688. [Google Scholar] [CrossRef]
  3. Yang, F.; Su, Y.; Li, X.; Zhang, Q.; Sun, R. Preparation of biodiesel from Idesia polycarpa var. vestita fruit oil. Ind. Crop. Prod. 2009, 29, 622–628. [Google Scholar] [CrossRef]
  4. Dai, L. Study on Geographic Variation of Fruit and Seed of Idesia polycarpa Maxim. Ph.D. Thesis, Henan Agricultural University, Hanan, Zhengzhou, 2014. (In Chinese) [Google Scholar] [CrossRef]
  5. Xiang, X.; Wen, L.; Wang, Z.; Yang, G.; Mao, J.; An, X.; Kan, J. A comprehensive study on physicochemical properties, bioactive compounds, and emulsified lipid digestion characteristics of Idesia polycarpa var. Vestita Diels fruits oil. Food Chem. 2023, 404, 134634. [Google Scholar] [CrossRef]
  6. Jung, M.; Yoo, J.; Kang, Y.; Lee, H.; Kim, S.; Sung, S.; Lee, Y.; Choi, I.; Kim, T. Idesolide, an isolate of Idesia polycarpa, inhibits apoptosis through induction of intracellular heat shock protein 70 in C2C12 muscle cells. Biol. Pharm. Bull. 2010, 33, 1063–1066. [Google Scholar] [CrossRef]
  7. Lee, M.; Lee, H.; Lee, J.; Ye, S.; Kim, S.; Sung, S. Anti-adipogenic activity of compounds isolated from Idesia polycarpa on 3T3-L1 cells. Bioorganic Med. Chem. Lett. 2013, 23, 3170–3174. [Google Scholar] [CrossRef] [PubMed]
  8. Charlesworth, B.; Charlesworth, D. A model for the evolution of dioecy and gynodioecy. Am. Nat. 1978, 112, 975–997. [Google Scholar] [CrossRef]
  9. Baránková, S.; Pascual-Díaz, J.P.; Sultana, N.; Alonso-Lifante, M.P.; Balant, M.; Barros, K.; D’Ambrosio, U.; Malinská, H.; Peska, V.; Pérez Lorenzo, I.; et al. Sex-chrom, a database on plant sex chromosomes. New Phytol. 2020, 227, 1594–1604. [Google Scholar] [CrossRef] [PubMed]
  10. Ritchie, M.; Holzinger, E.; Li, R.; Pendergrass, S.; Kim, D. Methods of integrating data to uncover genotype-phenotype interactions. Nat. Rev. Genet. 2015, 16, 85–97. [Google Scholar] [CrossRef] [PubMed]
  11. Kumari, S.; Deng, W.; Gunasekara, C.; Chiang, V.; Chen, H.; Ma, H.; Davis, X.; Wei, H. Bottom-up GGM algorithm for constructing multilayered hierarchical gene regulatory networks that govern biological pathways or processes. BMC Bioinf. 2016, 17, 132. [Google Scholar] [CrossRef]
  12. Iwasaki, M.; Tabata, T.; Kawahara, Y.; Ishihama, Y.; Nakagawa, M. Removal of interference MS/MS spectra for accurate quantification in isobaric tag-based proteomics. J. Proteome Res. 2019, 18, 2535–2544. [Google Scholar] [CrossRef] [PubMed]
  13. Vogel, C.; Marcotte, E.M. Insights into the regulation of protein abundance from proteomic and transcriptomic analyses. Nat. Rev. Genet. 2012, 13, 227–232. [Google Scholar] [CrossRef]
  14. Zhang, C.; Yu, D.; Ke, F.; Zhu, M.; Xu, J.; Zhang, M. Seedless mutant ‘Wuzi Ougan’ (Citrus suavissima Hort. ex Tanaka ‘seedless’) and the wild type were compared by iTRAQ-based quantitative proteomics and integratedly analyzed with transcriptome to improve understanding of male sterility. BMC Genet. 2018, 19, 106. [Google Scholar] [CrossRef]
  15. Dai, F.; Wang, Z.; Li, Z.; Luo, G.; Wang, Y.; Tang, C. Transcriptomic and proteomic analyses of mulberry (Morus atropurpurea) fruit response to Ciboria carunculoides. J. Proteom. 2018, 193, 142–153. [Google Scholar] [CrossRef]
  16. Wu, L.; Fang, Z.; Lin, J.; Sun, Y.; Du, Z.; Guo, Y.; Liu, J.; Liang, Y.; Ye, J. Complementary iTRAQ proteomic and transcriptomic analyses of leaves in tea plant (Camellia sinensis L.) with different maturity and regulatory network of flavonoid biosynthesis. J. Proteome Res. 2018, 18, 252–264. [Google Scholar] [CrossRef] [PubMed]
  17. Zhang, J.; Wang, S.; Song, S.; Xu, F.; Pan, Y.; Wang, H. Transcriptomic and proteomic analyses reveal new insight into chlorophyll synthesis and chloroplast structure of maize leaves under zinc deficiency stress. J. Proteom. 2019, 199, 123–134. [Google Scholar] [CrossRef]
  18. Li, Z.; Liu, N.; Zhang, W.; Wu, C.; Jiang, Y.; Ma, J.; Li, M.; Sui, S. Integrated transcriptome and proteome analysis provides insight into chilling-induced dormancy breaking in Chimonanthus praecox. Hortic. Res. 2020, 7, 198. [Google Scholar] [CrossRef] [PubMed]
  19. Ye, Z.; Yu, J.; Yan, W.; Zhang, J.; Yang, D.; Yao, G.; Liu, Z.; Wu, Y.; Hou, X. Integrative iTRAQ-based proteomic and transcriptomic analysis reveals the accumulation patterns of key metabolites associated with oil quality during seed ripening of Camellia oleifera. Hortic. Res. 2021, 8, 157. [Google Scholar] [CrossRef]
  20. Chen, T.; Sheng, Y.; Hao, Z.; Long, X.; Fu, F.; Liu, Y.; Tang, Z.; Ali, A.; Peng, Y.; Liu, Y.; et al. Transcriptome and proteome analysis suggest enhanced photosynthesis in tetraploid Liriodendron sino-americanum. Tree Physiol. 2021, 41, 1953–1971. [Google Scholar] [CrossRef]
  21. Dong, N.; Lin, H. Contribution of phenylpropanoid metabolism to plant development and plant-environment interactions. J. Integr. Plant Biol. 2020, 63, 180–209. [Google Scholar] [CrossRef]
  22. Brenda, W.S. Biosynthesis of flavonoids and effects of stress. Curr. Opin. Plant Biol. 2002, 5, 218–223. [Google Scholar] [CrossRef]
  23. Tohge, T.; Watanabe, M.; Hoefgen, R.; Fernie, A. The evolution of phenylpropanoid metabolism in the green lineage. Crit. Rev. Biochem. Mol. Biol. 2013, 48, 123–152. [Google Scholar] [CrossRef] [PubMed]
  24. Panche, A.; Diwan, A.; Chandra, S. Flavonoids: An overview. J. Nutr. Sci. 2016, 5, 1–15. [Google Scholar] [CrossRef]
  25. Shimada, N.; Akashi, T.; Aoki, T.; Ayabe, S. Induction of isoflavonoid pathway in the model legume Lotus japonicus: Molecular characterization of enzymes involved in phytoalexin biosynthesis. Plant Sci. 2000, 160, 37–47. [Google Scholar] [CrossRef]
  26. Payyavula, R.S.; Singh, R.K.; Navarre, D.A. Transcription factors, sucrose, and sucrose metabolic genes interact to regulate potato phenylpropanoid metabolism. J. Exp. Bot. 2013, 64, 5115–5131. [Google Scholar] [CrossRef]
  27. Ban, Z.; Qin, H.; Mitchell, A.J.; Liu, B.; Zhang, F.; Weng, J.K.; Dixon, R.A.; Wang, G. Noncatalytic Chalcone Isomerase-fold Proteins in Humulus lupulus are Auxiliary Components in Prenylated Flavonoid Biosynthesis. Proc. Natl. Acad. Sci. USA 2018, 115, E5223–E5232. [Google Scholar] [CrossRef]
  28. Zhang, S.; Yang, J.; Li, H.; Chiang, V.L.; Fu, Y. Cooperative Regulation of Flavonoid and Lignin Biosynthesis in Plants. Crit. Rev. Plant Sci. 2021, 40, 109–126. [Google Scholar] [CrossRef]
  29. Van der Meer, I.; Stam, M.; van Tunen, A.; Mol, J.; Stuitje, A. Antisense inhibition of flavonoid biosynthesis in petunia anthers results in male sterility. Plant Cell. 1992, 4, 253–262. [Google Scholar] [CrossRef]
  30. Napoli, C.; Deirdre, F.; Wang, H.; Taylor, L. White anther: A petunia mutant that abolishes pollen flavonol accumulation, induces male sterility, and is complemented by a chalcone synthase transgene1. Plant Physiol. 1999, 120, 615–622. [Google Scholar] [CrossRef]
  31. Mahajan, M.; Ahuja, P.; Yadav, S. Post-transcriptional silencing of flavonol synthase mRNA in tobacco leads to fruits with arrested seed set. PLoS ONE 2011, 6, e28315. [Google Scholar] [CrossRef]
  32. Shan, X.; Li, Y.; Yang, S.; Yang, Z.; Qiu, M.; Gao, R.; Han, T.; Meng, X.; Xu, Z.; Wang, L.; et al. The spatio-temporal biosynthesis of floral flavonols is controlled by differential phylogenetic MYB regulators in Freesia hybrida. New Phytol. 2020, 228, 1864–1879. [Google Scholar] [CrossRef] [PubMed]
  33. Xue, J.; Zhang, B.; Zhan, H.; Lv, Y.; Jia, X.; Wang, T.; Yang, N.; Lou, Y.; Zhang, Z.; Hu, W.; et al. Phenylpropanoid Derivatives Are Essential Components of Sporopollenin in Vascular Plants. Mol. Plant 2020, 13, 1–10. [Google Scholar] [CrossRef]
  34. Diggle, P.K.; Di Stilio, V.S.; Gschwend, A.R.; Golenberg, E.M.; Moore, R.C.; Russell, J.R.W.; Sinclair, J. Multiple developmental processes underlie sex differentitation in angiosperms. Trends Genet. 2011, 27, 368–376. [Google Scholar] [CrossRef]
  35. Aggarwal, S.; Yadav, A.K. Dissecting the iTRAQ Data Analysis. Methods Mol. Biol. 2016, 1362, 277–291. [Google Scholar] [CrossRef]
  36. Unwin, R.D.; Griffiths, J.R.; Whetton, A.D. Simultaneous analysis of relative protein expression levels across multiple samples using ITRAQ isobaric tags with 2D nano LC-MS/MS. Nat. Protoc. 2010, 5, 1574–1582. [Google Scholar] [CrossRef] [PubMed]
  37. Brosch, M.; Yu, L.; Hubbard, T.; Choudhary, J. Accurate and Sensitive Peptide Identification with Mascot Percolator. J. Proteome Res. 2009, 8, 3176–3181. [Google Scholar] [CrossRef]
  38. Benjamini, Y.; Hochberg, Y. Controlling the False Discovery Rate: A Practical and Powerful Approach to Multiple Testing. J. R. Statist. Soc. B. 1995, 57, 289–300. [Google Scholar] [CrossRef]
  39. Storey, J.D.; Tibshirani, R. Statistical significance for genomewide studies. Proc. Natl. Acad. Sci. USA 2003, 100, 9440–9445. [Google Scholar] [CrossRef]
  40. Pertea, G.; Huang, X.; Liang, F.; Antonescu, V.; Sultana, R.; Karamycheva, S.; Lee, Y.; White, J.; Cheung, F.; Parvizi, B.; et al. TIGR Gene Indices clustering tools (TGICL): A software system for fast clustering of large EST datasets. Bioinformatics 2003, 19, 651–652. [Google Scholar] [CrossRef]
  41. Savitski, M.; Wilhelm, M.; Hahne, H.; Kuster, B.; Bantscheff, M. A Scalable Approach for Protein False Discovery Rate Estimation in Large Proteomic Data Sets. Mol. Cell. Proteom. 2015, 14, 2394–2404. [Google Scholar] [CrossRef]
  42. Wen, B.; Zhou, R.; Feng, Q.; Wang, Q.; Wang, J.; Liu, S. IQuant: An automated pipeline for quantitative proteomics based upon isobaric tags. Proteomics 2014, 14, 2280–2285. [Google Scholar] [CrossRef] [PubMed]
  43. Huang, J.; Liang, X.; Xuan, Y.; Geng, C.; Li, Y.; Lu, H.; Qu, S.; Mei, X.; Chen, H.; Yu, T.; et al. A reference human genome dataset of the BGISEQ-500 sequencer. Gigascience 2017, 6, 1–9. [Google Scholar] [CrossRef] [PubMed]
  44. Li, Q.; Zhao, X.; Zhang, W.; Wang, L.; Wang, J.; Xu, D.; Mei, Z.; Liu, Q.; Du, S.; Li, Z.; et al. Reliable multiplex sequencing with rare index mis-assignment on DNB-based NGS platform. BMC Genom. 2019, 20, 215. [Google Scholar] [CrossRef] [PubMed]
  45. Li, R.; Li, Y.; Kristiansen, K.; Wang, J. SOAP: Short oligonucleotide alignment program. Bioinformatics 2008, 24, 713–714. [Google Scholar] [CrossRef]
  46. Zhang, F.; Gao, Q.; Khan, G.; Luo, K.; Chen, S. Comparative transcriptome analysis of aboveground and underground tissues of Rhodiola algida, an important ethno-medicinal herb endemic to the Qinghai-Tibetan Plateau. Gene 2014, 553, 90–97. [Google Scholar] [CrossRef]
  47. Grabherr, M.G.; Haas, B.J.; Yassour, M.; Levin, J.Z.; Thompson, D.A.; Amit, I.; Adiconis, X.; Fan, L.; Raychowdhury, R.; Zeng, Q.; et al. Full-length transcriptome assembly from RNA-Seq data without a reference genome. Nat. Biotechnol. 2011, 29, 644–652. [Google Scholar] [CrossRef]
  48. Langmead, B.; Salzberg, S.L. Fast gapped-read alignment with Bowtie 2. Nat. Methods 2012, 9, 357–359. [Google Scholar] [CrossRef]
  49. Li, B.; Dewey, C.N. RSEM: Accurate transcript quantification from RNA-Seq data with or without a reference genome. BMC Bioinf. 2011, 12, 323. [Google Scholar] [CrossRef]
  50. Love, M.I.; Huber, W.; Anders, S. Moderated estimation of fold change and dispersion for RNA-seq data with DESeq2. Genome Biol. 2014, 15, 550. [Google Scholar] [CrossRef]
  51. Deutsch, E.W.; Bandeira, N.; Perez-Riverol, Y.; Sharma, V.; Carver, J.J.; Mendoza, L.; Kundu, D.; Wang, S.; Bandla, C.; Kamatchinathan, S.; et al. The ProteomeXchange Consortium at 10 years: 2023 update. Nucleic Acids Res. 2023, 51, D1539–D1548. [Google Scholar] [CrossRef]
  52. Miller, W.; Myers, E.W.; Lipman, D.J. Blast (basic local alignment search tool). In Encyclopedia of Genetics, Genomics, Proteomics and Informatics; Springer: Dordrecht, The Netherlands, 2008. [Google Scholar] [CrossRef]
  53. Harris, M.A.; Clark, J.; Ireland, A.; Lomax, J.; Ashburner, M.; Foulger, R.; Eilbeck, K.; Lewis, S.; Marshall, B.; Mungall, C.; et al. The Gene Ontology (GO) database and informatics resource. Nucleic Acids Res. 2004, 32, 258–261. [Google Scholar] [CrossRef]
  54. Kanehisa, M.; Araki, M.; Goto, S.; Hattori, M.; Hirakawa, M.; Itoh, M.; Katayama, T.; Kawashima, S.; Okuda, S.; Tokimatsu, T.; et al. KEGG for linking genomes to life and the environment. Nucleic Acids Res. 2008, 36, 480–484. [Google Scholar] [CrossRef] [PubMed]
  55. Li, W.V.; Li, J.J. Modeling and analysis of RNA-seq data: A review from a statistical perspective. Quant. Biol. 2018, 6, 195–209. [Google Scholar] [CrossRef] [PubMed]
  56. Young, M.D.; Wakefield, M.J.; Smyth, G.K.; Oshlack, A. Gene ontology analysis for RNA-seq: Accounting for selection bias. Genome Biol. 2010, 11, R14. [Google Scholar] [CrossRef]
  57. Conesa, A.; Götz, S.; García-Gómez, J.M.; Terol, J.; Talon, M.; Robles, M. Blast2GO: A universal tool for annotation, visualization and analysis in functional genomics research. Bioinformatics 2005, 21, 3674–3676. [Google Scholar] [CrossRef]
  58. Spearman, C.E. “General Intelligence,” Objectively Determined and Measured. Am. J. Psychol. 1904, 15, 201–293. [Google Scholar] [CrossRef]
  59. Hauke, J.; Kossowski, T. Comparison of values of Pearson’s and Spearman’s correlation coefficients on the same sets of data. Quaest. Geogr. 2011, 30, 87–93. [Google Scholar] [CrossRef]
  60. Fan, R.; Cai, G.; Zhou, X.; Qiao, Y.; Wang, J.; Zhong, H.; Bo, J.; Miao, F.; Tu, W.; Long, F.; et al. Characterization of diacylglycerol acyltransferase 2 from Idesia polycarpa and function analysis. Chem. Phys. Lipids. 2021, 234, 105023. [Google Scholar] [CrossRef]
  61. Livak, K.J.; Schmittgen, T.D. Analysis of Relative Gene Expression Data Using Real-Time Quantitative PCR and the 2−ΔΔCt Method. Methods 2001, 25, 402–408. [Google Scholar] [CrossRef]
  62. Cruden, R.W.; Lloyd, R.M. Embryophytes have equivalent sexual phenotypes and breeding systems: Why not a common terminology to describe them? Am. J. Bot. 1995, 82, 816–825. [Google Scholar] [CrossRef]
  63. Rottenberg, A. Sex ratio and gender stability in the dioecious plants of Israel. Bot. J. Linn. Soc. 1998, 128, 137–148. [Google Scholar] [CrossRef]
  64. Fechter, I.; Hausmann, L.; Daum, M.; Rosleff Sörensen, T.; Viehöver, P.; Weisshaar, B.; Töpfer, R. Candidate genes within a 143 kb region of the flower sex locus in Vitis. Mol. Genet. Genom. 2012, 287, 247–259. [Google Scholar] [CrossRef]
  65. Wang, J.; Na, J.; Yu, Q.; Gschwend, A.; Han, J.; Zeng, F.; Aryal, R.; Van Buren, R.; Murray, J.; Zhang, W.; et al. Sequencing Papaya X and Yh Chromosomes Reveals Molecular Basis of Incipient Sex Chromosome Evolution. Proc. Natl. Acad. Sci. USA 2012, 109, 13710–13715. [Google Scholar] [CrossRef]
  66. Van Buren, R.; Zeng, F.; Chen, C.; Zhang, J.; Wai, C.M.; Han, J.; Aryal, R.; Gschwend, A.; Wang, J.; Na, J.; et al. Origin and domestication of papaya Yh chromosome. Genome Res. 2015, 25, 524–533. [Google Scholar] [CrossRef]
  67. Nagata, T.; Hasebe, M.; Toriba, T.; Crane, P. Sex conversion in Ginkgo biloba (Ginkgoaceae). J. Jpn. Bot. 2016, 91, 120–127. Available online: https://www.researchgate.net/publication/311859168 (accessed on 19 January 2016).
  68. Venkatasamy, S.; Khittoo, G.; Keeley, K.S. Leaky dioecy in Diospyros (Ebenaceae) endemic to the Island of Mauritius. Plant Ecol. 2007, 189, 139–146. [Google Scholar] [CrossRef]
  69. Krizek, B.A.; Fletcher, J.C. Molecular Mechanisms of Flower Development: An Armchair Guide. Nat. Rev. Genet. 2005, 6, 688–698. [Google Scholar] [CrossRef]
  70. Ming, R.; Moore, P.H. Genomics of sex chromosomes. Curr. Opin. Plant Biol. 2007, 10, 123–130. [Google Scholar] [CrossRef]
  71. Renner, S.S. The Relative and Absolute Frequencies of Angiosperm Sexual Systems: Dioecy, Monoecy, Gynodioecy, and An Updated Online Database. Am. J. Bot. 2014, 101, 1588–1596. [Google Scholar] [CrossRef]
  72. Charlesworth, D. Plant contributions to our understanding of sex chromosome evolution. New Phytol. 2015, 208, 52–65. [Google Scholar] [CrossRef]
  73. Renner, S.S.; Ricklefs, R.E. Dioecy and its correlates in the flowering plants. Am. J. Bot. 1995, 82, 596–606. [Google Scholar] [CrossRef]
  74. Charlesworth, D. Mogens Westergaard’s Contributions to Understanding Sex Chromosomes. Genetics 2018, 210, 1143–1149. [Google Scholar] [CrossRef]
  75. Ross, M.D. The Evolution of Gynodioecy and Subdioecy. Evolution 1978, 32, 174–188. [Google Scholar] [CrossRef]
  76. Harder, L.D.; Barrett, S.C.H. Ecology and Evolution of Flowers; Oxford University Press: New York, NY, USA, 2007. [Google Scholar]
  77. Barrett, S.C.H. The evolution of plant sexual diversity. Nat. Rev. Genet. 2002, 3, 274–284. [Google Scholar] [CrossRef]
  78. Charlesworth, D. Plant sex Chromosome Evolution. J. Exp. Bot. 2012, 64, 405–420. [Google Scholar] [CrossRef]
  79. Lloyd, D.G. Breeding systems in Cotula L. (Compositae, Anthemideae). I. The array of monoclinous and diclinous systems. New Phytol. 1972, 71, 1181–1194. [Google Scholar] [CrossRef]
  80. Opler, P.A.; Baker, H.G.; Frankie, G.W. Reproductive Biology of Some Costa Rican Cordia Species (Boraginaceae). Biotropica 1975, 7, 234–247. [Google Scholar] [CrossRef]
  81. Aryal, R.; Ming, R. Sex determination in flowering plants: Papaya as a model system. Plant Sci. 2014, 217–218, 56–62. [Google Scholar] [CrossRef]
  82. Akagi, T.; Henry, I.; Ohtani, H.; Morimoto, T.; Beppu, K.; Kataoka, I.; Tao, R. A Y-Encoded Suppressor of Feminization Arose via Lineage-Specific Duplication of a Cytokinin Response Regulator in Kiwifruit. Plant Cell. 2018, 30, 780–795. [Google Scholar] [CrossRef]
  83. Ideker, T.; Thorsson, V.; Ranish, J.A.; Christmas, R.; Buhler, J.; Eng, J.K.; Bumgarner, R.; Goodlett, D.; Aebersold, R.; Hood, L. Integrated genomic and proteomic analyses of a systematically perturbed metabolic network. Science 2001, 292, 929–934. [Google Scholar] [CrossRef]
  84. Muers, M. Gene expression: Transcriptome to proteome and back to genome. Nat. Rev. Genet. 2011, 12, 518. [Google Scholar] [CrossRef] [PubMed]
  85. Maier, T.; Güell, M.; Serrano, L. Correlation of mRNA and protein in complex biological samples. FEBS Lett. 2009, 583, 3966–3973. [Google Scholar] [CrossRef]
  86. Du, S.; Sang, Y.; Liu, X.; Xing, S.; Li, J.; Tang, H.; Sun, L. Transcriptome Profile Analysis from Different Sex Types of Ginkgo biloba L. Front. Plant Sci. 2016, 7, 871. [Google Scholar] [CrossRef] [PubMed]
  87. Wils, C.; Brandt, W.; Manke, K.; Vogt, T. A single amino acid determines position specificity of an Arabidopsis thaliana CCoAOMT-like O-methyltransferase. FEBS Lett. 2013, 587, 683–689. [Google Scholar] [CrossRef] [PubMed]
  88. Liu, X.; Zhao, C.; Gong, Q.; Wang, Y.; Cao, J.; Li, X.; Grierson, D.; Sun, C. Characterization of a caffeoyl-CoA O-methyltransferase-like enzyme involved in biosynthesis of polymethoxylated flavones in Citrus reticulata. J. Exp. Bot. 2020, 71, 3066–3079. [Google Scholar] [CrossRef]
  89. Hugueney, P.; Provenzano, S.; Verriès, C.; Ferrandino, A.; Meudec, E.; Batelli, G.; Merdinoglu, D.; Cheynier, V.; Schubert, A.; Ageorges, A. A novel cation-dependent O-methyltransferase involved in anthocyanin methylation in grapevine. Plant Physiol. 2009, 150, 2057–2070. [Google Scholar] [CrossRef]
  90. Gomez Roldan, M.V.; Outchkourov, N.; van Houwelingen, A.; Lammers, M.; Romero de la Fuente, I.; Ziklo, N.; Aharoni, A.; Hall, R.; Beekwilder, J. An O-methyltransferase modifies accumulation of methylated anthocyanins in seedlings of tomato. Plant J. 2014, 80, 695–708. [Google Scholar] [CrossRef]
  91. Du, H.; Wu, J.; Ji, K.; Zeng, Q.Y.; Bhuiya, M.W.; Su, S.; Shu, Q.; Ren, H.; Liu, Z.; Wang, L. Methylation mediated by an anthocyanin, O-methyltransferase, is involved in purple flower coloration in Paeonia. J. Exp. Bot. 2015, 66, 6563–6577. [Google Scholar] [CrossRef]
  92. Chowdhury, E.M.; Bo, S.C.; Sang, U.P.; Lim, H.S.; Bae, H. Transcriptional analysis of hydroxycinnamoyl transferase (HCT) in various tissues of Hibiscus cannabinus in response to abiotic stress conditions. Plant Omics 2012, 5, 305–313. [Google Scholar] [CrossRef]
  93. Vanholme, B.; Cesarino, I.; Goeminne, G.; Kim, H.; Marroni, F.; Van Acker, R.; Vanholme, R.; Morreel, K.; Ivens, B.; Pinosio, S.; et al. Breeding with rare defective alleles (BRDA): A natural Populus nigra HCT mutant with modified lignin as a case study. New Phytol. 2013, 198, 765–776. [Google Scholar] [CrossRef]
  94. Teng, L.; Zheng, K.; Qu, Y.T.; Cheng, Q. Cloning and Expression Characteristics Analysis of GbHCT13 Gene in Gossypium barbadense. Chin. J. Agric. Biotechnol. 2021, 29, 1050–1060. [Google Scholar] [CrossRef]
Figure 1. Morphology of I. polycarpa male flowers, bisexual flowers, and inflorescences. (A) Male and bisexual flowers; (B) male inflorescence; (C) bisexual inflorescence.
Forests 14 01737 g001
Figure 2. Photomicrographs of longitudinal sections of I. polycarpa male and bisexual flowers. The bisexual (A,B) and male flowers (C,D) are shown. S = stamen; O = ovule or ovule primordium. Bars, 200 µm.
Forests 14 01737 g002
Figure 3. Analysis of the differentially expressed proteins (DEPs). (A) The bar charts of DEPs in four comparison groups. The comparison groups are listed on the x-axis, and the corresponding up- and down protein numbers are listed on the y-axis. The red and green bars refer to upregulated and downregulated proteins, respectively. (BE) The volcano plots of the DEPs in four comparison groups. These are volcano plots of DEPs of log2 FC (x-axis) versus −log10 Q-value (y-axis). Adjusted p-value < 0.05 and FC greater than 1.2 or less than 0.83 were the significant threshold criteria for DEPs. The red and green dots indicate significantly upregulated and downregulated DEPs, respectively. The gray dots refer to non-significant expression differences.
Forests 14 01737 g003
Figure 4. The statistics and enriched GO terms of I. polycarpa DEGs. (A) The numbers of upregulated and downregulated DEGs. (B) The Venn diagrams of DEGs. (C) The GO functional classification analysis of DEGs. Different colored blocks represent the different comparison groups; orange blocks represent Ha vs. Ma data; blue blocks represent Hb vs. Mb data; green blocks represent Hb vs. Ha data; and yellow blocks represent Mb vs. Ma data.
Forests 14 01737 g004
Figure 5. The KEGG enrichment correlation analysis of transcriptome and proteome. The x-axis is the enriched number of proteins or genes, and the y-axis is the enriched KEGG pathway. Different colored blocks represent different omics data. Blue blocks refer to transcriptome data; yellow blocks refer to proteome data; and red blocks represent correlation data between the two omics.
Forests 14 01737 g005
Figure 6. Possible flavonoid metabolism pathways during I. polycarpa flower development. Enzymes involved in the pathways are shown in boldface capitals. The arrow tips indicate the orientation of enzymatic reactions. Abbreviation: CYP73A, trans-cinnamate 4-monooxygenase; CHS, chalcone synthase; CHI, chalcone isomerase; F3H, flavanone 3-hydroxylase; FLS, flavonol synthase; DFR, dihydroflavonol reductase; LAR, leucoanthocyanidin reductase; C3′H, p-coumaroyl shikimate 3′-hydroxylase; CCR, cinnamoyl-CoA reductase; PGT1, phlorizin synthase; HCT, shikimate/quinate hydroxycinnamoyl transferase; CCoAOMT, caffeoyl-CoA O-methyltransferase; CYP75B1, flavonoid 3′-monooxygenase; F3′5′H, flavonoid 3′,5′-hydroxylase; ANS, anthocyanin synthase; IFS, isoflavone synthase; HIDH, 2-hydroxyisoflavanone dehydratase; IF7GT, isoflavone 7-O-glucosyltransferase; IF7MAT, isoflavone 7-O-glucoside-6″-O-malonyltransferase; and I2′H, isoflavone 2′-hydroxylase.
Forests 14 01737 g006
Figure 7. Expression analysis of 9 candidate genes based on qRT−PCR and RNA−seq involved in the four comparison groups. The bar charts represent the log2 (fold change) values of the 9 candidate genes based on qRT−PCR and RNA−seq (values indicate mean ± SD based on three independent experiments), the genes are listed on the x-axis. Abbreviation: CCoAOMT, caffeoyl-CoA O-methyltransferase; HCT, shikimate/quinate hydroxycinnamoyl transferase; ANS, anthocyanidin synthase; PGT1, phlorizin synthase; CHS, chalcone synthase; CHI, chalcone isomerase.
Forests 14 01737 g007
Table 1. MASCOT search parameters.
ItemValue
Type of searchMS/MS ion search
EnzymeTrypsin
Fragment mass tolerance0.05 Da
Peptide mass tolerance20 ppm
Fixed modificationsCarbamidomethyl (C), ITRAQ8plex (N-term), ITRAQ8plex (K)
Variable modificationsOxidation (M), deamidated (NQ), ITRAQ8plex (Y)
Peptide FDR≤0.01
Table 2. Summary of protein identification in I. polycarpa male and bisexual flowers.
Sample NameTotal SpectraSpectraPeptideUnique PeptideProtein
Replicate 1928,921111,49747,19531,51410,122
Replicate 2953,111115,43448,00631,90410,158
Replicate 3938,500111,13847,99032,05210,243
Total2,820,532338,06964,94247,58015,003
Table 3. The statistics of RNA-seq data from 12 samples.
SampleTotal Raw Reads (M)Total Clean Reads (M)Total Clean Bases (Gb)Total Number of UnigenesClean Reads Q20 (%)Clean Reads Q30 (%)GC (%)
Ha147.3343.716.5687,61897.0588.8740.44
Ha247.3343.16.4687,26396.8988.3840.45
Ha347.3343.056.4686,16897.289.1240.48
Hb147.3343.246.4993,89997.0288.7640.08
Hb249.0844.966.74114,09897.0888.9939.5
Hb347.3343.56.5390,57596.9888.6340.18
Ma147.3343.396.5198,94797.0888.9740.03
Ma249.0845.056.76112,13096.988.3939.44
Ma347.3343.46.5170,1229788.740.88
Mb147.3343.766.5648,72096.9588.6141.41
Mb247.3343.446.52102,84896.988.4139.71
Mb349.0844.96.74115,56496.9188.4439.18
Note, Q20 percentage presents the proportion of bases with quality values larger than 20. Q30 percentage presents the proportion of bases with quality values larger than 30. GC percentage is the guanine and cytosine molar ratio.
Disclaimer/Publisher’s Note: The statements, opinions and data contained in all publications are solely those of the individual author(s) and contributor(s) and not of MDPI and/or the editor(s). MDPI and/or the editor(s) disclaim responsibility for any injury to people or property resulting from any ideas, methods, instructions or products referred to in the content.

