Article

Remote Sensing Identification and the Spatiotemporal Variation of Drought Characteristics in Inner Mongolia, China

1
Water Conservancy and Civil Engineering College, Inner Mongolia Agricultural University, Hohhot 010018, China
2
Yinshanbeilu National Field Research Station of Desert Steppe Eco-Hydrological System, China Institute of Water Resources and Hydropower Research, Beijing 100038, China
3
Institute of Water Resources for Pastoral Area, Ministry of Water Resources, Hohhot 010020, China
*
Author to whom correspondence should be addressed.
Forests 2023, 14(8), 1679; https://doi.org/10.3390/f14081679
Submission received: 20 June 2023 / Revised: 7 August 2023 / Accepted: 7 August 2023 / Published: 18 August 2023
(This article belongs to the Special Issue Global Change and Forest Plant Community Dynamics)

Abstract

:
In the context of global warming, timely and accurate drought monitoring is of great importance to ensure regional ecological security and guide agricultural production. This study established the Drought Severity Index (DSI), based on the potential evapotranspiration (PET), evapotranspiration (ET) and normalized difference vegetation index (NDVI) data from 2001 to 2020, to compensate for the low accuracy of drought spatial and temporal evolution due to the uneven distribution of stations. The DSI index was established to reveal the spatial and temporal variation of droughts in Inner Mongolia in the past 20 years, using trend analysis, gravity shift and geographic probes, and to explore the influence of different factors on the DSI. The results were as follows. (1) The results showed that the spatial distribution of DSI in Inner Mongolia during 2001–2020 had strong spatial heterogeneity, and generally showed distribution characteristics of drought in the west and wet in the east. In addition, the changes in DSI all exhibited a rising tendency, with the highest tendency in deciduous broadleaf forests (DBF) and the lowest tendency in grassland (GRA). (2) The center of gravity of wet, normal and arid areas showed a migration trend from northeast to southwest, with migration distances of 209 km, 462 km and 826 km, respectively. (3) The four combinations of temperature and elevation, temperature and slope, temperature and land use, and temperature and rainfall contributed the most. The results obtained in this study are important for the scheduling of ecological early warnings and drought prevention and control.

1. Introduction

With rapid socio-economic development and a growing population, the problem of water shortages is becoming progressively severe, bringing about the expansion of dry areas and deepening aridity, which has become a hot issue of global concern [1,2,3]. Decreasing precipitation and increasing temperature are the dominating elements resulting in a drought occurring [4]. Droughts are characterized by a wide range of impacts and great difficulty in management and have serious impacts on agricultural production and human life [5,6,7]. Therefore, information on how to monitor and predict drought occurrence and its development pattern on a large scale and in a timely and accurate manner will be crucial guidance for agricultural production and ecological environment management in Inner Mongolia.
Drought assessment and monitoring are often evaluated quantitatively through drought indices [8,9,10]. In previous studies, for example, Ji et al. (2022) [11] and Pei et al. (2020) [12], the standardized precipitation evapotranspiration index (SPEI) and standardized precipitation index (SPI) have been used to describe drought conditions in Inner Mongolia. Drought indices were mostly calculated based on meteorological data observed at stations, which were limited by the number of monitoring stations, coverage, and the spatial and temporal distribution and density of monitoring data, making it difficult to meet the needs of drought monitoring in large regions [13]. Recently, as remote sensing technology and data are promoted by the advantage of easy access, wide coverage and spatial continuity have compensated for the lack of station observation figures. Additionally, continuity is widely used in drought monitoring [14,15,16]. However, there are often problems with using drought indices for the remote sensing monitoring of vegetation conditions, such as an obvious lag effect of the vegetation growth status on precipitation, the possible production of a large bias when using such indices to monitor drought [17,18,19,20], and the difficulty of eliminating drought caused by seasonal stresses when using drought indices for the remote sensing monitoring of temperature categories, although they can describe vegetation drought caused by high temperatures and moisture stresses [21,22,23]. Therefore, the use of drought indices that combine surface temperature and vegetation indices can better monitor changes in soil moisture [24,25,26]. For example, Carlson et al. [27] proposed the Vegetation Water Supply Index (VSWI), a simpler vegetation–temperature crop drought composite index that provides a better response to drought conditions throughout the growing season. Zormand et al. [28] evaluated the application of remote sensing indices such as the perpendicular drought index (PDI) and the modified perpendicular drought index (MPDI) used in drought monitoring in Northeast Iran and concluded that the different aridity indices have different accuracies at different time scales. Yao et al. [29] used the temperature vegetation drought index (TVDI) to analyze the characteristics of drought changes in Inner Mongolia and proved that TVDI has good applicability in drought monitoring in arid and semi-arid regions, concluding that the frequency of drought events in four typical grassland-type regions in Inner Mongolia, namely Duolun, Xilinhot, Hailaer and Siziwangqi, increased significantly after the year 2000. The Vegetation Health Index (VHI) takes into account the local biophysical (soil and slope) and climatic conditions and can be used for practical drought monitoring in various agro-meteorological zones [30]. Jackson et al. [31] proposed the Crop Water Scarcity Index (CWSI), based on the principle of heat balance, which can reflect a certain vegetation soil moisture condition and thus obtain crop water scarcity information. The Drought Severity Index (DSI) is based on the surface energy equilibrium and has an elevated gauge accuracy and a specific physical definition, which is a vital element making it superior to the other drought indicators, and provides a potential means for global assessment and the potential monitoring of drought occurrence, severity and duration at relatively fine (1 km resolution) spatial scales.
Therefore, this study uses the DSI to make up for the low accuracy of the spatio-temporal evolution of drought caused by the uneven distribution of sites and studies the spatio-temporal evolution of drought. The main purpose of this study is (1) to analyze the spatio-temporal variation of drought using trend analysis; (2) to reveal the moving direction and distance of the barycenter locus of wetting, normal and drought changes; and (3) to explore and reveal the driving factors of drought occurrence, and clarify the response mechanism of the DSI to climate, topographic factors and land use types with the aim of clarifying the driving mechanism of drought changes in Inner Mongolia and providing scientific reference for regional disaster prevention and mitigation.

2. Materials and Methods
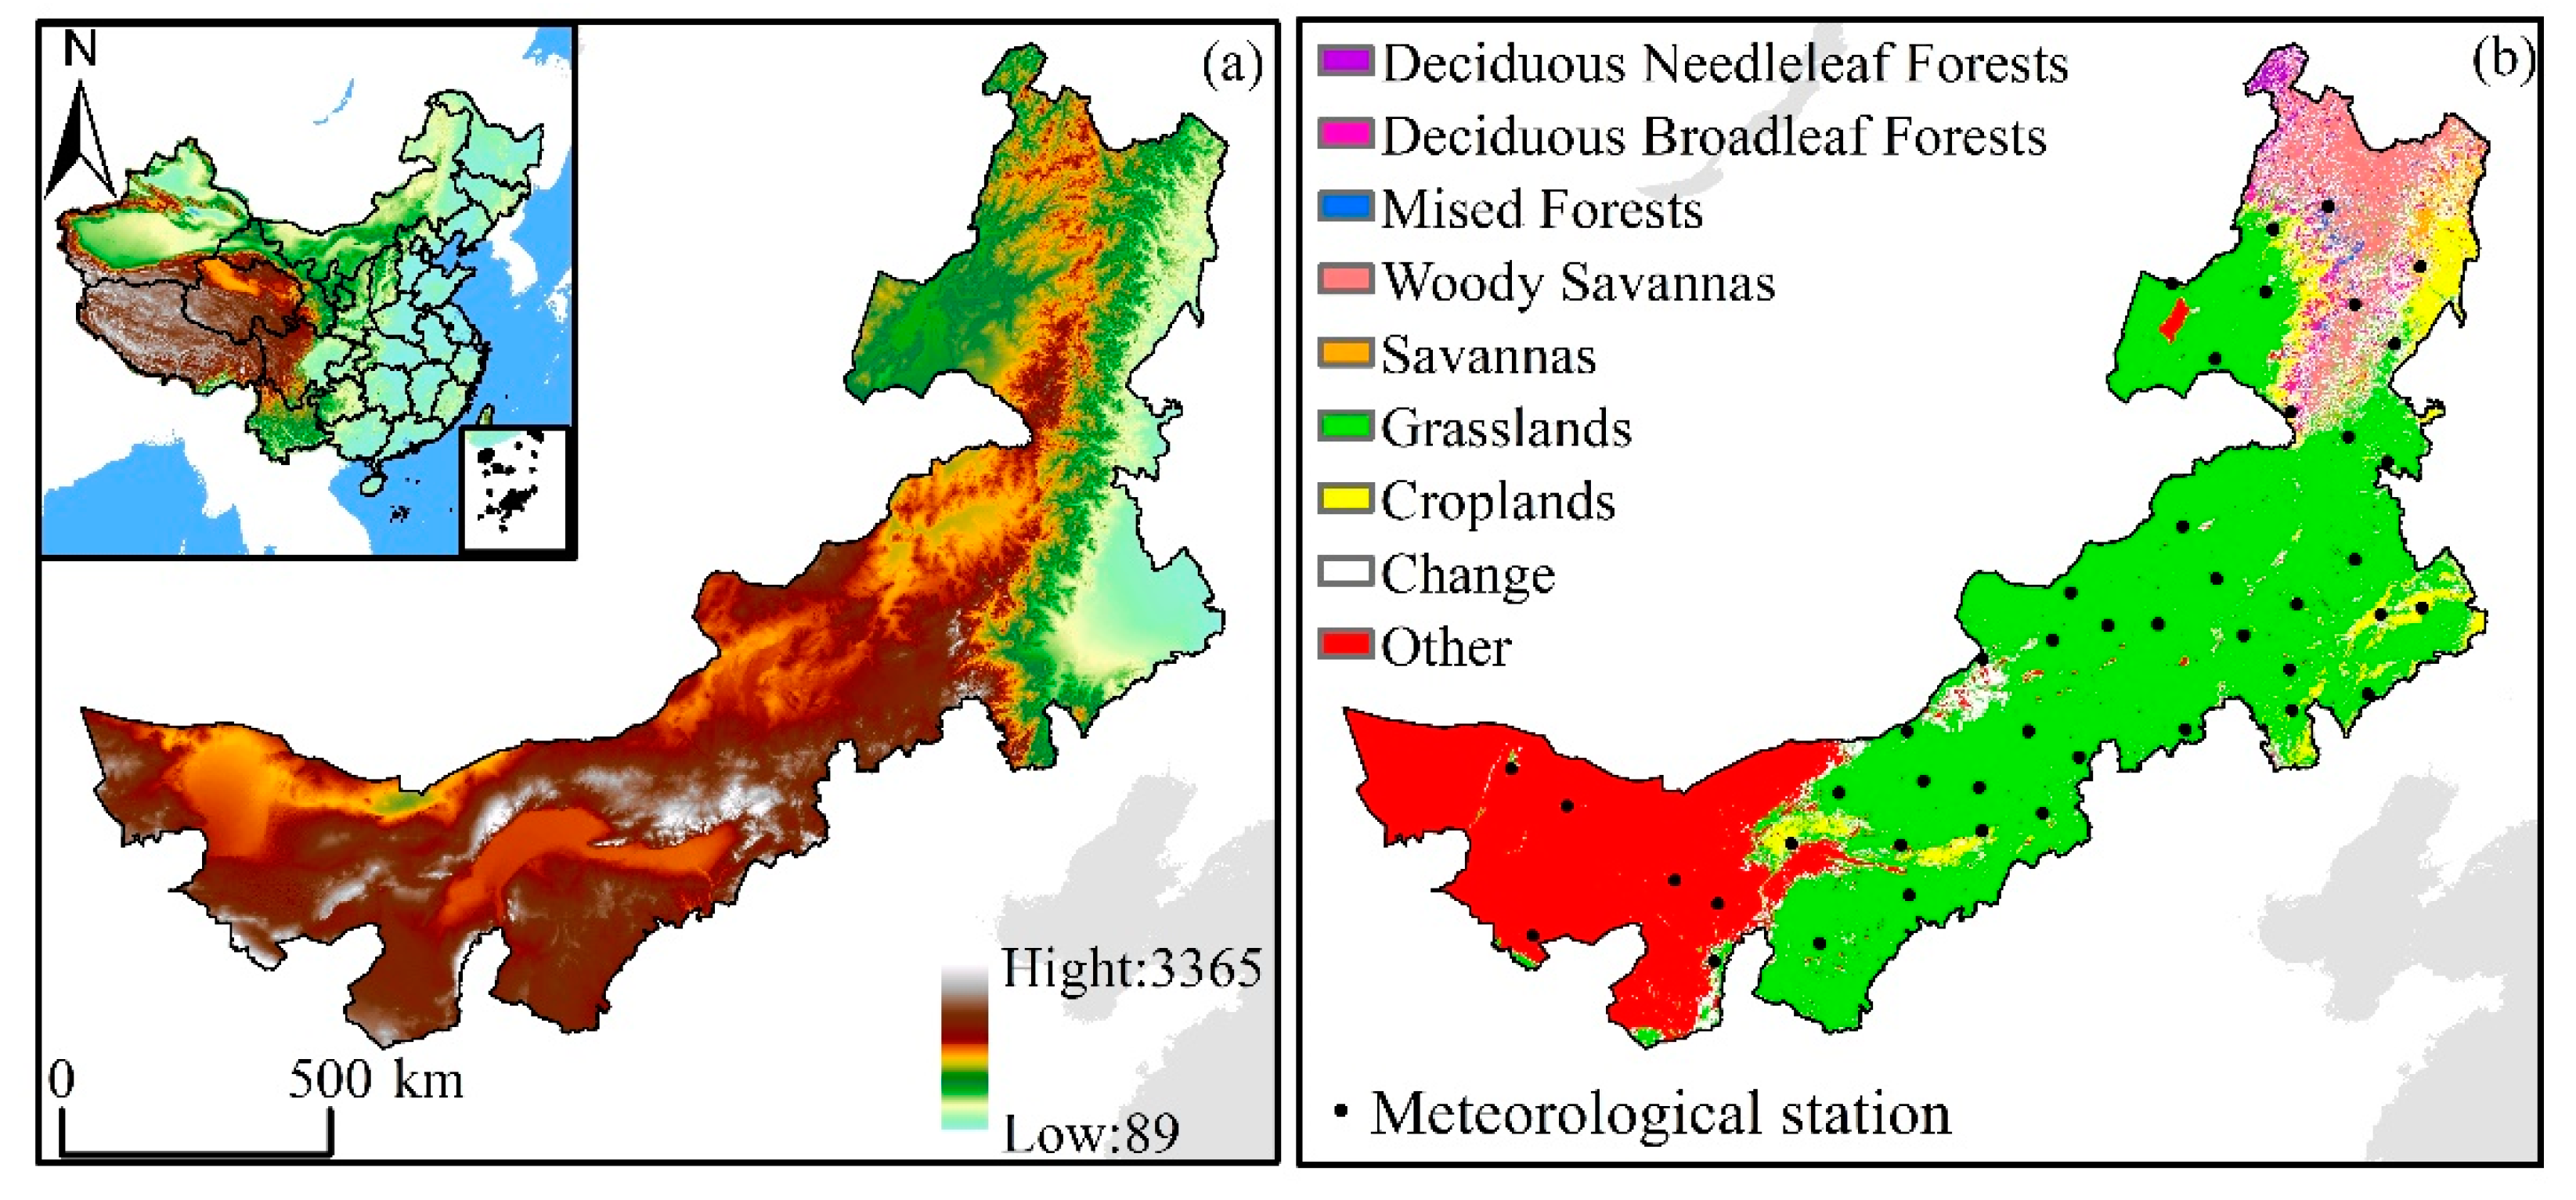
2.1. Study Area

Inner Mongolia lies in the northern frontier region of China, with an area of 1.183 million km2. The topography of Inner Mongolia is complex, with a variety of geomorphological units and an average altitude of 1000 m. The topography decreases from west to east and from south to north (Figure 1a). Inner Mongolia is inland, in the middle of the northern hemisphere and with high latitudes, and belongs to the transition area from semi-arid climate in the northwest to semi-humid and humid monsoon climates on the southeast coast. The average annual temperature is between −4.65 and 9.14 °C, characteristic of a hot and short summer, a long and cold winter, a windy spring with little rain, a dramatic temperature drop in autumn, a big temperature difference between days and nights, and sufficient sunshine time. The precipitation is low and uneven, with an average of 375 mm across the region, decreasing from northeast to southwest.

2.2. Data Sources and Preprocessing

2.2.1. Remote Sensing Data

MOD16A2, MOD13A3 and MCD12Q1 for 2001–2020 all originated from the National Aeronautics and Space Administration (NASA). MOD16A2 covers 8 days’ potential evapotranspiration (PET) and synthetic actual evapotranspiration (ET) with a resolution of 0.5 km; MOD13A3 is the monthly synthetic NDVI with a resolution of 1 km. Land cover products with a spatial resolution of 0.5 km were converted from HDF format to Geo-Tiff by means of HEG software (v 2.15) offered by NASA. The SIN projection was converted to a WGS~1984/Geographic latitude and longitude coordinate system, and mosaic and crop. The ET, PET, NDVI and land cover product datasets for the study area were obtained by removing invalid values from figures and restoring true values according to the instructions for using the data provided on the website, and unifying them to 1 km resolution.

2.2.2. Vegetation Cover Data

With a view to lessening the errors of classification and the potential outcomes of land cover variations, only the image elements whose land cover categories remained unchanged between 2001 and 2020 were preserved in this article. The percentages of major vegetation types were: Deciduous Needleleaf Forests (0.66%), Deciduous Broadleaf Forests (1.30%), Mised Forests (1.38%), Woody Savannas (0.26%), Croplands (4.65%), Savannas (6.08%), Grasslands (49.99%), Change (10.25%), Other (25.43%).

2.2.3. Meteorological Data

The meteorological figures originated from the China Meteorological Data Network, and the year-by-year average temperature and precipitation data were selected from a total of 43 meteorological stations in and around Inner Mongolia from 2001 to 2020. Missing or anomalous data of individual stations were excluded, and the Kriging approach was employed to spatially inset meteorological figures and align their resolutions with ET, PET and NDVI figures.

2.3. Methodology

2.3.1. DSI

The DSI integrates the NDVI and ET to PET ratio [32], which can invert the water deficit of vegetation and crops. The calculation equation is:
Z N D V I = N D V I N D V I ¯ δ N D V I
Z E T / P E T = E T / P E T E T / P E T ¯ δ E T / P E T
Z = Z N D V I + Z E T / P E T
D S I = Z Z ¯ δ Z
In which NDVI and ET/PET are the values of NDVI and ET/PET for a certain period within the study period, respectively; N D V I ¯ and δ N D V I refer to the average and standard deviation of NDVI, separately; E T / P E T ¯ and δ E T / P E T refer to the average and standard deviation of ET/PET, separately; Z ¯ and δ Z are the mean and standard deviation of Z, separately; and a larger value of the DSI indicates humidity for drought, and vice versa. In this study, the drought level of the study area was divided by reference to the literature [33] (Table 1).

2.3.2. Sen + Mann–Kendall Trend Estimation

Trends in ET, PET, NDVI and DSI time series from 2001 to 2020 were analyzed using trend analysis to study the characteristics of the change trends [34]. At the same time, the Mann–Kendall method was used to test the significance of the change trend, calculated as below [35]:
β = M e d i a n ( x j - x i j - i ) , j > i
where β is the variation trend of pixel ET, PET, NDVI and DSI; i and j are time series; and xi and xj represent the pixel ET, PET, NDVI and DSI values of time i and time j, respectively.

2.3.3. Weight Transfer Model

The weight migration model is capable of reflecting the spatial aggregation and migration characteristics of drought in spatial and temporal variation [36], using the following equation [37]:
X = i = 1 n P i X i i = 1 n P i , Y = i = 1 n P i Y i i = 1 n P i
In which X and Y are the latitude and longitude coordinates of the center of gravity of the drought distribution; Pi is the DSI value of the ith image factor; and Xi and Yi are the latitude and longitude coordinates of the center of the ith image factor, separately.

2.3.4. Correlation Analysis

To study the impact of climate elements on drought, correlation coefficients between climate elements and DSI were calculated image by image [38] using the following equation [39]:
R = i = 0 n ( x i - x ¯ ) ( y - y ¯ ) i = 0 n ( x i - x ¯ ) 2 i = 0 n ( y - y ¯ ) 2
where xi denotes the climate element value in year i, x ¯ denotes the mean value of the climate element in the calendar year, yi denotes the yearly mean DSI value in year i, and additionally y ¯ denotes the mean DSI value in the calendar year.

2.3.5. Geographic Probe Model

Factor and interaction detectors were adopted to investigate the influence of the drought index (DSI). The q value (value range of 0 to 1) within the factor detector was adopted to gauge the explanatory power from the independent variable to the spatial heterogeneity concerning the dependent variable. When q reaches 0, it means that the independent variable factor does not depend upon the dependent variable; when q reaches 1 it means that the independent variable fully masters the spatial distribution of the dependent variable [40]. If the q value is larger, the explanatory power from the independent variable to the dependent variable will be stronger. This formula is as follows [41]:
q = 1 1 N σ 2 h = 1 L N h σ h 2
where L refers to the stratification of variable Y or factor X; N and σ2 are the whole quantity of all examples within the study field, as well as the discrete variance of the whole area, separately; Nh and σ h 2 are the number of examples and discrete variance of area h, respectively, and h = 1,2,3,…,n. The interaction detector is mainly employed for the purpose of identifying interactions between disparate influencing elements, i.e., to assess whether the driving factors, when acting together, strengthen or de-escalate the explanatory power when the driving factors act together, or whether these factors have an independent effect on the dependent variable.

3. Results

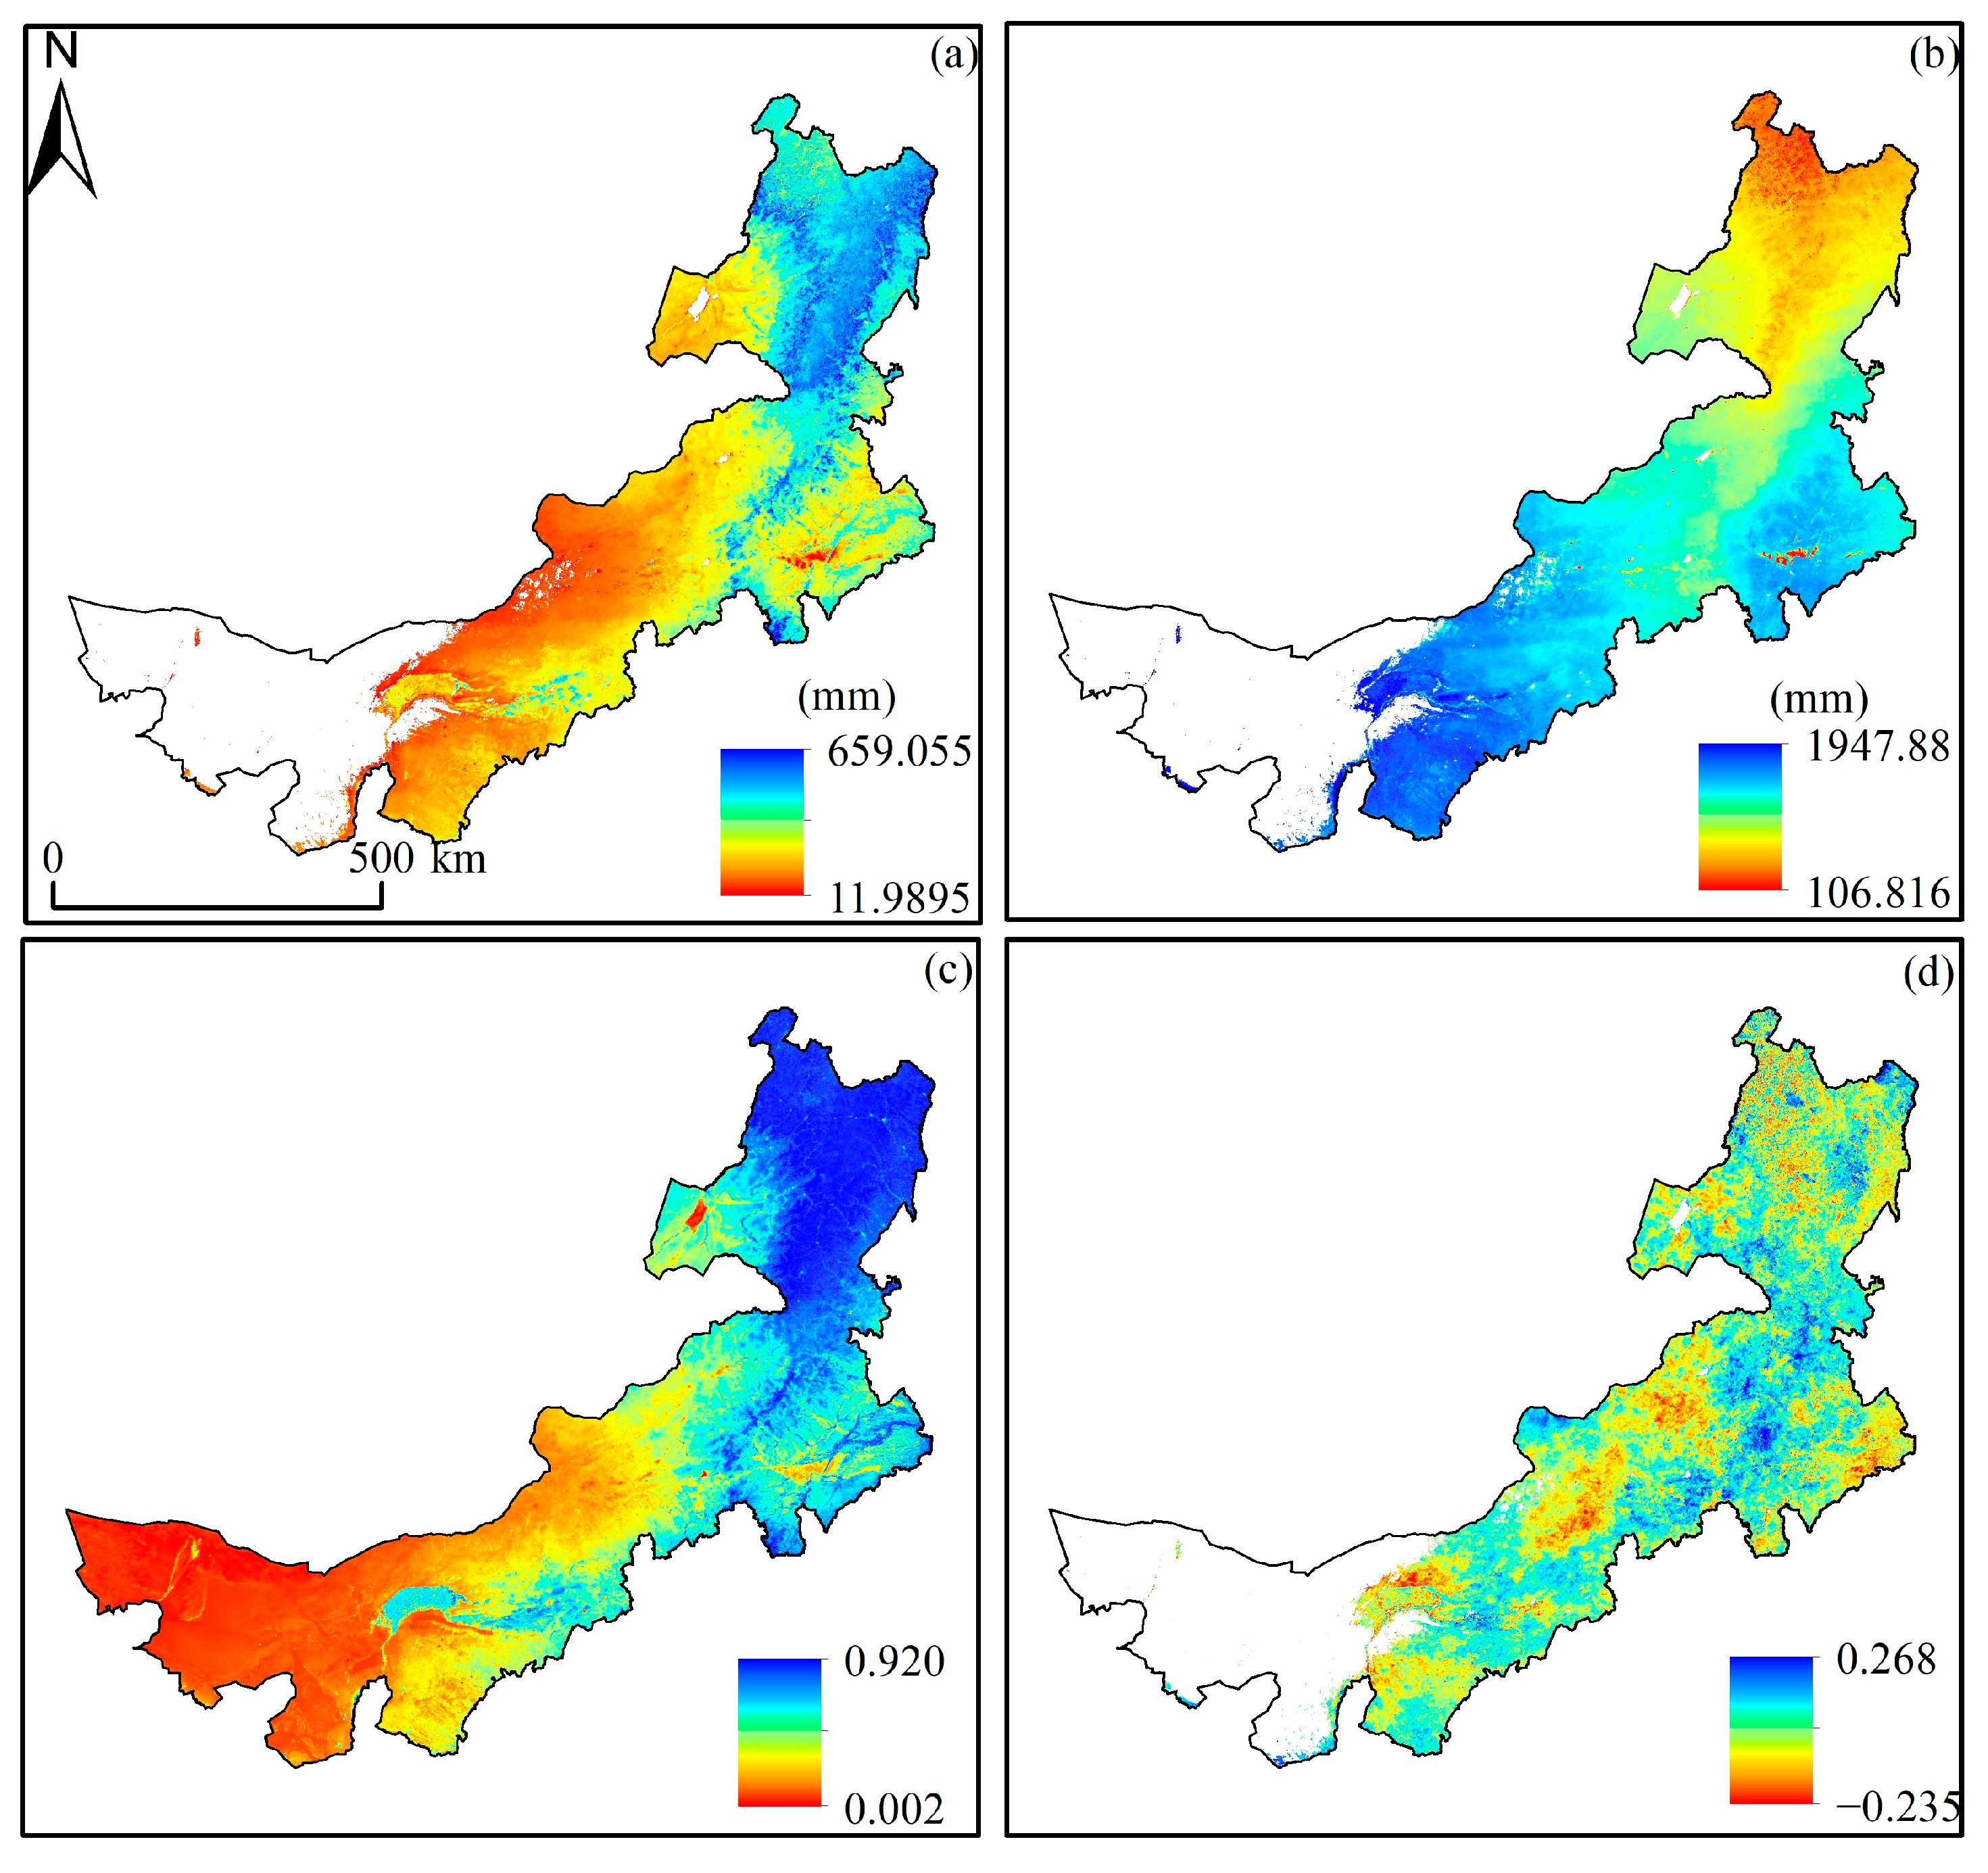
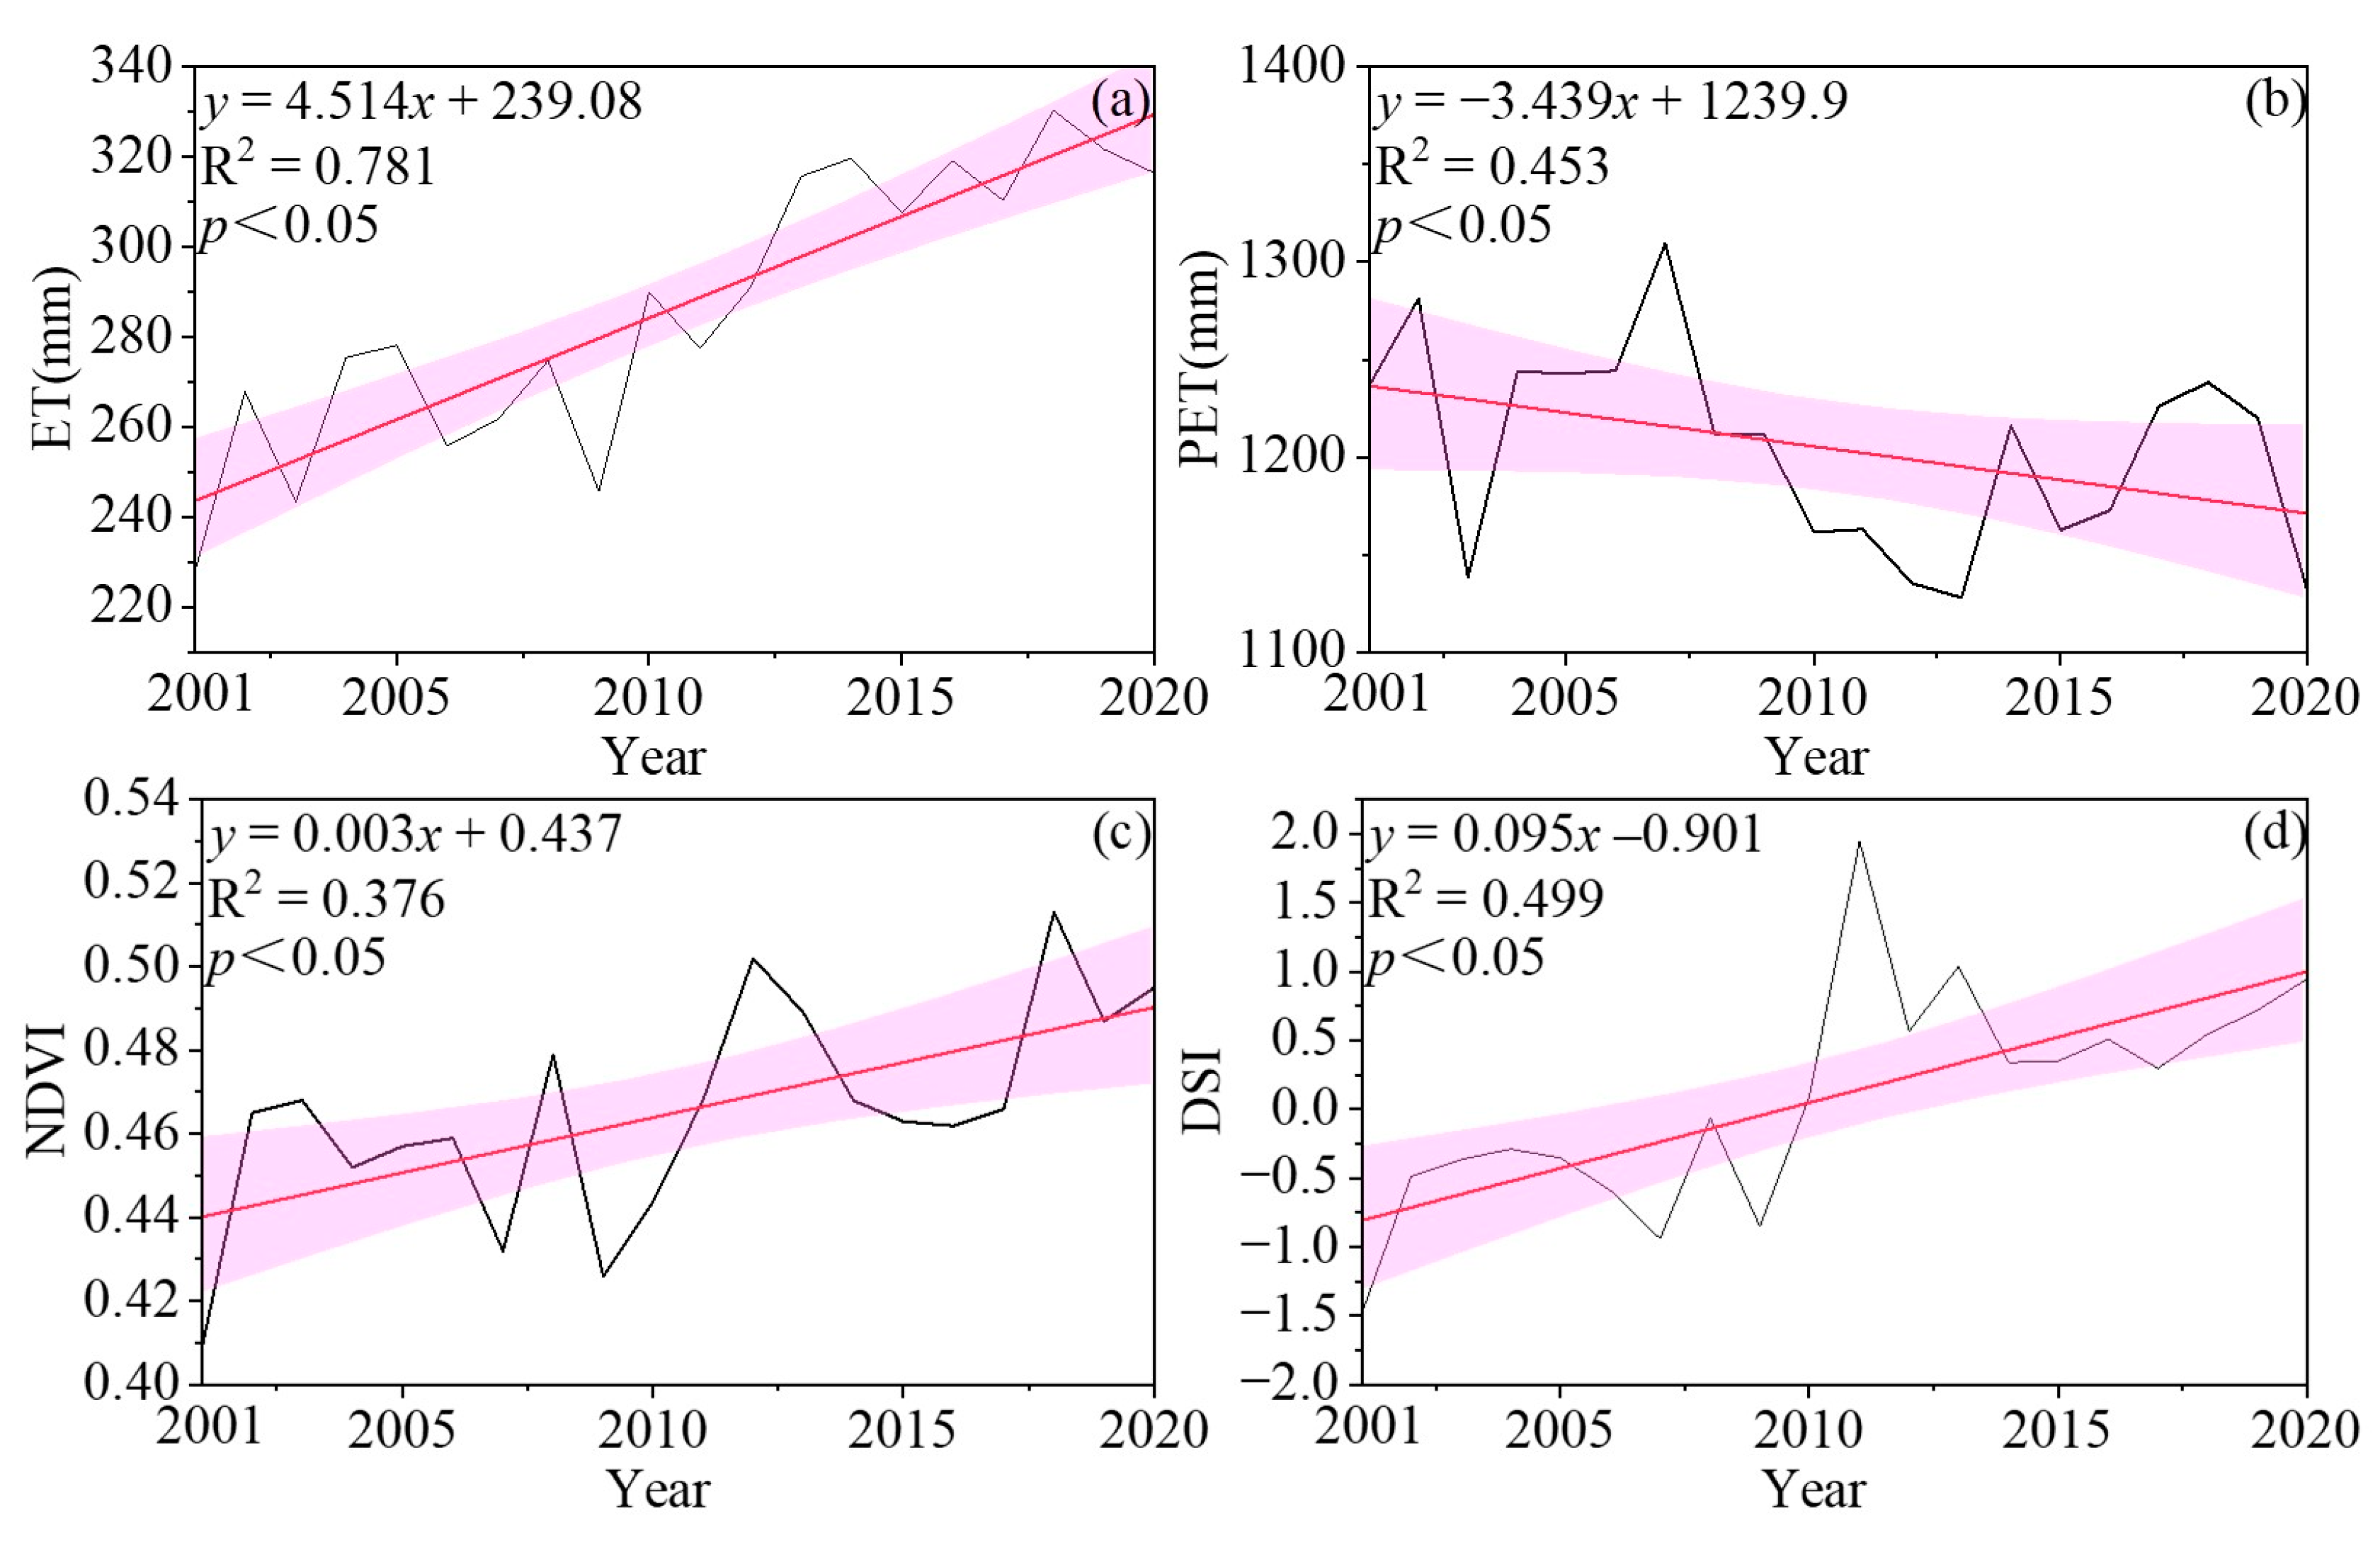
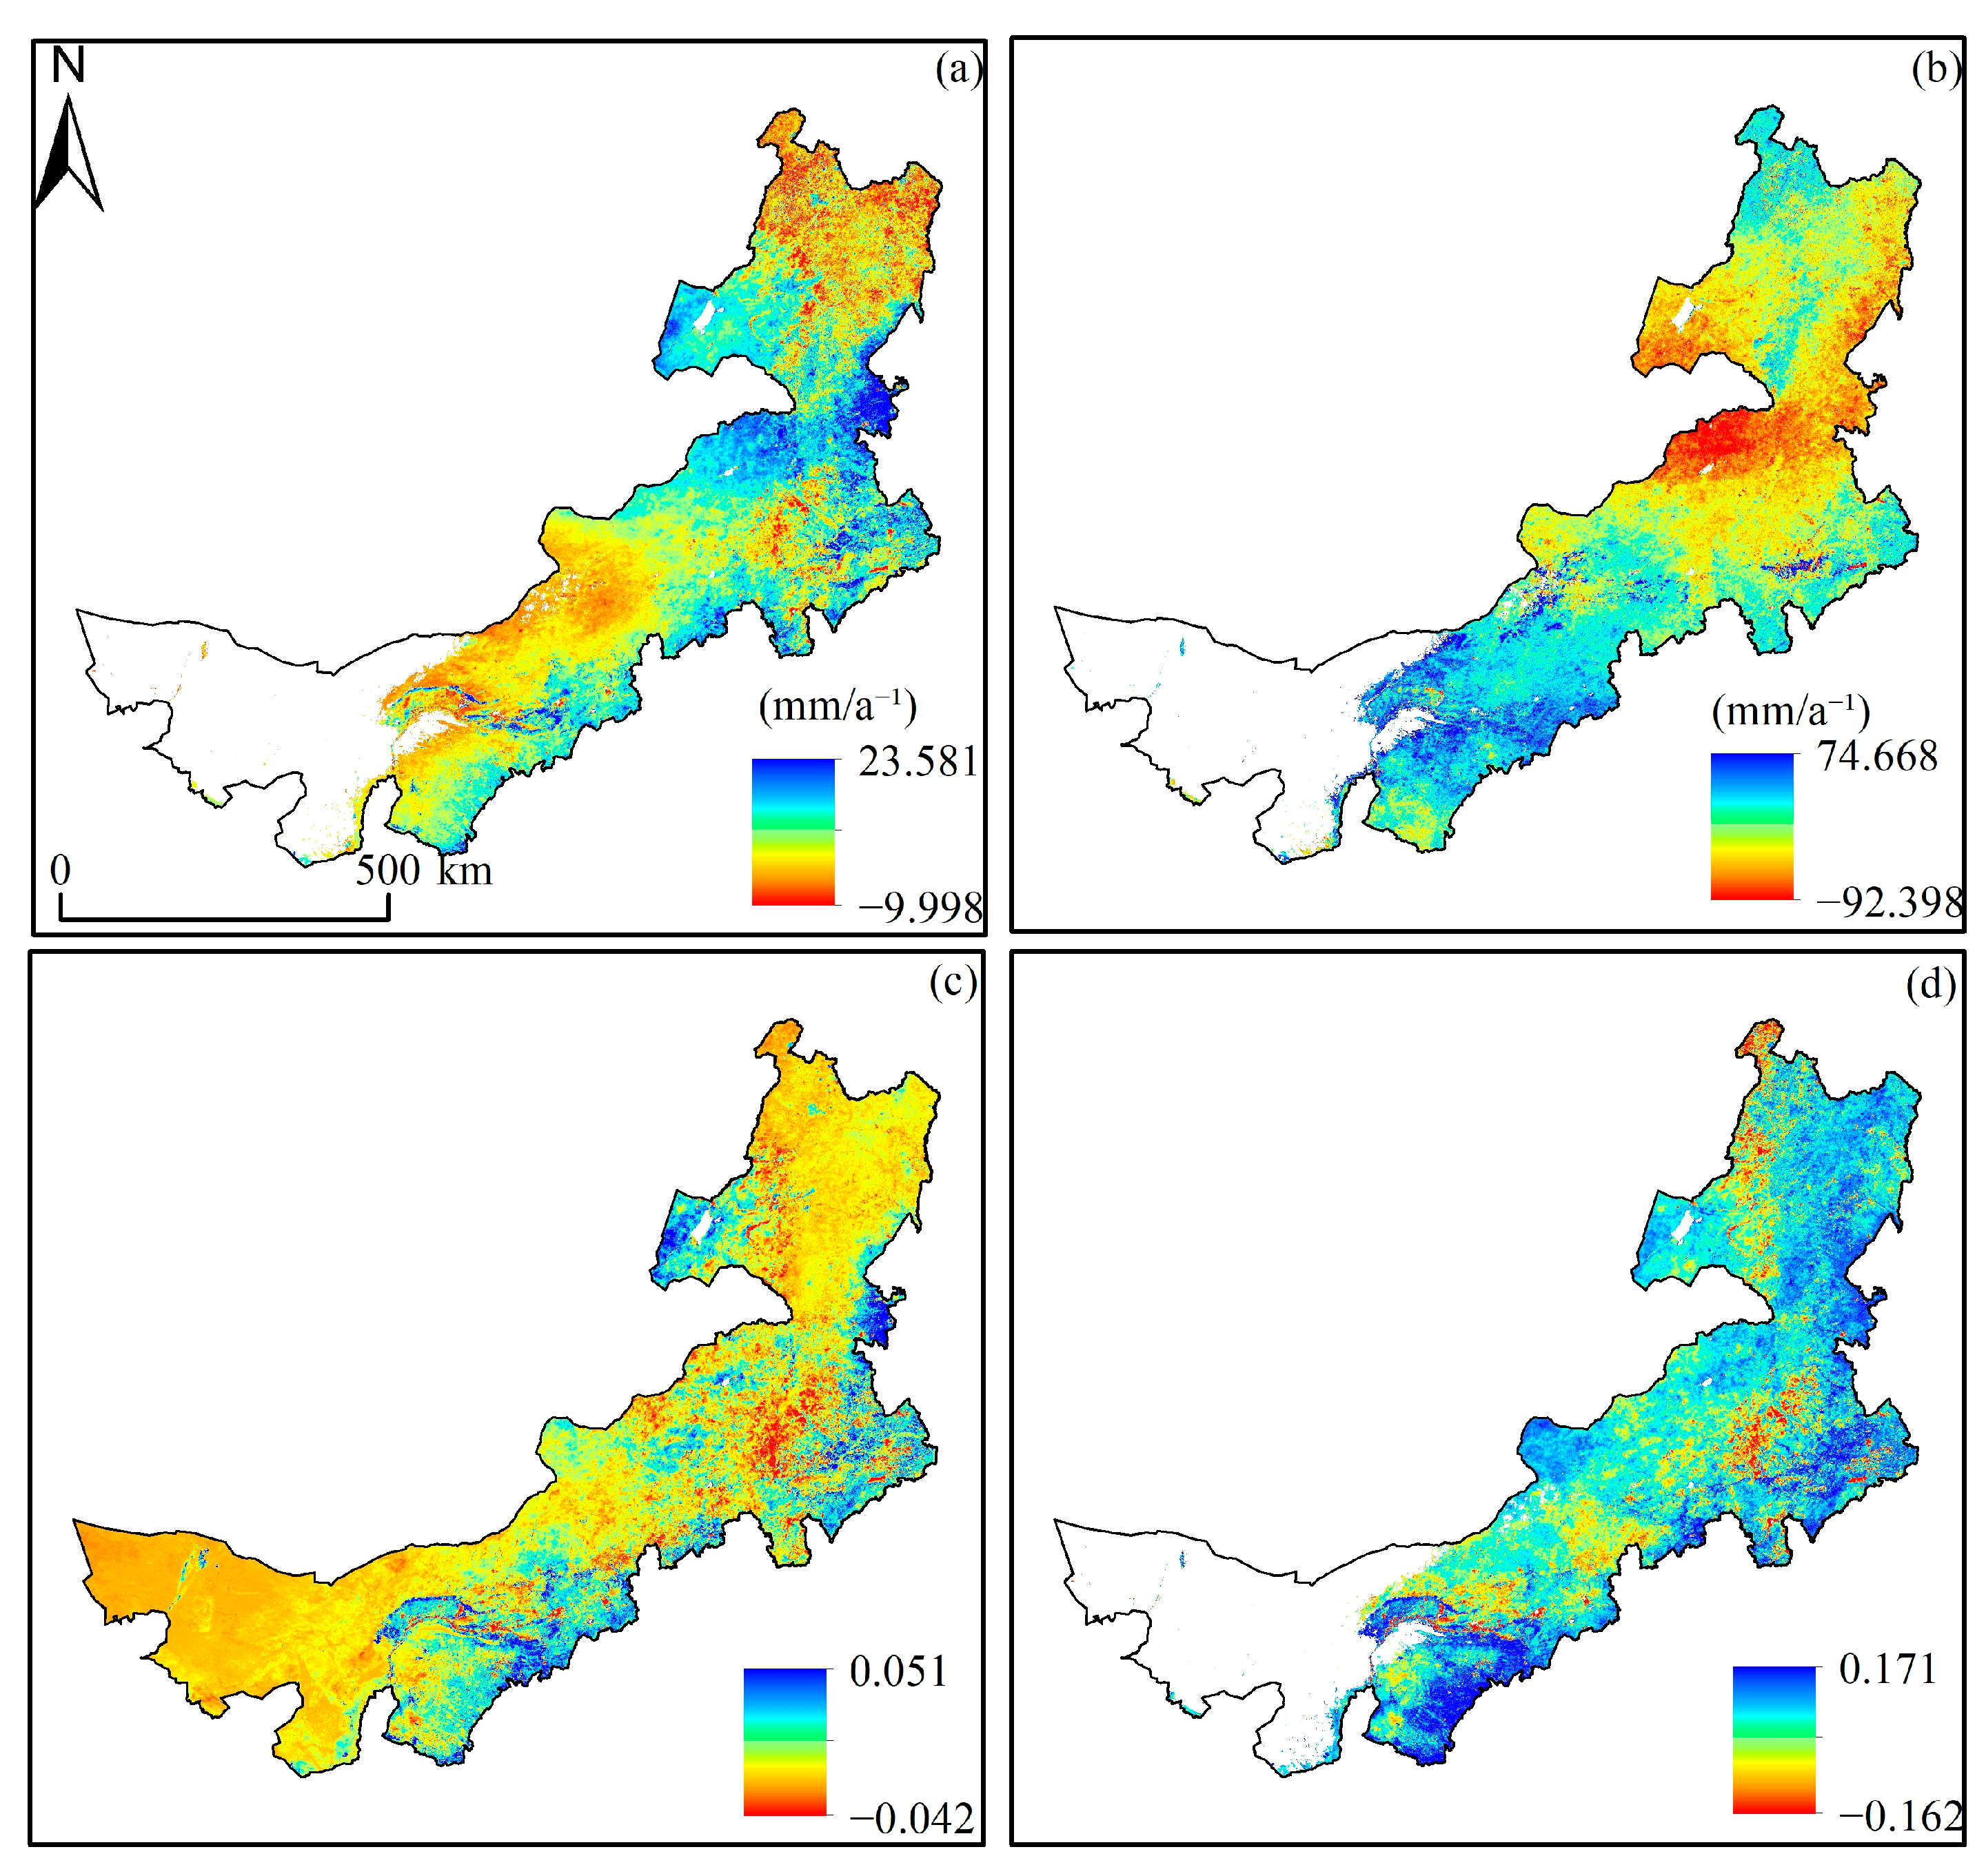
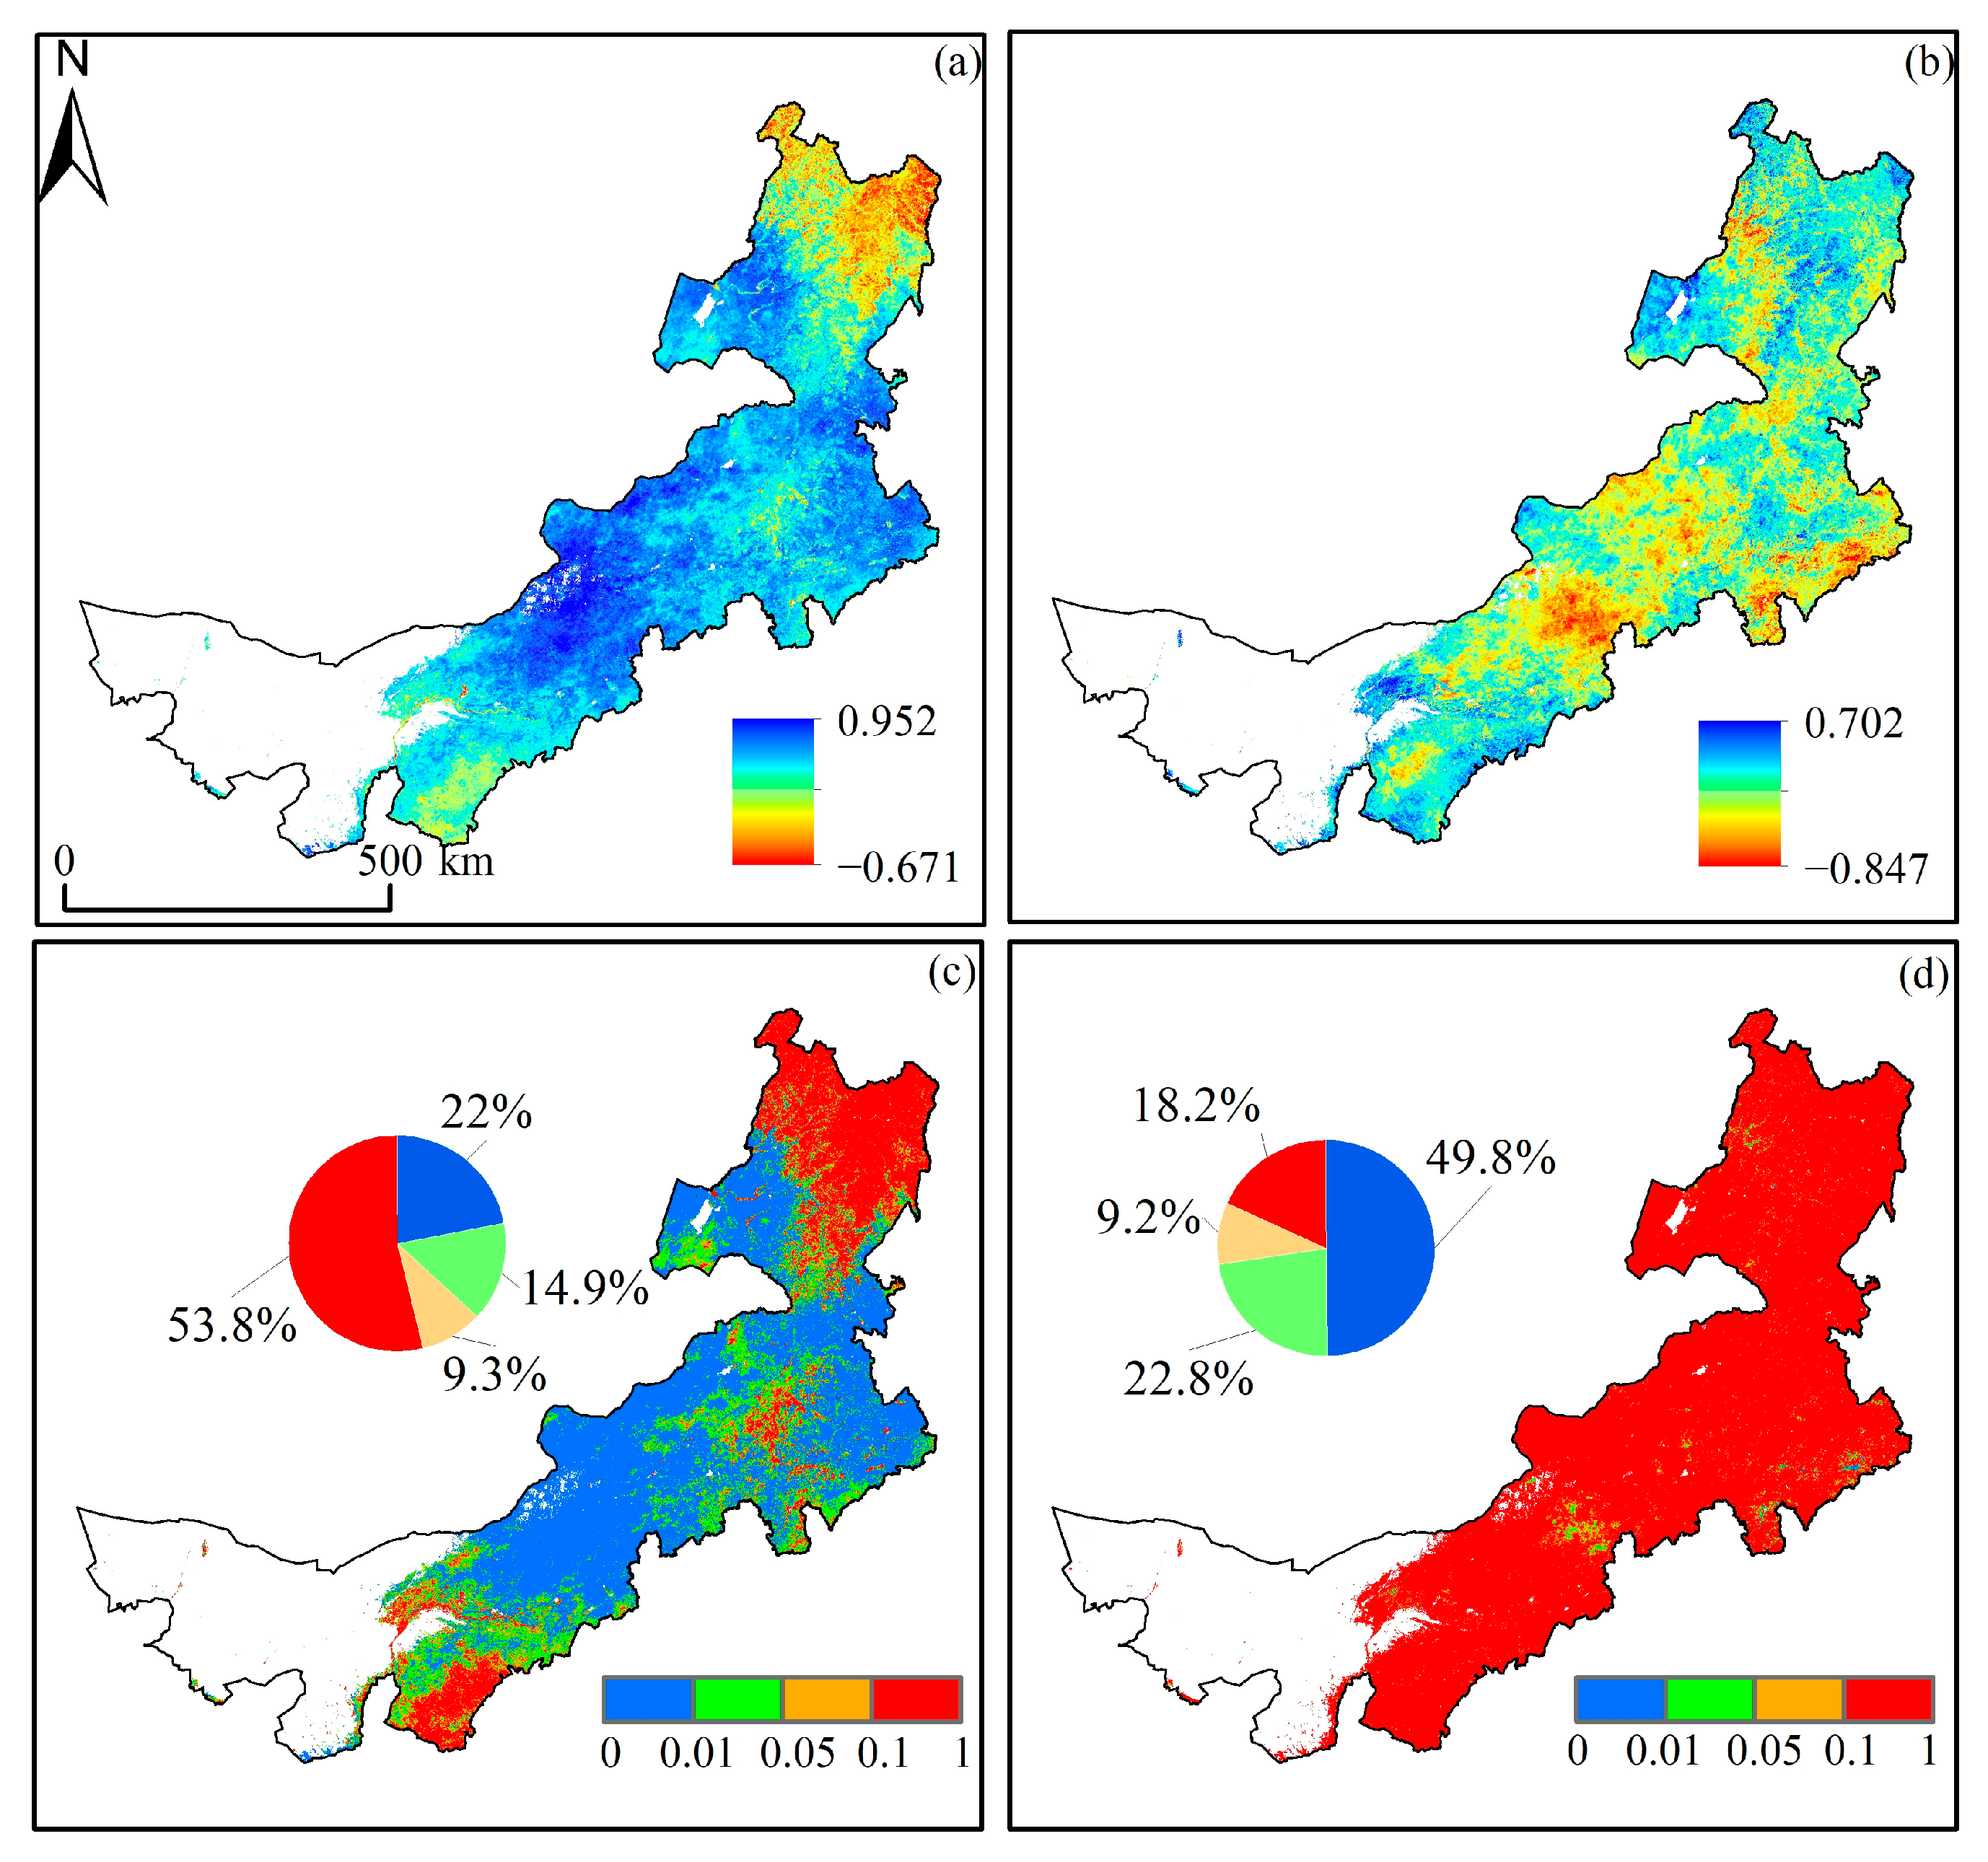
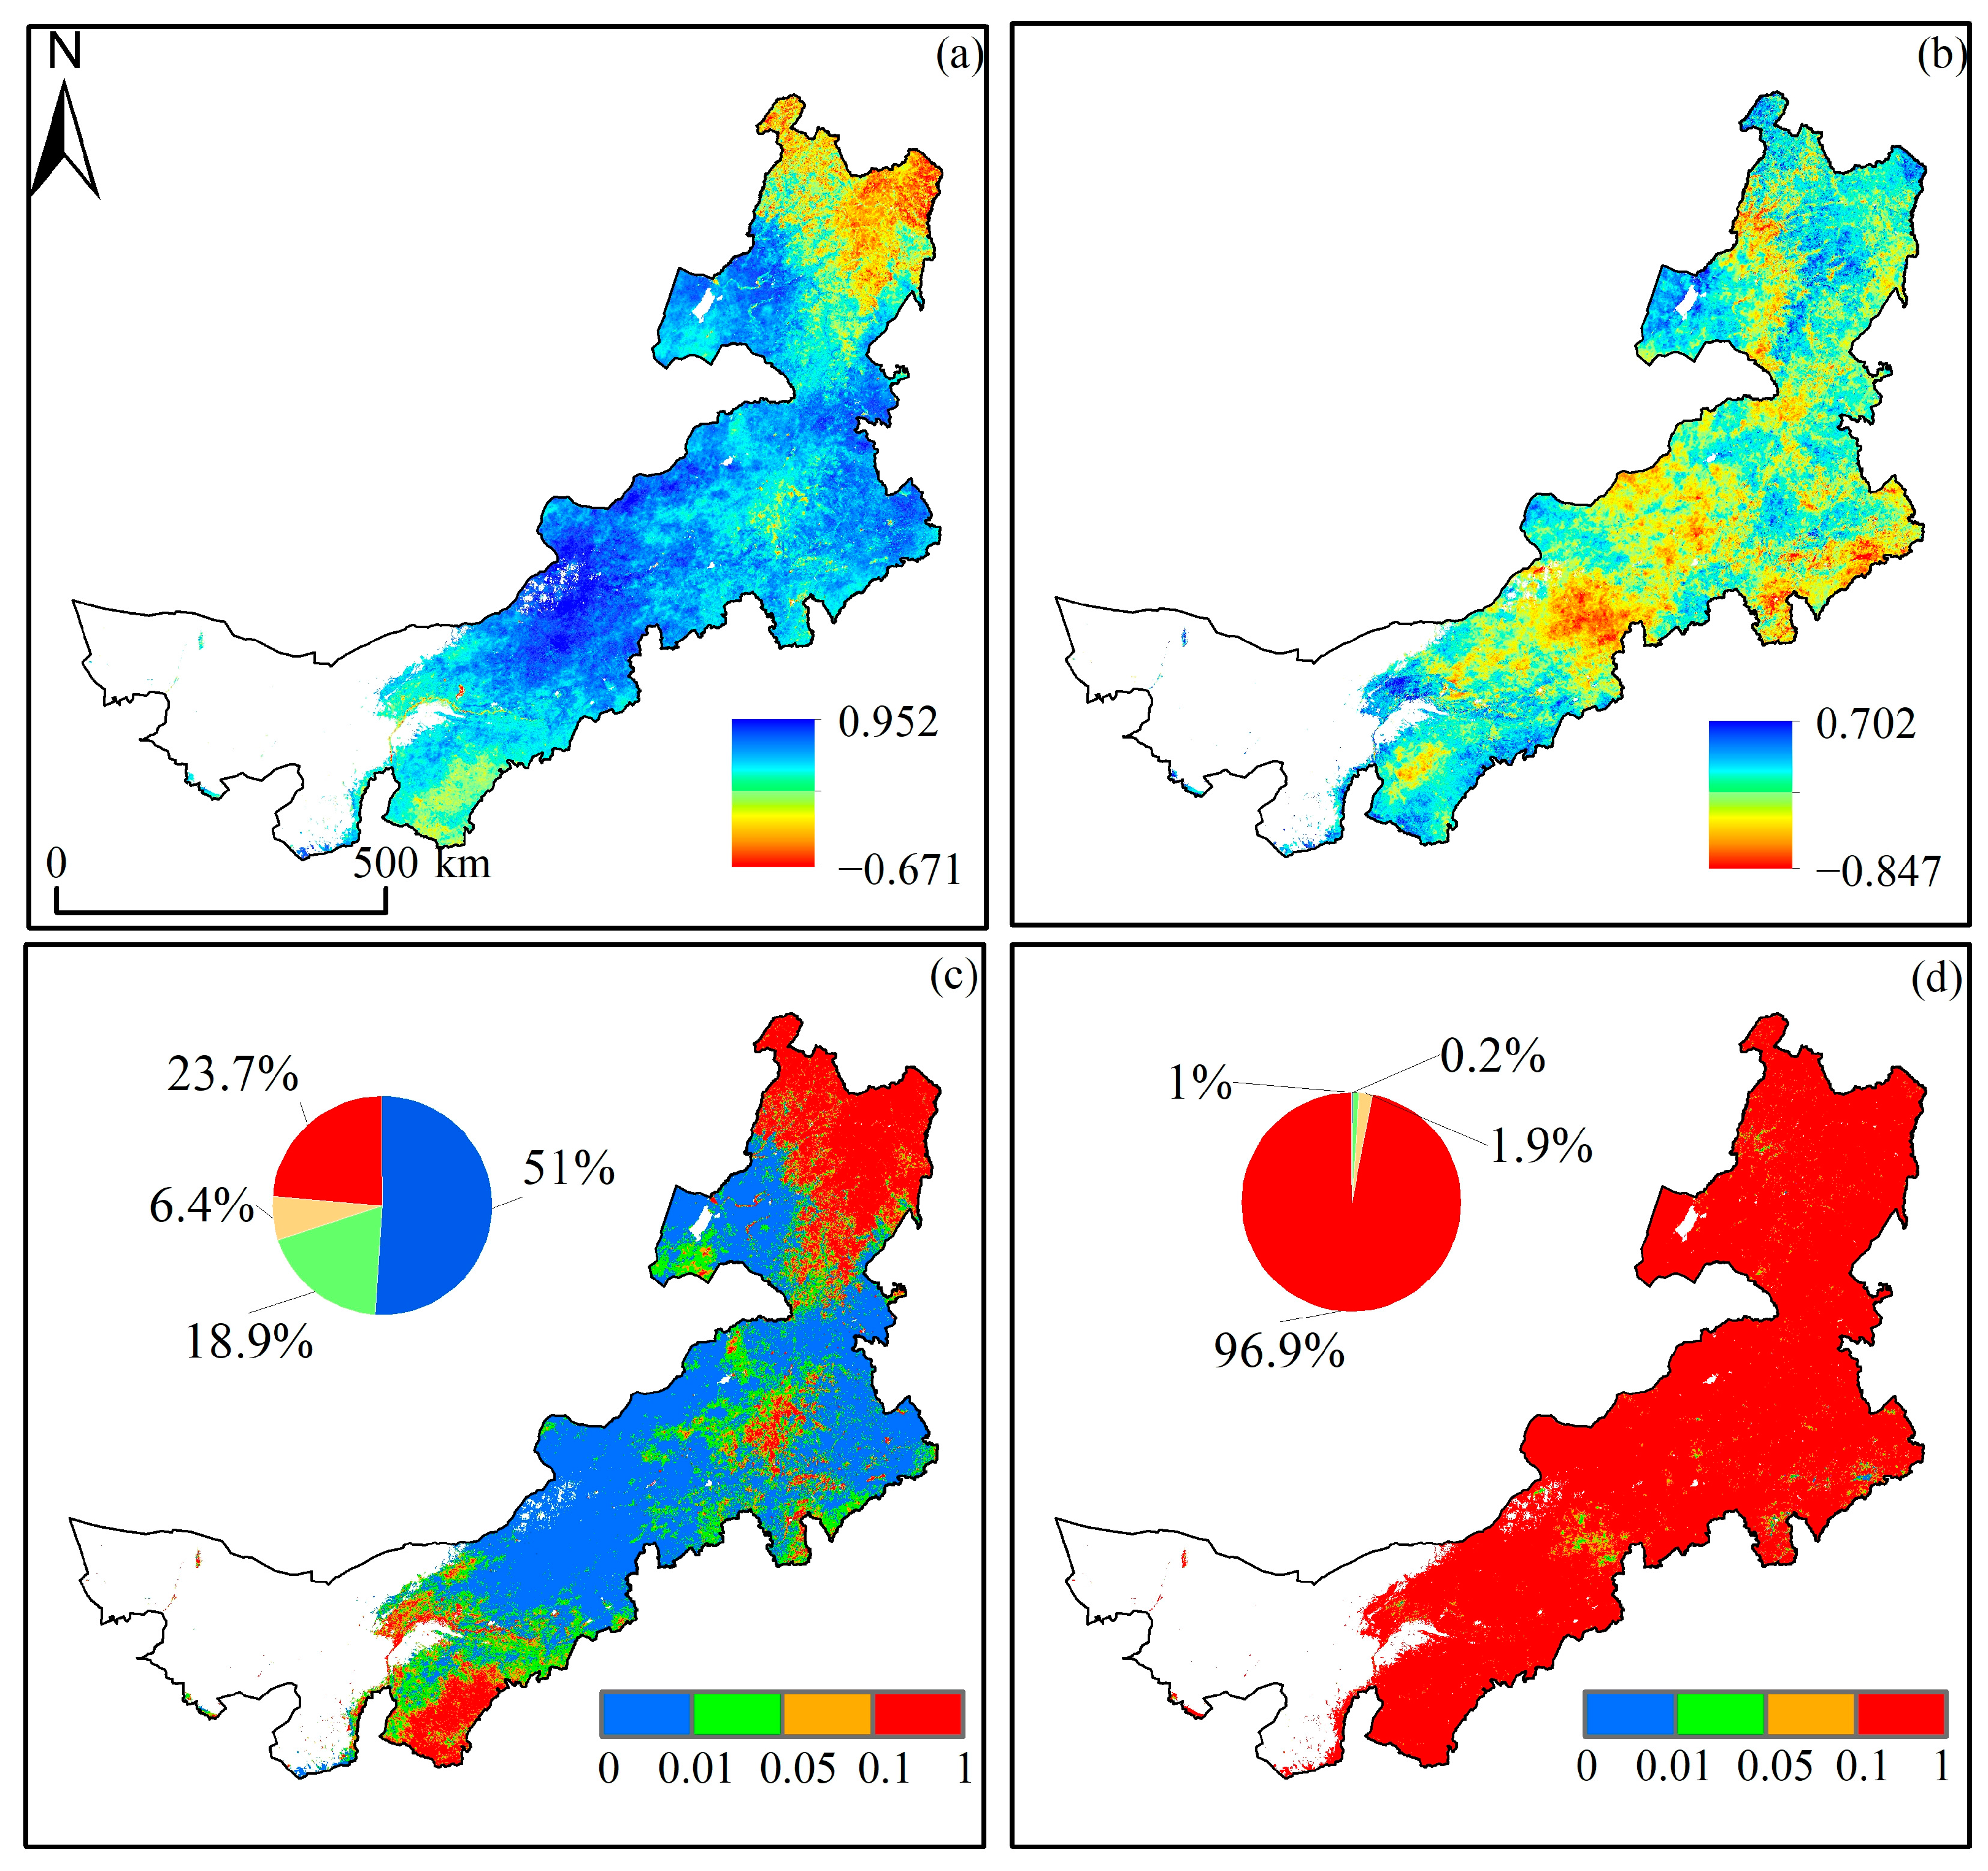
3.1. Spatial Distribution Characteristics and Drought Trends

The distribution of multi-year average ET, PET, NDVI and DSI between 2001 and 2020 showed obvious spatial heterogeneity (Figure 2), with the ET and NDVI exhibiting a spatial mode of low values in the southwest and high in the northeast, PET showing a spatial mode of high values in the southwest and low in the northeast, and DSI showing a distribution characteristic of aridity in the west and wetness in the east. The multi-year average ET fluctuated from 11.99 to 659.06 mm, PET fluctuated from 106.82 to 1947.88 mm, NDVI fluctuated from 0 to 0.92, and DSI fluctuated from −0.24 to 0.27. Specifically, the drought was mainly located at the southern end of the Xilinguole grassland in the Hunsandake Sands; the drought-free area with high ET and low PET values accounted for 36.32% of the whole area, and was largely located in eastern Inner Mongolia, along the Daxinganling Mountains and in the forest–steppe interlacing area; the areas with much vegetation were largely located in the forest zone in the northeast and in the agricultural area of the Hetao Plain.
According to Figure 3, the ET, PET, NDVI and DSI in Inner Mongolia showed little interannual fluctuation during the study period, and from 2001 to 2020 the ET and NDVI in Inner Mongolia exhibited an obvious rising tendency (p < 0.05), with a rising ratio of ET (4.514 mm/a) and NDVI (0.003) in order of magnitude. The PET showed a significant decreasing tendency (p < 0.05); additionally, the decreasing ratio was ET (−3.439 mm/a) and NDVI in order of magnitude. The rate of decrease was ET (−3.439 mm/a), and the magnitudes of R2 were ET (0.781), PET (0.451) and NDVI (0.376), indicating that the fitted lines of ET, PET and NDVI trends were highly reliable. The annual average value of DSI from 2001 to 2020 varied between −0.235 and 0.268, and the overall interannual variation showed a significant upward tendency with a rate of change of 0.06 and an R2 of 0.499, indicating that the fitted line of the trend was more reliable. A higher DSI value indicates increased wetness, thus indicating that the drought situation was alleviated within the study period.
The spatial variability of the ET varied from −9.998 to 23.581 mm·a−1 (Figure 4a) within the region exhibiting a rising tendency reaching 75.42% of the vegetation cover within the study region, and most of the regions (73%) smashed the significance trial (p < 0.05) (Figure 5a); just 24.58% of those regions exhibited a lowering tendency, mainly distributed close to the forest in the northeast and near the Erlianhaote desert. The spatial change rate of the PET varied between −92.398 and 74.668 mm·a−1 (Figure 4b), within which the region exhibited a rising tendency reaching 42.36% of the vegetation cover within the study region, and a small part of the region (17.9%) smashed the significance trial (p < 0.05) (Figure 5b); up to 57.64% of the region showed a lowering tendency, mainly in the study region (Figure 5b), and mainly distributed near the Maowusu Sands in the western study region. The spatial variation rate of the NDVI varied from −0.042 to 0.051 mm·a−1 (Figure 4c), and the increase in NDVI was mainly in the eastern part of Inner Mongolia (eastern Xilinguole League, western Hulunbeier City, eastern Xing’an League, Tongliao City and Chifeng City); the decrease was mainly in the central and western part (western Xilinguole League to eastern Bayannur City and northern Chifeng City). A small proportion (36.9%) of the areas smashed the significance trial (p < 0.05) (Figure 5c). The spatial variation rate of DSI varied from −0.162 to 0.171 (Figure 4d), in which 84.36% of the vegetation cover over the study region exhibited a rising tendency; in addition, most of the areas (72.7%) passed the significance trial (p < 0.05) (Figure 5d), and just 15.64% of the regions exhibited a lowering tendency, mainly in the southwest of the Mawusu Sands, the central grasslands and near the forests in the northeast.

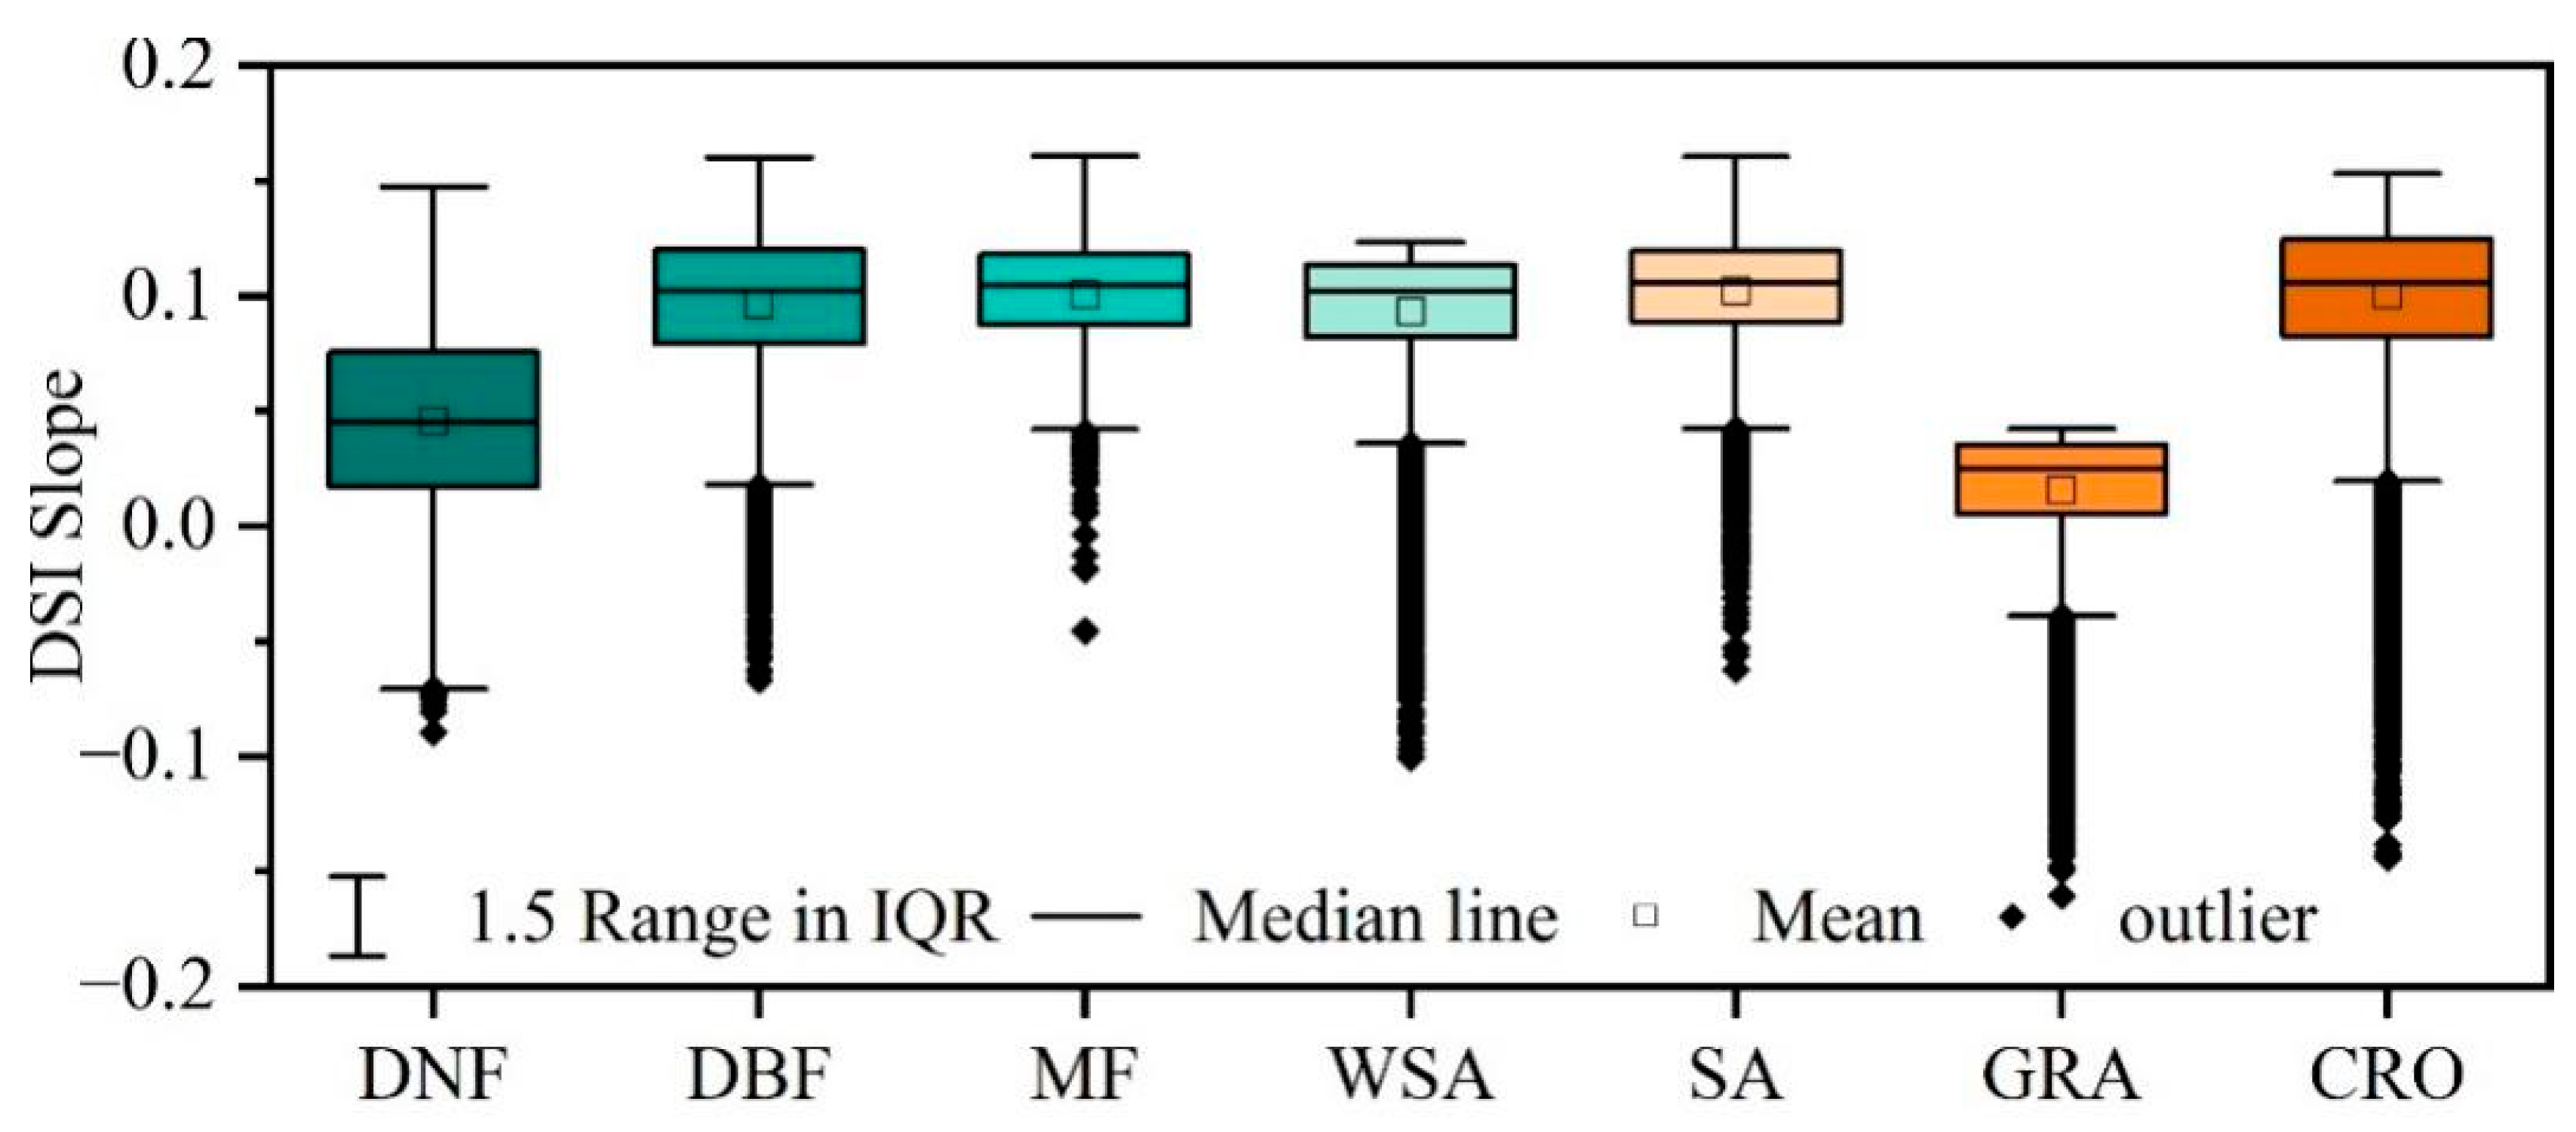
3.2. Effect of Different Vegetation Types on DSI

Different vegetation types directly affect the growth status of vegetation, and similarly different vegetation cover also affects changes in evapotranspiration. We can analyze the effects of the different vegetation utilization types on the changes in the NDVI and ET, which can effectively reveal their effects on DSI, and we can thus analyze their resilience to drought. Among different vegetation utilization types, DBF had the highest NDVI value, 0.869, and GRA had the lowest value, 0.782. GRA had the lowest NDVI value because of the restricted vegetation growth due to the disturbance of human activities; the highest mean ET value was DBF with 482.278 mm, and the lowest was GRA with 244.104 mm. The ET value was higher in broadleaf forests because of the larger leaf area and stronger transpiration (Table 2), while the ET value was lower in GRA because of the sparse vegetation cover and weaker evapotranspiration, coupled with the blocked evapotranspiration from the surface deadfall cover.
Combining the NDVI, ET and drought frequency, DBF had higher NDVI and ET values than other land types and the lowest drought frequency, and therefore broadleaf forest is wetter than other land types; GRA had low vegetation cover and lower NDVI and ET values, and therefore the highest drought frequency, i.e., it is more prone to drought. The ranking of the drought frequency of different land types in the southwest karst region from largest to smallest during the study period was DBF > DNF > MF > WSA > SA > CRO > GRA. In addition, the changes in the DSI all exhibited a rising tendency, with the largest tendency in DBF and the smallest tendency in GRA (Figure 6).

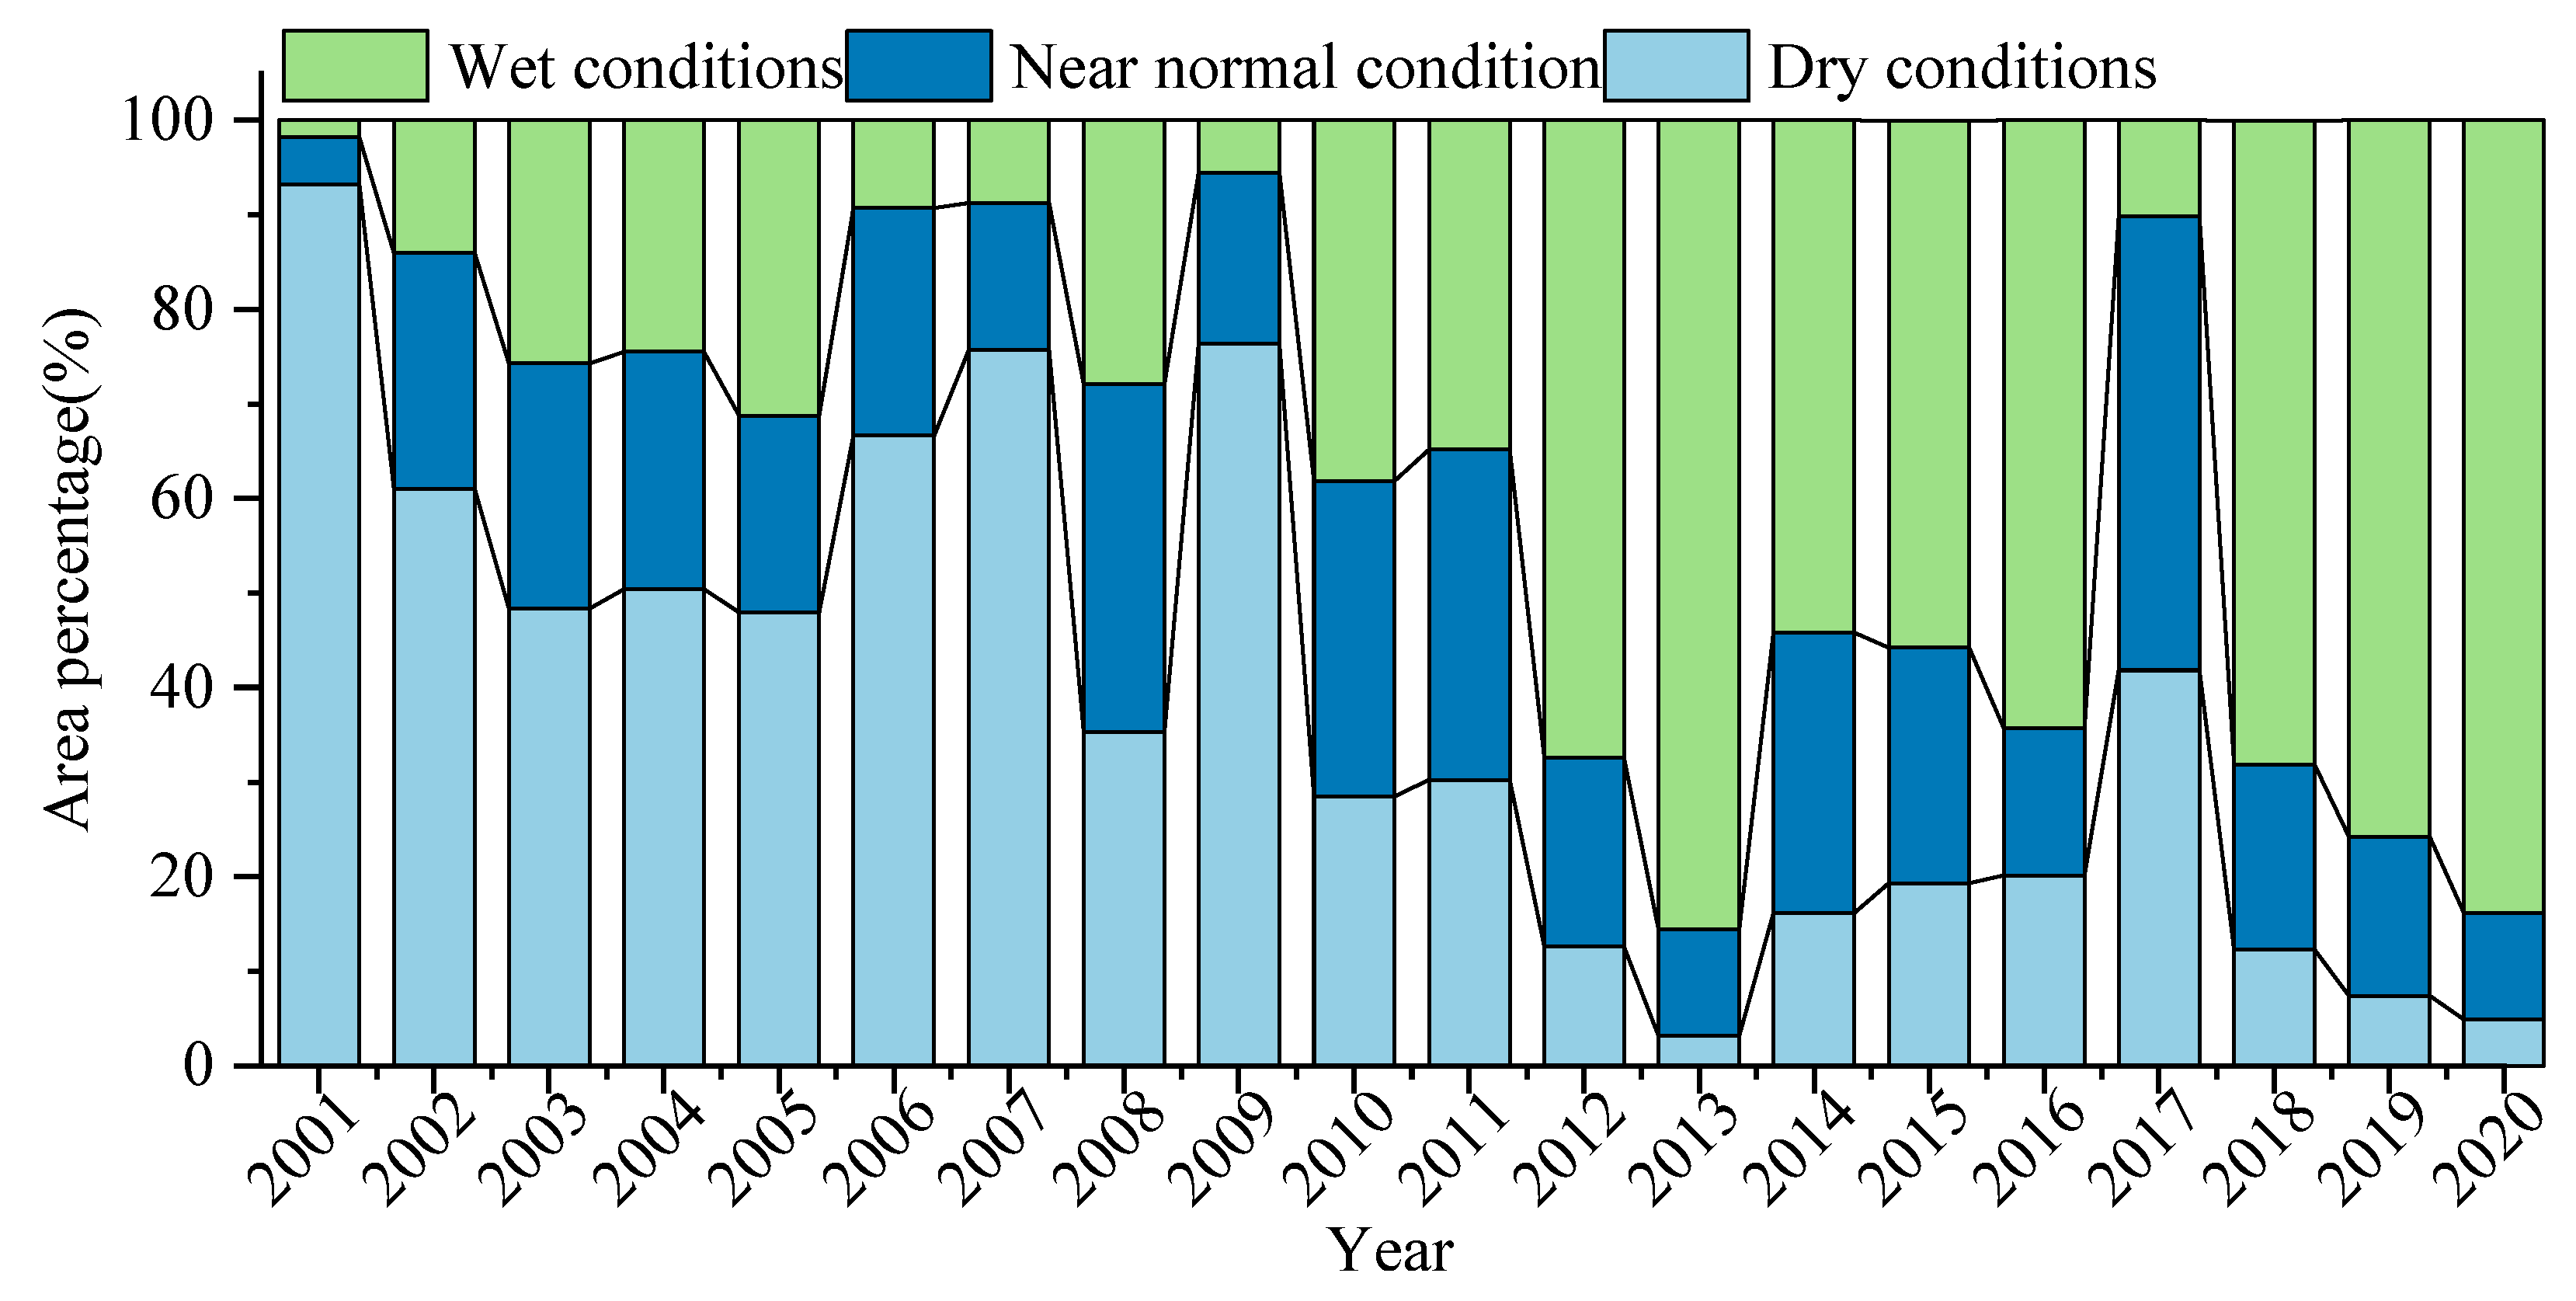
3.3. Area Change in Drought Classification

The consequences of the area variation of the graded drought degree (Figure 7) show that different degrees of drought occurred in Inner Mongolia in the last 20 years, within which the dry region exhibited a lowering tendency (the most obvious year was 2001, reaching 93.23%), the normal area exhibited a lowering tendency (the most obvious year was 2011, reaching 34.95%), and the wet region exhibited a rising tendency (the most obvious year was 2013, with a proportion of 85.57%). In addition, before 2009, Inner Mongolia mainly had drought conditions, after 2009 it was mainly wet, in 2017 the drought and normal area reached the maximum, and after 2017 the whole dry and normal area decreased slightly.

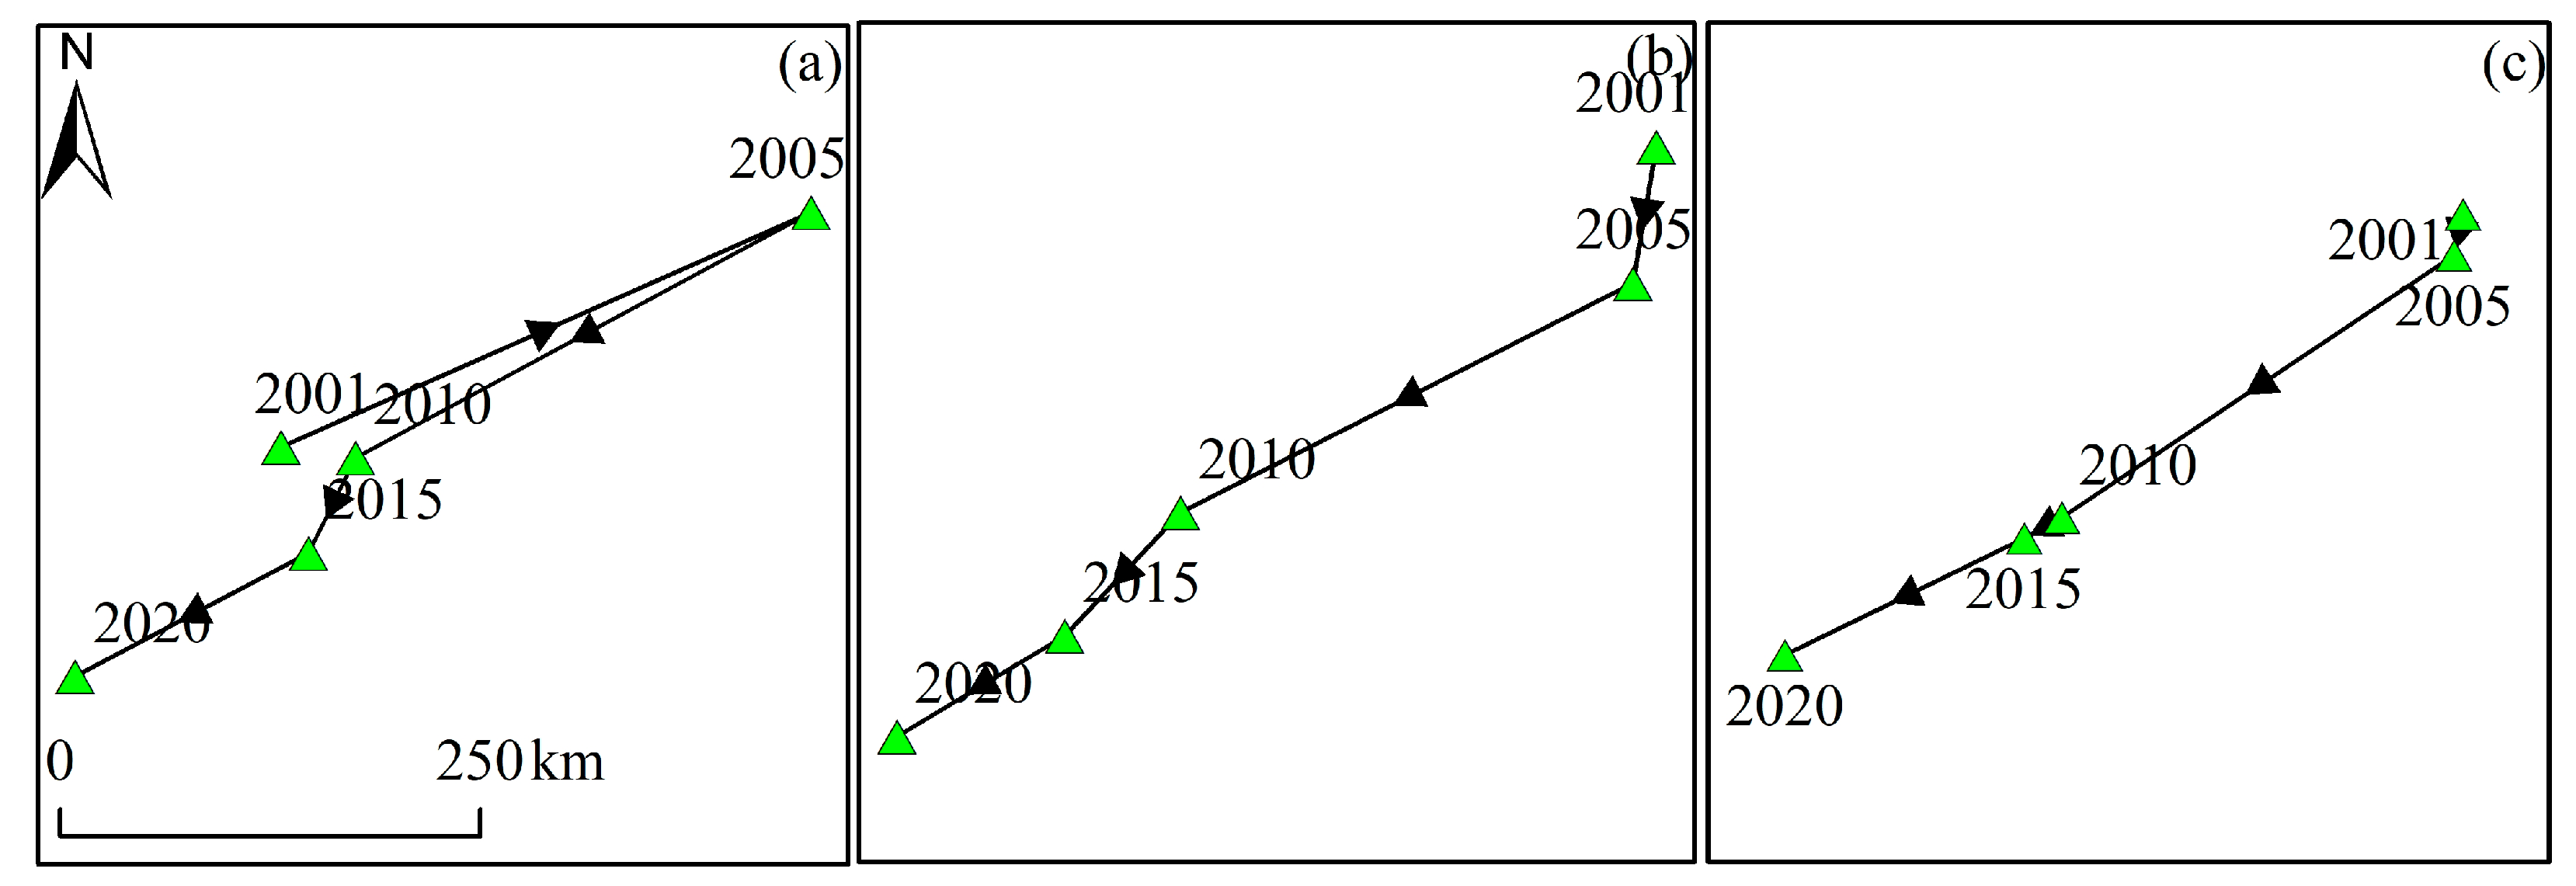
3.4. Drought Center of Gravity Shift Distribution Characteristics

Figure 8 shows the annual average DSI of drought-prone areas in the study area from 2001 to 2020 as weights to calculate the interannual drought center of gravity distribution in Inner Mongolia over the past 20 years. From Figure 8, it can be seen that the drought center of gravity within the study region has changed relatively little in the last 20 years, and the wet center of gravity of the DSI in 2001–2020 mainly moved from position 115.926° N, 45.364° E to 114.567° N, 43.711° E, with a distance of 209.22 km. The center of gravity of the normal DSI mainly shifted from position 120.012° N, 47.473° E to 116.036° N, 44.373° E with a distance of 462.248 km in 2001–2020, and 47.764° E to 112.521° N, 42.894° E, with a distance of 826.812 km.

3.5. Drought Driving Force Analysis

Considering the effects of image element spatial resolution and topographic vertical zoning features, and combining them with previous, related studies, the average annual temperature, average annual rainfall, land use type, population density, elevation, slope and slope direction from 2001 to 2020 were selected as independent variables to analyze the drivers of aridification in Inner Mongolia. The independent variables were classified and visualized using ArcGIS10.6, and then the sampling values of dependent and independent variables within each grid were extracted with each factor for geographic probe analysis, and the degree of explanatory power from each element to the spatial change of aridity in Inner Mongolia was obtained.
As can be seen from Table 3, the aspect and population density did not beat the significance trial (p > 0.05), while all other detection factors passed the significance trial (p < 0.05) and could be used as influencing factors for analyzing the spatial heterogeneity of drought (Table 3). Larger q-values indicated a greater degree of influence on the DSI, and vice versa for smaller ones. The explanatory power from the affecting factors could be ranked as follows: temperature, elevation, slope, rainfall and land use type. Among these, temperature and DEM were the major factors affecting the differences in the spatial distribution of the DSI during the last 20 years (all q-values were greater than 0.45), and the degree of influence of other factors on the DSI was varied. On the basis of comparing the results of one-way detection, the dependent variable DSI of the study area was analyzed using interactive detection with five independent variables that passed the significance test. As can be seen from Table 3, the degree of influence under the two-factor interaction was both bivariate and nonlinearly enhanced, and the strongest interaction of each interaction was with temperature. The interaction mainly revealed that the degree of the influencing factors affecting the drought across Inner Mongolia in the last 20 years was greater than that of any single factor when they acted together. The interaction of temperature and elevation (q value 0.815) had the strongest effect on the DSI, while the interaction of slope and land use category (q value 0.372) had the weakest effect on the DSI. This indicates that each factor directly or indirectly influenced the differences in the spatial distribution of drought under the joint action.
With the aim of further investigating the influence of meteorological factors on the DSI, the relationship between annual average temperature and annual average rainfall and the DSI in the study area from 2001 to 2020 was analyzed. The correlation analysis and significance test results of the DSI and annual precipitation (Figure 9) showed that the DSI was actively linked to the precipitation in most regions during the study period, but a large negative correlation was observed in its northeastern part. The reason for this is that drought is influenced not only by precipitation, but also by topography, vegetation type, human activities and other factors. The statistical consequences illustrated that the area of active correlation between the DSI and precipitation occupied 79.26% of the whole region, while the region of passive relationship was 20.74%. The DSI was mainly positively correlated with temperature, but a large area was passively linked to the north-central area of Inner Mongolia. In insufficiently moist areas, the PET value increased when the temperature rose and there was not enough moisture to give it evaporation, which led to a greater PET–ET spacing and a lower DSI value, i.e., it became dryer earlier. Statistically, the DSI was actively linked to the temperature in 63.25% of the total region, and negatively correlated in 36.75% of the whole region. The percentage of areas that beat the 0.05 significance level test was only 0.2%.

4. Discussion

Due to global warming and enhanced evapotranspiration, the aridification of Inner Mongolia has attracted widespread attention [42,43,44,45]. Since 1998, the ecological environment of Inner Mongolia has been significantly improved, especially by alleviating the degree of summer drought, in order to curb its destruction [46,47,48,49,50,51,52]. However, at the beginning of the implementation of water conservancy projects and the policy of changing farmland to grass, natural elements like the climate and hydrology of the region were not taken into consideration. The drastic change in the land use of the area increased the evaporation of soil in some parts of Inner Mongolia, thus causing an increase in the degree of drought in the land, with the phenomenon of soil desiccation becoming a common concern [53,54,55]. In this paper, by studying the drought, we discovered that the overall performance of the last 20 years tended to show drought mitigation, mainly showing an increasing trend in the west (mainly in the central part of Alashan Union) and a decreasing rate of the DSI in the east, a conclusion in line with the discoveries by Shen et al. [56] but contradictory to the conclusion of Wei et al. [57], who found an increasing drought in the eastern and central parts and a decreasing drought in the west based on the SPI index. Some researchers have focused on the temporal and spatial distribution of drought in China based on weather station data or remote sensing drought indices. According to the Palmer Drought Severity Index, Yan et al. [58] found that an extreme drought event occurred in 2001, and a relatively severe drought also occurred in Inner Mongolia, which was similar to the result shown in Figure 8. The main reason was that the strong La Niña phenomenon occurred in 2000–2001, resulting in abundant precipitation in the south and drought in the north [59]. In addition, Li et al. [60] reported a weakening drought trend in northwestern China based on the increasing trends of the SPI series, and Huang et al. [61] found that the drought in western Inner Mongolia was more severe than that in eastern Inner Mongolia, which was consistent with the results shown in Figure 2. Zhou et al. [62] found that the drought trend in northeast China from 2001 to 2013 showed a downward trend, which was consistent with the results shown in Figure 4. In summary, the spatio-temporal distribution and variation trends of drought in Inner Mongolia are generally consistent with previous national or regional drought monitoring studies, but there may be slight differences in details due to different selections of drought indices.
The reason for this may be, on the one hand, that the use of different drought evaluation indicators, the basis of drought classification of the same indicator and the time period of the study could lead to opposite conclusions. Most of the SPEI indices chosen to dissect spatial and temporal characteristics based on meteorological station information can have difficulty in accurately describing the drought situation on a large regional scale or in areas with few meteorological stations [63,64], while the DSI indices used in this research for the assessment of the drought degree were based upon the indicators established using ET, PET and NDVI, thus making the results different. Therefore, there were differences in the results of different evaluation indicators for monitoring drought in Inner Mongolia. In addition, the study found that the drought levels in the coniferous and mixed coniferous forest cover areas in northern Hulunbeier, Inner Mongolia during 2001–2020 were low; additionally, the extensive conduction of ecological restoration steps may have played an important role. Since the study time period, Inner Mongolia has begun to implement state-owned afforestation, encourage artificial afforestation, return farming and grazing land to forest and grass, close mountains for forestry, and implement the new closure of non-forested and sparsely forested land, and the drought situation of forest and grassland has been alleviated, with the improvement of forest land being particularly obvious [65].
Some scholars have studied the correlation between soil moisture and climate factors and found that an increase in temperature and precipitation promoted an increase in the ET, which led to an increase in the DSI, showing that rising temperature and precipitation had an active effect on drought mitigation, within which the temperature change had a greater impact on the change in drought levels in Inner Mongolia, which was consistent with the conclusion of Wang, Kotani, Tanaka and Ohta [38]. In the context of the development of the climate from warm–dry to warm–wet in Inner Mongolia, the dependence of soil moisture on precipitation decreases. Compared with precipitation, air temperature is more important for soil conditions in the wet zone, and the level of air temperature directly determines the evaporation of water from the soil and the transpiration of plants.
In addition, there is also a close relationship between the degree of drought and extreme weather in Inner Mongolia. Du et al. [66] found that after 2000, the frequency of drought events in four regions of Inner Mongolia, namely Duolun, Xilinhot, Hailar and Shiziwangqi, increased significantly under the condition that the frequency of extreme heat events increased significantly. Those findings demonstrate that the adoption of active and effective ecological protection measures not only possesses some reference worth for controlling and mitigating drought and reducing the risk of natural disaster occurrence in the future, but also has an important scientific significance and strategic value for enhancing the response to ecological risks and geopolitical security in Inner Mongolia in the context of global warming [53]. In this paper, we used the DSI model to monitor the spatial and temporal distribution of drought in Inner Mongolia and compared it with the results of existing studies, which confirmed that the model can achieve good and reliable results. These results can be used as a basis for formulating an ecosystem construction program in Inner Mongolia. However, there are also some limitations. Follow-up studies can use various vegetation drought index models to find the optimal method to analyze the feasibility of the spatial distribution of drought in Inner Mongolia. The use of long-time series remote sensing data for large-scale drought monitoring is characterized by a large volume of data, a large number of repeated calculations and a large number of human factors, which are prone to errors. Future work should be combined with other indicators of drought influencing factors (atmospheric circulation, sea temperature, solar activity, CO2 emissions, etc.) to develop a real-time drought monitoring system based on a variety of drought indices, so as to carry out drought monitoring and early warning in a more rational and dynamic way.

5. Conclusions

On the basis of MODIS data produced between 2001 and 2020, the spatial and temporal variations and features of drought were dissected by calculating the DSI of different time scales and spatial variations. The seven influencing factors of the DSI (temperature, average annual rainfall, land use type, population density, elevation, slope and aspect) were analyzed, and the following conclusions were drawn:
(1)
From 2001 to 2020, the spatial distribution of the DSI in Inner Mongolia was generally characterized by a dry west and a wet east. In addition, the changes in the DSI showed an upward trend.
(2)
Inner Mongolia’s wet, normal and dry centers of gravity showed a migration trend from northeast to southwest, and the migration distances were all over 200 km.
(3)
Temperature and elevation were the main influences driving the formation of aridification in the study area. In addition, four pairs of temperature and elevation, temperature and slope, temperature and land use, and temperature and rainfall combined to drive the formation of aridification in Inner Mongolia.
Since drought is affected by a variety of factors, the establishment of an integrated drought monitoring model should be considered and will become an important direction and development path for solving the complex problems of drought monitoring in the future.

Author Contributions

Methodology, S.W.; Writing—Original draft, X.L.; Writing—Review and editing, Y.W. All authors have read and agreed to the published version of the manuscript.

Funding

This study was jointly funded by the Yinshanbeilu Grassland Eco-Hydrology National Observation and Research Station and the China Institute of Water Resources and Hydropower Research, Beijing 100038, China (YSS202114); Nature Foundation of Inner Mongolia Autonomous Region 2021MS05042; National Natural Science Foundation of China project 51969021, 52169016; Basic Research Funds of China Research Institute of Water Resources and Hydropower (MK2023J07); Inner Mongolia Natural Science Youth Foundation (2023QN05003).

Data Availability Statement

Not applicable.

Acknowledgments

The authors are grateful to the editors and anonymous reviewers for their insightful comments and helpful suggestions.

Conflicts of Interest

The authors declare no conflict of interest.

References

  1. Cheng, G.; Liu, T.; Wang, S.; Wu, Y.; Zhang, C. Responses to the Impact of Drought on Carbon and Water Use Efficiency in Inner Mongolia. Land 2023, 12, 583. [Google Scholar] [CrossRef]
  2. Gang, C.; Wang, Z.; Chen, Y.; Yang, Y.; Li, J.; Cheng, J.; Qi, J.; Odeh, I. Drought-induced dynamics of carbon and water use efficiency of global grasslands from 2000 to 2011. Ecol. Indic. 2016, 67, 788–797. [Google Scholar] [CrossRef]
  3. Yang, S.; Song, S.; Li, F.; Yu, M.; Yu, G.; Zhang, Q.; Cui, H.; Wang, R.; Wu, Y. Vegetation coverage changes driven by a combination of climate change and human activities in Ethiopia, 2003–2018. Ecol. Inform. 2022, 71, 101776. [Google Scholar] [CrossRef]
  4. Chen, Y.; Yang, J.; Xu, Y.; Zhang, W.; Wang, Y.; Wei, J.; Cheng, W. Remote-Sensing Drought Monitoring in Sichuan Province from 2001 to 2020 Based on MODIS Data. Atmosphere 2022, 13, 1970. [Google Scholar] [CrossRef]
  5. Liu, C.; Wang, C.; Li, Y.; Wang, Y. Spatiotemporal differentiation and geographic detection mechanism of ecological security in Chongqing, China. Glob. Ecol. Conserv. 2022, 35, e02072. [Google Scholar] [CrossRef]
  6. He, C.; Shao, H.; Xian, W. Spatiotemporal Variation and Driving Forces Analysis of Eco-System Service Values: A Case Study of Sichuan Province, China. Int. J. Environ. Res. Public Health 2022, 19, 8595. [Google Scholar] [CrossRef] [PubMed]
  7. Ye, C.; Hu, M.; Lu, L.; Dong, Q.; Gu, M. Spatio-temporal evolution and factor explanatory power analysis of urban resilience in the Yangtze River Economic Belt. Geogr. Sustain. 2022, 3, 299–311. [Google Scholar] [CrossRef]
  8. Yang, H.; Hu, D.; Xu, H.; Zhong, X. Assessing the spatiotemporal variation of NPP and its response to driving factors in Anhui province, China. Environ. Sci. Pollut. Res. 2020, 27, 14915–14932. [Google Scholar] [CrossRef]
  9. Liu, X.; Zhu, X.; Pan, Y.; Zhao, A.; Li, Y. Spatiotemporal changes of cold surges in Inner Mongolia between 1960 and 2012. J. Geogr. Sci. 2015, 25, 259–273. [Google Scholar] [CrossRef]
  10. Pan, N.; Guan, Q.; Wang, Q.; Sun, Y.; Li, H.; Ma, Y. Spatial differentiation and driving mechanisms in ecosystem service value of arid region: A case study in the middle and lower reaches of Shule River Basin, NW China. J. Clean. Prod. 2021, 319, 128718. [Google Scholar] [CrossRef]
  11. Ji, B.; Qin, Y.; Zhang, T.; Zhou, X.; Yi, G.; Zhang, M.; Li, M. Analyzing Driving Factors of Drought in Growing Season in the Inner Mongolia Based on Geodetector and GWR Models. Remote Sens. 2022, 14, 6007. [Google Scholar]
  12. Pei, Z.; Fang, S.; Wang, L.; Yang, W. Comparative Analysis of Drought Indicated by the SPI and SPEI at Various Timescales in Inner Mongolia, China. Water 2020, 12, 1925. [Google Scholar] [CrossRef]
  13. Wang, H.; Yao, F.; Zhu, H.; Zhao, Y. Spatiotemporal variation of vegetation coverage and its response to climate factors and human activities in arid and semi-arid areas: Case study of the Otindag Sandy Land in China. Sustainability 2020, 12, 5214. [Google Scholar]
  14. Wu, Z.; Xue, W.; Xu, H.; Yan, D.; Wang, H.; Qi, W. Urban Flood Risk Assessment in Zhengzhou, China, Based on a D-Number-Improved Analytic Hierarchy Process and a Self-Organizing Map Algorithm. Remote Sens. 2022, 14, 4777. [Google Scholar] [CrossRef]
  15. Shi, J.; Shi, P.; Wang, Z.; Wang, L.; Li, Y. Multi-Scenario Simulation and Driving Force Analysis of Ecosystem Service Value in Arid Areas Based on PLUS Model: A Case Study of Jiuquan City, China. Land 2023, 12, 937. [Google Scholar] [CrossRef]
  16. Wen, Y.; Guo, B.; Zang, W.; Lai, J.; Li, R. Quantitative discrimination of the influences of climate change and human activity on rocky desertification based on a novel feature space model. Open Geosci. 2022, 14, 367–381. [Google Scholar] [CrossRef]
  17. Chen, K.; Ge, G.; Bao, G.; Bai, L.; Tong, S.; Bao, Y.; Chao, L. Impact of Extreme Climate on the NDVI of Different Steppe Areas in Inner Mongolia, China. Remote Sens. 2022, 14, 1530. [Google Scholar] [CrossRef]
  18. Zeng, J.; Zhang, R.; Qu, Y.; Bento, V.A.; Zhou, T.; Lin, Y.; Wu, X.; Qi, J.; Shui, W.; Wang, Q. Improving the drought monitoring capability of VHI at the global scale via ensemble indices for various vegetation types from 2001 to 2018. Weather Clim. Extrem. 2022, 35, 100412. [Google Scholar] [CrossRef]
  19. Pham, H.T.; Awange, J.; Kuhn, M.; Nguyen, B.V.; Bui, L.K. Enhancing crop yield prediction utilizing machine learning on satellite-based vegetation health indices. Sensors 2022, 22, 719. [Google Scholar] [CrossRef]
  20. Masroor, M.; Sajjad, H.; Rehman, S.; Singh, R.; Rahaman, M.H.; Sahana, M.; Ahmed, R.; Avtar, R. Analysing the relationship between drought and soil erosion using vegetation health index and RUSLE models in Godavari middle sub-basin, India. Geosci. Front. 2022, 13, 101312. [Google Scholar] [CrossRef]
  21. Abdi, M.J.; Raffar, N.; Zulkafli, Z.; Nurulhuda, K.; Rehan, B.M.; Muharam, F.M.; Khosim, N.A.; Tangang, F. Index-based insurance and hydroclimatic risk management in agriculture: A systematic review of index selection and yield-index modelling methods. Int. J. Disaster Risk Reduct. 2022, 67, 102653. [Google Scholar] [CrossRef]
  22. Li, W.; Wang, Y.; Yang, J. Cloudy Region Drought Index (CRDI) Based on Long-Time-Series Cloud Optical Thickness (COT) and Vegetation Conditions Index (VCI): A Case Study in Guangdong, South Eastern China. Remote Sens. 2020, 12, 3641. [Google Scholar] [CrossRef]
  23. Wei, W.; Pang, S.; Wang, X.; Zhou, L.; Xie, B.; Zhou, J.; Li, C. Temperature Vegetation Precipitation Dryness Index (TVPDI)-based dryness-wetness monitoring in China. Remote Sens. Environ. 2020, 248, 111957. [Google Scholar] [CrossRef]
  24. Shi, S.; Yao, F.; Zhang, J.; Yang, S. Evaluation of temperature vegetation dryness index on drought monitoring over Eurasia. IEEE Access 2020, 8, 30050–30059. [Google Scholar] [CrossRef]
  25. Zhang, J.; Mu, Q.; Huang, J. Assessing the remotely sensed Drought Severity Index for agricultural drought monitoring and impact analysis in North China. Ecol. Indic. 2016, 63, 296–309. [Google Scholar] [CrossRef]
  26. Haroon, M.A.; Zhang, J.; Yao, F. Drought monitoring and performance evaluation of MODIS-based drought severity index (DSI) over Pakistan. Nat. Hazards 2016, 84, 1349–1366. [Google Scholar] [CrossRef]
  27. Carlson, T.N.; Perry, E.M.; Schmugge, T.J. Remote estimation of soil moisture availability and fractional vegetation cover for agricultural fields. Agric. For. Meteorol. 1990, 52, 45–69. [Google Scholar] [CrossRef]
  28. Zormand, S.; Jafari, R.; Koupaei, S.S. Assessment of PDI, MPDI and TVDI drought indices derived from MODIS Aqua/Terra Level 1B data in natural lands. Nat. Hazards 2017, 86, 757–777. [Google Scholar] [CrossRef]
  29. Kang, Y.; Guo, E.-L.; Wang, Y.-F.; Bao, Y.-L.; Bao, Y.-H.; Na, R.-M. Application of temperature vegetation dryness index for drought monitoring in Mongolian Plateau. Ying Yong Sheng Tai Xue Bao J. Appl. Ecol. 2021, 32, 2534–2544. [Google Scholar]
  30. Bhuiyan, C.; Singh, R.P.; Kogan, F.N. Monitoring drought dynamics in the Aravalli region (India) using different indices based on ground and remote sensing data. Int. J. Appl. Earth Obs. Geoinf. 2006, 8, 289–302. [Google Scholar] [CrossRef]
  31. Jackson, R.D.; Idso, S.B.; Reginato, R.J.; Pinter, P.J., Jr. Canopy temperature as a crop water stress indicator. Water Resour. Res. 1981, 17, 1133–1138. [Google Scholar] [CrossRef]
  32. Um, M.-J.; Kim, Y.; Park, D. Evaluation and modification of the drought severity index (DSI) in East Asia. Remote Sens. Environ. 2018, 209, 66–76. [Google Scholar] [CrossRef]
  33. Tong, D.; Bai, Y.; Zhang, S.; Liu, Q.; Yang, J. Applicability of Drought Severity Index(DSI) in Remote Sensing Monitoring of Drought in Shandong Province. Chin. J. Agrometeorol. 2020, 41, 102–112. [Google Scholar]
  34. Huang, J.; Sun, Z.; Du, M. Spatiotemporal characteristics and determinants of agricultural carbon offset rate in China based on the geographic detector. Environ. Sci. Pollut. Res. 2023, 30, 58142–58155. [Google Scholar] [CrossRef] [PubMed]
  35. Guo, Y.; Han, L.; Zhang, D.; Sun, G.; Fan, J.; Ren, X. The Factors Affecting the Quality of the Temperature Vegetation Dryness Index (TVDI) and the Spatial–Temporal Variations in Drought from 2011 to 2020 in Regions Affected by Climate Change. Sustainability 2023, 15, 11350. [Google Scholar] [CrossRef]
  36. Li, J.; Chunyu, X.; Huang, F. Land Use Pattern Changes and the Driving Forces in the Shiyang River Basin from 2000 to 2018. Sustainability 2022, 15, 154. [Google Scholar] [CrossRef]
  37. Li, P.; Hu, Z.; Liu, Y. Shift in the trend of browning in Southwestern Tibetan Plateau in the past two decades. Agric. For. Meteorol. 2020, 287, 107950. [Google Scholar] [CrossRef]
  38. Wang, L.; Kotani, A.; Tanaka, T.; Ohta, T. Assessment of drought condition using remotely sensed drought severity index and its correlations with soil moisture product in Inner Mongolia. Theor. Appl. Climatol. 2020, 141, 715–728. [Google Scholar] [CrossRef]
  39. Vrieling, A.; De Leeuw, J.; Said, M.Y. Length of Growing Period over Africa: Variability and Trends from 30 Years of NDVI Time Series. Remote Sens. 2013, 5, 982–1000. [Google Scholar] [CrossRef]
  40. Duan, H.; Wang, T.; Xue, X.; Yan, C. Dynamic monitoring of aeolian desertification based on multiple indicators in Horqin Sandy Land, China. Sci. Total Environ. 2019, 650, 2374–2388. [Google Scholar] [CrossRef]
  41. Li, J.; Wang, J.; Zhang, J.; Liu, C.; He, S.; Liu, L. Growing-season vegetation coverage patterns and driving factors in the China-Myanmar Economic Corridor based on Google Earth Engine and geographic detector. Ecol. Indic. 2022, 136, 108620. [Google Scholar] [CrossRef]
  42. Bai, Y.; Deng, X.; Cheng, Y.; Hu, Y.; Zhang, L. Exploring regional land use dynamics under shared socioeconomic pathways: A case study in Inner Mongolia, China. Technol. Forecast. Soc. Change 2021, 166, 120606. [Google Scholar] [CrossRef]
  43. Hao, L.; Li, L.; Zhang, B.; Chen, Y. Research on the coupling and coordinated development of forest economic and ecological environment systems in Heilongjiang Province. Sustain. For. 2022, 5, 28–38. [Google Scholar] [CrossRef]
  44. Tong, S.; Zhang, J.; Bao, Y.; Wurina; Terigele; Weilisi; Lianxiao. Spatial and temporal variations of vegetation cover and the relationships with climate factors in Inner Mongolia based on GIMMS NDVI3g data. J. Arid Land 2017, 9, 394–407. [Google Scholar] [CrossRef]
  45. Ma, Z.-C.; Sun, P.; Zhang, Q.; Hu, Y.-Q.; Jiang, W. Characterization and Evaluation of MODIS-Derived Crop Water Stress Index (CWSI) for Monitoring Drought from 2001 to 2017 over Inner Mongolia. Sustainability 2021, 13, 916. [Google Scholar] [CrossRef]
  46. Gao, J.; Jiang, Y.; Wang, H.; Zuo, L. Identification of dominant factors affecting soil erosion and water yield within ecological red line areas. Remote Sens. 2020, 12, 399. [Google Scholar] [CrossRef]
  47. Liu, W.; Ma, S.; Feng, K.; Gong, Y.; Liang, L.; Tsubo, M. The Suitability Assessment of Agricultural Drought Monitoring Indices: A Case Study in Inland River Basin. Agronomy 2023, 13, 469. [Google Scholar] [CrossRef]
  48. Meng, F.; Guo, J.; Guo, Z.; Lee, J.C.K.; Liu, G.; Wang, N. Urban ecological transition: The practice of ecological civilization construction in China. Sci. Total Environ. 2021, 755, 142633. [Google Scholar] [CrossRef]
  49. Shen, Y.; Ren, Y. Construction and evaluation of a system to measure the coordinated development of the ecological environment and the economy of the construction industry. Environ. Sci. Pollut. Res. 2022, 29, 12648–12660. [Google Scholar] [CrossRef]
  50. Feng, S.; Liu, X.; Zhao, W.; Yao, Y.; Zhou, A.; Liu, X.; Pereira, P. Key areas of ecological restoration in Inner Mongolia based on ecosystem vulnerability and ecosystem service. Remote Sens. 2022, 14, 2729. [Google Scholar] [CrossRef]
  51. Zhang, X.; Xu, D.; Wang, Z.; Zhang, Y. Balance of water supply and consumption during ecological restoration in arid regions of Inner Mongolia, China. J. Arid Environ. 2021, 186, 104406. [Google Scholar] [CrossRef]
  52. Zhang, F.; Nilsson, C.; Xu, Z.; Zhou, G. Evaluation of restoration approaches on the Inner Mongolian Steppe based on criteria of the Society for Ecological Restoration. Land Degrad. Dev. 2020, 31, 285–296. [Google Scholar] [CrossRef]
  53. Kou, X.; Li, J.; Liu, H.; Li, B.; Yu, X.; Cao, X.; Liu, D.; Wen, L.; Zhuo, Y.; Wang, L. Characteristics of bacterial biodiversity and community structure in non-rhizosphere soils along zonal distribution of plants within littoral wetlands in inner Mongolia, China. Glob. Ecol. Conserv. 2020, 24, e01310. [Google Scholar] [CrossRef]
  54. Wang, Q.; Liu, X.; Wang, Z.; Zhao, L.; Zhang, Q.-P. Time scale selection and periodicity analysis of grassland drought monitoring index in Inner Mongolia. Glob. Ecol. Conserv. 2022, 36, e02138. [Google Scholar] [CrossRef]
  55. Yu, D.; Li, Y.; Yin, B.; Wu, N.; Ye, R.; Liu, G. Spatiotemporal variation of net primary productivity and its response to drought in Inner Mongolian desert steppe. Glob. Ecol. Conserv. 2022, 33, e01991. [Google Scholar] [CrossRef]
  56. Shen, Z.; Zhang, Q.; Singh, V.P.; Sun, P.; Song, C.; Yu, H. Agricultural drought monitoring across Inner Mongolia, China: Model development, spatiotemporal patterns and impacts. J. Hydrol. 2019, 571, 793–804. [Google Scholar] [CrossRef]
  57. Wei, Y.; Zhu, L.; Chen, Y.; Cao, X.; Yu, H. Spatiotemporal Variations in Drought and Vegetation Response in Inner Mongolia from 1982 to 2019. Remote Sens. 2022, 14, 3803. [Google Scholar] [CrossRef]
  58. Yan, H.; Wang, S.-Q.; Wang, J.-B.; Lu, H.-Q.; Guo, A.-H.; Zhu, Z.-C.; Myneni, R.B.; Shugart, H.H. Assessing spatiotemporal variation of drought in China and its impact on agriculture during 1982–2011 by using PDSI indices and agriculture drought survey data. J. Geophys. Res. Atmos. 2016, 121, 2283–2298. [Google Scholar] [CrossRef]
  59. Li, Y.; Strapasson, A.; Rojas, O. Assessment of El Niño and La Niña impacts on China: Enhancing the Early Warning System on Food and Agriculture. Weather Clim. Extrem. 2020, 27, 100208. [Google Scholar] [CrossRef]
  60. Li, H.; Hou, E.; Deng, J. Spatio-Temporal Differentiation Characteristic and Evolution Process of Meteorological Drought in Northwest China From 1960 to 2018. Front. Earth Sci. 2022, 10, 857953. [Google Scholar] [CrossRef]
  61. Song, X.; Li, L.; Fu, G.; Li, J.; Zhang, A.; Liu, W.; Zhang, K. Spatial–temporal variations of spring drought based on spring-composite index values for the Songnen Plain, Northeast China. Theor. Appl. Climatol. 2014, 116, 371–384. [Google Scholar] [CrossRef]
  62. Zhou, L.; Wu, J.; Mo, X.; Zhou, H.; Diao, C.; Wang, Q.; Chen, Y.; Zhang, F. Quantitative and detailed spatiotemporal patterns of drought in China during 2001–2013. Sci. Total Environ. 2017, 589, 136–145. [Google Scholar] [CrossRef]
  63. Tong, S.; Lai, Q.; Zhang, J.; Bao, Y.; Lusi, A.; Ma, Q.; Li, X.; Zhang, F. Spatiotemporal drought variability on the Mongolian Plateau from 1980–2014 based on the SPEI-PM, intensity analysis and Hurst exponent. Sci. Total Environ. 2018, 615, 1557–1565. [Google Scholar] [CrossRef] [PubMed]
  64. Tong, S.; Bao, G.; Bao, Y.; Huang, X. Monitoring of long-term vegetation dynamics and responses to droughts of various timescales in Inner Mongolia. Ecosphere 2023, 14, e4415. [Google Scholar] [CrossRef]
  65. Wang, C.; Chen, J.; Chen, X.; Chen, J. Identification of concealed faults in a grassland area in Inner Mongolia, China, using the temperature vegetation dryness index. J. Earth Sci. 2019, 30, 853–860. [Google Scholar] [CrossRef]
  66. Du, W.; Guo, E.; Wang, A.; Tong, Z.; Liu, X.; Zhang, J.; Guna, A. Spatiotemporal variation in precipitation concentration and its potential relationship with drought under different scenarios in Inner Mongolia, China. Int. J. Climatol. 2022, 42, 7648–7667. [Google Scholar] [CrossRef]
Figure 1. Geographical location of the study area: (a) digital elevation model, (b) distribution of vegetation categories and meteorological stations.
Forests 14 01679 g001
Figure 2. Spatial distribution of annual mean parameters between 2001 and 2020. (a) ET, (b) PET, (c) NDVI and (d) DSI.
Forests 14 01679 g002
Figure 3. Annual average parameters of interannual (a) ET, (b) PET, (c) NDVI and (d) DSI (the time series in the figure have all passed the MK test, where p < 0.01 means passing the test very significantly and p < 0.05 means passing the test significantly).
Forests 14 01679 g003
Figure 4. Spatial trends of annual mean parameters from 2001 to 2020. (a) ET, (b) PET, (c) NDVI and (d) DSI.
Forests 14 01679 g004
Figure 5. Spatially significant trends of annual mean parameters from 2001 to 2020. (a) ET, (b) PET, (c) NDVI and (d) DSI.
Forests 14 01679 g005
Figure 6. Significance trend statistics of different vegetation types.
Forests 14 01679 g006
Figure 7. Percentage variation of wet, near-normal and dry area between 2001 and 2020.
Forests 14 01679 g007
Figure 8. Characteristics of wet, normal and drought weight shift distribution in Inner Mongolia: (ac) is the spatial distribution of wetness, normal gravity shift and drought gravity shift during different time periods during 2001–2005, 2005–2010, 2010–2015 and 2015–2020. (Black triangles represent the direction of the transfer, and green triangles represent the year).
Forests 14 01679 g008
Figure 9. Correlations of DSI with climate factors: (a) correlation of DSI with precipitation, (b) correlation of DSI with temperature, (c) significance of DSI with precipitation and (d) significance of DSI with temperature.
Forests 14 01679 g009
Table 1. The categories for drought circumstances for the DSIs all over the world.
CategoryGradeDSI
1Extreme drought<−1.5
2Severe drought−1.49 to −1.2
3Moderate drought−1.19 to −0.9
4Mild drought−0.89 to −0.6
5Incipient drought−0.59 to −0.3
6Near normal−0.29 to 0.29
7Incipient wet0.3 to 0.59
8Slightly wet0.6 to 0.89
9Moderately wet0.9 to 1.19
10Very wet1.2 to 1.5
11Extremely wet>1.5
Table 2. Statistical table of the mean values of ET and NDVI of different vegetation types.
TypeET/mmPET/mmNDVITMP/°CPRE/mmDrought Frequency/%
DNF362.348749.7370.869−3.611453.3380.337
DBF482.278921.2540.892−1.398455.7870.332
MF400.104829.2420.885−2.842482.1120.338
WSA409.665839.4590.864−2.419478.6620.354
SA478.252932.3480.868−0.355471.4040.358
GRA244.1041288.2290.4824.245304.9070.372
CRO370.6471149.1350.7933.411403.8290.363
Table 3. Single factor and multi-factor interactive detection results.
Impact FactorsTemperaturePrecipitationSlopeElevationLand Use Type
Temperature0.6120.6840.7360.8150.687
Precipitation-0.2730.3980.5730.463
Slope--0.2830.5020.372
Elevation---0.4940.598
Land use type----0.059
Note: Bold is the g-value of each factor; additionally, the rest are g-values of interactions between factors.
Disclaimer/Publisher’s Note: The statements, opinions and data contained in all publications are solely those of the individual author(s) and contributor(s) and not of MDPI and/or the editor(s). MDPI and/or the editor(s) disclaim responsibility for any injury to people or property resulting from any ideas, methods, instructions or products referred to in the content.

