Article

Distribution of Genes and Microbial Taxa Related to Soil Phosphorus Cycling across Soil Depths in Subtropical Forests

1
Faculty of Life Science and Technology, Central South University of Forestry and Technology, No. 498 Southern Shaoshan Road, Changsha 410004, China
2
Hunan Botanical Garden, Changsha 410116, China
3
Huitong National Station for Scientific Observation and Research of Chinese Fir Plantation Ecosystem in Hunan Province, Huitong, Huaihua 438107, China
4
Faculty of Agriculture and Forestry Technology, Hunan Applied Technology University, Changde 415000, China
*
Author to whom correspondence should be addressed.
Forests 2023, 14(8), 1665; https://doi.org/10.3390/f14081665
Submission received: 28 June 2023 / Revised: 3 August 2023 / Accepted: 16 August 2023 / Published: 17 August 2023
(This article belongs to the Special Issue Application of Microbes in Landscape Restoration)

Abstract

:
Although many studies have focused on the roles of soil microbes in phosphorus (P) cycling, little is known about the distribution of microbial P cycling genes across soil depths. In this study, metagenomic sequencing was adopted to examine the differences in the abundance of genes and microbial taxa associated with soil P cycling between organic and mineral soil in subtropical forests. The total relative abundance of inorganic P solubilizing genes was the highest, that of P starvation response regulating genes was second, and organic P mineralizing genes was the lowest. The soil organic carbon concentration, N:P ratio, and available P concentration were higher in the organic soil than the mineral soil, resulting in abundances of organic P mineralizing genes (appA and 3-phytase), and inorganic P cycling genes (ppa), whereas those of the inorganic P cycling genes (gcd and pqqC) and the P starvation response regulating gene (phoR) were higher in mineral soil. The four bacteria phyla that related to P cycling, Proteobacteria, Actinobacteria, Bacteroidetes, and Candidatus_Eremiobacteraeota were higher in organic soil; conversely, the three bacteria phyla (Acidobacteria, Verrucomicrobia, and Chloroflexi) and archaea taxa were more abundant in mineral soil. Therefore, we concluded that the distribution of genes and microbial taxa involved in soil P cycling differed among soil depths, providing a depth-resolved scale insight into the underlying mechanisms of P cycling by soil microorganisms in subtropical forests.

1. Introduction

Phosphorus (P) is the key limitation nutrient for tree growth in subtropical forests [1]. Although total soil P content may be sufficient [2], only small quantities of inorganic P—namely orthophosphate (H2PO4 and HPO42−) ions—can be directly absorbed by plant roots [3]. The dominant soil P pools, including low-solubility inorganic and highly complex organic P forms, can be transformed into orthophosphates by physical chemical reactions (i.e., dissolution and desorption) and biological activities (i.e., mineralization). Soil microbes play an essential role in regulating P cycling and available P concentration [4]. Furthermore, natural forest ecosystems are more severely P-limited than cropland ecosystems [5], highlighting the importance of the soil microbial regulation of P cycling in forest ecosystems. Three microbial gene groups, including (1) inorganic P solubilizing and organic P mineralizing genes, (2) P uptake and transport genes, and (3) P starvation response regulating genes, are associated with soil P cycling processes [6].
Soil depths determine changes in soil structure, nutrient quantity, and availability, leading to a variation in soil microbial diversity, community composition, and functional profiles [7]. However, most studies have concentrated on the P cycling-related microbial taxa and functional genes through metagenome and genome mining only at the surface soil level [8,9], which will mask finer-scale (i.e., surface soil vs. deeper soil) differences [10]. Moreover, surface soil may be more affected by plant litter while deeper soil may be more influenced by root exudation [11], resulting in differences in microbial communities and functions between soil depths. Therefore, it is necessary to systematically understand the distribution of P cycling genes and microbial community changes at depth-resolved scales (i.e., separating the different soil layers).
In this study, we tried to elucidate the differences in the genes and microbial taxa associated with soil P cycling across soil depths through metagenomic mining in subtropical forests. As we all know, the organic P content accounts for total P decreases with soil depth in forest ecosystems, whereas that of inorganic P increases [12]. Therefore, compared to deeper soil, we hypothesized that surface soil has a higher potential to mineralize organic P. In addition, total soil P concentration and availability are often lower in deeper soil [13], indicating that P starvation increases with soil depth. It is reasonable to deduce that the P starvation response regulating genes contained in the soil microorganisms would be more abundant in deeper soil. Furthermore, soil microbial taxonomic composition determines their potential function in P cycling [14]. Compared with the better studied and understood function of bacteria in P cycling, that of archaea and fungi is far from certain [6,9]. For instance, most of the identified P-solubilizing microorganisms are bacteria species [15]. However, the potential capacity of microorganisms to cope with P deficiency by relying on their taxonomy composition remains unclear. Therefore, we also aimed to investigate the soil P cycling genes harboring taxa of archaea, bacteria, and fungi among surface soil and deeper soil.

2. Materials and Methods

2.1. Site Description

This study was conducted in Dashanchong Forest Park (28°23′58″–28°24′58″ N, 113°17′46″–113°19′08″ E) in Changsha County, Hunan Province, China. A hilly topography with an altitude of 55−217 m a.s.l. has been characterized in the park. The area has a humid mid-subtropical monsoonal climate with a mean annual precipitation of 1416 mm and mean monthly temperatures ranging from −10.3 to 39.8 °C. The soil is well-drained clay loam that developed from slate and shale parent rock and is classified as Ferralsols [16], which is very shallow [17].
This study operated in two typical secondary forests: (1) Pinus massonianaLithocarpus glaber coniferous and evergreen broadleaved mixed forest (PLF), and (2) L. glaberQuercus glauca evergreen broadleaved forest (LGF). These two forests are approximately 70 years old. There are almost no herbs and very sparse shrubs and saplings due to the closed canopy. A 200 m wide valley separates the PLF (28°24′36″ N, 113°18′12″ E) and LGF (28°24′32″ N, 113°18′18″ E). The environmental factors (e.g., elevation, soil moisture, pH, and nutrient availability) differed between PLF and LGF [18]. Four plots with 30 m × 30 m area were established in each forest. The species, diameter at breast height, and height of all trees were identified and recorded. The stand characteristics were detailed in the work of Ouyang et al. [19] and Table S1.

2.2. Soil Samples Collection

In June 2022, we randomly sampled seven soil cores (10 cm in internal diameter and 20 cm in depth) in the central 10 m × 10 m area of each plot. Depending on the soil color, every soil core was separated into two soil depths: a surface layer (brownish-black color; organic soil) and a deeper layer (brownish-yellow color; mineral soil). The soils at the same layer were mixed thoroughly, and about 500 g of mixed soil was collected for each sample. A total of 16 soil samples were obtained. The stones and roots of each sample were removed by a 2 mm mesh and then divided into three subsamples: one for measuring soil moisture; one for determining soil pH and the concentrations of soil organic carbon (SOC), total P (TP) and nitrogen (TN), inorganic nitrogen (NH4+-N and NO3-N), and available soil P (AP); and one for metagenomic sequencing.

2.3. Soil Chemical and Physical Analysis

Soil TP concentration was measured using the Mo-Sb colorimetric method [20]. Soil AP concentration was quantified using a solution of 0.05 M HCl and 0.025 M H2SO4 [21]. The SOC concentration was measured using the K2Cr2O7-H2SO4 oxidation method. Soil TN concentration was measured using the Kjeldahl method. The inorganic N was extracted using 0.5 M K2SO4 solution, and then measured the NH4+-N and NO3-N concentrations of the filtered extract by a flow injection analyzer (FIAstar 5000, FOSS, Höganäs, Sweden). Soil moisture was quantified by drying the samples at 105 °C to constant weight. Soil pH was determined at a soil-to-water ratio of 1:2.5 by using an FE20 pH meter (Mettler Toledo Instrument Co., Ltd., Shanghai, China). Soil properties are presented in Table 1.

2.4. DNA Extraction and Metagenomic Sequencing

Total genomic DNA was extracted from ~0.5 g of fresh soil using the E.Z.N.A.® Soil DNA Kit (Omega Bio-tek, Norcross, GA, USA). Metagenomic libraries were size-selected to fragment lengths of about 400 bp using Covaris M220 (Gene Company Limited, Shanghai, China) and NEXTFLEX® Rapid DNA-Seq (Bioo Scientific, Austin, TX, USA). In total, 16 metagenomic DNA libraries were constructed. The size-selected libraries were sequenced on the Illumina NovaSeq platform (Illumina Inc., San Diego, CA, USA) with paired-end mode (2 × 150 bp).

2.5. Metagenomics Analysis

The adaptors of sequenced reads were trimmed. Reads with lengths shorter than 50 bp or quality value lower than 20 or containing N bases were removed using fastp software (v0.20.0) [22]. Metagenomics data were assembled by MEGAHIT software (v1.1.2) [23] using succinct de Bruijn graphs. The final assembled contigs with lengths ≥300 bp were selected, and their open reading frames were predicted by MetaGene [24]. The predicted open reading frames with lengths of 100 bp or more were retrieved and translated into amino acid sequences through NCBI. A non-redundant gene catalogue was constructed using CD-HIT [25] with 90% sequence identity and 90% coverage. After quality control, reads were mapped to the non-redundant gene catalog with 95% identity using SOAP aligner [26], and gene abundance was evaluated for each sample. Overall, a total of ~0.77 billion high-quality reads were produced, ranging from 41.24 to 55.99 million reads per sample.
Representative sequences of the non-redundant gene catalogue were aligned to the NCBI NR database with an e-value cutoff of 1 × 10⁻⁵ using Diamond [27] for taxonomic annotations. The KEGG annotation was conducted using Diamond against the Kyoto Encyclopedia of Genes and Genomes database with an e-value cutoff of 1 × 10⁻⁵. The abundance of a taxonomic group was calculated by summing the abundance of genes annotated to a feature. Relative gene abundances (%) were normalized to the annotated read number across all samples for subsequent analysis. In this study, 27 functional genes (Table S2) related to organic P mineralization, inorganic P solubilization, and P starvation response regulation were selected for further investigation.

2.6. Statistical Analysis

The statistical analyses were conducted by R software (version 4.2.2) and on the Majorbio Cloud Platform. The variations in the gene composition and associated microbial taxa for P transformation between samples were evaluated by ANOSIM with the “vegan” R package [28], and then displayed by nonmetric multidimensional scaling plots (NMDS) via the Bray–Curtis dissimilarity matrix. Significant differences in the relative abundance of P cycling genes between organic and mineral soil were quantified by one-way analysis of variance (ANOVA). Circus has developed to quantify the corresponding relationships between soil microbial taxonomic groups involved in P cycling and samples using Circos-0.67-7 software (http://circos.ca/), and phyla with an abundance of <0.01 were merged with others. Species and functional contribution analysis were performed for the major phyla of archaea (Candidatus_Bathyarchaeota, Candidatus_Thermoplasmatota, Euryarchaeota, Thaumarchaeota), bacteria (Acidobacteria, Actinobacteria, Bacteroidetes, Candidatus_Eremiobacteraeota, Chloroflexi, Gemmatimonadetes, Planctomycetes, Proteobacteria, Verrucomicrobia), and fungi (Ascomycota, Basidiomycota). The key genes associated with soil P cycling to determine the available soil P were identified using random forest analysis [29].

3. Results

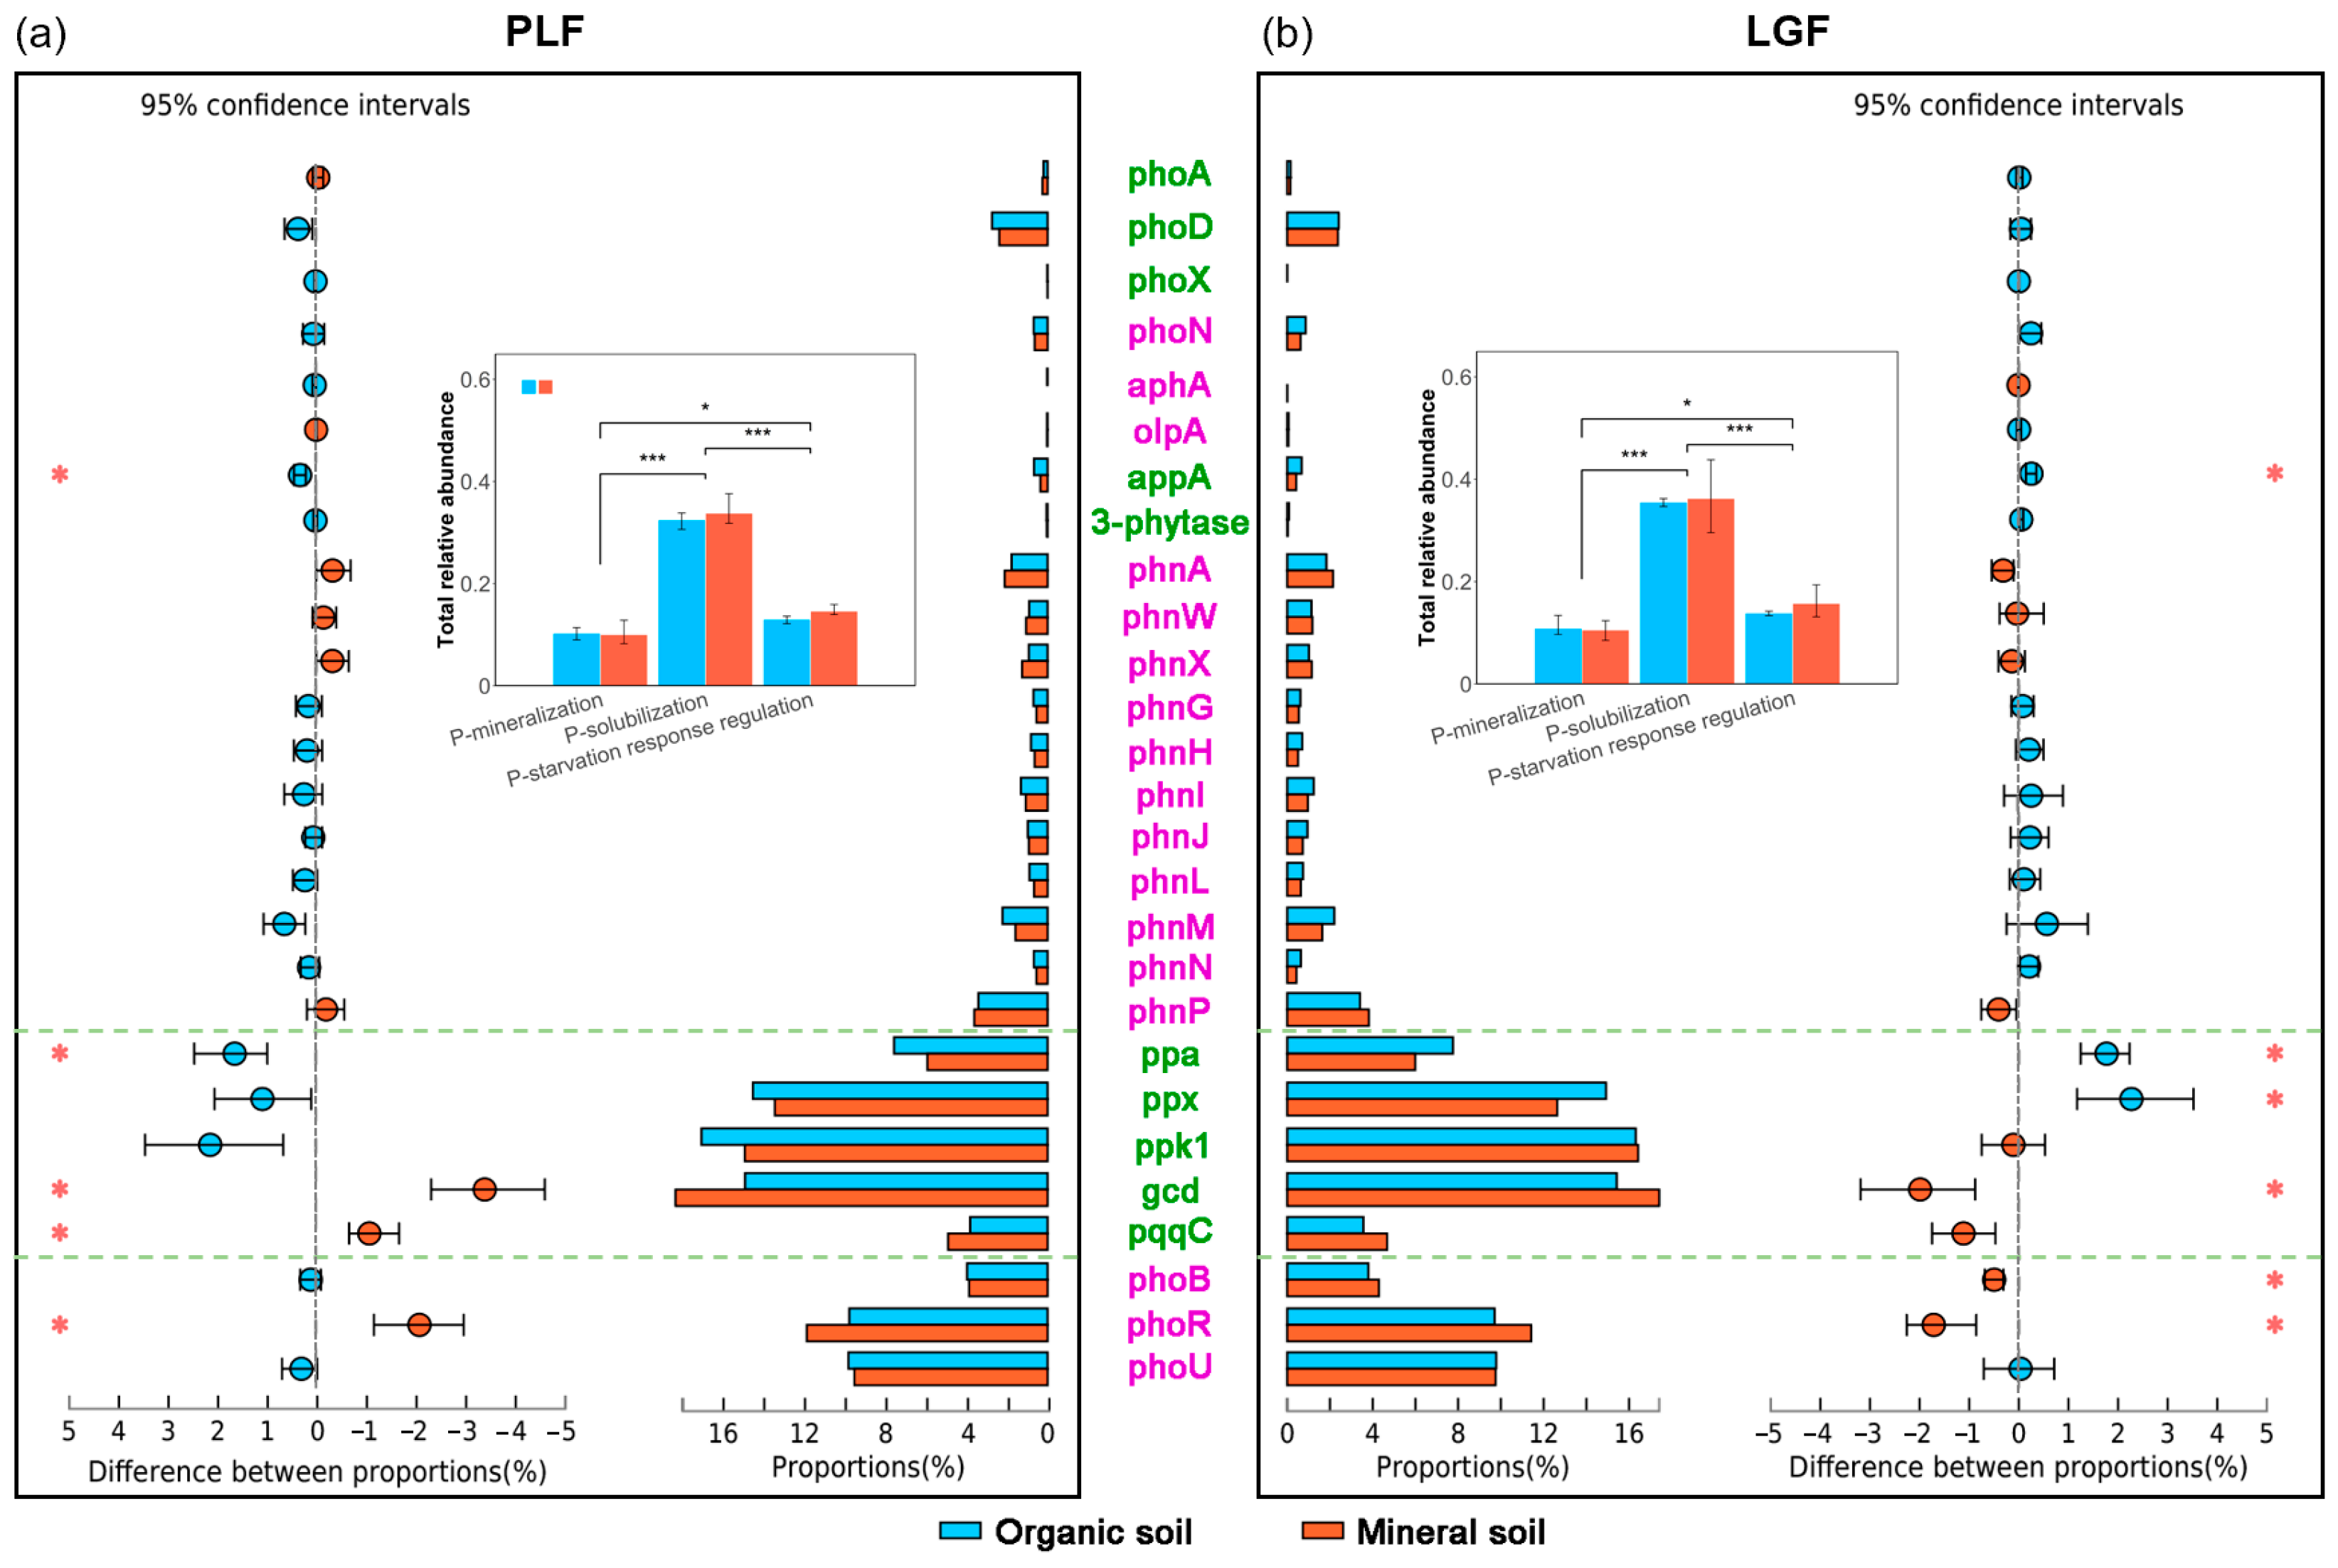
3.1. Differences in Relative Abundance of P Cycling Genes across Soil Depths

The composition of P cycling genes varied significantly between organic and mineral soil (p = 0.005), whereas the differences in forest types were insignificant (Figure S1a). There were substantial differences among the total relative abundance of genes that function for inorganic P solubilizing, organic P mineralizing, and P starvation response regulating (Figure 1). With individual genes functioning for organic P mineralizing, only the appA gene coding for phytase was more abundant in surface organic soil than in deeper mineral soil. As for inorganic P solubilizing genes, the ppa gene in PLF and LGF, as well as ppx in LGF, were more abundant in surface organic soil than in deeper mineral soil, whereas the gcd gene in PLF and LGF, as well as the pqqC gene in PLF, were lower in organic soil. The genes functioning for P starvation response regulating, including phoB in LGF and phoR in PLF and LGF, were more abundant in deeper mineral soil than in surface organic soil (Figure 1).

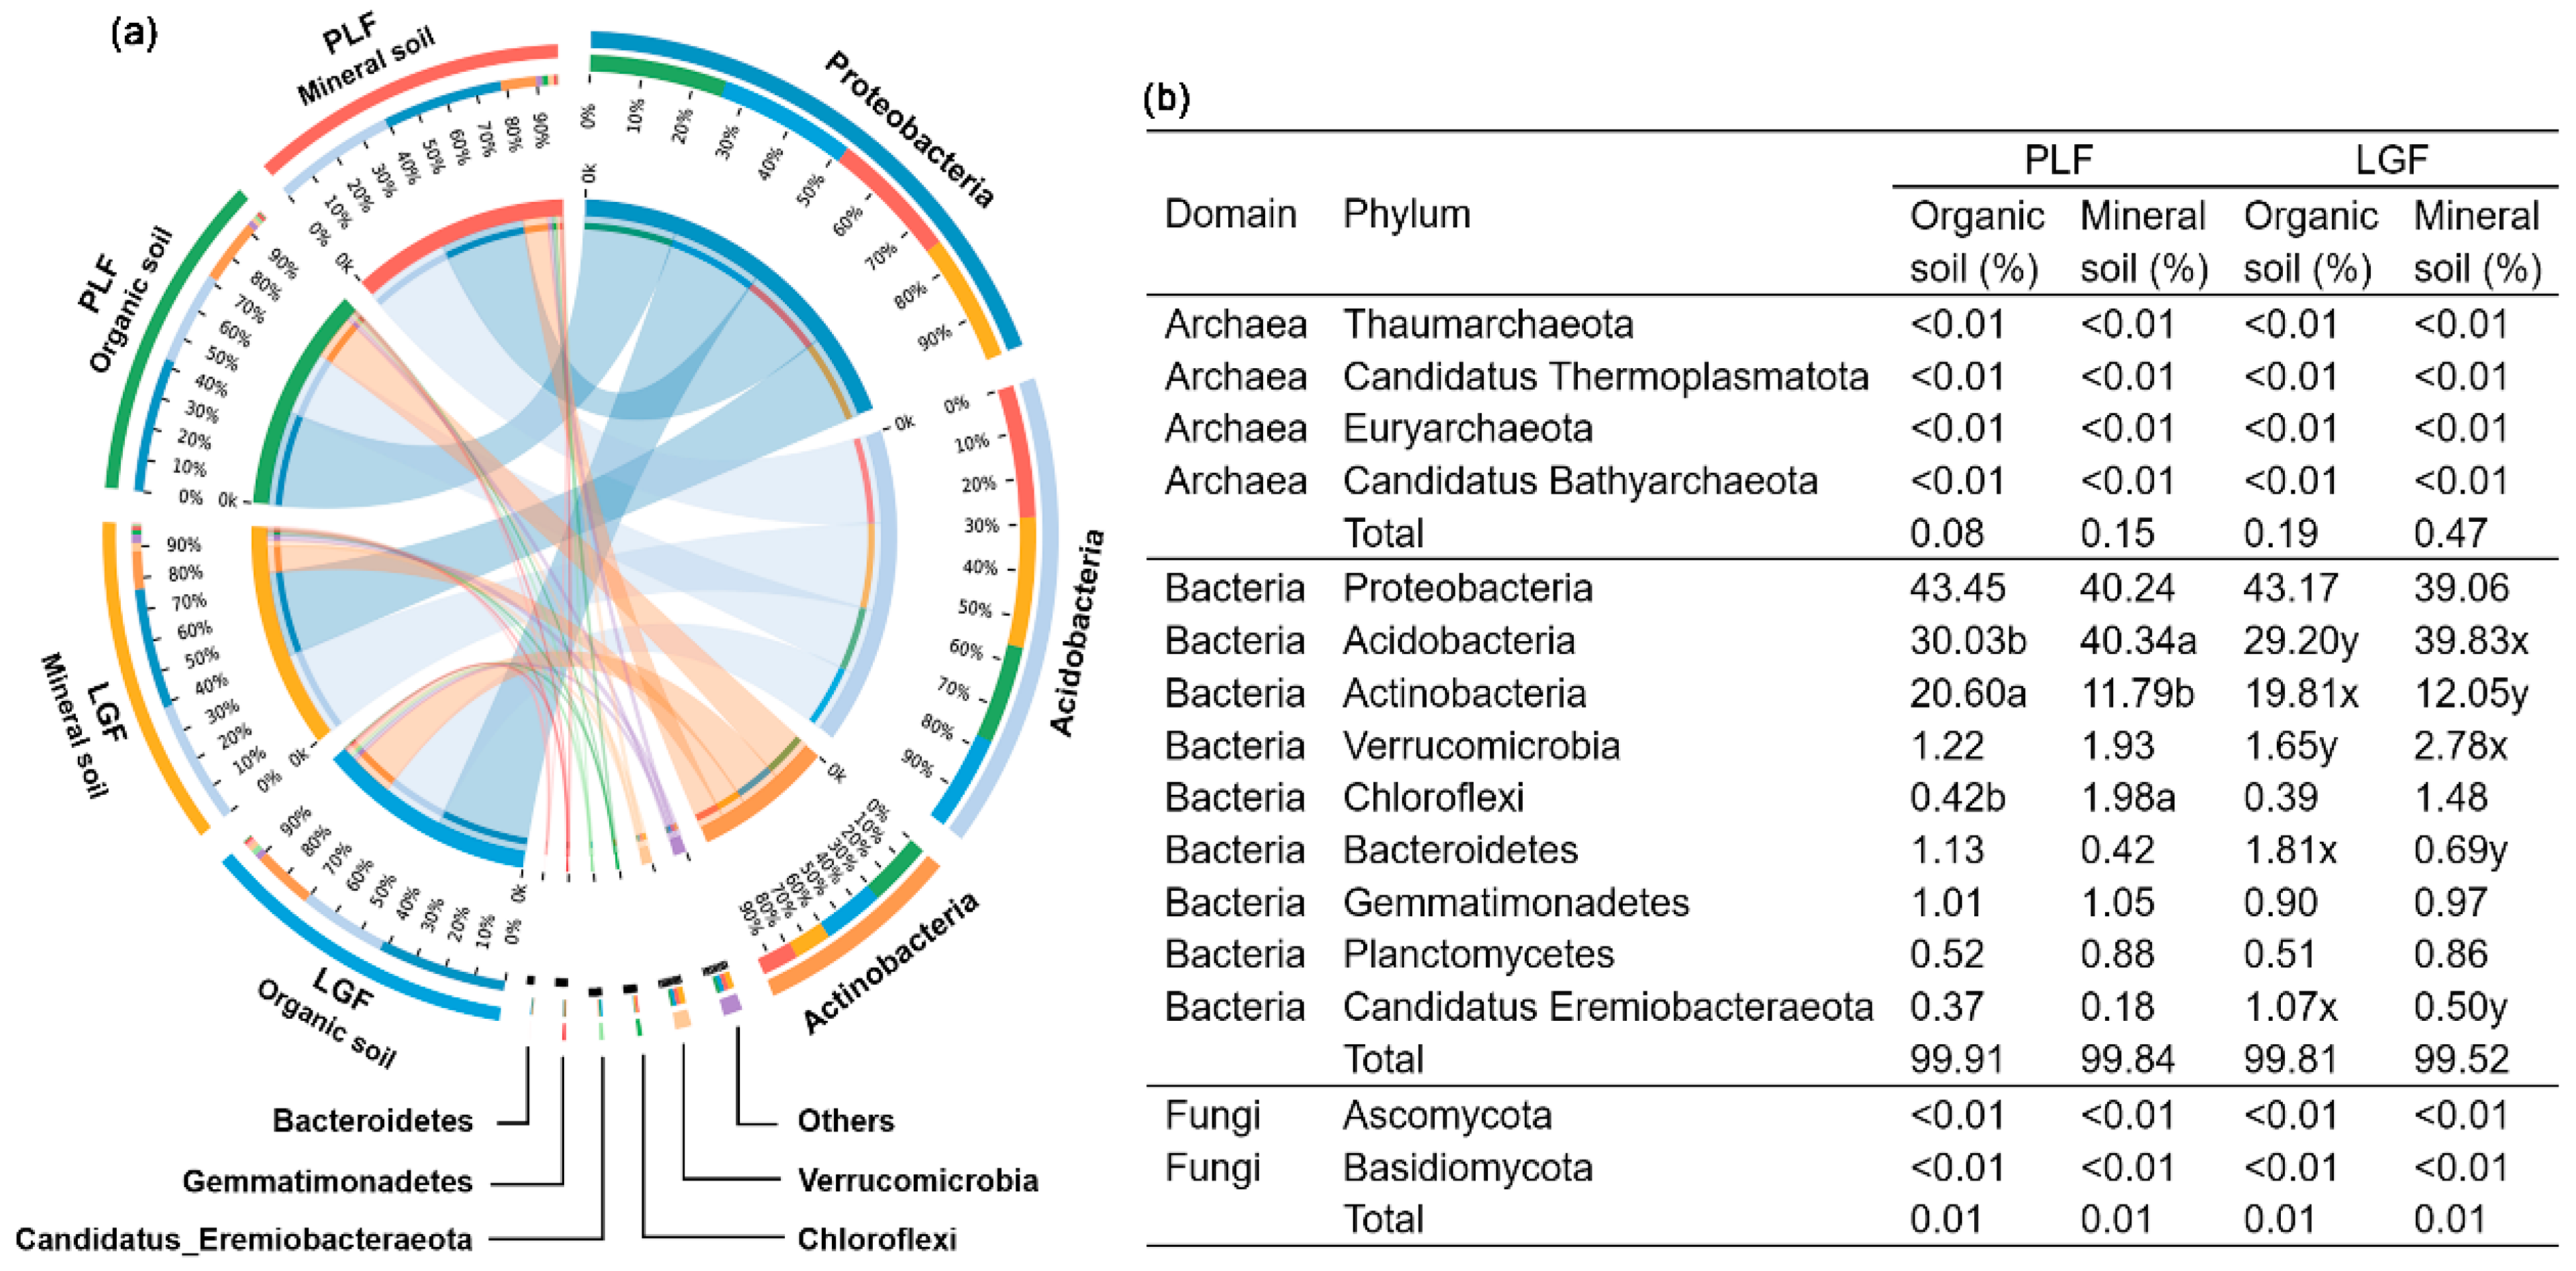
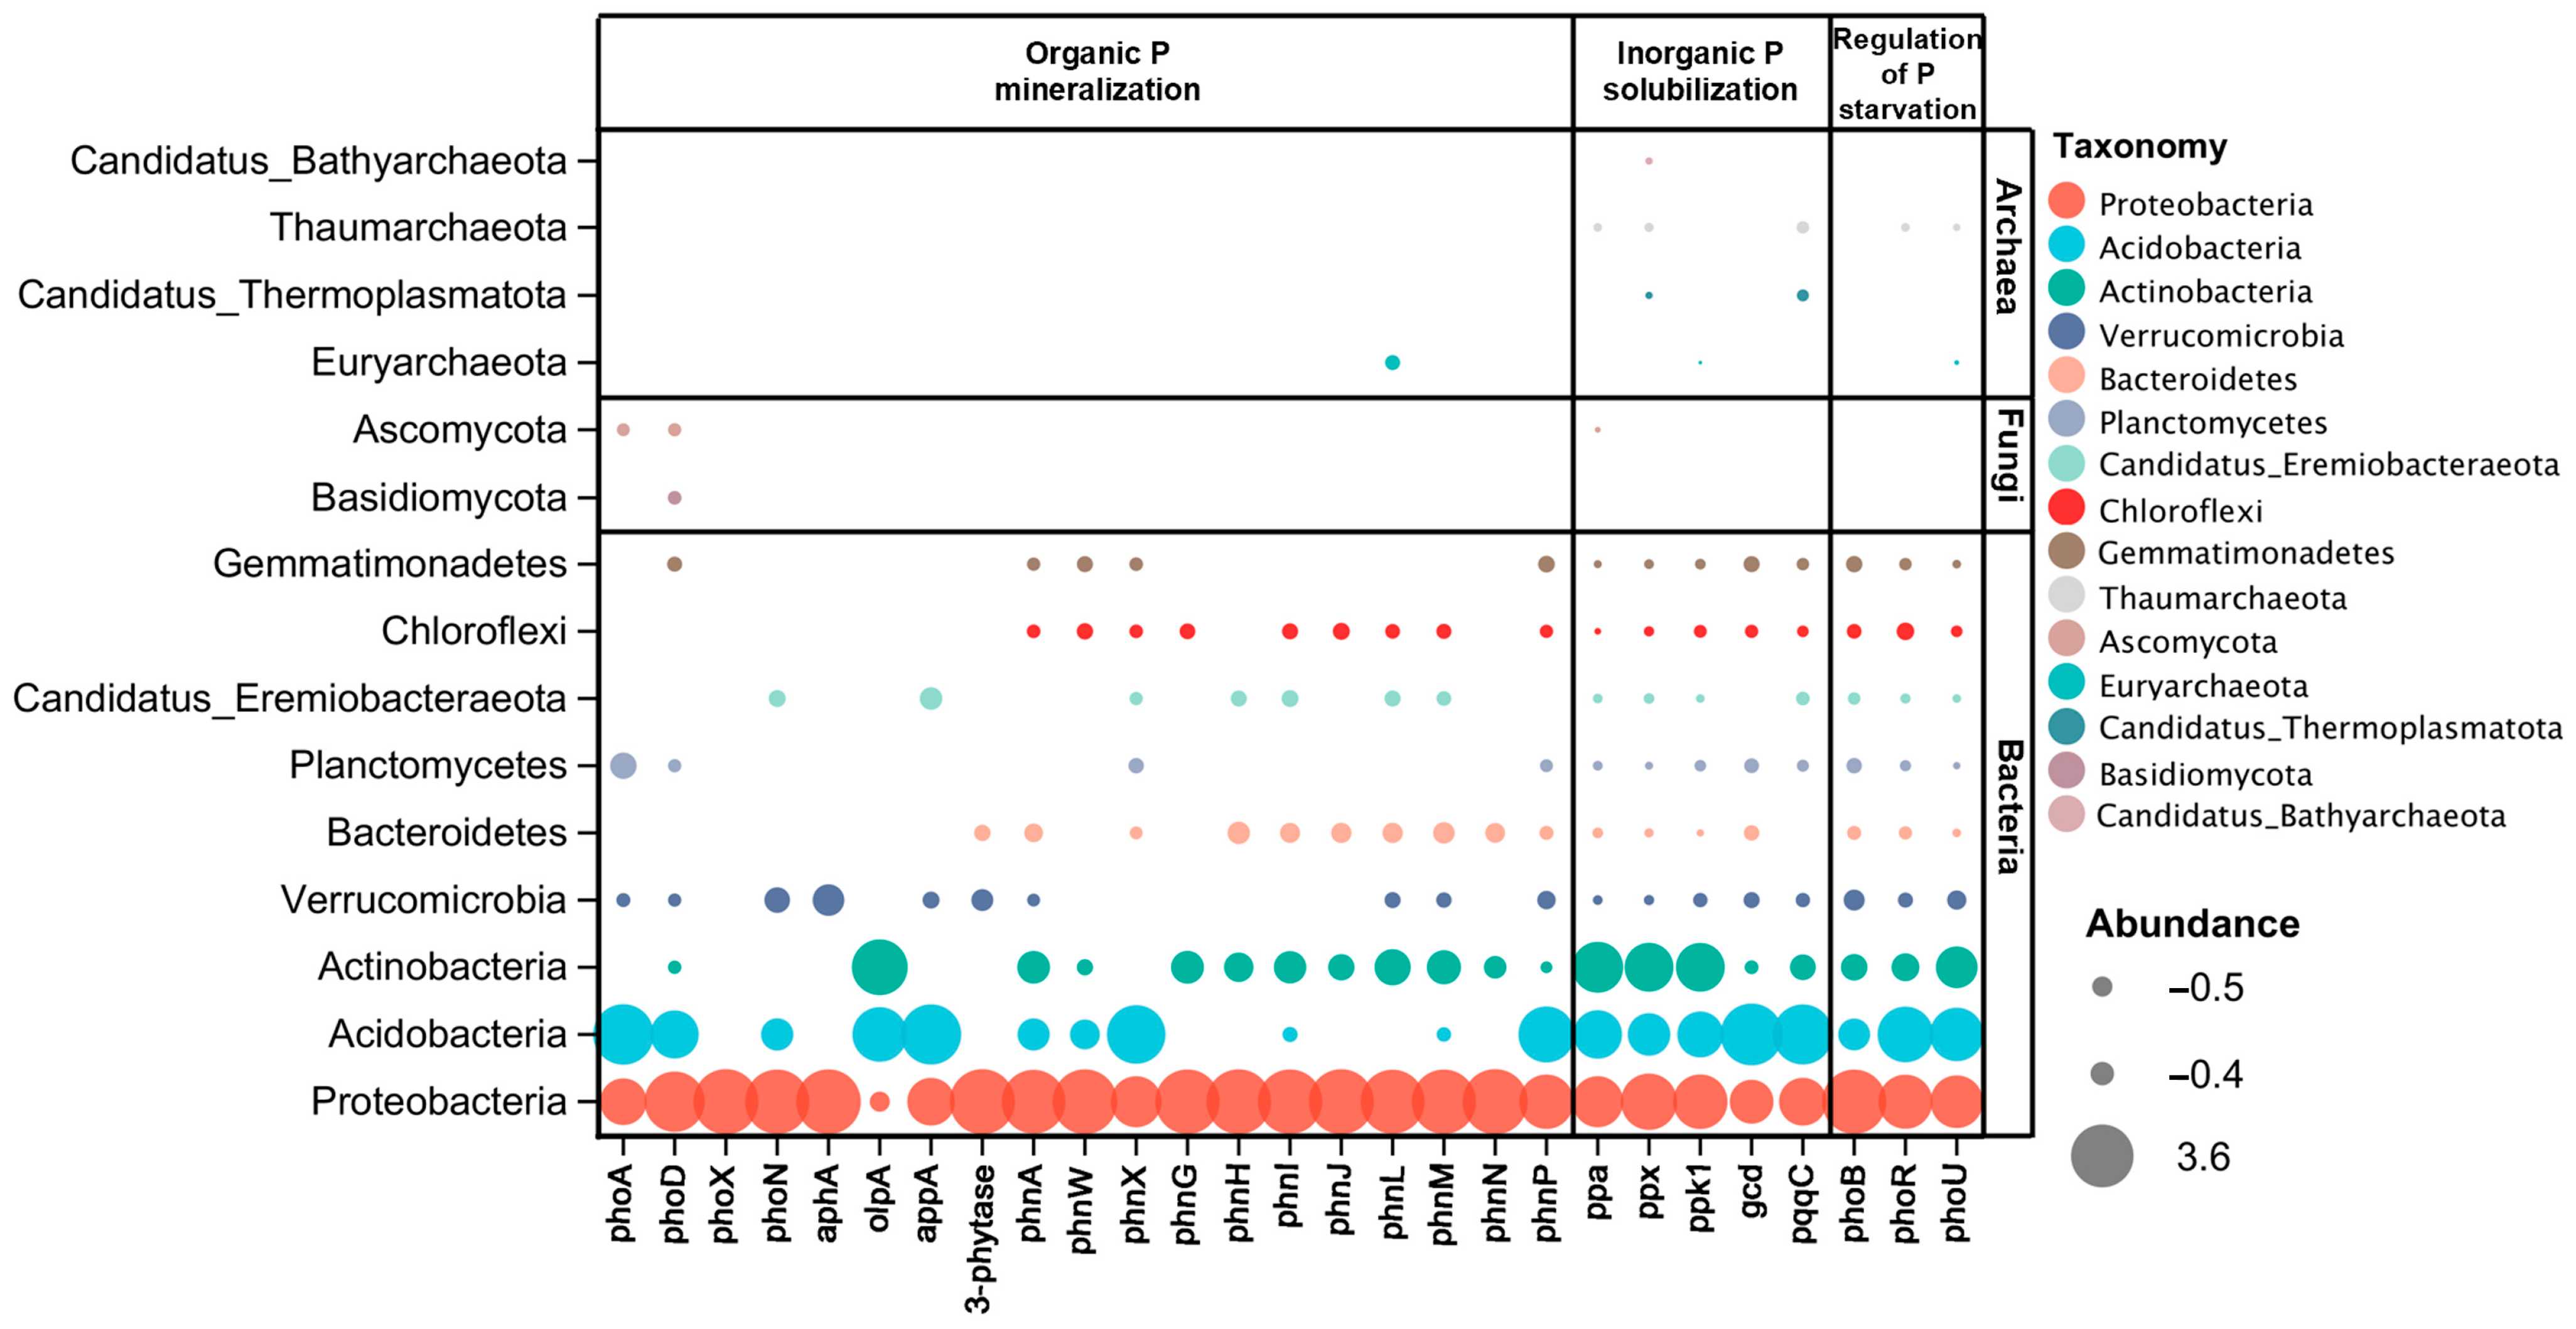
3.2. Differences in Taxonomic Assignments of P Cycling Genes across Soil Depths

The soil microbial taxa associated with P cycling genes varied significantly between organic and mineral soil (p = 0.002), whereas the differences in forest types were insignificant (Figure S1b). In the similarities analysis via the NCBI-NR database, 99.86% of sequences that were associated with P cycling genes were matched as bacteria, 0.13% as archaea, and 0.01% as fungi in organic soil, whereas in mineral soil, 99.68% were compared as bacteria, 0.31% as archaea, and 0.01% as fungi. Although the total abundance of these three taxa varied insignificantly among organic and mineral soil, archaea abundance was higher in the latter than in the former (Figure 2b). The phyla Proteobacteria, Acidobacteria, and Actinobacteria were the dominant soil bacterial communities (Figure 2a), which were the most crucial taxonomic groups associated with soil P cycling (Figure 3 and Table S3). Organic soil has a higher abundance of the phyla Actinobacteria, Bacteroidetes, and Candidatus_Eremiobacteraeota than mineral soil, whereas Acidobacteria, Verrucomicrobia, and Chloroflexi were higher in mineral soil (Figure 2b).
Except for the phoA and phoD genes found in bacterial and fungi communities and phnL located in bacterial and archaea communities, all the organic P mineralization genes were present in bacteria (Figure 3). The genes functioning for inorganic P solubilizing and P starvation response regulating were present in bacteria and archaea. A significant positive relationship was shown between the beta (β) diversity of genes and the microbial taxa that are associated with soil P cycling (Figure 4), and mineral soil has a higher β diversity of both phyla and genes than organic soil.

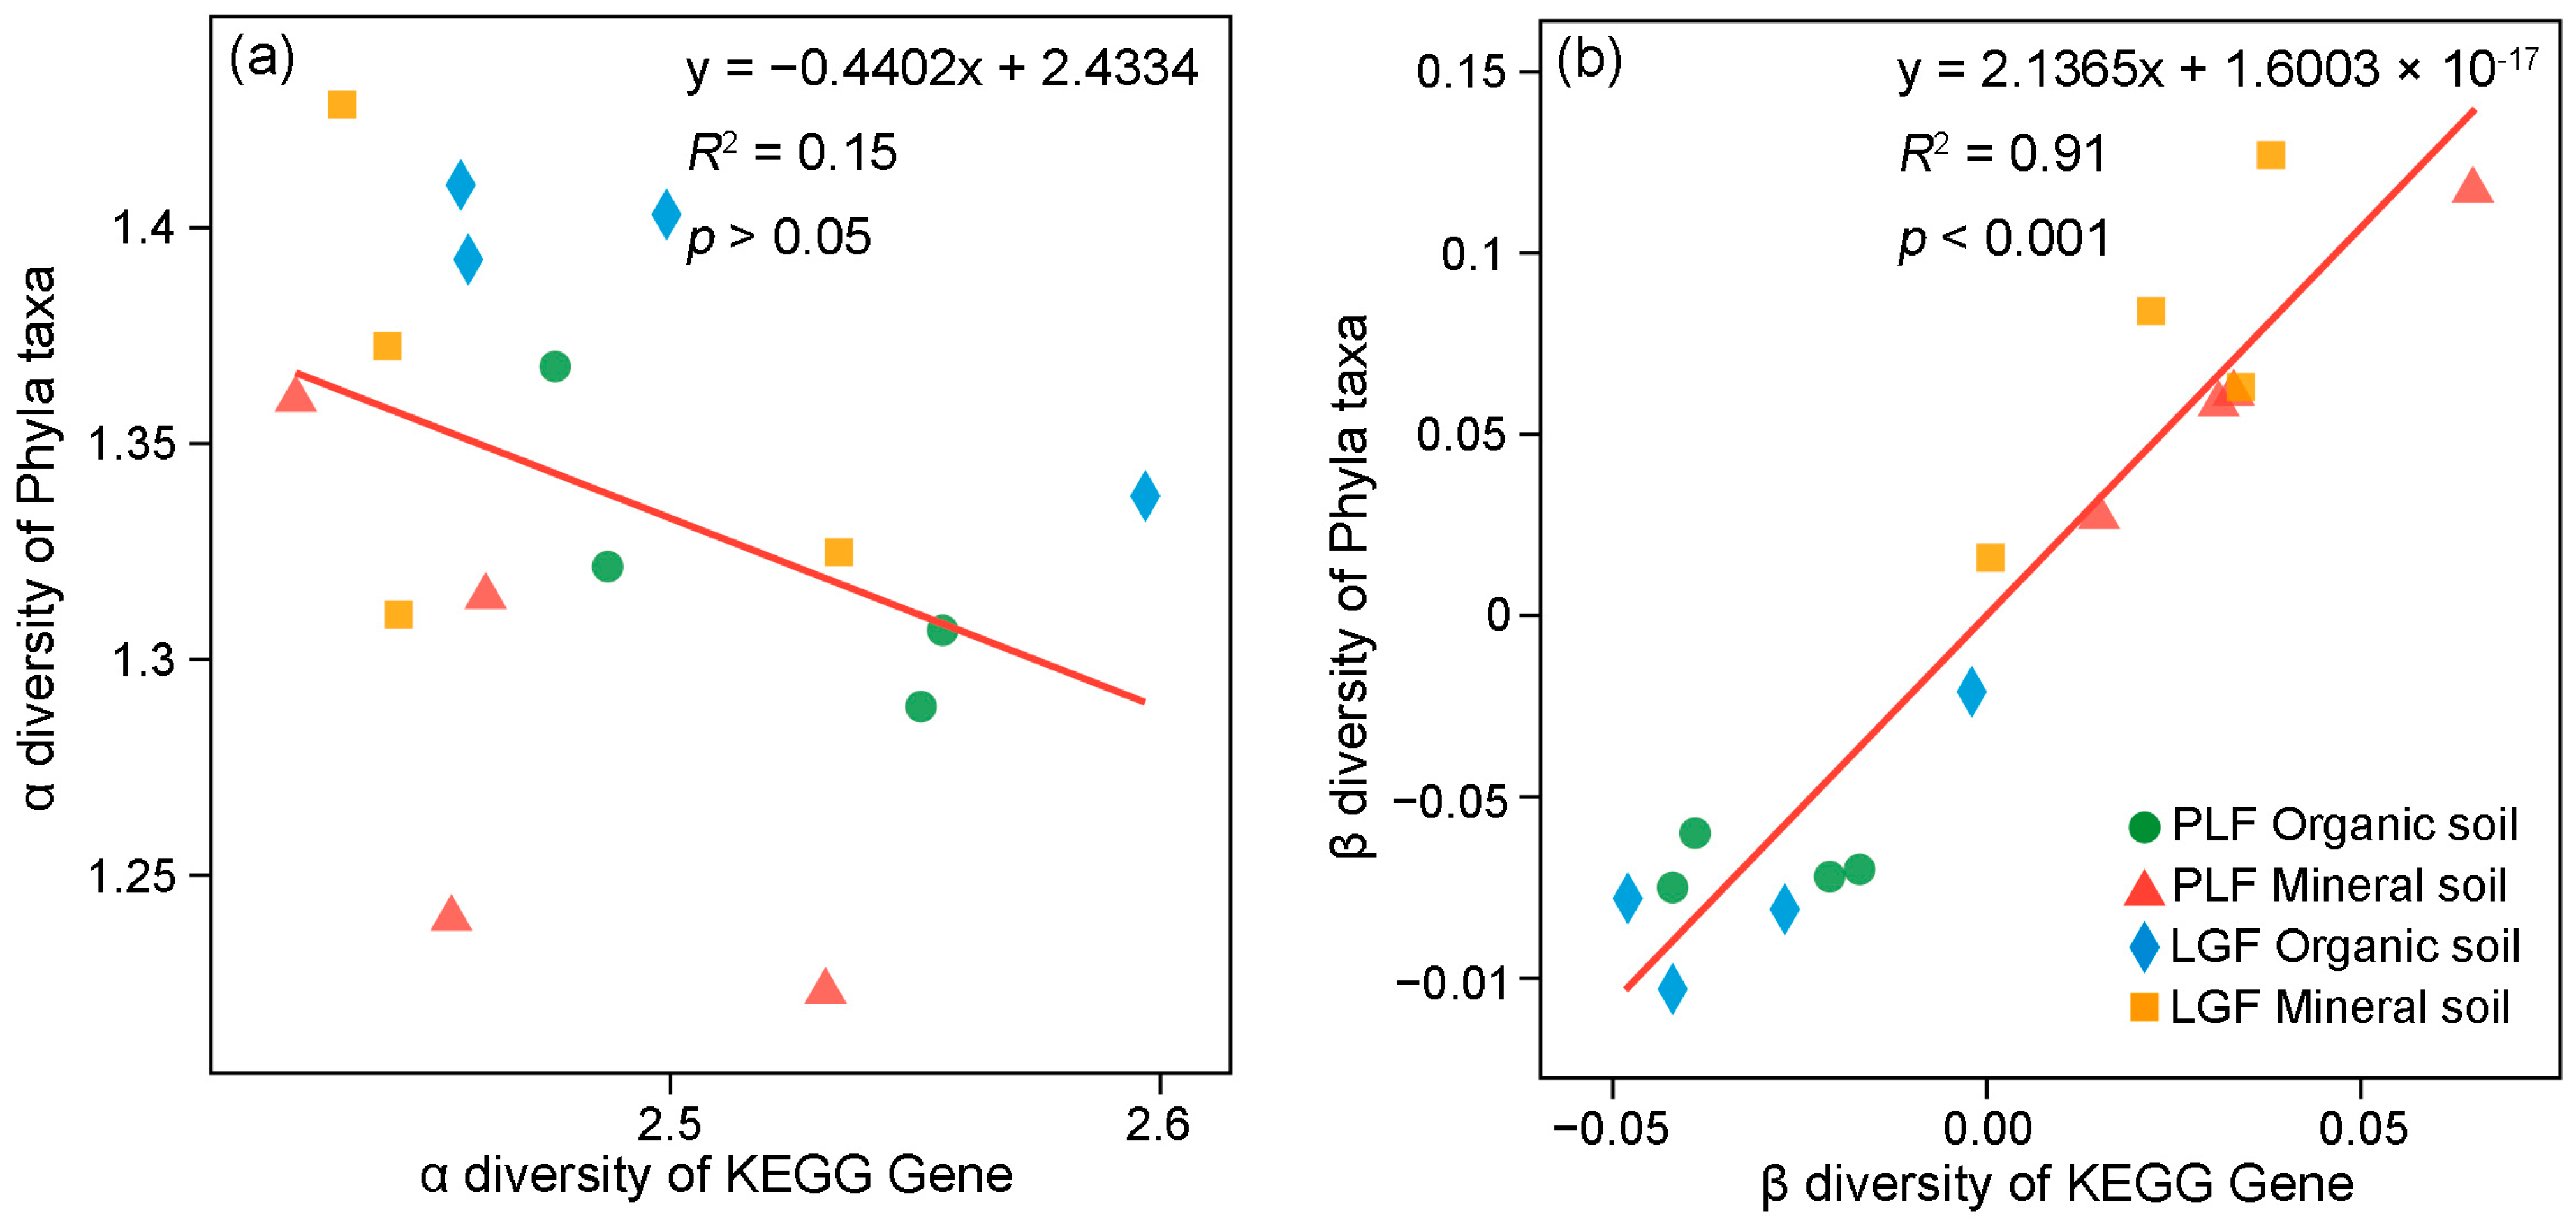
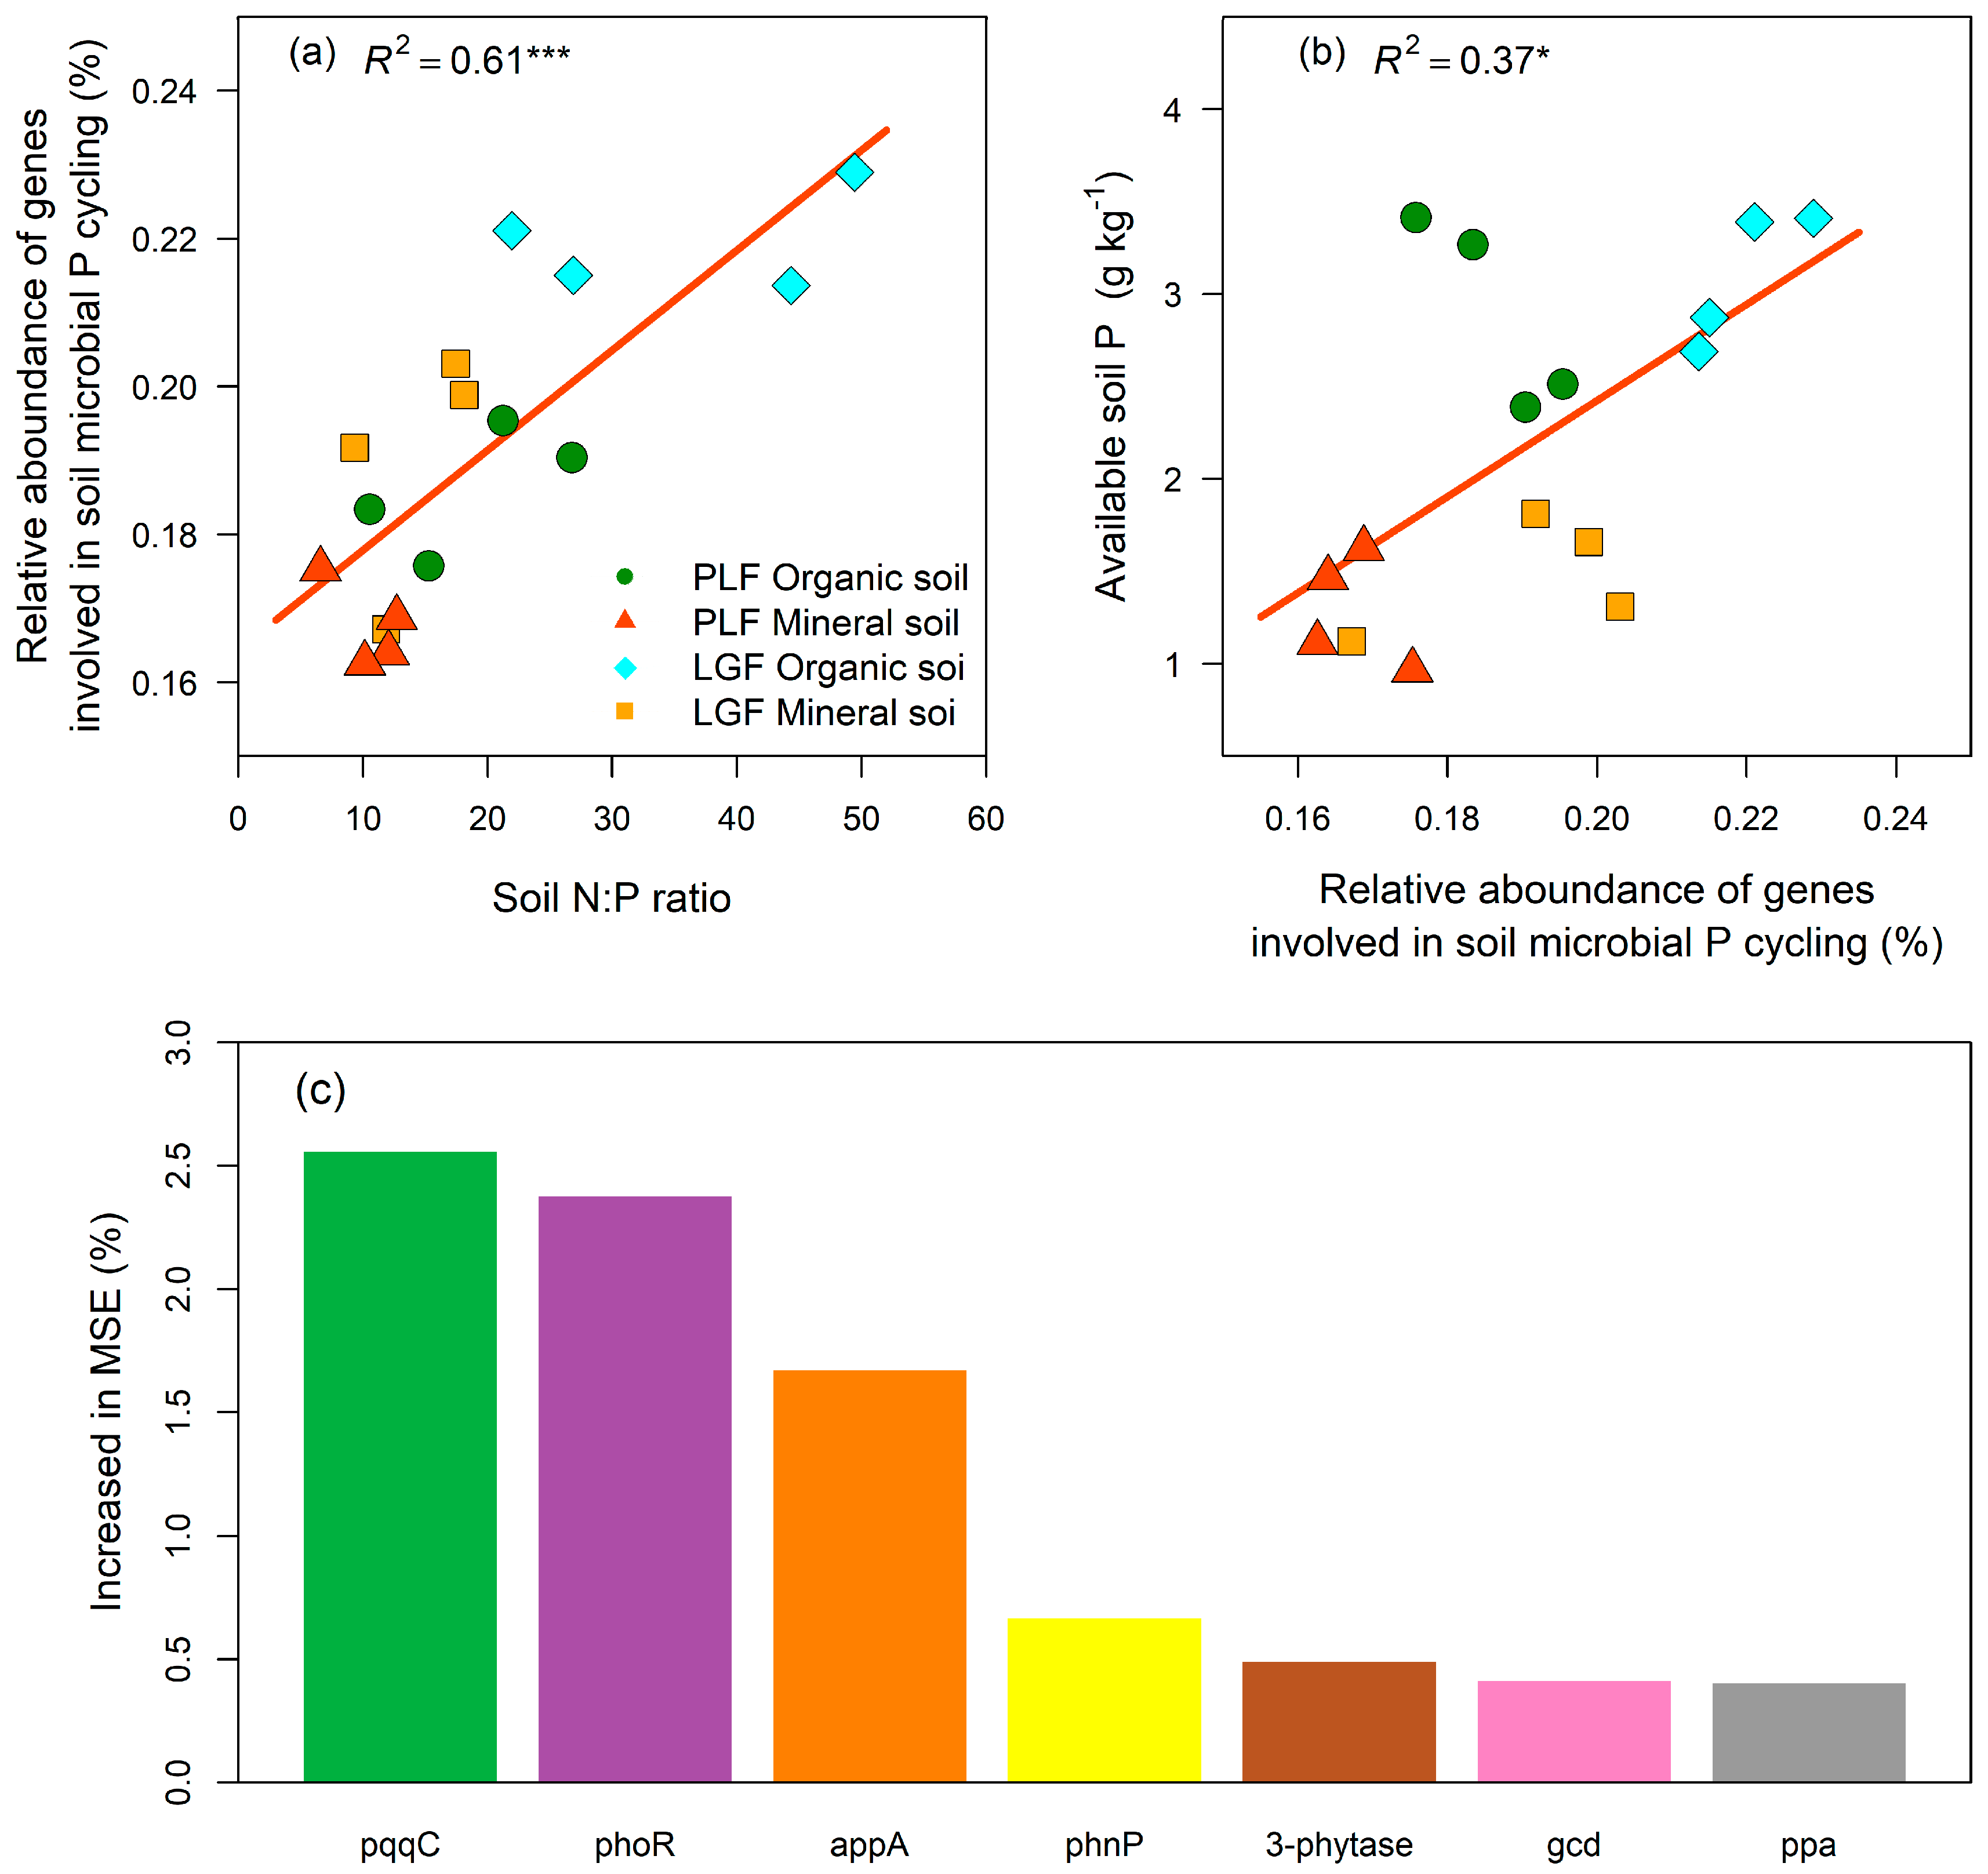
3.3. Linkages between P Cycling Genes and Soil P Status

The relative abundance of P cycling genes positively and significantly correlated with soil N:P ratio (p < 0.001; Figure 5a) and available soil P concentration (p < 0.05; Figure 5b). A random forest analysis revealed that 7 of the 27 P cycling genes contributed to mediating the concentration of available soil P (Figure 5c). A Pearson correlation analysis displayed that the available soil P concentration significantly increased with gene abundances of appA, 3-phytase, and ppa (p < 0.01; Table S4), whereas decreased with that of genes pqqC, phoR, phnP, and gcd (p < 0.05; Table S4).

4. Discussion

4.1. Key Genes Associated with Soil P Cycling in Organic and Mineral Soil

The inorganic P solubilization genes were the most abundant in both organic and mineral soil in subtropical forests (Figure 1), indicating that inorganic P solubilizing may be the dominant resource for the supply of available soil P (soluble orthophosphate), which contrasted with our hypothesis that surface soil has a higher potential to mineralize organic P compared to deeper soil. Owing to subtropical forest soils being highly weathered and acidified [30], P is often adsorbed or precipitated as inorganic forms (Fe-P and Al-P) [31]; as a result, the available soil P pool is tiny [32], and the insoluble inorganic P pool is large [33]. In response to low soil P availability and a sizeable inorganic P pool, the inorganic P solubilization genes will trigger to increase their abundance.
The inorganic P solubilizing genes, pqqC and gcd, were the key predictors of enhanced soil P cycling in mineral soil (Figure 6), which verified the previous results [8,9]. This result can be attributed to the following three aspects. First, the genes pqqC and gcd were more abundant in mineral soil than in organic soil (Figure 1). The gcd gene encodes the glucose dehydrogenase (GCD) and the pqqC gene codes the pyrroloquinoline quinone synthase C (PqqC) that is involved in the synthesis pathway of pyrroloquinoline quinone (PQQ) [34]. The compound forming with GCD and the redox cofactor PQQ is essential to produce gluconic acid by microbial [35]. Gluconic acid is considered the most important organic acid in the solubilization of the recalcitrant inorganic P [36]. Second, there was a negative relationship between the available soil P concentration and the relative abundance of genes pqqC and gcd (Table S4). Consistent with a previous study [37], we observed that the available soil P concentration was higher in surface organic soil than in deeper mineral soil, which indicated that the pqqC and gcd genes were more sensitive to a low soil P availability than other P cycling genes. Third, mineral soil tends to increase inorganic P content in the forest ecosystem. Soil organic carbon has been identified as a key driver of soil TP concentration and the distribution of its forms [38]. In this study, the SOC concentration was significantly lower in deeper mineral soil than in surface organic soil (Table 1), indicating that more inorganic P existed in the mineral soil. Therefore, the larger inorganic P pool would stimulate the inorganic P solubilization genes, including pqqC and gcd.
The phoR gene (P starvation response regulation gene) may also be a key marker of the soil microbial regulation capacity of P cycling in mineral soil [4,14]. In both PLF and LGF, the phoR gene was more abundant in deeper mineral soil than in surface organic soil (Figure 1), which agreed with previous studies, which showed that low P conditions activate the phoR gene [39], and our hypothesis. The phosphate (Pho) regulon is controlled by the genes phoB, phoR, and phoU which regulates soil inorganic P transformation [40]. Thus, we inferred that the activated phoR gene might be necessary for regulating the pqqC and gcd genes. This assumption was supported by the fact that the genes phoR, pqqC, and gcd were considered as determinants of the concentration of available soil P via the random forest analysis (Figure 5), and that these three gene abundances significantly and negatively correlated with available soil P concentration through the Pearson correlation analysis (Table S3). In addition, the genes phoB and phoR were more abundant in deeper mineral soil than in the surface organic soil of LGF with low soil TP. In contrast, there were no significant differences in the genes phoB and phoU between the organic and mineral soil of PLF with high soil TP (Figure 1 and Table 1). This result is explained by the fact that phoB is activated by phoR under P-low environments, whereas phoB is triggered by phoU in P-rich environments [4].
The key genes that functioned in P cycling differed between organic and mineral soil (Figure 1 and Figure 6). The ppa gene, which encodes an inorganic pyrophosphatase to hydrolyze inorganic polyphosphate compounds, was the key inorganic P solubilization gene in organic soil [41]. Inorganic polyphosphate, in chains of tens to hundreds of phosphate residues, is environmentally ubiquitous and abundant, such that it is found in every cell in nature [42]. Accordingly, higher levels of inorganic polyphosphate are accumulated in surface organic soil than in deeper mineral soil, as it is derived from forest floor litter decomposition and significant microbial population turnover [43]. Moreover, the ppx gene was more abundant in the surface organic soil than in the deeper mineral soil of LGF, whereas for PLF, that of ppx and ppk1 was slightly higher in the organic soil (Figure 1). Exopolyphosphatase—which releases orthophosphate anions from inorganic polyphosphate—is encoded by the ppx gene [41], and polyphosphate kinase—which catalyzes the formation of polyphosphate—is coded by the ppk1 gene [44]. Therefore, the high levels of inorganic polyphosphate in organic soil may trigger inorganic P solubilization genes, especially ppa.
Despite the total relative abundance of organic P mineralizing genes being the lowest in subtropical forest soils (Figure 1), the appA and 3-phytase genes were found to have a vital role in determining the available soil P concentration in organic soil (Figure 5 and Table S4). The appA and 3-phytase genes encode phytases that hydrolyze the phytate [45]. Phytates are the dominant organic P forms in soil [46]. Previous studies suggested that the 3-phytase gene was abundant in P-deficient soil [47], which indicates that mineralizing phytate as a P-source is critical in P-deficient soils [14]. Based on N:P stoichiometry, a high soil N:P ratio implies a high N concentration and/or low P concentration, which may increase the P-starvation of soil microorganisms [48]. Our results revealed that the total relative abundance of P cycling genes significantly increased with the soil N:P ratio (Figure 5), and the appA gene was more abundant in the surface organic soil (higher N:P ratio) than in deeper mineral soil (lower N:P ratio), which was in line with a previous study [8]. We concluded that the high soil N:P ratio in organic soil stimulated the appA and 3-phytase genes to encode phytase, which improved the mineralization of phytate and then increased the concentration of available soil P.

4.2. Phosphorus Cycling Genes Harboring Microbial Taxa Change with Soil Depths

Consistent with previous studies, P-cycling genes harboring microbial taxa distributed among bacteria, fungi, and archaea [14]. As bacteria are better studied and understood in soil P cycling [e.g., primers targeting key P cycling genes have been designed for bacteria, numerous bacterial genomic data], this has resulted in most P-cycling genes being found in soil bacteria [49]. Interestingly, several genes were also presented in fungi and archaea. For example, the phoA and phoD genes presented in fungi agreed with previous studies showing that phoD is widely distributed in different soil microbial taxa [50]. Genes associated with inorganic P solubilizing and P starvation response regulating were also presented in archaea, suggesting that archaea have a critical role in soil inorganic P solubilizing and P starvation responding [14,51]. The species and functional regression analyses also denoted that the soil microbial taxa harbor more distinct P cycling genes in mineral soil (Figure 4b), indicating that more diverse soil microbial taxonomic groups have a higher potential to mineralize and solubilize soil P in subtropical forests.
The bacteria phyla Actinobacteria, Bacteroidetes, and Candidatus_Eremiobacteraeota decreased in abundance with depth (Figure 2), which may be attributed to their copiotrophic behavior [52,53]. The significant increases in the abundance of Acidobacteria, Verrucomicrobia, and Chloroflexi with depth (Figure 2) have been previously evidenced by their tolerance for nutrient-poor conditions [54,55]. The copiotrophic hypothesis states that copiotrophic taxa seem to increase in nutrient-rich environments, whereas oligotrophic taxa would likely decrease [56,57]. Furthermore, copiotrophic taxa exhibit fast growth rates with high soil C availability, whereas oligotrophic taxa grow slowly by metabolizing recalcitrant C and nutrient-poor substrates [57]. The variations in copiotrophic and oligotrophic taxa with soil depth may be directly influenced by the decreases in the available soil P concentration, N:P ratio, and SOC, or they are indirectly affected by the increase in soil pH in mineral soil [6,53,58]. For example, the abundance of oligotrophic Acidobacteria significantly decreased with the soil N:P ratio (R2 = 0.35, p < 0.05) in this study. In contrast, it increased with the soil pH (R2 = 0.42, p < 0.05), which is consistent with a previous study [8]. Contrary to the copiotrophic hypothesis, the abundance of copiotrophic proteobacteria did not significantly differ between organic (43.45% in PLF, 43.17% in LGF) and mineral (40.24% in PLF, 39.06% in LGF) soil (Figure 2), which suggested that proteobacteria is the predominant contributor in soil P cycling in subtropical forests.
According to previous studies [53,55], the archaea taxa associated with soil P cycling was more abundant in deeper mineral soil than in surface organic soil (Figure 2). Several reasons have been documented for the increasing abundance of archaea taxa with soil depth, including their adaptation to nutrient-limited conditions as slow-growing oligotrophs, adaption to chronic energy stress, preference as methanogens for anaerobic conditions, and function as ammonia oxidizers to stimulate autotropic nitrification in deeper soil [53,54,59,60]. In addition, the total relative abundance of fungi taxa that harbored soil P cycling genes was lower than 0.01% (Figure 2). Compared to bacteria and archaea, the potential of fungi associated with the underlying mechanisms stimulated by changes in soil P availability seems to be more limited [14].

5. Conclusions

The key genes associated with soil P cycling in organic soil were ppa, appA, and 3-phytase, indicating that soil microorganisms had the potential to both mineralize organic P and solubilize inorganic P in organic soil, whereas those in mineral soil were phoR, gcd, and pqqC, suggesting that soil microbial P starvation response regulating genes were stimulated to improve inorganic P solubilization in mineral soil. The P cycling genes not only contained bacteria, but also harbored archaea and fungi. The bacteria that function in soil P cycling were Proteobacteria, Actinobacteria, Bacteroidetes, and Candidatus_Eremiobacteraeota in organic soil, and Proteobacteria, Acidobacteria, Verrucomicrobia, and Chloroflexi in mineral soil. The relative abundance of archaea associated with soil P cycling was higher in mineral soil than organic soil. These results showed that the distribution of P cycling genes and microbial taxonomic groups significantly differed between the organic and mineral soil. Thus, a depth-resolved scale investigation can deeply reveal the functions of the soil microorganisms and the benefits to soil P nutrition management in P-deficient subtropical forests.

Supplementary Materials

The following supporting information can be downloaded at: https://www.mdpi.com/article/10.3390/f14081665/s1, Figure S1: Nonmetric multidimensional scaling plots (NMDS) of P cycling genes (a) and soil microbial taxa involved in P cycling (b) in soils. NMDS had a good explanation of variation as stress < 0.1. ANOSIM showed significant differences in variables between organic and mineral soil as p < 0.05. Table S1: Stand characteristics (mean ± SD) in the Pinus massoniana—Lithocarpus glaber coniferous and evergreen broadleaved mixed forest (PLF) and L. glaber—Quercus glauca evergreen broadleaved forest (LGF). DBH represents tree diameter at breast height, H represents tree height. Table S2: Details on the 27 functional genes related to P cycling studied in this study. Table S3: The abundance (RPKM) of species (phyla taxa) for a specific functional (KEGG gene) in organic and mineral soils. Table S4: Pearson correlations between the available soil P concentration and the relative abundance of the P cycling genes selected by Random Forest analysis.

Author Contributions

Conceptualization, S.O. and G.W.; Formal analysis, H.L.; Investigation, H.L., J.Y., S.S., Y.L., J.F., Y.S., T.W. and J.P.; Methodology, L.C. and G.W.; Writing—original draft, H.L.; Writing—review and editing, L.T., L.C., S.O. and G.W. All authors have read and agreed to the published version of the manuscript.

Funding

This study was funded by the Natural Science Foundation of Hunan Province, China (2022JJ31003), Hunan Forestry Science and Technology Innovation Fund project (XLK202105-4), Scientific Research Innovation Project of Hunan Province (2021RC3104), National College Students innovation and entrepreneurship training program (202210538005), and Huitong Forest Ecological Station funded by the State Forestry and Grassland Administration of China (2021132078).

Data Availability Statement

All data that support the findings of this study are available from the corresponding author (GJW) upon request.

Acknowledgments

We are very grateful to the other teachers of our team for their help in language editing and the postgraduate students for their help with the field experiments.

Conflicts of Interest

The authors declare that they have no known competing financial interest or personal relationships that could have appeared to influence the work reported in this paper.

References

  1. Du, E.Z.; Terrer, C.; Pellegrini, A.F.A.; Ahlström, A.; van Lissa, C.J.; Zhao, X.; Xia, N.; Wu, X.H.; Jackson, R.B. Global patterns of terrestrial nitrogen and phosphorus limitation. Nat. Geosci. 2020, 13, 221–226. [Google Scholar] [CrossRef]
  2. Barea, J.M.; Richardson, A.E. Phosphate mobilisation by soil microorganisms. In Principles of Plant-Microbe Interactions; Lugtenberg, B., Ed.; Springer International Publishing: Cham, Switzerland, 2015; pp. 225–234. [Google Scholar]
  3. Arif, M.S.; Shahzad, S.M.; Yasmeen, T.; Riaz, M.; Ashraf, M.; Ashraf, M.A.; Mubarik, M.S.; Kausar, R. Improving plant phosphorus (P) acquisition by phosphate-solubilizing bacteria. In Essential Plant Nutrients; Naeem, M., Ansari, A.A., Gill, S.S., Eds.; Springer International Publishing: Cham, Switzerland, 2017; pp. 513–556. [Google Scholar]
  4. Oliverio, A.M.; Bissett, A.; McGuire, K.; Saltonstall, K.; Turner, B.L.; Fierer, N. The role of phosphorus limitation in shaping soil bacterial communities and their metabolic capabilities. mBio 2020, 11, e01718–e01720. [Google Scholar] [CrossRef] [PubMed]
  5. Hou, E.; Luo, Y.; Kuang, Y.; Chen, C.; Wen, D. Global meta-analysis shows pervasive phosphorus limitation of aboveground plant production in natural terrestrial ecosystems. Nat. Commun. 2020, 11, 637. [Google Scholar] [CrossRef]
  6. Liang, J.L.; Liu, J.; Jia, P.; Yang, T.T.; Zeng, Q.W.; Zhang, S.C.; Liao, B.; Shu, W.S.; Li, J.T. Novel phosphate-solubilizing bacteria enhance soil phosphorus cycling following ecological restoration of land degraded by mining. ISME J. 2020, 14, 1600–1613. [Google Scholar] [CrossRef] [PubMed]
  7. Naylor, D.; McClure, R.; Jansson, J. Trends in microbial community composition and function by soil depth. Microorganisms 2022, 10, 540. [Google Scholar] [CrossRef]
  8. Dai, Z.M.; Liu, G.F.; Chen, H.H.; Chen, C.R.; Wang, J.K.; Ai, S.Y.; Wei, D.; Li, D.M.; Ma, B.; Tang, C.X.; et al. Long-term nutrient inputs shift soil microbial functional profiles of phosphorus cycling in diverse agroecosystems. ISME J. 2020, 14, 757–770. [Google Scholar] [CrossRef]
  9. Wu, X.J.; Cui, Z.L.; Peng, J.J.; Zhang, F.S.; Liesack, W. Genome-resolved metagenomics identifies the particular genetic traits of phosphate-solubilizing bacteria in agricultural soil. ISME Commun. 2022, 2, 17. [Google Scholar] [CrossRef]
  10. Yu, H.; He, Z.L.; Wang, A.J.; Xie, J.P.; Wu, L.Y.; Nostrand, J.D.V.; Jin, D.C.; Shao, Z.M.; Schadt, C.W.; Zhou, J.Z.; et al. Divergent responses of forest soil microbial communities under elevated CO2 in different depths of upper soil layers. Appl. Environ. Microbiol. 2017, 84, e01694-17. [Google Scholar]
  11. Griffiths, R.I.; Whiteley, A.S.; O’Donnell, A.G.; Bailey, M.J. Influence of depth and sampling time on bacterial community structure in an upland grassland soil. FEMS Microbiol. Ecol. 2003, 43, 35–43. [Google Scholar] [CrossRef]
  12. Fan, Y.; Lin, F.; Yang, L.; Zhong, X.; Wang, M.; Zhou, J.; Chen, Y.; Yang, Y. Decreased soil organic P fraction associated with ectomycorrhizal fungal activity to meet increased P demand under N application in a subtropical forest ecosystem. Biol. Fertil. Soils 2018, 54, 149–161. [Google Scholar] [CrossRef]
  13. Zhu, X.Y.; Fang, X.; Wang, L.F.; Xiang, W.H.; Alharbi, H.A.; Lei, P.F.; Kuzyakov, Y. Regulation of soil phosphorus availability and composition during forest succession in subtropics. For. Ecol. Manag. 2021, 502, 119706. [Google Scholar] [CrossRef]
  14. Siles, J.A.; Starke, R.; Martinovic, T.; Fernandes, P.M.L.; Orgiazzi, A.; Bastida, F. Distribution of phosphorus cycling genes across land uses and microbial taxonomic groups based on metagenome and genome mining. Soil Biol. Biochem. 2022, 174, 108826. [Google Scholar] [CrossRef]
  15. Kishore, N.; Pindi, P.K.; Reddy, S.R. Phosphate-Solubilizing Microorganisms: A Critical Review. In Plant Biology and Biotechnology: Volume I: Plant Diversity, Organization, Function and Improvement; Bahadur, B., Sahijram, M.V.R.L., Krishnamurthy, K.V., Eds.; Springer: New Delhi, India, 2015; pp. 307–347. [Google Scholar]
  16. IUSS Working Group WRB. World Reference Base for Soil Resources 2014 International soil classification system for naming soils and creating legends for soil maps. In World Soil Resources Reports No. 106; FAO: Rome, Italy, 2015. [Google Scholar]
  17. Zeng, W.X.; Xiang, W.H.; Zhou, B.; Ouyang, S.; Zeng, Y.L.; Chen, L.; Freschet, G.T.; Valverde-Barrantes, O.J.; Milcu, A. Positive tree diversity effect on fine root biomass: Via density dependence rather than spatial root partitioning. Oikos 2021, 130, 1–14. [Google Scholar] [CrossRef]
  18. Wu, H.L.; Xiang, W.H.; Ouyang, S.; Forrester, D.I.; Zhou, B.; Chen, L.X.; Ge, T.D.; Lei, P.F.; Chen, L.; Zeng, Y.L.; et al. Linkage between tree species richness and soil microbial diversity improves phosphorus bioavailability. Funct. Ecol. 2019, 33, 1549–1560. [Google Scholar] [CrossRef]
  19. Ouyang, S.; Xiang, W.H.; Wang, X.P.; Zeng, Y.L.; Lei, P.F.; Deng, X.W.; Peng, C.H. Significant effects of biodiversity on forest biomass during the succession of subtropical forest in south China. For. Ecol. Manag. 2016, 372, 291–302. [Google Scholar] [CrossRef]
  20. Institute of Soil Science, Chinese Academy of Sciences. Analytical Methods of Soil Physics and Chemistry; Shanghai Scientific and Technical Publishers: Shanghai, China, 1978. [Google Scholar]
  21. Mehlich, A. Mehlich 3 soil test extractant: A modification of Mehlich 2 extractant. Commun. Soil Sci. Plant Anal. 1984, 15, 1409–1416. [Google Scholar] [CrossRef]
  22. Chen, S.F.; Zhou, Y.Q.; Chen, Y.R.; Gu, J. Fastp: An ultra-fast all-in-one FASTQ preprocessor. Bioinformatics 2018, 34, i884–i890. [Google Scholar] [CrossRef]
  23. Li, D.H.; Liu, C.M.; Luo, R.; Sadakane, K.; Lam, T.W. MEGAHIT: An ultra-fast single-node solution for large and complex metagenomics assembly via succinct de Bruijn graph. Bioinformatics 2015, 31, 1674–1676. [Google Scholar] [CrossRef]
  24. Noguchi, H.; Park, J.; Takagi, T. MetaGene: Prokaryotic gene finding from environmental genome shotgun sequences. Nucleic Acids Res. 2006, 34, 5623–5630. [Google Scholar] [CrossRef]
  25. Fu, L.; Niu, B.; Zhu, Z.; Wu, S.; Li, W. CD-HIT: Accelerated for clustering the next-generation sequencing data. Bioinformatics 2012, 28, 3150–3152. [Google Scholar] [CrossRef]
  26. Li, R.; Li, Y.; Kristiansen, K.; Wang, J. SOAP: Short oligonucleotide alignment program. Bioinformatics 2008, 24, 713–714. [Google Scholar] [CrossRef] [PubMed]
  27. Buchfink, B.; Xie, C.; Huson, D.H. Fast and sensitive protein alignment using DIAMOND. Nat. Methods 2015, 12, 59–60. [Google Scholar] [CrossRef] [PubMed]
  28. Oksanen, J.; Blanchet, F.G.; Kindt, R.; Legendre, P.; Minchin, P.R.; O’Hara, R.B.; Simpson, G.L.; Solymos, P.; Stevens, M.H.H.; Wagner, H.H.; et al. Vegan: Community Ecology Package, R Package Version 2.0-10; RStudio: Boston, MA, USA, 2013. [Google Scholar]
  29. Breiman, L. Random forests. Mach. Learn. 2001, 45, 5–32. [Google Scholar] [CrossRef]
  30. Hu, Y.L.; Chen, J.; Hui, D.F.; Wang, Y.P.; Li, J.L.; Chen, J.W.; Chen, G.Y.; Zhu, Y.R.; Zhang, L.Y.; Zhang, D.Q.; et al. Mycorrhizal fungi alleviate acidification-induced phosphorus limitation: Evidence from a decade-long field experiment of simulated acid deposition in a tropical forest in south China. Glob. Chang. Biol. 2022, 28, 3605–3619. [Google Scholar] [CrossRef] [PubMed]
  31. Ma, J.; Ma, Y.L.; Wei, R.F.; Chen, Y.L.; Weng, L.P.; Ouyang, X.X.; Li, Y.T. Phosphorus transport in different soil types and the contribution of control factors to phosphorus retardation. Chemosphere 2021, 276, 130012. [Google Scholar] [CrossRef]
  32. Wu, H.L.; Chen, L.; Ouyang, S.; Zhou, W.N.; Wu, M.G.; Zeng, L.X.; Lei, P.F.; Zeng, Y.L.; Deng, X.W.; Li, S.G.; et al. Phosphorus cycling and supply–demand balance across a chronosequence of Chinese fir plantations. Catena 2023, 228, 107117. [Google Scholar] [CrossRef]
  33. Wan, W.J.; Hao, X.L.; Xing, Y.H.; Liu, S.; Zhang, X.Y.; Li, X.; Chen, W.L.; Huang, Q.Y. Spatial differences in soil microbial diversity caused by pH-driven organic phosphorus mineralization. Land Degrad. Dev. 2021, 32, 766–776. [Google Scholar] [CrossRef]
  34. Meyer, J.B.; Frapolli, M.; Keel, C.; Maurhofer, M. Pyrroloquinoline quinone biosynthesis gene pqqC, a novel molecular marker for studying the phylogeny and diversity of phosphate-solubilizing pseudomonads. Appl. Environ. Microbiol. 2011, 77, 7345–7354. [Google Scholar] [CrossRef]
  35. An, R.; Moe, L.A. Regulation of pyrroloquinoline quinone-dependent glucose dehydrogenase activity in the model rhizosphere-dwelling bacterium Pseudomonas putida KT2440. Appl. Environ. Microbiol. 2016, 82, 4955–4964. [Google Scholar] [CrossRef]
  36. Alori, E.T.; Glick, B.R.; Babalola, O.O. Microbial phosphorus solubilization and its potential for use in sustainable agriculture. Front. Microbiol. 2017, 8, 971. [Google Scholar] [CrossRef]
  37. Chen, X.L.; Chen, H.Y.H.; Chang, S.X. Meta-analysis shows that plant mixtures increase soil phosphorus availability and plant productivity in diverse ecosystems. Nat. Ecol. Evol. 2022, 6, 1112–1121. [Google Scholar] [CrossRef] [PubMed]
  38. He, X.; Augusto, L.; Goll, D.S.; Ringeval, B.; Wang, Y.; Helfenstein, J.; Huang, Y.; Yu, K.; Wang, Z.; Yang, Y. Global patterns and drivers of soil total phosphorus concentration. Earth Syst. Sci. Data 2021, 13, 5831–5846. [Google Scholar] [CrossRef]
  39. Hsieh, Y.J.; Wanner, B.L. Global regulation by the seven-component Pi signaling system. Curr. Opin. Microbiol. 2010, 13, 198–203. [Google Scholar] [CrossRef] [PubMed]
  40. Santos-Beneit, F. The Pho regulon: A huge regulatory network in bacteria. Front. Microbiol. 2015, 6, 402. [Google Scholar] [CrossRef]
  41. Tanuwidjaja, I.; Vogel, C.; Pronk, G.J.; Schöler, A.; Kublik, S.; Vestergaard, G.; Kogel-Knabner, I.; Mrkonjic Fuka, M.; Schloter, M.; Schulz, S. Microbial key players involved in P turnover differ in artificial soil mixtures depending on clay mineral composition. Microb. Ecol. 2021, 81, 897–907. [Google Scholar] [CrossRef]
  42. Brown, M.R.W.; Arthur, K. Inorganic polyphosphate in the origin and survival of species. Proc. Natl. Acad. Sci. USA 2004, 101, 16085–16087. [Google Scholar] [CrossRef]
  43. Ghonsikar, C.P.; Miller, R.H. Soil inorganic polyphosphates of microbial origin. Plant Soil 1973, 38, 651–655. [Google Scholar] [CrossRef]
  44. Kavvadias, V.; Doula, M.; Papadopoulou, M.; Theocharopoulos, S. Long-term application of olive-mill wastewater affects soil chemical and microbial properties. Soil Res. 2015, 53, 461–473. [Google Scholar] [CrossRef]
  45. Naghshbandi, M.P.; Moghimi, H. Chapter Eighteen—Stabilization of phytase on multi-walled carbon nanotubes via covalent immobilization. In Methods in Enzymology; Kumar, C.V., Ed.; Academic Press: Cambridge, MA, USA, 2020; pp. 431–451. [Google Scholar]
  46. Turner, B.L.; Mahieu, N.; Condron, L.M. The phosphorus composition of temperate pasture soils determined by NaOH-EDTA extraction and solution 31P NMR spectroscopy. Org. Geochem. 2003, 34, 1199–1210. [Google Scholar] [CrossRef]
  47. Yao, Q.; Li, Z.; Song, Y.; Wright, S.J.; Guo, X.; Tringe, S.G.; Tfaily, M.M.; Paša-Tolić, L.; Hazen, T.C.; Turner, B.L.; et al. Community proteogenomics reveals the systemic impact of phosphorus availability on microbial functions in tropical soil. Nat. Ecol. Evol. 2018, 2, 499–509. [Google Scholar] [CrossRef]
  48. Qiao, Y.; Wang, J.; Liu, H.M.; Huang, K.; Yang, Q.S.; Lu, R.L.; Yan, L.M.; Wang, X.H.; Xia, J.Y. Depth-dependent soil C-N-P stoichiometry in a mature subtropical broadleaf forest. Geoderma 2020, 370, 114357. [Google Scholar] [CrossRef]
  49. Zheng, B.; Zhu, Y.; Sardans, J.; Peñuelas, J.; Su, J. QMEC: A tool for high throughput quantitative assessment of microbial functional potential in C, N, P, and S biogeochemical cycling. Sci. China Life Sci. 2018, 61, 1451–1462. [Google Scholar] [CrossRef] [PubMed]
  50. Ragot, S.A.; Kertesz, M.A.; Mészáros, É.; Frossard, E.; Bünemann, E.K. Soil phoD and phoX alkaline phosphatase gene diversity responds to multiple environmental factors. FEMS Microbiol. Ecol. 2017, 93, 212. [Google Scholar] [CrossRef] [PubMed]
  51. Paula, F.S.; Chin, J.P.; Schnürer, A.; Müller, B.; Manesiotis, P.; Waters, N.; Macintosh, K.A.; Quinn, J.P.; Connolly, J.; Abram, F.; et al. The potential for polyphosphate metabolism in Archaea and anaerobic polyphosphate formation in Methanosarcina mazei. Sci. Rep. 2019, 9, 17101. [Google Scholar] [CrossRef]
  52. Mundra, S.; Kjonaas, O.J.; Morgado, L.N.; Krabberod, A.K.; Ransedokken, Y.; Kauserud, H. Soil depth matters: Shift in composition and inter-kingdom co-occurrence patterns of microorganisms in forest soils. FEMS Microbiol. Ecol. 2021, 97, fiab022. [Google Scholar] [CrossRef]
  53. Byers, A.K.; Garrett, L.G.; Armstrong, C.; Dean, F.; Wakelin, S.A. Soil depth as a driver of microbial and carbon dynamics in a planted forest (Pinus radiata) pumice soil. Soil 2023, 9, 55–70. [Google Scholar] [CrossRef]
  54. Feng, H.; Guo, J.; Wang, W.; Song, X.; Yu, S. Soil depth determines the composition and diversity of bacterial and archaeal communities in a Poplar plantation. Forests 2019, 10, 550. [Google Scholar] [CrossRef]
  55. Frey, B.; Walthert, L.; Perez-Mon, C.; Stierli, B.; Köchli, R.; Dharmarajah, A.; Brunner, I. Deep soil layers of drought-exposed forests harbor poorly known bacterial and fungal communities. Front. Microbiol. 2021, 12, 674160. [Google Scholar] [CrossRef] [PubMed]
  56. Fierer, N.; Bradford, M.A.; Jackson, R.B. Toward an ecological classification of soil bacteria. Ecology 2007, 88, 1354–1364. [Google Scholar] [CrossRef]
  57. Ling, N.; Chen, D.M.; Guo, H.; Wei, J.X.; Bai, Y.F.; Shen, Q.R.; Hu, S.J. Differential responses of soil bacterial communities to long-term N and P inputs in a semi-arid steppe. Geoderma 2017, 292, 25–33. [Google Scholar] [CrossRef]
  58. Singavarapu, B.; Du, J.Q.; Beugnon, R.; Cesarz, S.; Eisenhauer, N.; Xue, K.; Wang, Y.F.; Bruelheide, H.; Wubeta, T. Functional potential of soil microbial communities and their subcommunities varies with tree mycorrhizal type and tree diversity. Microbiol. Spectr. 2023, 11, e04578-22. [Google Scholar] [CrossRef] [PubMed]
  59. Valentine, D.L. Adaptations to energy stress dictate the ecology and evolution of the Archaea. Nat. Rev. Microbiol. 2007, 5, 316–323. [Google Scholar] [CrossRef] [PubMed]
  60. Turner, S.; Mikutta, R.; Meyer-Stüve, S.; Guggenberger, G.; Schaarschmidt, F.; Lazar, C.S.; Dohrmann, R.; Schippers, A. Microbial community dynamics in soil depth profiles over 120,000 years of ecosystem development. Front. Microbiol. 2017, 8, 874. [Google Scholar] [CrossRef] [PubMed]
Figure 1. Differences in the relative abundance of microbial genes related to P cycling between organic and mineral soil in PLF (a) and LGF (b). PLF represents the Pinus massonianaLithocarpus glaber coniferous and evergreen broadleaved mixed forest, LGF represents the L. glaberQuercus glauca evergreen broadleaved forest. The red stars * represent significant differences between different soil depths for a given gene. The black stars * and *** represent significant differences between the total relative abundance of microbial genes involved in P-mineralization, P-solubilization, and P-starvation response regulation.
Forests 14 01665 g001
Figure 2. Co-occurrence diagrams of the abundance correspondence between samples and species associated with P cycling genes (a) and the proportion of P cycling genes–harboring species distributed in different samples (b). First and second colored circles from outside to inside: the left half of the circle represents the species (phyla taxa) composition corresponding to different samples; different colors represent different species, and the length represents the proportion of abundance of a species in the sample (with the percentage displayed in the second circles). The right half of the circles shows the proportion of different samples in the dominant species; the different colors represent separate samples, and the length shows the proportion of a certain species in the sample (with the percentage displayed in the second circle). The letters a and b indicate significant differences between organic and mineral soil in PLF, as do x and y in LGF. PLF represents the Pinus massonianaLithocarpus glaber coniferous and evergreen broadleaved mixed forest, LGF represents the L. glaberQuercus glauca evergreen broadleaved forest.
Forests 14 01665 g002
Figure 3. Correspondence between species (phyla taxa) and functional (KEGG gene). The contribution of a species indicates the primary species composition for a specific function; the contribution of a function represents the main functions in which a specific species is involved. The contributions are the average of organic and mineral soil. Detailed data are shown in Table S3.
Forests 14 01665 g003
Figure 4. Regression analysis of species [α diversity (a) and β diversity (b)] and functional (KEGG gene) in soil P cycling-related microbes. The α diversity and β diversity of species was calculated at the phyla taxa level. The coefficient of determination (R2) and significance level (p) of the fitted curves are shown.
Forests 14 01665 g004
Figure 5. The relationships between soil microbial P cycling genes and soil P status. The relationship between soil N:P ratio and the relative abundance of all genes involved in soil microbial P cycling (a), and between the relative abundance of all genes involved in soil microbial P cycling and available soil P concentration (b), are shown. Panel (c) shows the significant (p < 0.05) gene predictors of available soil P, which were identified by random forest analysis. The data of organic and mineral soil dates were analyzed together. Soil N:P ratio represents total soil nitrogen concentration divided by total soil P concentration. PLF represents the Pinus massonianaLithocarpus glaber coniferous and evergreen broadleaved mixed forest, LGF represents the L. glaberQuercus glauca evergreen broadleaved forest. R2 represents the coefficient of determination. * p < 0.05, *** p < 0.001.
Forests 14 01665 g005
Figure 6. Schematic diagram of microbial mechanisms underlying soil P cycling in subtropical forests for organic and mineral soil. PLF represents the Pinus massonianaLithocarpus glaber coniferous and evergreen broadleaved mixed forest, LGF represents the L. glaberQuercus glauca evergreen broadleaved forest. The values in % indicate the relative abundance of each phyla taxa.
Forests 14 01665 g006
Table 1. Physico-chemical properties (mean±SD) of organic and mineral soil in the two subtropic forests. The letters a and b indicate significant differences between organic and mineral soil in PLF, as do x and y in LGF.
PLFLGF
Organic SoilMineral SoilOrganic SoilMineral Soil
pH4.54 ± 0.154.69 ± 0.184.17 ± 0.05 y4.46 ± 0.08 x
SOC (g kg−1)75.72 ± 18.54 a23.44 ± 3.32 b73.35 ± 24.05 x28.19 ± 1.47 y
Total N (g kg−1)2.82 ± 0.26 a1.44 ± 0.09 b2.84 ± 0.59 x1.66 ± 0.15 y
NH4+-N (mg kg−1)22.74 ± 5.5115.09 ± 6.3831.98 ± 10.82 x14.29 ± 4.86 y
NO3--N (mg kg−1)14.32 ± 4.78 a2.20 ± 1.78 b15.56 ± 4.97 x3.31 ± 1.03 y
Total P (g kg−1)0.18 ± 0.090.15 ± 0.050.09 ± 0.040.11 ± 0.07
Available P (mg kg−1)2.90 ± 0.52 a1.29 ± 0.30 b3.09 ± 0.37 x1.48 ± 0.32 y
C/N26.80 ± 4.31 a19.65 ± 3.31 b25.81 ± 4.26 x16.94 ± 2.50 y
C/P431.62 ± 176.81157.89 ± 73.24823.20 ± 450.86 x266.93 ± 245.90 y
N/P16.10 ± 7.068.04 ± 3.9531.90 ± 13.30 x15.76 ± 4.28 y
Moisture content (%)49.19 ± 0.03 a30.73 ± 0.02 b53.74 ± 0.06 x36.20 ± 0.11 y
Disclaimer/Publisher’s Note: The statements, opinions and data contained in all publications are solely those of the individual author(s) and contributor(s) and not of MDPI and/or the editor(s). MDPI and/or the editor(s) disclaim responsibility for any injury to people or property resulting from any ideas, methods, instructions or products referred to in the content.

