Article

A Statistical Approach to Macrofungal Diversity in a Mediterranean Ecosystem of the Iberian Peninsula Dominated by the Holm Oak (Quercus ilex L. subsp. ballota (Desf.) Samp.)

by
Abel Fernández-Ruiz
1,2,
José Luis Vicente-Villardón
3,
José Sánchez-Sánchez
1,2,
Prudencio García-Jiménez
1,
Sergio Sánchez-Durán
4,5 and
David Rodríguez-de la Cruz
1,2,*
1
Institute for Agrobiotechnology Research (CIALE), Universidad de Salamanca, Río Duero 12, 37185 Villamayor, Spain
2
Department of Botany and Plant Physiology, Universidad de Salamanca, Licenciado Méndez Nieto s/n, 37007 Salamanca, Spain
3
Department of Statistics, Universidad de Salamanca, Campus Miguel de Unamuno, Alfonso X El Sabio s/n, 37007 Salamanca, Spain
4
Departamento de Ciencia Vegetal, Centro de Investigación y Tecnología Agroalimentaria de Aragón (CITA), Avda de Montañana 930, 50059 Zaragoza, Spain
5
Instituto Agroalimentario de Aragón IA2, CITA-Universidad de Zaragoza, 50013 Zaragoza, Spain
*
Author to whom correspondence should be addressed.
Forests 2023, 14(8), 1662; https://doi.org/10.3390/f14081662
Submission received: 23 June 2023 / Revised: 3 August 2023 / Accepted: 8 August 2023 / Published: 17 August 2023
(This article belongs to the Special Issue Fungal Dynamics and Diversity in Forests)

Abstract

:
The fungal biodiversity associated with a stable plant community appears to vary from year to year. To analyse the annual behaviour in the formation of fruiting bodies, a statistical study of the data obtained for 4 years (2009–2012) in an apparently undisturbed Mediterranean ecosystem dominated by the holm oak (Quercus ilex L. subsp. ballota (Desf.) Samp.), located in the Midwest of the Iberian Peninsula, was carried out. These data were related to the main meteorological variables. The 150 species collected showed a significant annual, monthly, and weekly difference in their fruiting during the collection period. All this implies a variation in the annual fungal fruiting which can modify the moment of when maximum peaks of fruiting appear, their duration, and the number of species that compose them. In addition, the results make it possible to establish an annual behaviour pattern, with sporocarp formation throughout the year and four fruiting groups (two of them in the dry season). They also allow for inferring a possible response to climate change, with a delay in the fruiting of the autumn-winter group and earlier fruit bearing in the winter-spring group.

1. Introduction

How much can fungal fruiting in a given area vary from year to year? Although this question was posed by James Bolton as early as 1788, it seems that it has not yet been fully answered [1]. There is no doubt that the formation of fruiting bodies for a given ecosystem varies over the years, but how and why is not yet fully defined. The dynamics of ecosystems are often complex and non-linear, due to feedbacks between the different components that make up the ecosystem [2] and to the fact that the patterns of variation in fungal distribution and abundance, as well as the possible drivers of these patterns, are insufficiently known [3,4]. Multiple factors can influence fungal fruiting: Habitat destruction [5,6], climate [7,8,9,10,11], vegetation type and forest composition [12,13], natural heterogeneity of resources in the soil matrix [14], the availability of carbohydrates and other nutrients, in particular, nitrogen, phosphorus and potassium [15,16,17], soil pH [18,19,20], human pressure [21], livestock pressure [13,14,15,16,17,18,19,20,21,22] or pollution [23], among others. Changes in environmental conditions can cause many possible responses—critical, gradual or local—in the ecosystem and shift the system from a stable to an alternative state [24]. Thus, adverse weather conditions can affect the biological cycle of fungi and cause the appearance of fruiting bodies to oscillate throughout the year or to even not occur [25]. A reduction in rainfall can cause significant changes in the composition of the mycorrhizal community and in seasonal fluctuations [26].
Fungi play a fundamental role in forest ecosystems [27], they intervene in the carbon and nitrogen cycles by decomposing organic matter, and act directly on the ecological competition of trees and woody plants by interacting as symbionts or parasites [28,29]. Ectomycorrhizal fungi consume a substantial part of the net carbon fixed by trees, and in turn, help them to adapt to environmental changes, due to their short life span and high diversity [30]. Estimating fungal diversity is fundamental to understanding the functioning of a forest ecosystem, but it is only a starting point; understanding how an ecosystem works also requires assessing the relationship of different fungal species according to their form of nutrition, the competencies that occur among the fungi, their fruiting dynamics throughout the year, and what factors influence their development and how.
Fungal diversity is part of ecological competition and is related to the resilience of a given ecosystem [31], where understanding the response of a dynamic system to variations and disturbances becomes a key factor [24]. The stability of the ecosystem depends on the factors that can exert disturbance phenomena. Meteorological variations are possible disturbance factors in forest ecosystems that cause competition and equilibrium among fungi. Fungi help their hosts to adapt to climate changes, and it is advisable to evaluate the influence of weather conditions on fungal fruiting in order to understand how fungi adapt to the ecosystem.
Weather conditions for the Mediterranean basin have changed and are expected to continue to change as a result of anthropogenic climate change [32]. The ecosystem will try to adapt to these new conditions with new inter-species competition and possible colonization by better adapted non-native species, with changes in the mycobiota occurring before changes in the distribution or composition of vegetation take place [33]. Knowing how the main meteorological variables influence fungal fruiting within a forest ecosystem in the Mediterranean area may serve as a basis for developing predictive models on the evolution of fungal diversity and its phenological variation, something very useful in the management and conservation of these ecosystems.
From the weekly collections carried out from February 2009 to December 2012 in a Mediterranean ecosystem presided by the holm oak (Quercus ilex L. subsp. ballota (Desf.) Samp.) in which, with the exception of the meteorological parameters, it seems that none of the factors that could influence the appearance of species have changed, a statistical analysis—univariate and multivariate—of the weeks and species collected was carried out, relating the weekly diversity data to a series of meteorological variables.
The general objective is to try to answer the initial question: how the fungal fruiting varies from year to year in a specific undisturbed ecosystem. The specific objectives of this work are to know and evaluate the inter-annual variability in the formation of fruiting bodies of epigeous macromycetes, to obtain criteria of their seasonal and annual behaviour, to understand the ecology of fruiting patterns of different species, and the possible effect of meteorological variables on fungal fruiting.

2. Materials and Methods

2.1. Study Area

The specimens were collected in a forest formation known as La Orbada forest, located in the central-western part of the Iberian Peninsula (41°8′0.48″ N, 5°29′0.01″ W). It is a group of plots of Mediterranean holm oak forest with a flat orography at an altitude of 820–856 m above sea level (m.a.s.l.). The climate is dry and Mediterranean with a clear continental nuance, induced by the combined effect of altitude, longitude, and orographic isolation [34], characterized by a dry season of 2 months, an annual thermal oscillation of more than 17 °C, and an annual precipitation of 372 mm. [35].

2.2. Data Collection

The experimental design consisted of a weekly line transect sampling from February 2009 to December 2012. This is a qualitative study, in which the presence or absence of a species is assessed [36], and mainly referred to for naming and classification. Fernandez et al. [37] provide more information on the study area, data collection, location map, and species inventory.

2.3. Meteorological Data

The meteorological data were provided by the Arabayona SA101 weather station, belonging to the Castile & Leon InfoRiego System Network [38], located in Arabayona, Salamanca (41°2′53″ N, 5°22′54″ W, 850 m.a.s.l.). The station was chosen since it is only 12 km away from the study area, at a similar height, and there are no orographic barriers in between. The meteorological variables analysed were the following: Average weekly temperature, Maximum weekly temperature, Minimum weekly temperature, Average weekly humidity, Average weekly wind speed, Average weekly wind direction, Average weekly radiation, and Average weekly precipitation. In addition, from these data, the Average weekly temperature 2 weeks prior to the collection and the Accumulated precipitation in the 4 weeks prior to the collection were calculated. All data can be found in Table S1.

2.4. Statistical Procedure

The initial information was organized in a binary data matrix with 209 rows, corresponding to the weeks of the study, and 150 columns, corresponding to the species sampled. The value 0 was assigned when the species was absent and 1 when it was present in each of the weeks. The present data of the taxa obtained in each transect were related to the meteorological variables of the weeks studied. Three nominal variables have been added to the matrix coding the year, month, and sampling season considering that all nominal variables would be useful for the interpretation of the techniques.
A multivariate ordination analysis was performed through a Principal Coordinates Analysis (PCA) using a similarity coefficient that took into account the binary nature of the data (Dice coefficient). An analysis of the differences between years using the ANOSIM method [39] was also carried out. In order to include more factors, the Analysis of Variance based on permutations of the distance matrix (ADONIS) proposed by Anderson [40] was used. In the PCA, the points are identified in a weekly scatter plot with the combination of both variables. January 2009 is not represented since there are no data available, nor other combinations in which no specimens were found in the corresponding weeks.
The analyses have been performed with R [41] using the vegan [42] and MultBiplotR [43] packages, and the MultBiplot [44] package. For the representation of the species in the figures, the first three letters of the generic name and the first three letters of the specific epithet are indicated.

3. Results

During the 209 weeks of study, fruit bodies of 150 species were collected (Table S2), the most frequent being Astraeus hygrometricus (Pers.) Morgan, Stereum hirsutum (Willd.) Pers. Leccinellum lepidum (H. Bouchet ex Essette) Bresinsky & Manfr. Binder, Clitocybe gibba (Pers.) P. Kumm, Laccaria laccata (Scop.) Cooke, Lepista nuda (Bull.) Cooke, Russula fragilis Fr., Amanita citrina Pers., Lactarius chrysorrheus Fr., Tricholoma scalpturatum (Fr.) Quél., Clitocybe odora (Bull.) P. Kumm., and Tricholoma sulphureum (Bull.) P. Kumm. Less frequent were Tarzetta gaillardiana (Boud.) Korf & J.K. Rogers, Tricholoma orirubens Quél., Sarcoscypha coccinea (Gray) Boud., Limacella illinita (Fr.) Maire, Gyroporus castaneus (Bull.) Quél., Entoloma clypeatum (L.) P. Kumm., Aleuria aurantia (Pers.) Fuckel, Amanita asteropus Sabo ex Romagn. or Amanita boudieri Barla.

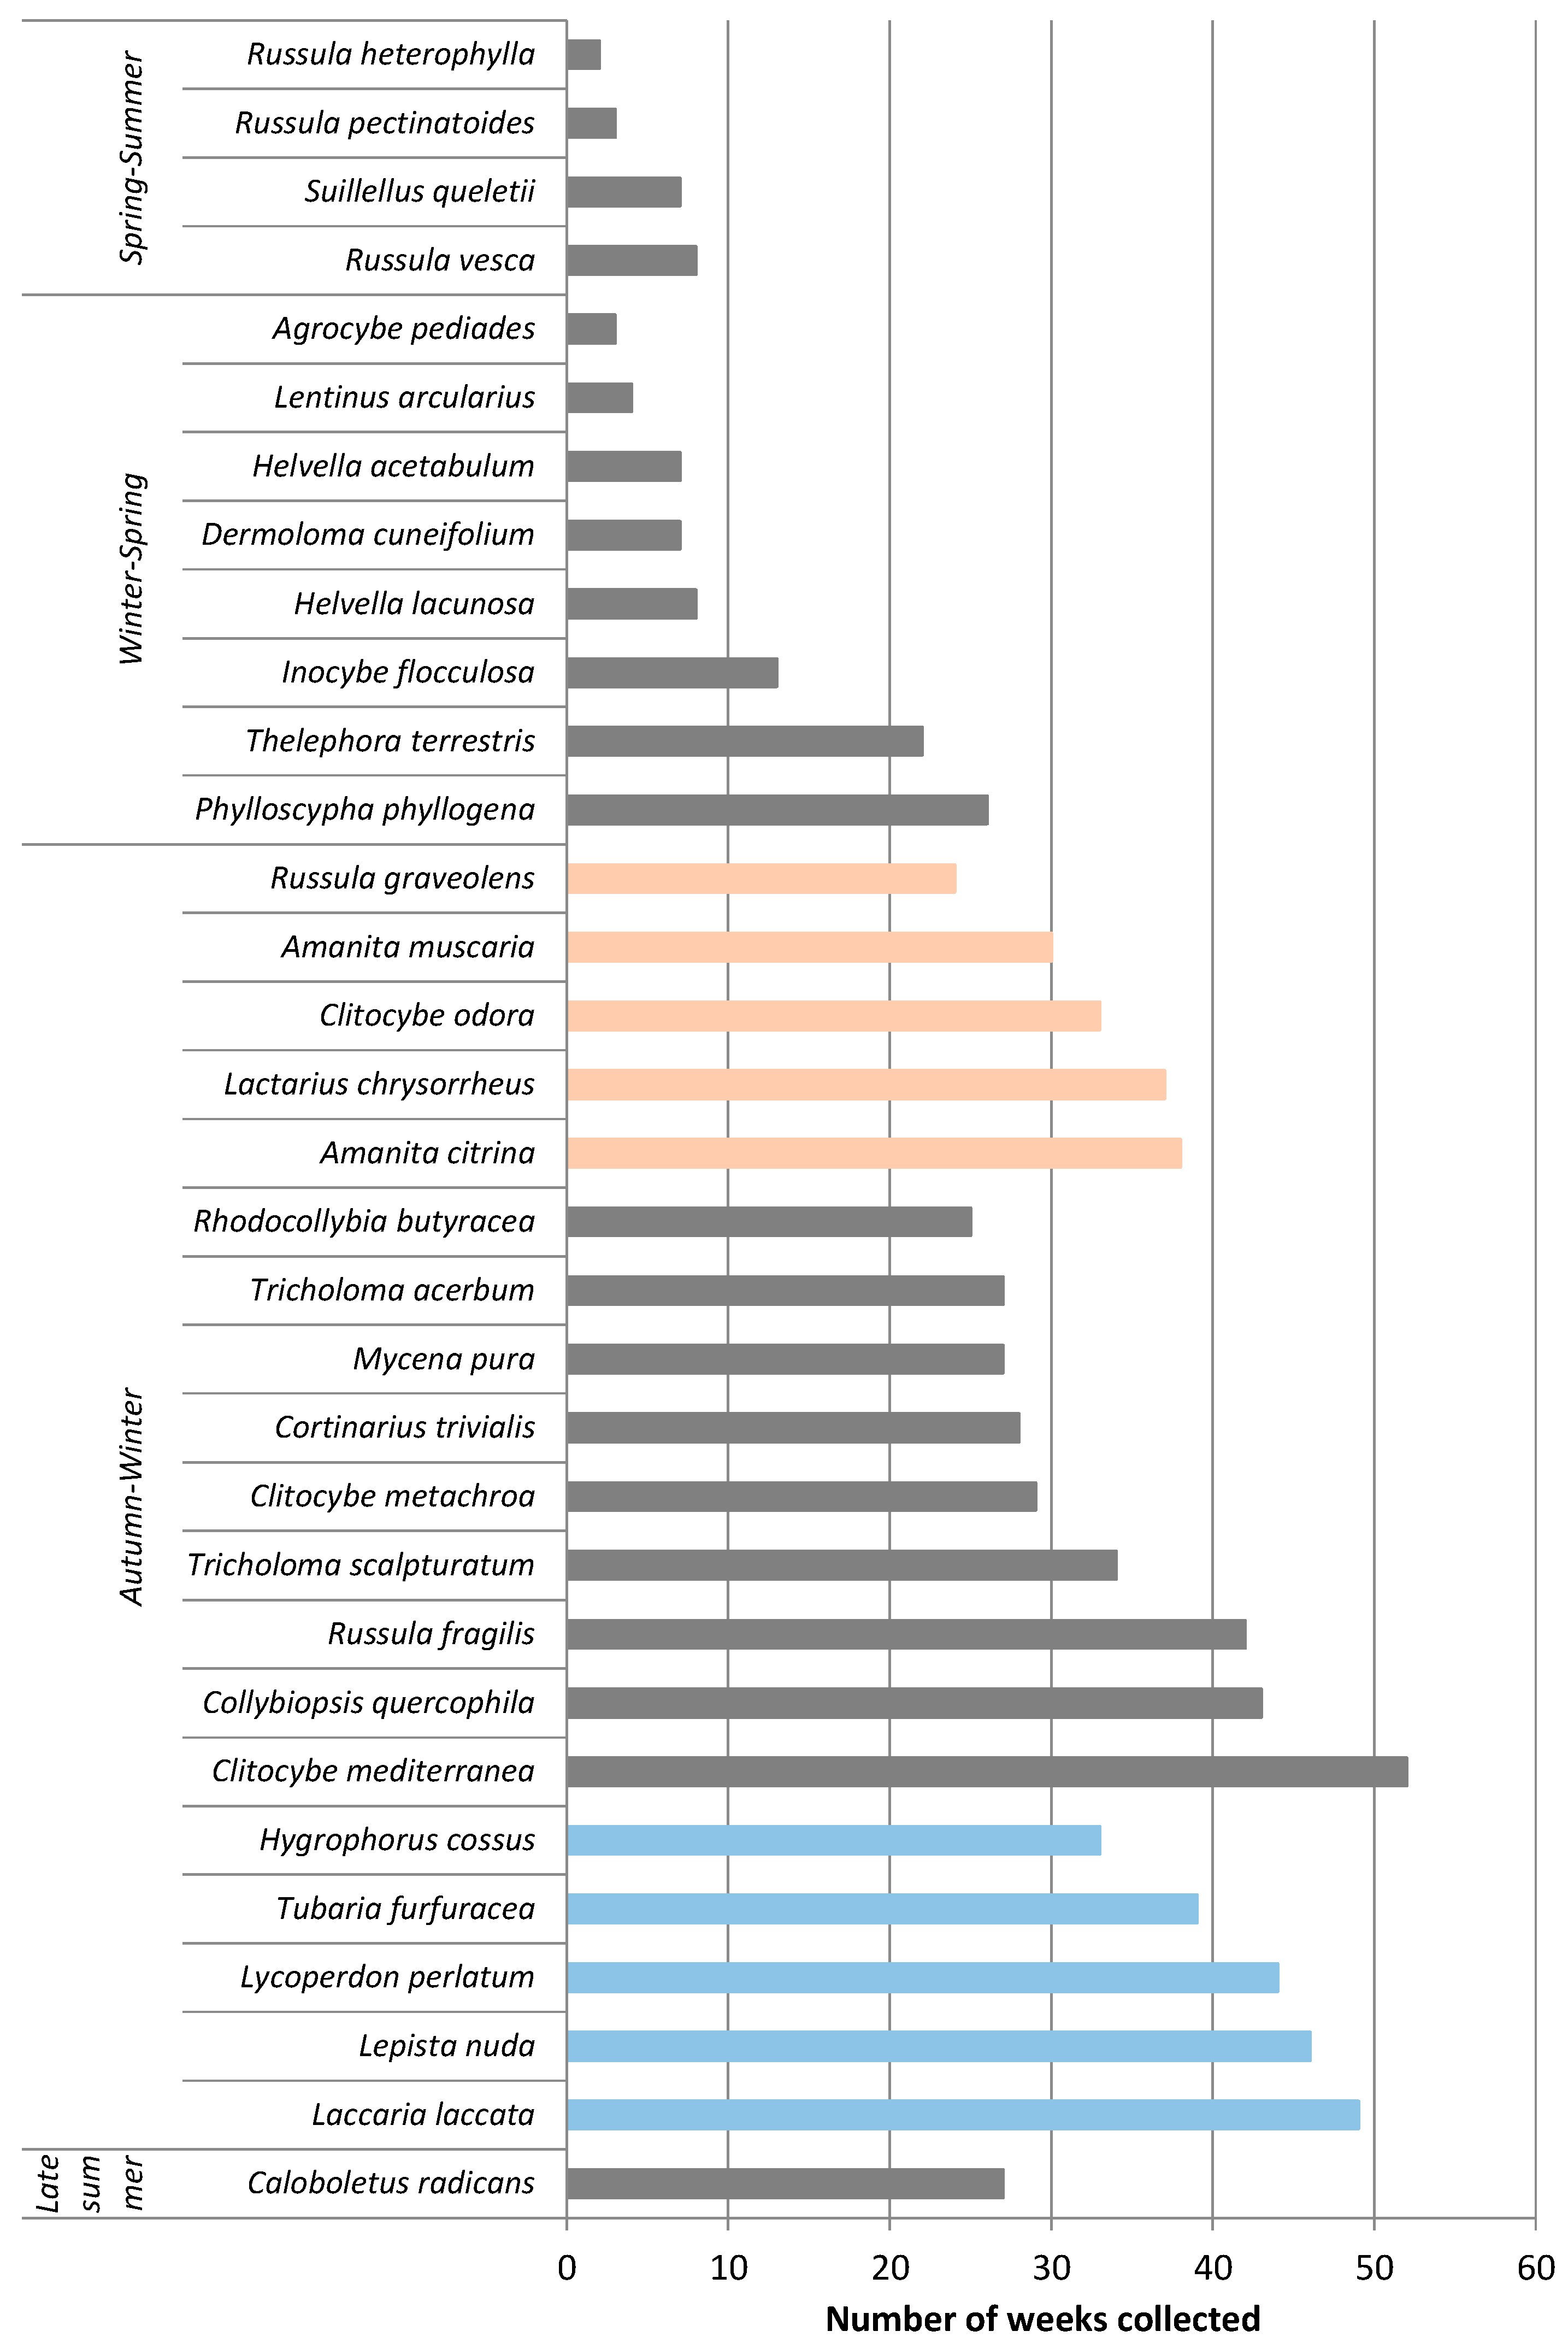
3.1. Univariate Analysis

If we group the number of species collected weekly by month and year according to the meteorological year (Figure 1), we obtain a general pattern of fungal fruiting for the La Orbada forest, where we observe a maximum wave of fungal fruiting in November, December, and January, linked to a smaller and shorter spring wave (April), as well as continuous collection throughout all the months of the year. The figure seems to indicate that there are fundamental differences in fungal fruiting year after year, that the months do not behave in the same way for all years, and that there is possibly an interaction between years and months. We will use this hypothesis as a basis for the multivariate study.

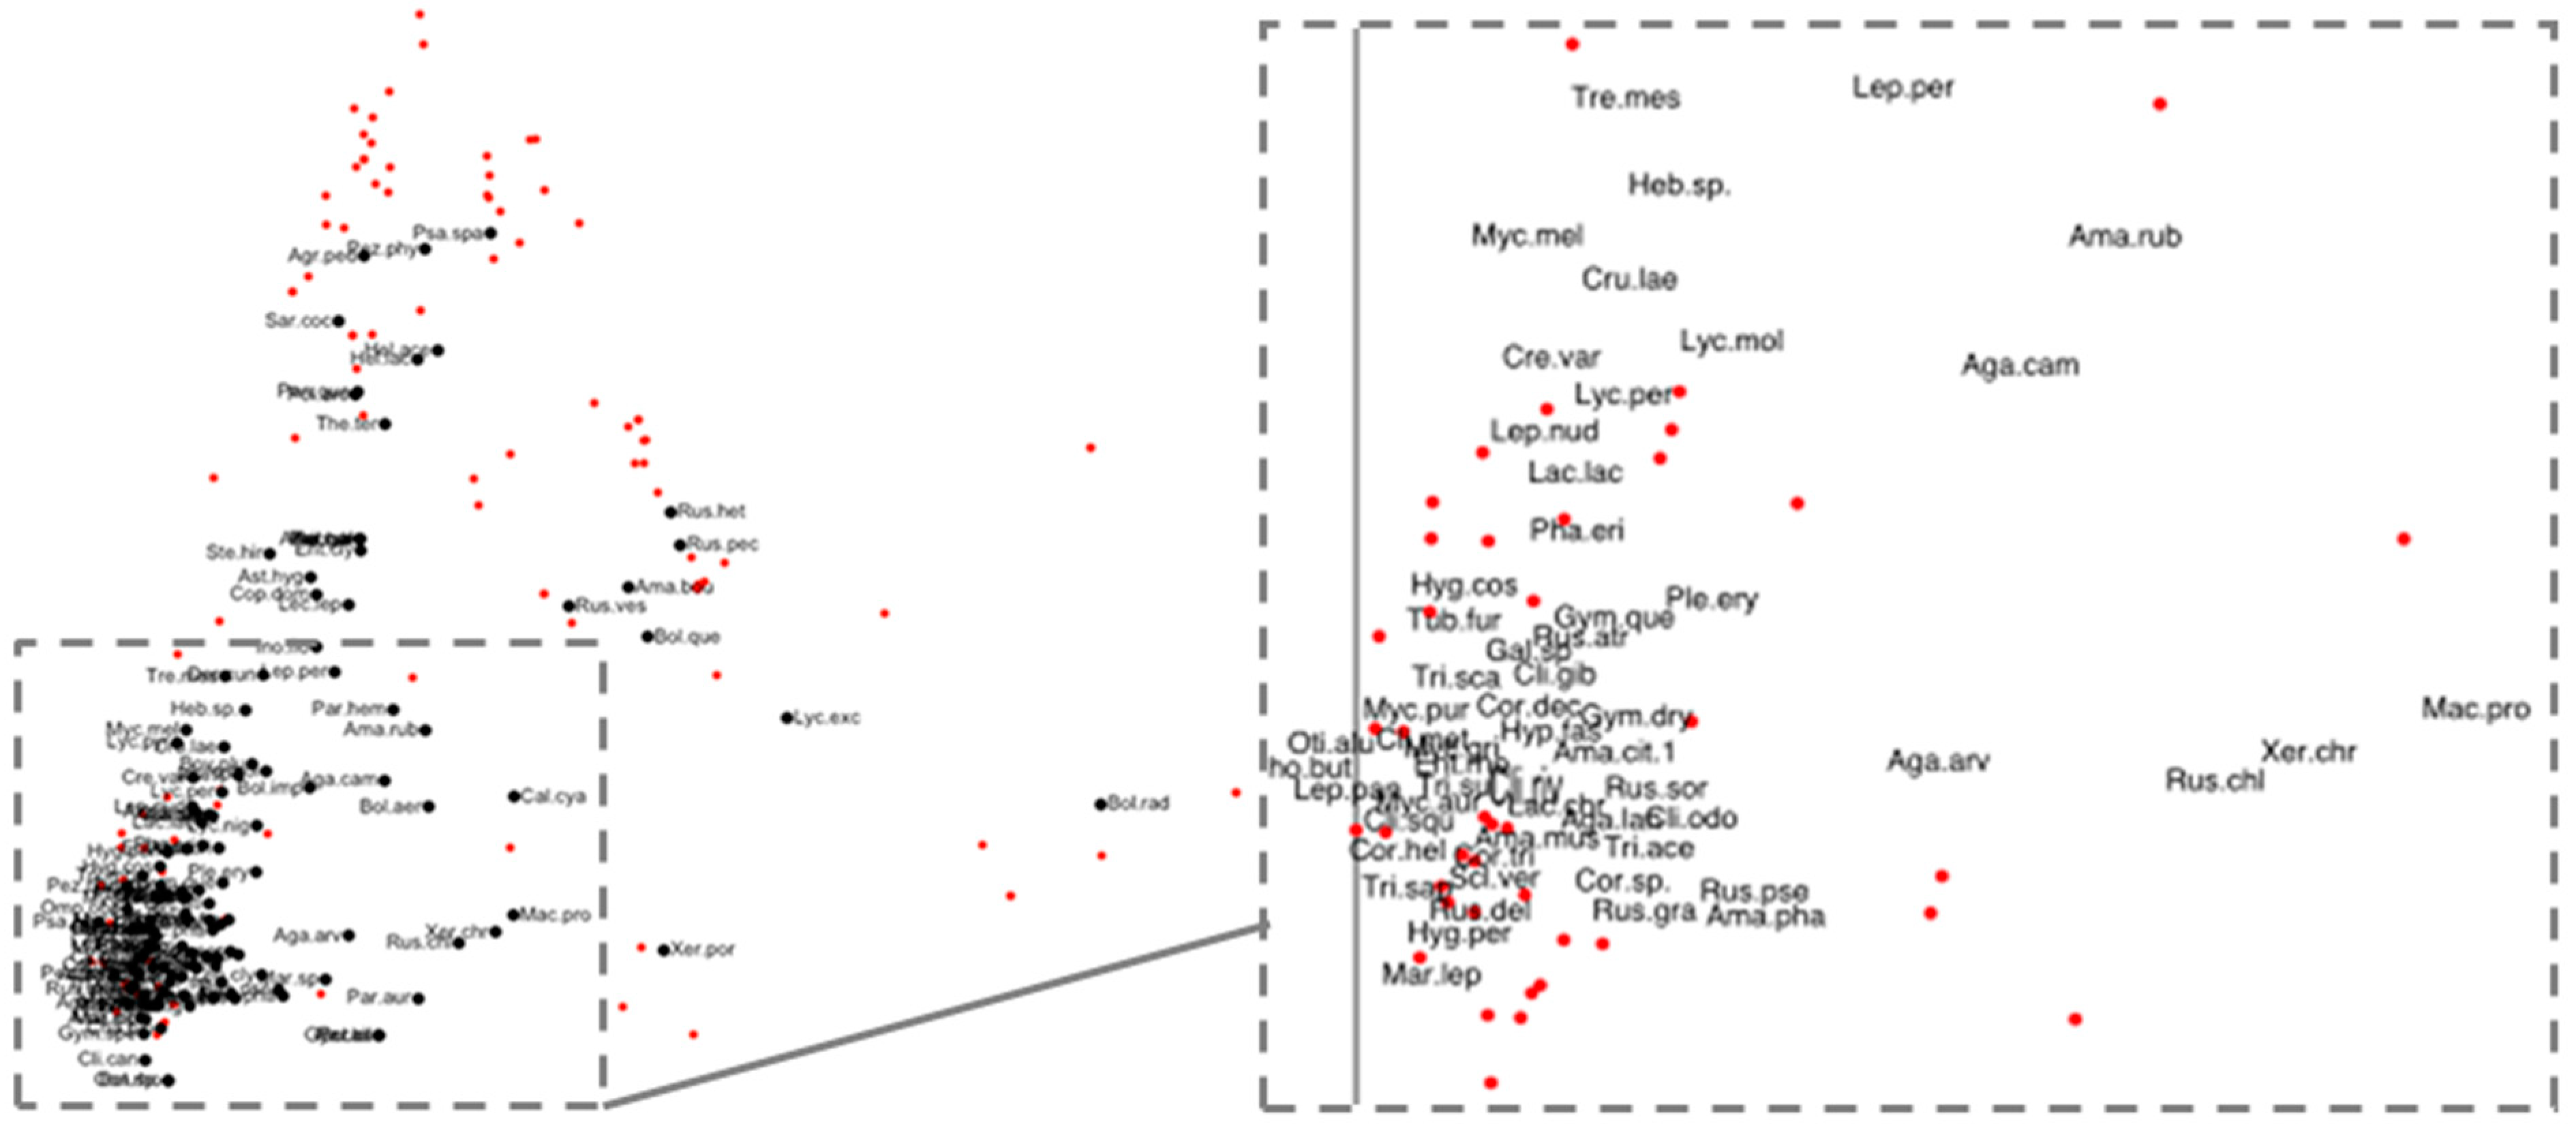
3.2. Multivariate Analysis

The hypothesis that there is an interaction between months and years was demonstrated through non-parametric methods of Analysis of Variance based on similarities and distances. In order to make the data comparable, 63 weeks in which no specimens were found were eliminated. It was verified that there was a statistically significant difference between the years (R = 0.064; p = 0.001; Figure S1).
To include more terms in the model, in order that we can identify not only the effect of years but also that of months and the interaction between years and months, we applied Analysis of Variance on a distance matrix with 999 permutations. The existence of a statistically significant effect of year (F = 7.4846; p = 0.001), month (F = 16.4994; p = 0.001), and the interaction between them (F = 2.6325; p = 0.001) were verified.
The existence of significant differences among the different weeks was verified in a Principal Coordinates Analysis (PCA). The first two main coordinates account for 30.02% of the variability (Table S1).
Figure 2 shows a graphical representation of the weeks by means of a PCA, showing four patterns of behaviour, four isolated groups of weeks with very little similarity among them and among the species collected in each of those weeks. Group A is located in the lower left corner and is formed by a large number of weeks of great similarity (short distances), in which two subgroups are distinguished: one located in the upper part, around week 154 which would be the centroid, and another in the lower part, around centroid week 204. Group B is located in the upper region of the graph, is less numerous than the previous one, and is composed of more distant and less homogeneous weeks in terms of the species that make up the group. It seems to be divided into two subgroups that are organized around different centroids, week 174 for the left subgroup and week 167 for the right one. The third group, C, appears in the central right, is made up of a small number of weeks that are quite dispersed and implicitly different in their composition. Finally, group D, at the bottom right of the graph, is made up of a very small number of weeks and is quite separate from the rest of the groups. Table 1 shows taxa collected in centroid weeks from the groups established in the PCA for weeks.
On the scatter plot obtained in Figure 2, some additional features of the data were represented: the month to which they belong (Figure 3), the season (Figure 4), and the year (Figure 5). The points have been coloured according to the values of those variables. For Figure 3, Figure 4 and Figure 5, the set of points in each group has been represented by its convex envelope, namely, the smallest (convex) polygon containing all the points in the group.
When identifying the points according to the month to which they belong (Figure 3), it can be seen that there is a correlation with the week groups described in Figure 2. Group A would correspond to the month of December, the most homogeneous one, while the overlap of this month with the months of November and January would include the lower and upper subgroups, respectively. Group B, in the upper part, would be included in the months of March and April, which appear overlapped, while the weeks of February included in the group would correlate with the left subgroup. Group C, in the central right-hand part, would correspond to the months of May, June, and July and group D to the months of August, September, and some weeks in October.
The pattern of week behaviour varied greatly across months, with December being the most homogeneous, least dispersed month, while October, January, and February were the most variable. October included very distant weeks that can be similar in composition to any of the four groups described. January, on the other hand, acted as a link between groups A and B; although most of its weeks were similar and close to those of December, it had other very distant weeks (with different species composition) that were within group B. A circular succession of months was observed.
Figure 4 shows the seasons of the year. The same circular succession described in Figure 3 and a partial overlap between the seasons can be seen, and none of the groups defined can be included in a single season. It can be inferred that the weeks within the seasonal juxtapositions have the same behaviour and a similar composition. Thus, autumn describes group A while winter intervenes in the distribution of the higher subgroup. Group B always belongs to spring, although some weeks of winter can be very similar to the spring weeks, which could explain the left subgroup. Group C is formed by the intersection of the four seasons and group D may belong to summer or autumn.
Autumn was the least predictable season and, in terms of fungal composition, its weeks may be similar to any of the other three seasons.
If we identify the points with the year they belong to (Figure 5), it is deduced that the four groups are not always included, and that, moreover, they are not constant throughout the years. The year 2010 does not encompass group D, which indicates that during 2010 no species were collected during those weeks. For their part, all groups are included in 2011 and 2012, but during 2009, a year with a more differentiated behaviour, the weeks at the top of group B were left out, since it did not include the month of January (the study began in February) and, especially, since very few specimens were collected in spring 2009. The year 2011 is the widest in area, although it does not include the lower subgroup of group A, and 2012 does not encompass the most distal weeks of group A or the most distal weeks of group B. It seems to be inferred that the weeks at the ends of the figure, made up of group D weeks, the most distal ones from group A and the most distal from group B, especially those belonging to the left subgroup, were the most affected by the years.
Once the behaviour of the weeks has been described, we tried to interpret which species are responsible for the week sorting. To perform this, an ordering diagram was created in which the weeks and the species appear simultaneously. The species are placed as the mean of the coordinates of the weeks in which the species is present. This way of proceeding, which is not usual, is justified by analogy with Correspondence Analysis, in which the species can be placed as weighted means of the places to approximate a Gaussian response model.
Figure 6 shows four groups of responsible taxa that correspond to the groups obtained in the PCA distribution for the ordering of weeks (Figure 3). These groups are quite far apart that they seem to indicate fruiting restricted to a certain time of year.
Taxa responsible for the ordering of group A are grouped in a very dense area composed of many species; they are taxa that are included in most weeks of the group, very homogeneous in their composition. They are typical autumn fruiting species [45,46], among which are Lepista nuda (Bull.) Cooke, Amanita citrina var. citrina Pers., Cortinarius trivialis J.E. Lange, Collybiopsis quercophila (Pouzar) R.H. Petersen. or Hygrophorus cossus (Sowerby) Fr. The taxa responsible for groups B and C are less numerous and appear more distant from each other than those responsible for group A, which implies that their weekly collection was not constant. The species responsible for group B, described by various authors as fruiting in springtime [45,46], include: Agrocybe pediades (Fr.) Fayod, Phylloscypha phyllogena (Cooke) Van Vooren, Psathyrella spadiceogrisea (Schaeff.) Maire., Sarcoscypha coccinea (Gray) Boud, Helvella acetabulum (L.) Quél., and Helvella lacunosa Afzel. The species that define group C are: Russula heterophylla (Fr.) Fr., Russula pectinatoides Peck, Russula vesca Fr., Amanita boudieri Barla and Suillellus queletii (Schulzer) Vizzini, Simonini & Gelardi (=Boletus queletii Schulzer). Group D is defined by a single species, Caloboletus radicans (Pers.) Vizzini.
In addition, there were several responsible species, far from each other, which did not correspond to the groups described for the week sorting, but which seemed to gather around group A. These are taxa that could also be collected in other groups even though they were collected in some of the weeks belonging to group A, where the probability of fruiting depended on the distance toward those groups.
Thus, taxa located between groups A, B, and C, such as Stereum hirsutum (Willd.) Pers., Tremella mesenterica Retz., Leccinellum lepidum (H. Bouchet ex Essette) Bresinsky & Manfr. Binder, Thelephora terrestris Ehrh., Amanita rubescens Pers. or Astraeus hygrometricus (Pers.) Morgan, could appear within weeks belonging to all three groups. The same applies to taxa located between groups A and D, such as Calvatia cyathiformis (Bosc) Morgan, Macrolepiota procera (Scop.) Singer, Xerocomellus chrysenteron (Bull.) Šutara or Xerocomellus porosporus (Imler ex Watling) Šutara.
Figure 7 shows an external Biplot in which the values of the meteorological parameters analysed at each of the points obtained within the ordination by weeks for the PCA are estimated by adjusting a regression. The enlarged autumn-winter group is shown on the left.
A projection of the points on the water-related vectors (humidity, accumulated precipitation during the previous 4 weeks, and weekly precipitation) showed a high positive correlation between the three vectors and the appearance of species in the different groups described in Figure 3, although the response to the meteorological variables differs with the group. At this same point, it is evident there was a close correlation between high relative humidity and high rainfall accumulated during the previous 4 weeks with the weeks of group A (autumn-winter peak), while weekly rainfall presented a greater correlation with the weeks of group B (winter-spring wave). In contrast, group C (spring-summer) presented a close correlation with the three variables in a lower range, especially with the accumulation of precipitation, and group D (summer-autumn) would be correlated with the scarce precipitation associated with that period.
The variables related to temperature (Average temperature, Maximum temperature, Minimum temperature, and Average weekly temperature 2 weeks before collection) were highly correlated, with closely grouped projection lines and acute angles, and can be considered as a single vector when studying the correlations. A not very significant correlation was inferred between low temperatures and the appearance of fungi for groups A and B. Groups C and D, on the contrary, were favoured in a very significant way by the increase in variables related to temperature. The wind direction, where 0 represents north, showed that southwest winds (200) correlated with group A, while winds with a greater south component were more related to groups B and C. Group D showed no correlation with the wind direction.
The average weekly wind speed was almost parallel to solar radiation. Low solar radiation and wind speeds correlated closely with the weeks in group A, while lower values correlated with group C. Groups B and D were less influenced by these two variables.

4. Discussion

Fungal fruiting in the study area takes place during all months of the year, with the moments of greatest diversity being grouped into two seasonal peaks with a normal distribution (Figure 1). According to the multivariate analysis carried out, there are four fruiting waves, with a significant difference among years (Figure S1), between months and years studied and among weeks of collection (Table S3), which implies a variation in the annual formation of fruiting bodies; this can modify the moment of appearance of the waves, their duration, and the number of species that make them up. From these data, the diversity of macromycetes over all months should not be obtained by averaging for all years and vice versa, nor can it be calculated in a single year, but requires several years to record most of the present species, as indicated by other studies of fungal diversity [47,48,49,50].
The PCA for the weeks (Figure 2) shows the existence of four widely separated fruiting groups (A, B, C, and D) that can be considered as independently fruiting populations, with a minimum probability of occurrence of each of their constituent taxa outside their group.
Group A represents the maximum peak of fruiting obtained in the univariate analysis (Figure 1). It consists of a large number of weeks of very homogeneous composition (Figure 2) distributed in two subgroups; it appears in autumn-winter (Figure 4) and it extends from November to January (Figure 3). Although the month of December (Figure 4), with concentrated and very homogeneous weeks throughout the study, would explain the general behaviour of the group, we have to take into account that it is the areas of intersection with the months of November and January that seem to be responsible for the behaviour pattern of the subgroups. The lower subgroup would correspond to the juxtaposition area of the months of November and December, while the upper subgroup, with more wintery features and fruiting occurring later on, would match the intersection area of December and January. All this seems to indicate that there is a correlation between the formation of fruiting bodies and the months of December analysed (Figure 3) and when these vary or other months are similar to them, the week centroids deviate and the subgroups appear. If we take into account the implicit environmental conditions associated with a given month, it seems to be deduced (Figure 4) that the months of December with more typically winter parameters make the group A deviate toward the upper part of the figure. In contrast, the months of December with more autumnal weather conditions make it deviate toward the lower group. These results are confirmed by applying the external Biplot of meteorological variables (Figure 7), which also shows the existence of a close correlation with an accumulation of rainfall in the weeks prior to collection and with a low wind speed, which is probably related to an increase in soil moisture. However, there is less correlation with temperature (average, maximum, minimum, and average in the 2 weeks prior to collection), although the group is favoured by average temperatures below 10 °C. Low solar radiation, associated with the time of year, and of winds from the southwest, which we associate with the entrance of storms with rain [51], have a great influence on fruiting.
Group B represents a winter-spring fruiting period (Figure 1). This period is constant throughout the study (Figure 5) and has a high correlation with occasional rainfall and average temperatures between 9 °C and 13 °C to a lesser extent. Its duration in time is shorter than the previous one, showing a spring maximum, and 2 months, March and April, which could explain the general behaviour of the group. Weekly collections are not homogeneous and the number of taxa collected is small, from 2 to 10 (Table 1). The species responsible for the weekly order are not as reliable as those of the autumn-winter group. They are indicator species with high fidelity, but with a low weekly collection frequency.
The behaviour of the species collected in the period with water scarcity and high temperatures, characteristic of the Mediterranean climate [34], differs, with two short fruiting periods. The first is more abundant and appears at the beginning of the dry season. This is a third annual fruiting that remains stable throughout the study (Figure 5). It occurs at the intersection of spring and summer (Figure 4) and can be explained by the month of June (Figure 3). This behaviour was observed by other authors [52], who link it to climate change and indicate that various mycelium can be as active in spring as in autumn. In the study area, the species responsible for the week sorting are all mycorrhizal and belong to the genera Russula Pers., Amanita Pers., and Suillellus Murrill. The species of the spring-summer wave are correlated with average values of all the meteorological variables studied, which seems to provide them with stability in fruiting as they are less influenced by the annual variations of the factors, although there seems to be a certain relationship with the accumulation of precipitation [53], average temperatures around 13 °C, and winds from the south. On the contrary, the second summer fruiting, later and overlapping with autumn (Figure 4), is highly correlated with weekly precipitation, generally in the form of storms, and with high temperatures, average maximum temperatures above 30 °C, and average temperatures above 15 °C. This group is represented by a single mycorrhizal taxon, Caloboletus radicans (Pers.) Vizzini, which is limited to the months of August, September, and October (Figure 3 and Figure 6). The mycological indicators based on the nutrition form of the fungi show, according to our study, an increase in the percentage of mycorrhizal taxa, from 51% in May to 72% in June possibly as a result of the phenology and vegetative rates of holm oak and accompanying shrubs [54]. Local abiotic variables are important factors in the composition of the saprophytic mushroom community [20]. On the other hand, the way a fungus obtains carbohydrates may explain a substantial fraction of the ECM fruiting phenology, which may make a differential contribution to the community structure of fungus-associated organisms [55].
An adequate collection method is required to understand the structure of fungal diversity at scales suitable for conservation planning. This method should take into account all fruiting periods, as the taxa occurring in the dry season are mainly mycorrhizal and have great relevance for water availability in these water-deprived periods [56]. The dispersion of the weeks comprising the last three groups described (Figure 2) and the small number of taxa collected in these weeks could suggest methods with a weekly collection frequency.
The distance among the various groups, with different collection times, allows us to infer that most species bear fruit in a single group. However, it is clear that there is an annual circular succession (Figure 3 and Figure 4), with many weeks appearing distant from the four groups described and a series of species responsible for those weeks. These would be taxa capable of fruiting in more than one group, such as Macrolepiota procera (Scop.) Singer, with constant early autumn fruiting but which can also appear in the autumn-winter group and in the second summer group, or a series of taxa situated among autumn-winter, winter-autumn, and first-summer fruiting, such as Stereum hirsutum (Willd.) Pers. and Astraeus hygrometricus (Pers.) Morgan, which act as a link between fruiting waves. In some cases, a higher frequency of basidiomata in surveys could be related to a higher basidiomata production, as in the case of Astraeus hygrometricus (Pers.) Morgan [57], which is usually found in slightly degraded Mediterranean forest ecosystems [58]. In other cases, it could be due to its wide plasticity to degrade woody debris, as in the case of Stereum hirsutum (Willd.) Pers. The fruiting bodies of this species can be found over long periods of time withstanding short periods of drought in Mediterranean environments [59,60].
From the scatter diagrams and the total weekly collection frequency, we can characterise the pattern of fungal fruiting and the responsible taxa for the study area (Figure 8).
Climate models predict an increase in average temperature, with a potential decrease in annual rainfall and dramatic changes in its distribution, with rainfall concentration, in the Mediterranean basin during the 21st century [32]. These are climates that can produce an increase in the potential area of the holm oak groves [61] and that could cause significant changes in the composition of the fungal community without effects on the overall richness of the mycorrhizal community [26], with a possible increase in growth rates and alteration in the distribution of mycorrhizal species with an advantage for generalist mycorrhizae [62], delays in autumn fruiting, early spring or shorter duration of fruiting [7,8,9]. The projections of the meteorological variables studied seem to corroborate that the new conditions will modify the fruiting waves. An increase in global temperature will increase enzymatic activity, but also dehydration, fine root mortality, and microbial respiration rate [63], with an increase in the rate of organic decomposition [64]. According to our data, phenological changes will occur, with a delay in autumn-summer fruiting and an anticipation of winter-spring fruiting, results similar to those obtained by Kauserud et al. [8], when analysing herbarium collections during the last four decades. With higher temperatures, there will be a shift of the two waves toward the winter weeks and an increasing overlap between them. In addition, the fruiting of the two minority groups linked to the dry season (spring-summer and summer-autumn) will be favoured as long as the increase in temperature is not drastic and fruiting does not occur [47].
Additionally, a decrease in precipitation would reduce soil moisture [65], carbon exchange [66], and soil enzymatic activity, consequently effecting phosphorus, carbon, and nitrogen cycles [67,68]. Thus, abundant annual precipitation would be necessary for fruiting to occur [69]. The correlation of fruiting waves with water-related variables is very close, but there are differences among them. As a result, four groups of taxa can be established: autumn-winter, with species that would need high accumulated precipitation; winter-spring, which would be associated with abundant occasional precipitation; spring-summer, related to average accumulated precipitation; and summer-autumn, related to scarce and occasional precipitation. A decrease and concentration of rainfall would negatively influence autumn-winter fruiting, with taxa linked to high accumulated rainfall. This would then favour species in the lower subgroup, which are mainly mycorrhizal taxa and less influenced by this variable, such as: Amanita citrina var. citrina Pers., Amanita muscaria (L.) Lam., Lactarius chrysorrheus Fr., Clitocybe odora (Bull.) P. Kumm., and Russula graveolens Romell (marked in orange in Figure 9). In turn, the species responsible for the upper subgroup, such as Lepista nuda (Bull.) Cooke, Lycoperdon perlatum Pers., Laccaria laccata (Scop.) Cooke, Hygrophorus cossus (Sowerby) Fr., and Tubaria furfuracea (Pers.) Gillet, with a predominance of saprophytes (marked in blue in Figure 8) would become less abundant. In addition, the decrease and concentration of precipitation would favour the winter-spring wave, which is more influenced by occasional precipitation, although these conditions will have a lesser effect on summer fruiting.
Climate variables cannot be considered independently, since their effects on fungal fruiting are complex and are due to the interaction of all of them, together with other abiotic factors such as soil. Soil fungal diversity shows an increasing trend with increasing habitat fragmentation [70], a process that has occurred in Mediterranean ecosystems. It should also be taken into account that responses vary according to the species [71]. Knowing how symbiotic fungi, saprophytes, and pathogens achieve their lifestyle is crucial to understanding their ecological functions and their impact on plant communities [72]. Saprophytic fungi are more influenced by abiotic factors such as soil nutrients or moisture variations [73]. Our results are in line with those by Birgander et al. [74], who showed a decrease in the proportion of saprophytic taxa at the beginning of summer, with no fruiting in the central summer months (Figure 9). The combination of high temperatures and low rainfall associated with climate change could prevent saprophytic fungi from fruiting for a longer period of time, with a possible decrease in organic decomposition and variation in the composition of the fungal community of the leaf litter, determined by the dominant tree species [20]. On the other hand, the highly programmed reproduction of ECM fungi could reflect temperature-dependent increases and drought-induced decreases in photosynthetic activity in host plants, rather than improved growth conditions for fungi during the summer [55]. On the other hand, the specific ecological tolerance of mycorrhizal fungi adapted to the combination of these adverse weather conditions, such as Russula pectinatoides Peck, Boletus queletii Schulzer or Caloboletus radicans (Pers.) Vizzini, may favour their competitive interaction within the fungal community, affecting the composition of these communities and favouring their resilience to the invasion of other fungi [62].
Meteorological variables seem to explain the four fruiting waves described for an apparently undisturbed holm oak forest comprising trees of a similar age. However, these variables would not explain the differences found in diversity among weeks and fruiting waves. There must be other parameters, influenced directly or indirectly by the meteorological variables, responsible for the different fruiting of species and their diversity. For example, the concentration of ergosterol in the soil would be related to the composition of the ectomycorrhizal community [75,76] and the concentrations of nitrogen [17,77], calcium, and phosphorus [78]. Soil factors could be responsible for the distribution of fruiting in the landscape [79], which in turn, is related to the availability of nitrogen [77]. Dissolved organic nitrogen (DON) levels establish a dominance over mineral forms in the growing season and could favour the emergence of spring species, while xerophytic taxa, such as Caloboletus radicans (Pers.) Vizzini, could take better advantage of the mineral forms of nitrogen (nitrates and ammonium), which are dominant during the Mediterranean summer [19]. ECM species composition correlates with increasing rates of nitrogen mineralisation [80]. The variation of factors affecting an ecosystem may cause a wide variety of responses [81]. The concentration of ergosterol in the soil could be related to the composition of the ectomycorrhizal community [75], just as the age of dominant vegetation could influence sporocarp production and diversity [82].
Fungal populations are shaped by plant communities and environmental parameters, and in turn, fungal communities impact the forest ecosystem through intrinsic participation of different fungal guilds [83]. Mycorrhizal fungi depend on their hosts [84], as can be demonstrated in experimental defoliation [85]. It will be the tolerance of the holm oak—Quercus ilex L. subsp. ballota (Desf.) Samp—to new weather conditions and to variation in the fungal community, which may lead to a weakening of the host and favour the presence of pathogens [86,87], that is responsible for dramatic and rapid changes in fungal diversity.

5. Conclusions

The multivariate study of the data on the presence and absence of fruiting bodies shows that the PCA and Biplot logistic techniques are extremely useful statistical tools to describe and study the evolution of the macromycetes of an ecosystem; they allow for visually summarizing all the available information and isolating the most important data by trying to eliminate less important variabilities, which is probably associated with errors in the data collection or with small unidentifiable variations. Taking into account this work, future studies on fruiting body formation should explore and implement the data obtained using quantitative variables, as well as look for patterns of behaviour between weeks or species using previous knowledge such as mycological indicators based on nutritional form, and even discover possible new distribution patterns.

Supplementary Materials

The following supporting information can be downloaded at: https://www.mdpi.com/article/10.3390/f14081662/s1. Figure S1: Analysis of variance based on similarities (ANOSIM) to determine whether there are differences among the study years; Table S1: Meteorological data from the Arabayona meteorological station (Salamanca, Spain) during the study period; Table S2: List of species identified with the abbreviated name (in red species not mentioned in Figure 8), their current scientific name, and personal herbarium reference number; Table S3: Dimension, Eigenvalues, Variance Explained, and Cumulative Variance.

Author Contributions

Conceptualization, A.F.-R., J.L.V.-V., P.G.-J. and D.R.-d.l.C.; methodology, A.F.-R., D.R.-d.l.C. and J.L.V.-V.; software, J.L.V.-V. and A.F.-R.; validation, J.L.V.-V., A.F.-R., S.S.-D. and D.R.-d.l.C.; formal analysis, A.F.-R., D.R.-d.l.C. and J.L.V.-V.; investigation, A.F.-R., D.R.-d.l.C., P.G.-J. and J.S.-S.; resources, J.S.-S., D.R.-d.l.C. and A.F.-R.; data curation, A.F.-R. and P.G.-J.; writing—original draft preparation, A.F.-R., D.R.-d.l.C. and J.S.-S.; writing—review and editing, A.F.-R., S.S.-D., D.R.-d.l.C., P.G.-J. and J.S.-S.; visualization, A.F.-R., D.R.-d.l.C. and J.L.V.-V.; supervision, A.F.-R., S.S.-D. and J.S.-S.; project administration, A.F.-R., P.G.-J., D.R.-d.l.C. and J.S.-S.; funding acquisition, A.F.-R., D.R.-d.l.C. and J.S.-S. All authors have read and agreed to the published version of the manuscript.

Funding

This research received no external funding.

Acknowledgments

The authors would like to thank Sergio Pérez Gorjón for his advise on several identifications.

Conflicts of Interest

The authors declare no conflict of interest.

References

  1. Bolton, J. An History of Fungusses, Growing about Halifax; Author and sold in Halifax; Ulan Press: Halifax, UK, 1788; Volume 1. [Google Scholar]
  2. Bel, G.; Hagberg, A.; Meron, E. Gradual regime shifts in spatially extended ecosystems. Theor. Ecol. 2012, 5, 591–604. [Google Scholar] [CrossRef]
  3. Martiny, J.B.H.; Bohannan, B.J.; Brown, J.H.; Colwell, R.K.; Fuhrman, J.A.; Green, J.L.; Morin, P.J. Microbial biogeography: Putting microorganisms on the map. Nat. Rev. Microbiol. 2006, 4, 102. [Google Scholar] [PubMed]
  4. Taylor, D.L.; Hollingsworth, T.N.; McFarland, J.W.; Lennon, N.J.; Nusbaum, C.; Ruess, R.W. A first comprehensive census of fungi in soil reveals both hyperdiversity and fine-scale niche partitioning. Ecol. Monogr. 2014, 84, 3–20. [Google Scholar]
  5. Opdam, P.; Wiens, J.A. Fragmentation, habitat loss and landscape management. In Conserving Bird Biodiversity: General Principles and Their Application; Norris, K., Pain, D.J., Eds.; Cambridge University Press: Cambridge, UK, 2002; pp. 202–223. [Google Scholar]
  6. Beule, L.; Grüning, M.; Karlovsky, P.; lM-Arnold, A. Changes of Scots pine phyllosphere and soil fungal communities during outbreaks of defoliating insects. Forests 2017, 8, 316. [Google Scholar]
  7. Kauserud, H.; Stige, L.C.; Vik, J.O.; Økland, R.H.; Høiland, K.; Stenseth, N.C. Mushroom fruiting and climate change. Proc. Natl. Acad. Sci. USA 2008, 105, 3811–3814. [Google Scholar] [CrossRef]
  8. Kauserud, H.; Heegaard, E.; Semenov, M.A.; Boddy, L.; Halvorsen, R.; Stige, L.C.; Stenseth, N.C. Climate change and spring-fruiting fungi. Proc. R. Soc. B. 2009, 277, 1169–1177. [Google Scholar] [CrossRef]
  9. Kauserud, H.; Heegaard, E.; Büntgen, U.; Halvorsen, R.; Egli, S.; Senn-Irlet, B.; Høiland, K. Warming-induced shift in European mushroom fruiting phenology. Proc. Natl. Acad. Sci. USA 2012, 109, 14488–14493. [Google Scholar]
  10. Jang, S.K.; Kim, S.W. Relationship between Ectoycorrhizal Fruiting Bodies and Climatic and Environmental Factors in Naejangsan National Park. Mycobiology 2015, 43, 122–134. [Google Scholar] [CrossRef]
  11. Barnes, C.J.; van der Gast, C.J.; McNamara, N.P.; Rowe, R.; Bending, G.D. Extreme rainfall affects assembly of the root-associated fungal community. New Phytol. 2018, 220, 1172–1184. [Google Scholar]
  12. Shi, L.L.; Mortimer, P.E.; Slik, J.F.; Zou, X.M.; Xu, J.; Feng, W.T.; Qiao, L. Variation in forest soil fungal diversity along a latitudinal gradient. Fungal Divers. 2014, 64, 305–315. [Google Scholar]
  13. Angelini, P.; Compagno, R.; Arcangeli, A.; Bistocchi, G.; Gargano, M.L.; Venanzoni, R.; Venturella, G. Macrofungal diversity and ecology in two Mediterranean forest ecosystems. Plant Biosyst. 2016, 150, 540–549. [Google Scholar] [CrossRef]
  14. Buée, M.; De Boer, W.; Martin, F.; Van Overbeek, L.; Jurkevitch, E. The rhizosphere zoo: An overview of plant-associated communities of microorganisms, including phages, bacteria, archaea, and fungi, and of some of their structuring factors. Plant Soil 2009, 321, 189–212. [Google Scholar] [CrossRef]
  15. Lauber, C.L.; Strickland, M.S.; Bradford, M.A.; Fierer, N. The influence of soil properties on the structure of bacterial and fungal communities across land-use types. Soil Biol. Biochem. 2008, 40, 2407–2415. [Google Scholar] [CrossRef]
  16. Hawkes, C.V.; Kivlin, S.N.; Rocca, J.D.; Huguet, V.; Thomsen, M.A.; Suttle, K.B. Fungal community responses to precipitation. Glob. Chang. Biol. 2011, 17, 1637–1645. [Google Scholar] [CrossRef]
  17. Kjøller, R.; Nilsson, L.O.; Hansen, K.; Schmidt, I.K.; Vesterdal, L.; Gundersen, P. Dramatic changes in ectomycorrhizal community composition, root tip abundance and mycelial production along a stand-scale nitrogen deposition gradient. New Phytol. 2012, 194, 278–286. [Google Scholar] [CrossRef] [PubMed]
  18. Bååth, E.; Anderson, T.H. Comparison of soil fungal/bacterial ratios in a pH gradient using physiological and PLFA-based techniques. Soil Biol. Biochem. 2003, 35, 955–963. [Google Scholar] [CrossRef]
  19. Vaquerizo, M.D.; Gallardo, A. Nitrógeno orgánico disuelto en comunidades vegetales del SO de la Península Ibérica. Cuad. Soc. Esp. Cienc. For. 2008, 25, 153–159. [Google Scholar]
  20. Bahnmann, B.; Mašínová, T.; Halvorsen, R.; Davey, M.L.; Sedlák, P.; Tomšovský, M.; Baldrian, P. Effects of oak, beech and spruce on the distribution and community structure of fungi in litter and soils across a temperate forest. Soil Biol. Biochem. 2018, 119, 162–173. [Google Scholar] [CrossRef]
  21. Egli, S.; Peter, M.; Buser, C.; Stahel, W.; Ayer, F. Mushroom picking does not impair future harvests–results of a long-term study in Switzerland. Biol. Conserv. 2006, 129, 271–276. [Google Scholar] [CrossRef]
  22. García Jiménez, P.; Fernández Ruiz, A.; Sánchez Sánchez, J.; Rodríguez de la Cruz, D. Mycological Indicators in Evaluating Conservation Status: The Case of Quercus spp. Dehesas in the Middle-West of the Iberian Peninsula (Spain). Sustainability 2020, 12, 10442. [Google Scholar] [CrossRef]
  23. Sun, Q.; Liu, Y.; Yuan, H.; Lian, B. The effect of environmental contamination on the community structure and fructification of ectomycorrhizal fungi. Microbiol. Open 2017, 6, e00396. [Google Scholar] [CrossRef]
  24. Zelnik, Y.R.; Meron, E.; Bel, G. Localized states qualitatively change the response of ecosystems to varying conditions and local disturbances. Ecol. Complex. 2016, 25, 26–34. [Google Scholar] [CrossRef]
  25. Mehus, H. Fruit Body Production of Macrofungi in Some North Norwegian Forest Types. Nord. J. Bot. 1986, 6, 679–702. [Google Scholar] [CrossRef]
  26. Richard, F.; Roy, M.; Shahin, O.; Sthultz, C.; Duchemin, M.; Joffre, R.; Selosse, M.A. Ectomycorrhizal communities in a Mediterranean forest ecosystem dominated by Quercus ilex: Seasonal dynamics and response to drought in the surface organic horizon. Ann. For. Sci. 2011, 68, 57–68. [Google Scholar] [CrossRef]
  27. Perotto, S.; Angelini, P.; Bianciotto, V.; Bonfante, P.; Girlanda, M.; Kull, T. Interaction of fungi with other organisms. Plant Biosyst. 2013, 147, 208–218. [Google Scholar] [CrossRef]
  28. Smith, S.E.; Read, D. Mycorrhizal Symbiosis; Elsevier: New York, NY, USA, 2008. [Google Scholar]
  29. Chapin, F.S.; Matson, P.A.; Vitousek, P.M. Principles of Terrestial Ecosystem Ecology, 2nd ed.; Springer: New York, NY, USA, 2002. [Google Scholar]
  30. Markkola, A.M.; Saravesi, K.; Aikio, S.; Taulavuori, E.; Taulavuori, K. Light-driven host-symbiont interactions under hosts’ range shifts caused by global warming: A review. Environ. Exp. Bot. 2016, 121, 48–55. [Google Scholar] [CrossRef]
  31. Heilmann-Clausen, J.; Barron, E.S.; Boddy, L.; Dahlberg, A.; Griffith, G.W.; Nordén, J.; Ovaskainen, O.; Perini, C.; Senn-Irlet, B.; Halme, P. A fungal perspective on conservation biology. Conserv. Biol. 2015, 29, 61–68. [Google Scholar] [CrossRef]
  32. Solomon, S.; Qin, D.; Manning, M.; Chen, Z.; Marquis, M.; Averyt, K.B.; Tignor, M.; Miller, H.L. Climate Change 2007: The Physical Science Basis. In Contribution of Working Group I to the Fourth Assessment Report of the Intergovernmental Panel on Climate Change; Cambridge University Press: Cambridge, UK, 2007. [Google Scholar]
  33. Moreno, G.; Manjón, J.L.; Álvarez-Jiménez, J. Los hongos y el cambio climático. In Desert Truffle; Kagan-Zur, V., Sitrit, Y., Roth-Bejerano, N.A., Morte, Eds.; Springer Verlag: Berlin/Heidelberg, Germany, 2013; pp. 129–135. [Google Scholar]
  34. Capel Molina, J.J. Los Climas de España; Oikos-tau. S.A.: Barcelona, Spain, 1981. [Google Scholar]
  35. State Meteorological Agency. Monthly Weather Forecast; Ministry of Agriculture, Food and Environment. Territorial Delegation of Castile & Leon: Valladolid, Spain, 2012. [Google Scholar]
  36. Kirk, P.M.; Cannon, P.; Minter, D.; Stalpers, J. Dictionary of the Fungi, 10th ed.; CAB International: Wallingford, UK, 2008. [Google Scholar]
  37. Fernández, A.; Sánchez, S.; García, P.; Sánchez, J. Macrofungal diversity in an isolated and fragmented Mediterranean Forest ecosystem. Plant Biosyst. 2020, 154, 139–148. [Google Scholar] [CrossRef]
  38. Castile & Leon InfoRiego System Network. Available online: http://www.inforiego.org/opencms/opencms/estaciones/listado/index.html (accessed on 1 November 2015).
  39. Clarke, K.R. Non-parametric multivariate analysis of changes in community structure. Austral Ecol. 1993, 18, 117–143. [Google Scholar] [CrossRef]
  40. Anderson, M.J. A new method for non-parametric multivariate analysis of variance. Austral Ecol. 2001, 26, 32–46. [Google Scholar]
  41. R Core Team. R: A Language and Environment for Statistical Computing. R Foundation for Statistical Computing: Vienna, Austria. 2016. Available online: https://www.R-project.org/ (accessed on 5 February 2018).
  42. Oksanen, J.; Blanchet, F.G.; Friendly, M.; Kindt, R.; Legendre, P.; McGlinn, D.; Minchin, P.R.; O’Hara, R.B.; Simpson, G.L.; Solymos, P.; et al. R Package Version 2.4-2. Vegan: Community Ecology Package. 2017. Available online: https://cran.r-project.org/ (accessed on 5 January 2018).
  43. Vicente-Villardón, J.L. MultBiplot(R): Multivariate Analysis Using Biplots. R Package Version 0.3.3. 2016. Available online: http://biplot.usal.es/classicalbiplot/multbiplot-in-r/ (accessed on 5 January 2018).
  44. Vicente-Villardón, J.L. MULTBIPLOT: A package for Multivariate Analysis using Biplots. Statistics Department. University of Salamanca: Salamanca, Spain. 2016. Available online: http://biplot.usal.es/ClassicalBiplot/index.html (accessed on 6 January 2018).
  45. Eyssartier, G.; Roux, P. Le Guide des Champignons: France et Europe, 1st ed.; Belin: Périgueux, France, 2011. [Google Scholar]
  46. Courtecuisse, R.; Duhem, B. Guide des Champignons de France et d’Europe: 1752 Espèces Décrites et Illustrées; Delachaux & Niéstlé: Paris, France, 1994. [Google Scholar]
  47. Hering, T.F. The terricolous higher fungi of four lake district woodlands. Trans. Br. Mycol. Soc. 1966, 49, 369–383. [Google Scholar] [CrossRef]
  48. Durall, D.M.; Gamiet, S.; Simard, S.W.; Kudrna, L.; Sakakibara, S.M. Effects of clearcut logging and tree species composition on the diversity and community composition of epigeous fruit bodies formed by ectomycorrhizal fungi. Botany 2006, 84, 966–980. [Google Scholar] [CrossRef]
  49. Gabel, A.C.; Gabel, M.L. Comparison of diversity of macrofungi and vascular plants at seven sites in the Black Hills of South Dakota. Am. Midl. Nat. 2007, 157, 258–296. [Google Scholar] [CrossRef]
  50. Halme, P.; Heilmann-Clausen, J.; Rämä, T.; Kosonen, T.; Kunttu, P. Monitoring fungal biodiversity—Towards an integrated approach. Fungal Ecol. 2012, 5, 750–758. [Google Scholar] [CrossRef]
  51. Martin-Vide, J.; Lopez-Bustins, J.A. The western Mediterranean oscillation and rainfall in the Iberian Peninsula. Int. J. Climatol. 2006, 26, 1455–1475. [Google Scholar] [CrossRef]
  52. Gange, A.C.; Gange, E.G.; Sparks, T.H.; Boddy, L. Rapid and recent changes in fungal fruiting patterns. Science 2007, 316, 71. [Google Scholar] [CrossRef] [PubMed]
  53. Tuno, N.; Akaishi, D.; Kimura, M.T. Abundance and phenology of macrofungal fruiting bodies in central and northern Japan. Mycoscience. 2020, 61, 331–336. [Google Scholar] [CrossRef]
  54. Sanz-Benito, I.; Stadler, T.; Mediavilla, O.; Hernández-Rodríguez, M.; Oria-de-Rueda, J.A.; Dejene, T.; Geml, J.; Martín-Pinto, P. Into the void: ECM fungal communities involved in the succession from rockroses to oak stands. Sci Rep 2023, 13, 10085. [Google Scholar] [CrossRef]
  55. Sato, H.; Morimoto, S.; Hattori, T. A thirty-year survey reveals that ecosystem function of fungi predicts phenology of mushroom fruiting. PLoS ONE 2012, 7, e49777. [Google Scholar] [CrossRef]
  56. Sebastiana, M.; da Silva, A.B.; Matos, A.R.; Alcântara, A.; Silvestre, S.; Malhó, R. Ectomycorrhizal inoculation with Pisolithus tinctorius reduces stress induced by drought in cork oak. Mycorrhiza 2018, 28, 247–258. [Google Scholar] [CrossRef]
  57. Santos-Silva, C.; Gonçalves, A.; Louro, R. Canopy cover influence on macrofungal richness and sporocarp production in montado ecosystems. Agroforest Syst. 2011, 82, 149–159. [Google Scholar] [CrossRef]
  58. Sanz, A.; Fernández Ruiz, A.; García Jiménez, P.; Sánchez Sánchez, J.; Rodríguez de la Cruz, D. Preliminary survey of macrofungal diversity in El Monte de Villoria (Salamanca, Spain). Bot. Complut. 2022, 46, e80421. [Google Scholar] [CrossRef]
  59. Boddy, L.; Heilmann-Clausen, J. Basidiomycete Community Development in Temperate Angiosperm Wood. Br. Mycol. Soc. Symp. Ser. 2008, 28, 211–237. [Google Scholar]
  60. Fischer, M.; González García, V. An annotated checklist of European basidiomycetes related to white rot grapevine (Vitis vinifera). Phytol. Mediterr. 2011, 54, 281–298. [Google Scholar]
  61. Sabaté, S.; Gracia, C.A.; Sánchez, A. Likely effects of climate change on growth of Quercus ilex, Pinus halepensis, Pinus pinaster, Pinus sylvestris and Fagus sylvatica forests in the Mediterranean region. For. Ecol. Manag. 2002, 162, 23–37. [Google Scholar] [CrossRef]
  62. Pickles, B.J.; Egger, K.N.; Massicotte, H.B.; Green, D.S. Ectomycorrhizas and climate change. Fungal Ecol. 2012, 5, 73–84. [Google Scholar] [CrossRef]
  63. Hyvönen, R.; Ågren, G.I.; Linder, S.; Persson, T.; Cotrufo, M.F.; Ekblad, A.; Freeman, M.; Grelle, A.; Janssens, I.A.; Jarvis, P.G.; et al. The likely impact of elevated [CO2], nitrogen deposition, increased temperature and management on carbon sequestration in temperate and boreal forest ecosystems: A literature review. New Phytol. 2007, 173, 463–480. [Google Scholar] [CrossRef]
  64. Fang, C.; Smith, P.; Moncrieff, J.B.; Smith, J.U. Similar response of labile and resistant soil organic matter pools to changes in temperature. Nature 2005, 433, 57–59. [Google Scholar] [CrossRef]
  65. Limousin, J.M.; Rambal, S.; Ourcival, J.M.; Joffre, R. Modelling rainfall interception in a Mediterranean Quercus ilex ecosystem: Lesson from a throughfall exclusion experiment. J. Hydrol. 2008, 357, 57–66. [Google Scholar] [CrossRef]
  66. Misson, L.; Rocheteau, A.; Rambal, S.; Ourcival, J.M.; Limousin, J.M.; Rodriguez, R. Functional changes in the control of carbon fluxes after 3 years of increased drought in a Mediterranean holm forest. Glob. Chang. Biol. 2010, 16, 2461–2475. [Google Scholar]
  67. Sardans, J.; Penuelas, J. Drought decreases soil enzyme activity in a Mediterranean Quercus ilex L. forest. Soil Biol. Biochem. 2005, 37, 455–461. [Google Scholar] [CrossRef]
  68. Barnard, R.; Le Roux, X.; Hungate, B.A.; Cleland, E.E.; Blankinship, J.C.; Barthes, L.; Leadley, P.W. Several components of global change alter nitrifying and denitrifying activities in an annual grassland. Funct. Ecol. 2006, 20, 557–564. [Google Scholar] [CrossRef]
  69. Salerni, E.; Laganà, A.; Perini, C.; Loppi, S.; Dominicis, V.D. Effects of temperature and rainfall on fruiting of macrofungi in oak forests of the Mediterranean area. Isr. J. Plant Sci. 2002, 50, 189–198. [Google Scholar] [CrossRef]
  70. Su, N.; Jarvie, S.; Yan, Y.; Gong, X.; Li, F.; Han, P.; Zhang, Q. Landscape context determines soil fungal diversity in a fragmented habitat. Catena 2022, 213, 106163. [Google Scholar] [CrossRef]
  71. Kirschbaum, M.U. Forest growth and species distribution in a changing climate. Tree Physiol. 2000, 20, 309–322. [Google Scholar] [CrossRef]
  72. Martin, F.; Cullen, D.; Hibbett, D.; Pisabarro, A.; Spatafora, J.W.; Baker, S.E.; Grigoriev, I.V. Sequencing the fungal tree of life. New Phytol. 2011, 190, 818–821. [Google Scholar] [CrossRef]
  73. Reverchon, F.; del Ortega-Larrocea, P.M.; Pérez-Moreno, J. Saprophytic fungal communities change in diversity and species composition across a volcanic soil chronosequence at Sierra del Chichinautzin, Mexico. Ann. Microbiol. 2010, 60, 217–226. [Google Scholar] [CrossRef]
  74. Birgander, J.; Rousk, J.; Olsson, P.A. Comparison of fertility and seasonal effects on grassland microbial communities. Soil Biol. Biochem. 2014, 76, 80–89. [Google Scholar] [CrossRef]
  75. Sterkenburg, E.; Bahr, A.; Durling, M.B.; Clemmensen, K.E.; Lindahl, B.D. Changes in fungal communities along a boreal forest soil fertility gradient. New Phytol. 2015, 207, 1145–1158. [Google Scholar] [CrossRef]
  76. Adamo, I.; Dashevskaya, S.; Alday, J.G. Fungal perspective of pine and oak colonization in Mediterranean degraded ecosystems. Forests 2022, 13, 88. [Google Scholar] [CrossRef]
  77. Braga-Neto, R.; Luizão RC, C.; Magnusson, W.E.; Zuquim, G.; de Castilho, C.V. Leaf litter fungi in a Central Amazonian forest: The influence of rainfall, soil and topography on the distribution of fruiting bodies. Biodivers Conserv. 2008, 17, 2701–2712. [Google Scholar] [CrossRef]
  78. Hilszczańska, D.; Rosa-Gruszecka, A.; Gawryś, R.; Horak, J. Effect of soil properties and vegetation characteristics in determining the frequency of Burgundy truffle fruiting bodies in Southern Poland. Écoscience 2019, 26, 113–122. [Google Scholar] [CrossRef]
  79. Ponce, Á.; Alday, J.G.; Martínez de Aragón, J.; Collado, E.; Morera, A.; Bonet, J.A.; de-Miguel, S. Environmental drivers shaping the macrofungal sporocarp community in Mediterranean Quercus ilex stands. For. Ecol. Manag. 2022, 524, 120523. [Google Scholar] [CrossRef]
  80. Kranabetter, J.M.; Friesen, J.; Gamiet, S.; Kroeger, P. Epigeous fruiting bodies of ectomycorrhizal fungi as indicators of soil fertility and associated nitrogen status of boreal forests. Mycorrhiza 2009, 19, 535–548. [Google Scholar] [CrossRef]
  81. Wardle, D.A.; Walker, L.R.; Bardgett, R.D. Ecosystem properties and forest decline in contrasting long-term chronosequences. Science 2004, 305, 509–513. [Google Scholar] [CrossRef] [PubMed]
  82. Magarzo, A.; Sanz-Benito, I.; Mediavilla, O.; Hernández-Rodríguez, M.; Oria-de-Rueda, J.A.; Dejene, T.; Martín-Pinto, P. Mosaic forest management at landscape scale to enhance fungal diversity and production, in a context of forest fire-prevention in Mediterranean ecosystems. Ecol. Indic. 2023, 150, 110272. [Google Scholar] [CrossRef]
  83. Adnan, M.; Islam, W.; Gang, L.; Chen, H.Y. Advanced research tools for fungal diversity and its impact on forest ecosystem. Environ. Sci. Pollut. Res. 2022, 29, 45044–45062. [Google Scholar] [CrossRef]
  84. Gonçalves, S.C.; Haelewaters, D.; Furci, G.; Mueller, G.M. Include all fungi in biodiversity goals. Science 2021, 373, 403. [Google Scholar] [CrossRef]
  85. Kuikka, K.; Härmä, E.; Markkola, A.; Rautio, P.; Roitto, M.; Saikkonen, K.; Ahonen-Jonnarth, U.; Finlay, R.; Tuomi, J. Severe defoliation of Scots pine reduces reproductive investment by ectomycorrhizal symbionts. Ecology 2003, 84, 2051–2061. [Google Scholar] [CrossRef]
  86. Sarrionandia, E.; Salcedo, I. Macrofungal diversity of holm-oak forests at the northern limit of their distribution range in the Iberian Peninsula. Scand. J. For. Res. 2018, 33, 23–31. [Google Scholar] [CrossRef]
  87. Sun, W.; Yang, B.; Zhu, Y.; Wang, H.; Qin, G.; Yang, H. Ectomycorrhizal fungi enhance the tolerance of phytotoxicity and cadmium accumulation in oak (Quercus acutissima Carruth.) seedlings: Modulation of growth properties and the antioxidant defense responses. Environ. Sci. Pollut. Res. 2022, 29, 6526–6537. [Google Scholar] [CrossRef] [PubMed]
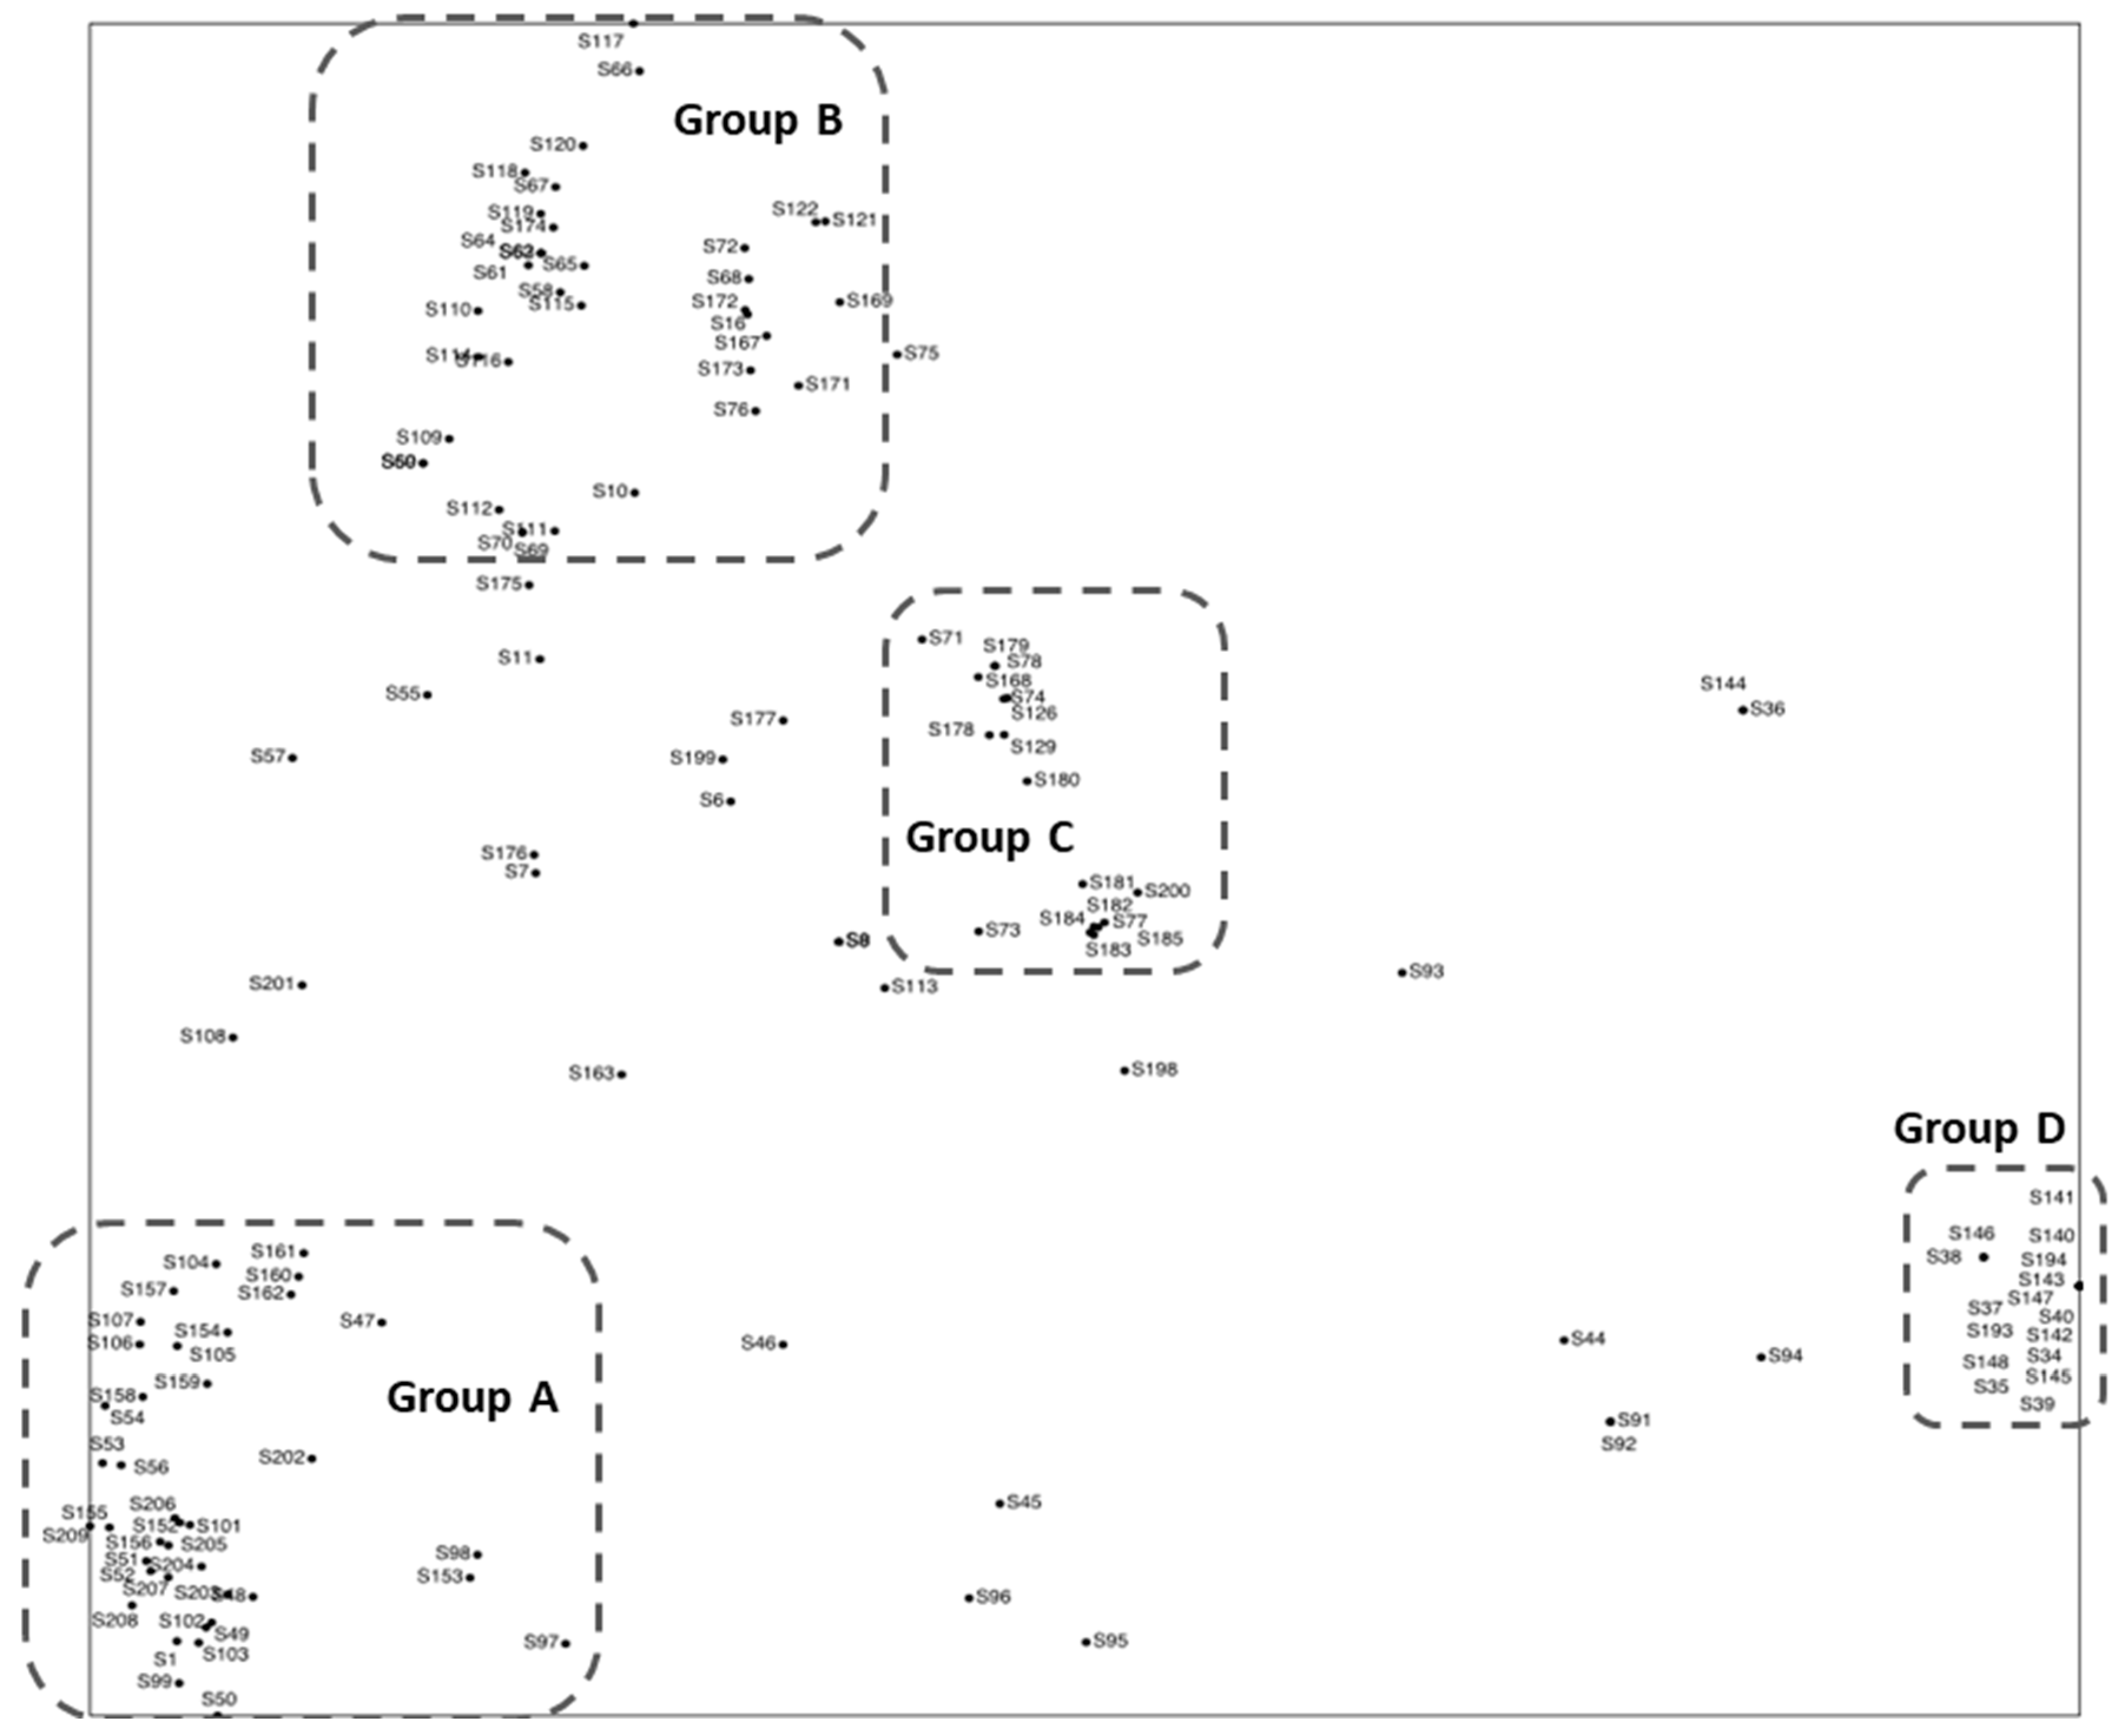
Figure 1. Total number of species collected by month and year.
Forests 14 01662 g001
Figure 2. Principal Coordinates Analysis for the ordering of 146 weeks of sampling, eliminating those in which no specimens were found, and the four established groups. S = Week.
Forests 14 01662 g002
Figure 3. Principal Coordinates Analysis for the weeks with the points identified according to the month to which they belong.
Forests 14 01662 g003
Figure 4. Principal Coordinates Analysis for the weeks with the points identified according to the season to which they belong.
Forests 14 01662 g004
Figure 5. Principal Coordinates Analysis for the weeks with the points identified according to the year to which they belong.
Forests 14 01662 g005
Figure 6. Species and week ordering diagram. The scientific names of the species are abbreviated by the first three letters of the generic name followed by the first three letters of the specific epithet and zoom area.
Forests 14 01662 g006
Figure 7. Logistic regression adjustment, probability of presence at each point for the analysed meteorological parameters. WeekTempC: weekly average temperature; Week2Temp: weekly average temperature 2 weeks prior to collection; TmaxC: weekly maximum temperature; TminC: weekly minimum temperature; H2O: weekly average humidity; Winspeed: weekly average wind speed; WindDir: weekly average wind direction; SunRad: weekly average radiation; Rain: weekly average precipitation; and Cumrain4: cumulative precipitation in the 4 weeks prior to collection.
Forests 14 01662 g007
Figure 8. Main pattern of annual fungal fruiting and responsible taxa for a Mediterranean ecosystem (with number of collected weeks) dominated by the holm oak. Orange bars represent lower autumn-winter subgroup, blue bars represent upper autumn-winter subgroup.
Forests 14 01662 g008
Figure 9. Relationship between the total frequency of collected taxa in late spring, summer, and early autumn, and their mode of nutrition.
Forests 14 01662 g009
Table 1. Number of taxa collected in centroid weeks and dates from the groups established in the PCA for weeks.
Group (Subgroup)WeekDateN Taxa
A (Upper subgroup)1546 December 201129
A (Lower subgroup)20419 November 201243
B (Left subgroup)17426 April 201210
B (Right subgroup)1676 March 20122
C7211 May 20103
D3815 September 20092
Week: week number of the centroid. N taxa: number of collected taxa.
Disclaimer/Publisher’s Note: The statements, opinions and data contained in all publications are solely those of the individual author(s) and contributor(s) and not of MDPI and/or the editor(s). MDPI and/or the editor(s) disclaim responsibility for any injury to people or property resulting from any ideas, methods, instructions or products referred to in the content.

