Article

Fungal Community Succession of Populus grandidentata (Bigtooth Aspen) during Wood Decomposition

1
Department of Ecology and Evolutionary Biology, University of Michigan, Ann Arbor, MI 48109, USA
2
Department of Biology, Virginia Commonwealth University, Richmond, VA 23284, USA
3
Department of Microbial Ecology, Netherlands Institute of Ecology (NIOO-KNAW), 6708 PB Wageningen, The Netherlands
4
Department of Biology, Linfield University, McMinnville, OR 97128, USA
*
Author to whom correspondence should be addressed.
This manuscript is part of a Ph.D. thesis by the first author Buck Tanner Castillo. Ph.D. Program in the University of Michigan.
Forests 2023, 14(10), 2086; https://doi.org/10.3390/f14102086
Submission received: 14 June 2023 / Revised: 21 July 2023 / Accepted: 3 August 2023 / Published: 18 October 2023
(This article belongs to the Special Issue Fungal Dynamics and Diversity in Forests)

Abstract

:
Fungal communities are primary decomposers of detritus, including coarse woody debris (CWD). We investigated the succession of fungal decomposer communities in CWD through different stages of decay in the wide-ranging and early successional tree species Populus grandidentata (bigtooth aspen). We compared shifts in fungal communities over time with concurrent changes in substrate chemistry and in bacterial community composition, the latter deriving from an earlier study of the same system. We found that fungal communities were highly dynamic during the stages of CWD decay, rapidly colonizing standing dead trees and gradually changing in composition until the late stages of decomposed wood were integrated into soil organic matter. Fungal communities were most similar to neighboring stages of decay, with fungal diversity, abundance, and enzyme activity positively related to percent nitrogen, irrespective of decay class. In contrast to other studies, we found that species diversity remained unchanged across decay classes. Differences in enzyme profiles across CWD decay stages mirrored changes in carbon recalcitrance, as B-D-xylosidase, peroxidase, and Leucyl aminopeptidase activity increased as decomposition progressed. Finally, fungal and bacterial gene abundances were stable and increased, respectively, with the extent of CWD decay, suggesting that fungal-driven decomposition was associated with shifting community composition and associated enzyme functions rather than fungal quantities.

1. Introduction

Coarse woody debris (CWD), which includes dead standing and downed wood, comprises up to 20% of the total carbon stored in forest ecosystems [1,2]. Age-related mortality of early colonizing trees during successional transitions and in response to pests and pathogens directly affects CWD production in forests [3,4]. This large influx of carbon substrate may stimulate microbial activity, which, in turn, may shift the net C balance of an ecosystem from sink to source [5,6]. Variation in C fluxes from CWD can be large [7], with decomposer community richness thought to explain a substantial fraction of the variation in heterotrophic respiration and CWD decay rates [5,8,9]. However, while patterns of fungal community assemblage and drivers of fungal succession have been studied in a small number of CWD species in a limited number of ecosystems, it is unclear if those results can be generalized across species and ecosystem boundaries.
Wood is mainly comprised of cellulose and hemicellulose embedded in a lignin matrix, termed lignocellulose, with breakdown of CWD relying on decomposers of these structurally complex high-polymeric materials. Lignin content is a key determinant of decomposition rates because it acts as a physical barrier to the enzymatic processing of the labile C contained in wood polysaccharides [10]. Disintegration of this lignin-barrier relies on extracellular enzymes that are produced by both bacteria [11] and more abundantly by specific groups of fungi, mostly Basidiomycetes and a few Ascomycetes [12,13].
Wood decay fungi predominately break down cellulose, hemicellulose, and lignin, accounting for 60% to 80% of the respiratory CO2 flux from CWD [14]. Fungi are particularly important during early decay stages, when CWD moisture is low, and wood is high in lignocellulose content. During this phase, white rot fungi break down lignin and cellulose through the production of laccases, lignin peroxidases, and other enzymes [15,16]. They may be a particularly important assemblage in the context of CWD decomposition because rates of lignin decay have implications for long-term C storage in detritus and soils [17]. In contrast, bacterial communities are thought to thrive in the later stages of wood decomposition, when the moisture content is higher and access to carbohydrates and partially degraded wood polymers is greater [18]. While these successional dynamics are generally understood, identifying the environmental factors that shape microbial community succession in CWD is important to understanding the role of decomposers in ecosystem function and, in particular, C emissions from ecosystems [19].
Fungal succession within woody plant tissues begins prior to tree mortality and continues through advanced stages of CWD decay as C is transferred into soil organic matter (SOM). Fungi colonize bark and heart wood, acting both as latent inhabitants and as pathogens prior to tree death [1,20]. These early colonizers may be important determinants of successional pathways in decomposer communities through priority effects and intraspecific competition [21]. As trees fall to the forest floor, additional decomposers arrive as spores from wind or via mycelial growth through soil networks [22,23]. In downed CWD, nutrients can then be translocated by fungal mycelial networks both into the wood and throughout the forest floor [24,25]. The establishment and growth of decomposers may be influenced by abiotic factors such as wood chemistry, moisture content, and temperature, all of which determine community structure through their effects on wood chemistry and microclimate [23].
Populus grandidentata (bigtooth aspen) can serve as an important model to study fungal succession. First, the genus Populus is among the most abundant and broadly distributed woody plant genera globally and species in this genus play a critical role in primary succession [26]. Second, the dominance of P. grandidentata as a component of northern hardwoods and boreal forests of eastern North America ensures a critical role in carbon storage and nutrient cycling in these systems, where it constitutes a large fraction of the first pool of CWD following large-scale disturbance, such as fire or windthrow [6]. Third, P. grandidentata’s decay status in our study site, spanning from standing dead to downed and extensively decomposed CWD, offered a complete successional continuum for examining fungal community structural changes. While fungal succession has been studied using similar techniques in other species [27,28,29], no study has examined fungal community succession and enzymatic productivity along a continuous gradient of Populus decomposition. Given that the details of fungal and microbial community succession are most assuredly ecosystem and tree species specific [11,27,30,31,32], a higher order understanding of fungal succession requires that we investigate additional tree species occurring in unique ecosystems. Additionally, a complementary study examining bacterial succession in Populus grandidentata allows for insight into the interaction between fungal and bacterial communities over the course of the same decompositional sequence [33].
We investigated fungal decomposer communities in the CWD of P. grandidentata across successional stages of decomposition. Studying fungal communities over a continuous sequence is critical to understanding patterns of community assembly and our use of metabarcoding ensures a more complete identification of microbial communities at each stage of decomposition [19,33,34]. Our goal is to understand if fungal successional trends related to diversity, functional groups, bacterial interactions, and enzyme production found in other species of CWD in other ecosystems are consistent with observations at our study site. To elucidate the drivers of successional patterns, we considered concurrent changes in moisture content, wood chemistry, and extracellular enzyme activity. We hypothesized that fungal community diversity would increase along the continuum of decay, with early dominance of heart and white rot fungi, and that the enzyme profiles would shift from predominantly lignin breakdown toward greater rates of cellulose and hemicellulose depolymerization. We anticipated an increase in bacterial abundance as CWD decomposition progressed, and an overall increase in bacteria:fungi ratios. By comparing these results with our prior analysis of the bacterial community structure [33], we were able to investigate the relative importance of biotic versus abiotic drivers in structuring microbial community succession in wood decomposition.

2. Materials and Methods

2.1. Study Site

The study was conducted at the University of Michigan Biological Station (UMBS), in northern Michigan, USA (45°35′ N 84°43′ W). Mean annual temperature is 5.5 °C and mean annual precipitation is 817 mm. The forest is a mixed hardwood with canopy and understory species composition primarily composed of P. grandidentata (bigtooth aspen), Betula papyrifera (paper birch), Quercus rubra (northern red oak), Acer rubrum (red maple), and Pinus strobus (eastern white pine). Maturing Populus are rapidly senescing and consequently are the primary constituent of CWD in this regionally representative ecosystem that emerged a century ago following widespread clear-cutting and fires [35]. Ground flora consists of Pteridium aqualinum, Gaultheria procumbens, Maianthemum canadense, and Vaccinium angustifolium. The study site is on a high-level sandy outwash plain and an adjacent gently sloping moraine [36]. Soils are excessively well-drained Entic Haplorthods of the Rubicon series. The typical morphology of this series consists of Oi and Oe horizons 1–3 cm thick, a bioturbated A horizon 1–3 cm, an E horizon 10–15 cm thick, and Bs and BC horizons of sand with occasional gravel and cobble [37]. Across all of these soils, approximately half of the fine root biomass is in the upper 20 cm of soil and the forest floor C mass is approximately 5–15 Mg C ha−1. Typical pH values for these soils are between 4.0–6.0. Sampling and methodology are identical to a bacterial study conducted at this site concurrent with fungal sampling (Kuramae et al., 2019). In this paper, we focus on fungal communities. while drawing comparisons to a previously published study on bacteria conducted within the same logs [33].

2.2. Field Sampling

Sampling was conducted in a plot (60 m radius) encircling the US-UMB Ameriflux tower (Curtis et al., 2002). Soil and CWD sampling were conducted in summer of 2015 and additional plot data were collected in the summer of 2016. A total of 24 P. grandidentata trees were identified as either standing dead (SD) or assigned a decay class (DC) 1–5 (USDA Forest Service, 2018), with DC 1 representing freshly fallen trees with minimal visual decay, and DC 5 representing individuals in late stages of decay (Supplemental Table S1). All standing dead logs appeared to be at the same stage of decay with bark and branches intact. Four logs were chosen for each category of SD and DC1-DC5. The mean diameter of all logs was 17.0 cm, ranging from 10–24 cm. Due to difficulty in identification of highly decayed logs, DC 5 logs were selected from a set of known P. grandidentata logs that were part of a prior long-term CWD experiment. All downed logs included in the analyses were at least 3 m in length and were in direct contact with the forest floor. We estimated the total span of the continuum from standing dead trees through decay class five and incorporation into SOM to be roughly 60 years based on published rates of decay for Populus [38]. The ages of individual log classes were estimated within this span (Supplemental Table S1).
A total of 9 sampling points along each log were identified (Supplemental Figure S1). To locate these 9 points, 3 transects were established on the log running perpendicular to the log, with the transects located at least 0.5 m from each other and from either end of the log. Along each transect, wood samples were taken from three points located at the top of the log (360°) and points as close to 120 and 240 degrees as possible. Wood samples were collected using an ethanol flame sterilized 19 mm drill bit, and logs were drilled with bark intact. A similar protocol was followed for sampling standing dead trees with the center transect for sampling at diameter at breast height DBH (1.3 m), and additional transects 0.5 m above and below this point. Additionally, three soil samples were collected 30 m from the plot center base at azimuths 120, 240, and 360. Oe and A horizons were collected at each soil sampling location, with depths ranging from 3–5 cm. All samples were kept in a cooler on ice in the field and during transport back to the lab.

2.3. Sample Processing

In the lab, 1 g of wood was removed from each drill point sample and refrigerated (4 °C) until enzyme assays could be completed (<1 week). The remainder of each drill point sample was lyophilized, and pre- and post-lyophilization mass differences used to determine relative moisture content. Once lyophilized, 1 g from each of the 9 points drilled was compiled into a single 9 g sample for each of the 24 logs. The composite sample for each log was ball-ground using a SPEX Certiprep 8000D Mixer/Mill (Metuchen, NJ, USA). Samples were then stored at −80 °C until analyzed. Soils were sieved through a 2.0 mm screen to remove pebbles and coarse particulate organic matter. A 10 g subsample from each sieved soil sample was taken for enzyme assays and refrigerated (4 °C) prior to lyophilization of the remaining soil samples.

2.4. DNA Extraction and Amplicon Sequencing

Genomic DNA was extracted from frozen soil and composite wood samples using a PowerMax Soil DNA Isolation Kit (MoBio, Carlsbad, CA, USA) following the manufacturer’s instructions. Extraction quantity was determined using a Qubit fluorometer (Invitrogen, San Jose, CA, USA) and frozen (−80 °C) until PCR amplification was performed. Amplification of the ITS2 region was conducted using the forward primer ITS2_KYO1 (5′-CTHGGTCATTTAGAGGAASTAA) and reverse primer ITS4_KYO3 (5′-CTBTTVCCKCTTCACTCG) using HotStarTaq Plus Master Mix (Qiagen, Hilden Germany), following methods described by Toju et al. (2012). PCR products were assessed on a 2% agarose gel and stored (−80 °C) until shipment to MR DNA (Shallowater, TX, USA) for library construction and sequencing. Illumina libraries were constructed using the TruSeq DNA library preparation protocol (Illumina, San Diego, CA, USA), purified using Ampure XP beads (Beckman Coulter, etc.), and sequencing was performed on an Illumina MiSeq to generate paired-end reads (~300 bp).

2.5. Quantitative PCR

Quantitative PCR (qPCR) was used to determine the relative abundance of bacteria and fungi in each genomic DNA sample. Bacterial assays targeted the 16S rRNA gene using the 799F and 1193R primer pair [33]. Reaction mixtures (15 μL) included 0.1 μM of each primer, 1.8 ng of template DNA, and SsoAdvanced™ Universal SYBR® Green Supermix (BioRad, Hercules, CA, USA). Thermal cycling conditions were: 95 °C for 4 min followed by 40 cycles of 30 s at 95 °C, 30 s at 53 °C, and 60 s at 72 °C, and then melt curve analysis to verify product size. Fungal qPCR reactions (15 μL) were performed as above but included 6 ng of template DNA and 0.75 μM each of the ITS2 KYO1 and ITS4 KYO3 primers. Reaction conditions were: 95 °C for 6 min followed by 35 cycles of 15 s at 95 °C, 30 s at 53.5 °C, and 45 s at 72 °C. Three technical replicates were prepared for each sample for each assay, and data were analyzed with BioRad CFX Manager (Version 3.1). Standard curves were prepared using genomic DNA from Escherichia coli (ATCC strain 11775, obtained from the American Type Culture Collection (Manassas, VA, USA)) and Saccharomyces cerevisiae (ATCC strain S288c) for bacteria and fungi, respectively. All reaction efficiencies were >99.5% and all r2 were >0.990. Results were standardized to the original dry mass of substrate (wood or soil) and are reported as gene copies g−1.

2.6. Chemical Analyses

Chemical analyses were conducted to determine changes in substrate quality and nutrient content along the wood decomposition gradient and in soil. Chemical analyses were conducted to determine changes in substrate quality (C:N) and nutrient content (%N and δ15N) along the wood decomposition gradient and in soil. This was accomplished by measuring percent C, N and δ15N of composite wood and soil samples at University of Michigan Biological Station (Pellston, MI, USA) using a Costech ECS 4010 elemental analyzer (Valencia, CA, USA) coupled with a Thermo Scientific Delta Plus XP isotope ratio mass spectrometer (San Jose, CA, USA). The primary reason we determined %C was to allow the calculation of C:N. We report C:N and %N because these chemical measures are coupled to microbial processes such as decomposition, with both prior and current analyses at our site showing %C varies minimally across stages of decay [4] (%C avg + SE across all 24 samples is 48.1 + 0.2). Wood and soil pH was collected using 0.2 g of composite, ball-ground material using a model 8000 pH meter following the manufacturer’s protocols (VWR Scientific, Radnor, PA, USA). Ball-ground samples were added to 15 mL of deionized water, incubated for 30 min at room temperature and equilibrated with a probe for 1 min prior to taking each reading.

2.7. Extracellular Enzyme Activity (EEA)

For each log, a composite sample for enzyme analysis was created by combining 1 g of fresh wood from each of the 9 drill point samples. Aqueous extracts were then prepared by combining 0.5 (±0.05) g of either homogenized wood or sieved soil (see Section 2.3) with 7.5 mL of sterile de-ionized water in a sterile 15 mL centrifuge tube. An aqueous extract was then prepared by combining 0.5 (±0.05) g of homogenized material with 7.5 mL of sterile deionized water in a sterile 15 mL centrifuge tube. Tubes were placed horizontally on a shaker table at 160 rpm for 2 h and then moved to the refrigerator to incubate overnight. The next morning, we measured EEA associated with six enzymes (Supplemental Table S2) using microplate assays similar to Morrissey et al. [39]. Hydrolytic enzymes were measured fluorometrically (360 nm excitation/460 nm emission) using 4-methylumbelliferone (MUB) as the fluorescent label. Labeled substrates were dissolved in ethylene glycol monomethyl ether (EGME) and brought up to desired concentration with MES (0.1 M, pH 6.1). The only exception was for the leucyl aminopeptidase assay, which used 7-amino-4-methylcoumarin (AMC) as the label and Trisma buffer (50 mM, pH 7.8). Phenol oxidase and peroxidase activities were measured colorimetrically (460 nm, using an empirically determined micromolar extinction coefficient of 7.9 per µmol) with L-3,4-dihydroxyphenylalanine (L-DOPA, 6.5 mM) using sodium bicarbonate buffer (50 mM, pH 6.1). Potential peroxidase activity was determined by the difference between soil with L-DOPA + 0.3% H2O2 and L-DOPA. All substrates and reagents were obtained from Sigma-Aldrich Co., Ltd. (Saint Louis, MO, USA), and measurements were made using a Synergy 2 plate reader (Biotek, Winooski, VT, USA). Three technical replicates were prepared for each assay, blank, and quench curve, and means were used to determine per-sample values. Enzymatic activities were calculated in international “units” (U; 1 U = 1000 mU = 16.67 × 10⁻⁹ kat) defined as the amount of enzyme that forms 1 μmol of product per minute under the assay conditions. Data were standardized to the original dry mass of substrate (wood or soil) and are reported as mU g−1.

2.8. Sequence Analyses

Fungal sequences were processed for quality control using Mothur v.1.39.0 software [40]. Contigs were created with make.contigs, check orient = true since forward and reverse fastq files contained both forward and reverse reads. Forward and reverse raw fasta sequences were trimmed of primers and adapters and demultiplexed. All short sequences (<200 bp) with ambiguous bases were removed from downstream analyses. Clustering was performed with a cutoff of 97% similarity using opticlust to determine Operational Taxonomic Units (OTUs). Taxonomy was classified using the UNITE fungal database [41]. Sequences with low total representation (<5 sequences across all samples) were removed from the dataset. All samples were rarified to 69,143 sequences prior to community analyses, which represents the lowest sequence depth. Raw data were deposited in the NCBI Short Read Archive under accession numbers SRR26222449-SRR26222475.
Alpha diversity within treatments was measured using Chao1, a non-parametric Shannon and inverse Simpson diversity indices in Mothur v1.39.0. Following rarefication, analyses of variance (ANOVA) were run in R to determine if alpha diversity indices changed significantly through decay. Beta-diversity was visualized with a principal coordinate analysis (PCoA) using Bray–Curtis distance matrices [41]. A between-class analysis (BCA) and Monte-Carlo test were applied to both the fungal community and substrate chemistry datasets to analyze variability explained by decay class. A suite of co-inertia analyses using the RV.rtest function of the ade4 package [42] was applied to examine co-variance between fungal community data, substrate chemistry, and a previously published bacterial data set from the same system [33]. Analysis of molecular variance (AMOVA) was also used to test for significant population structure based on the decay class [40]. Lastly, a dissimilarity percentage analysis (SIMPER) was conducted using the vegan package in R to test for contributions to community dissimilarity of taxa at the species and order taxonomic levels.

2.9. Additional Statistical Analysis

ANOVA was used to determine whether there were significant differences in wood chemistry across the decay classes and between CWD and soil, and Tukey’s HSD test was used for post hoc pairwise comparisons. Kruskal–Wallis tests followed by Dunn’s post hoc comparisons were used for analogous comparisons of qPCR and enzyme data. To visualize overall patterns in enzyme activity, a PCoA was performed using the Bray–Curtis coefficient. Lastly, Pearson correlation analysis was used to identify significant relationships between environmental data and alpha diversity metrics, qPCR gene abundances, and enzyme activity rates. These analyses were all performed using the PAST statistical package version 3.20 [43].

3. Results

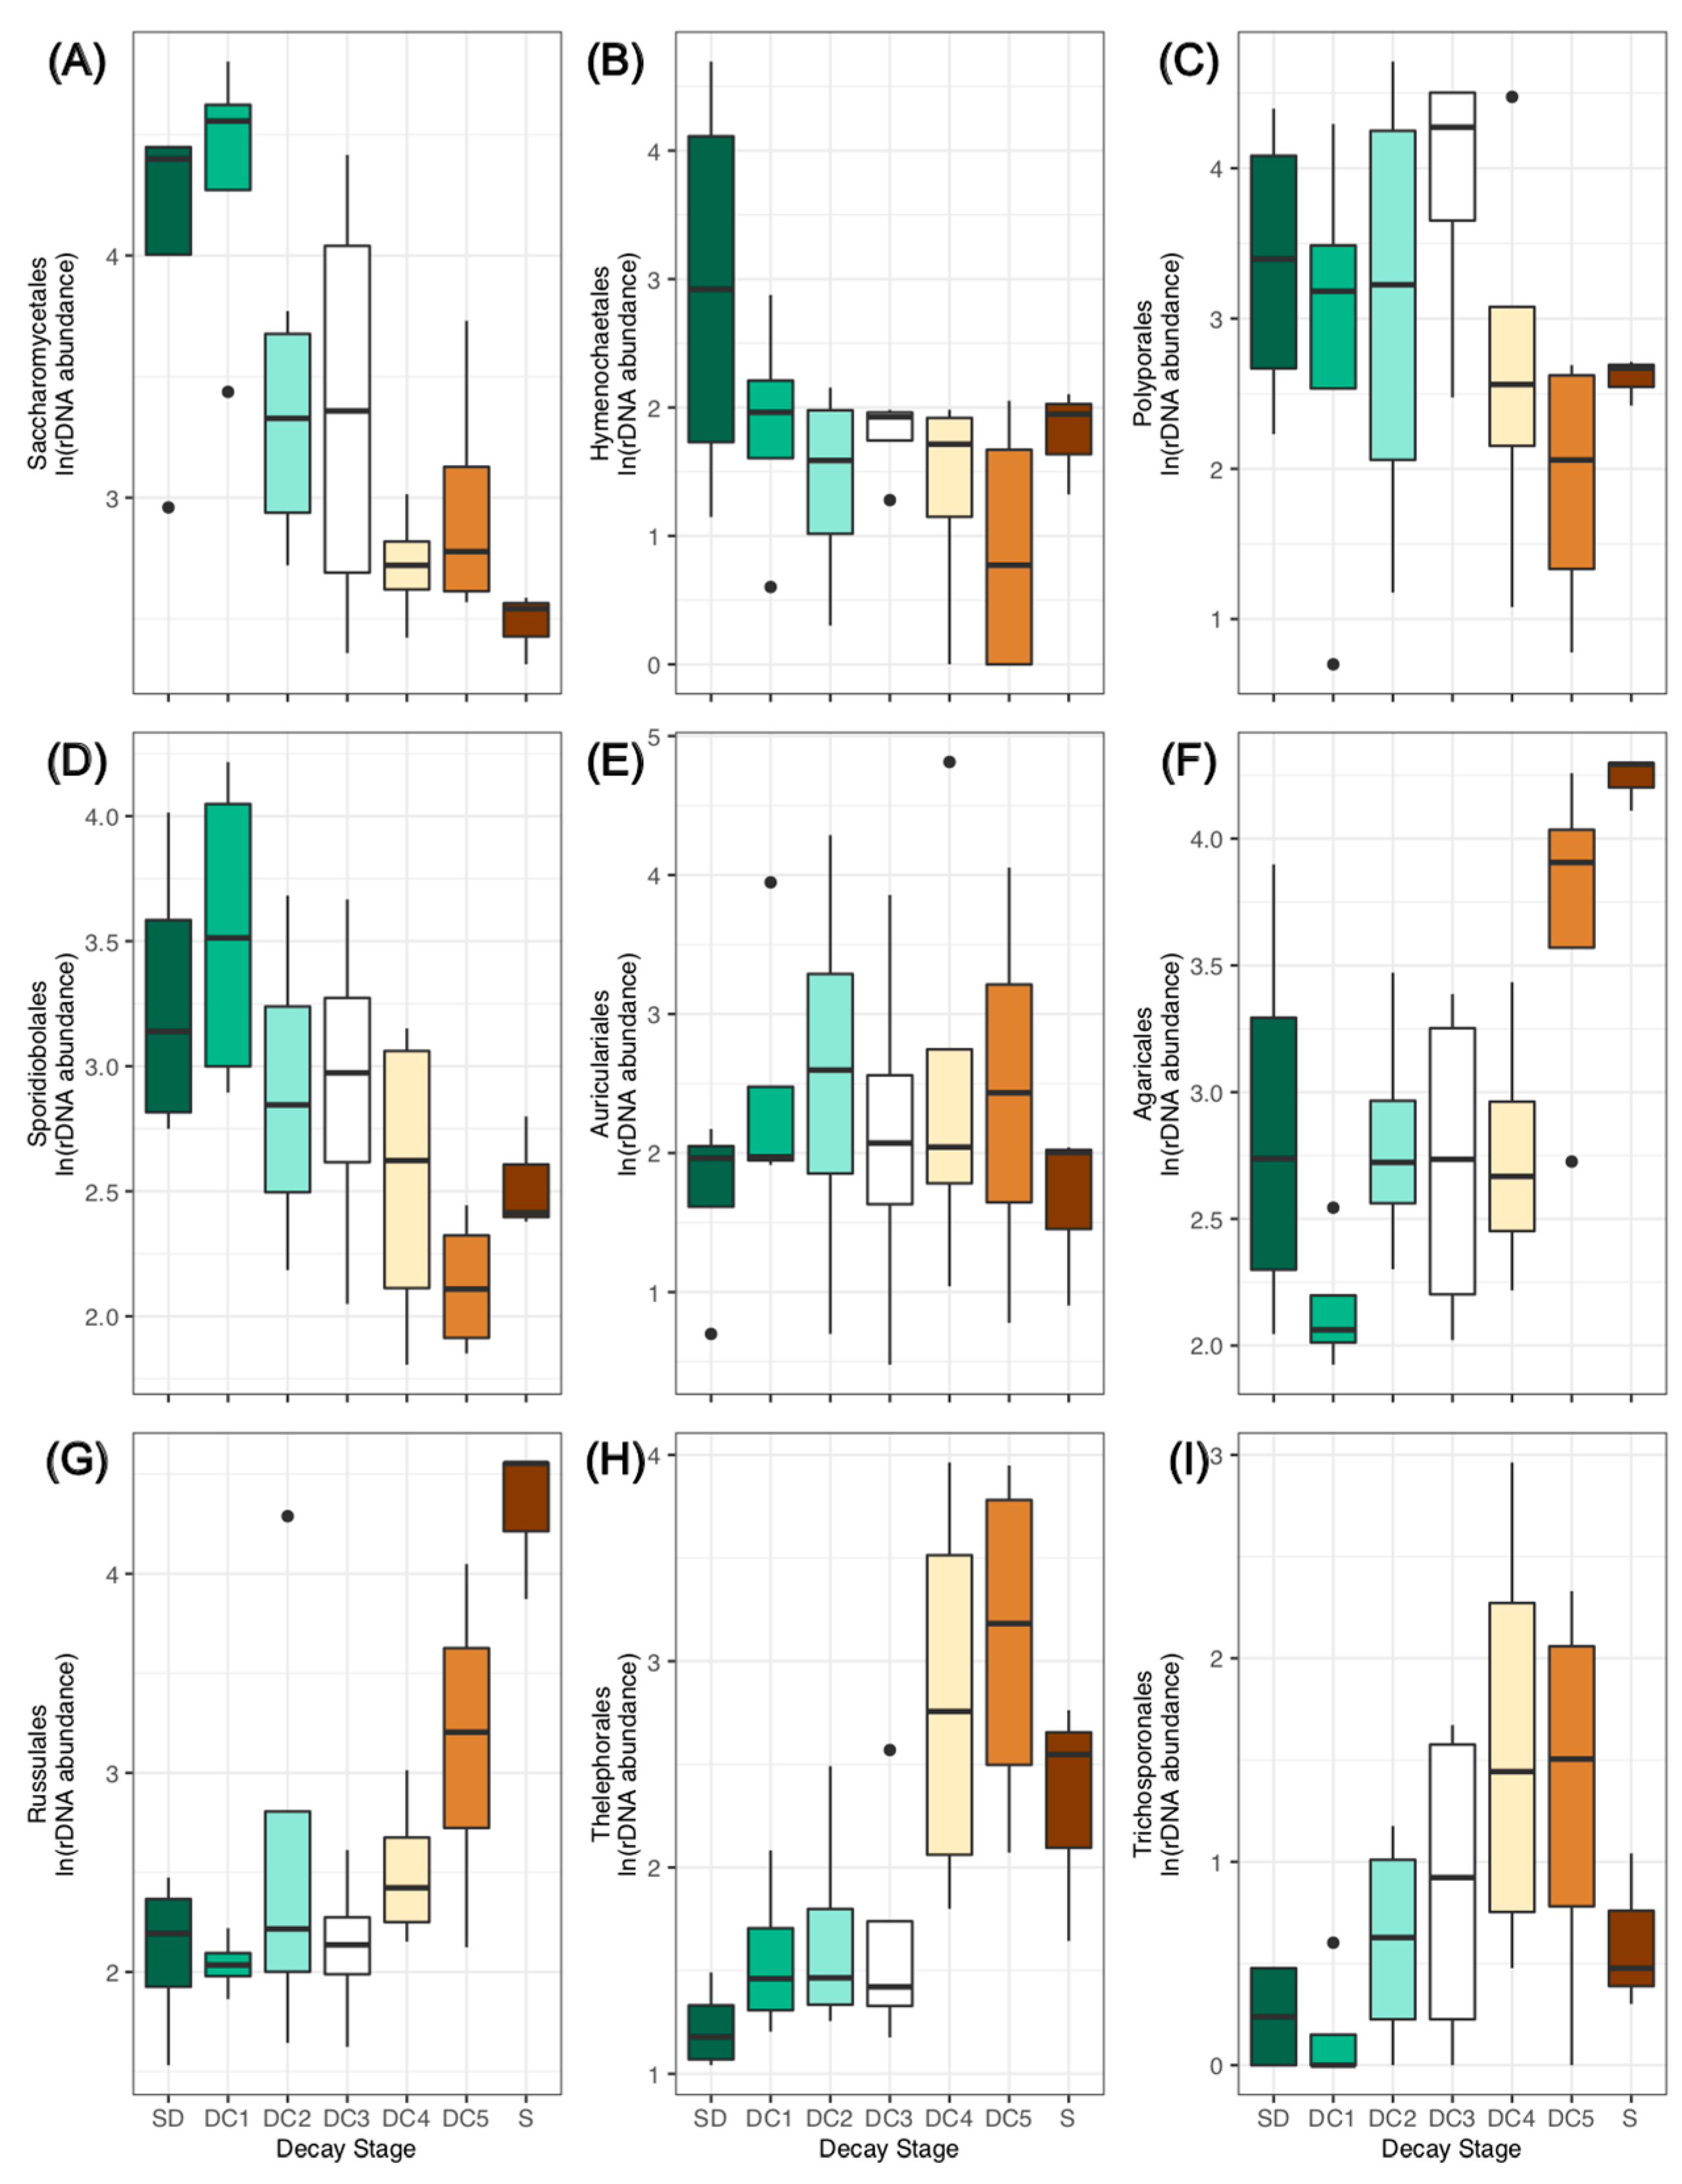
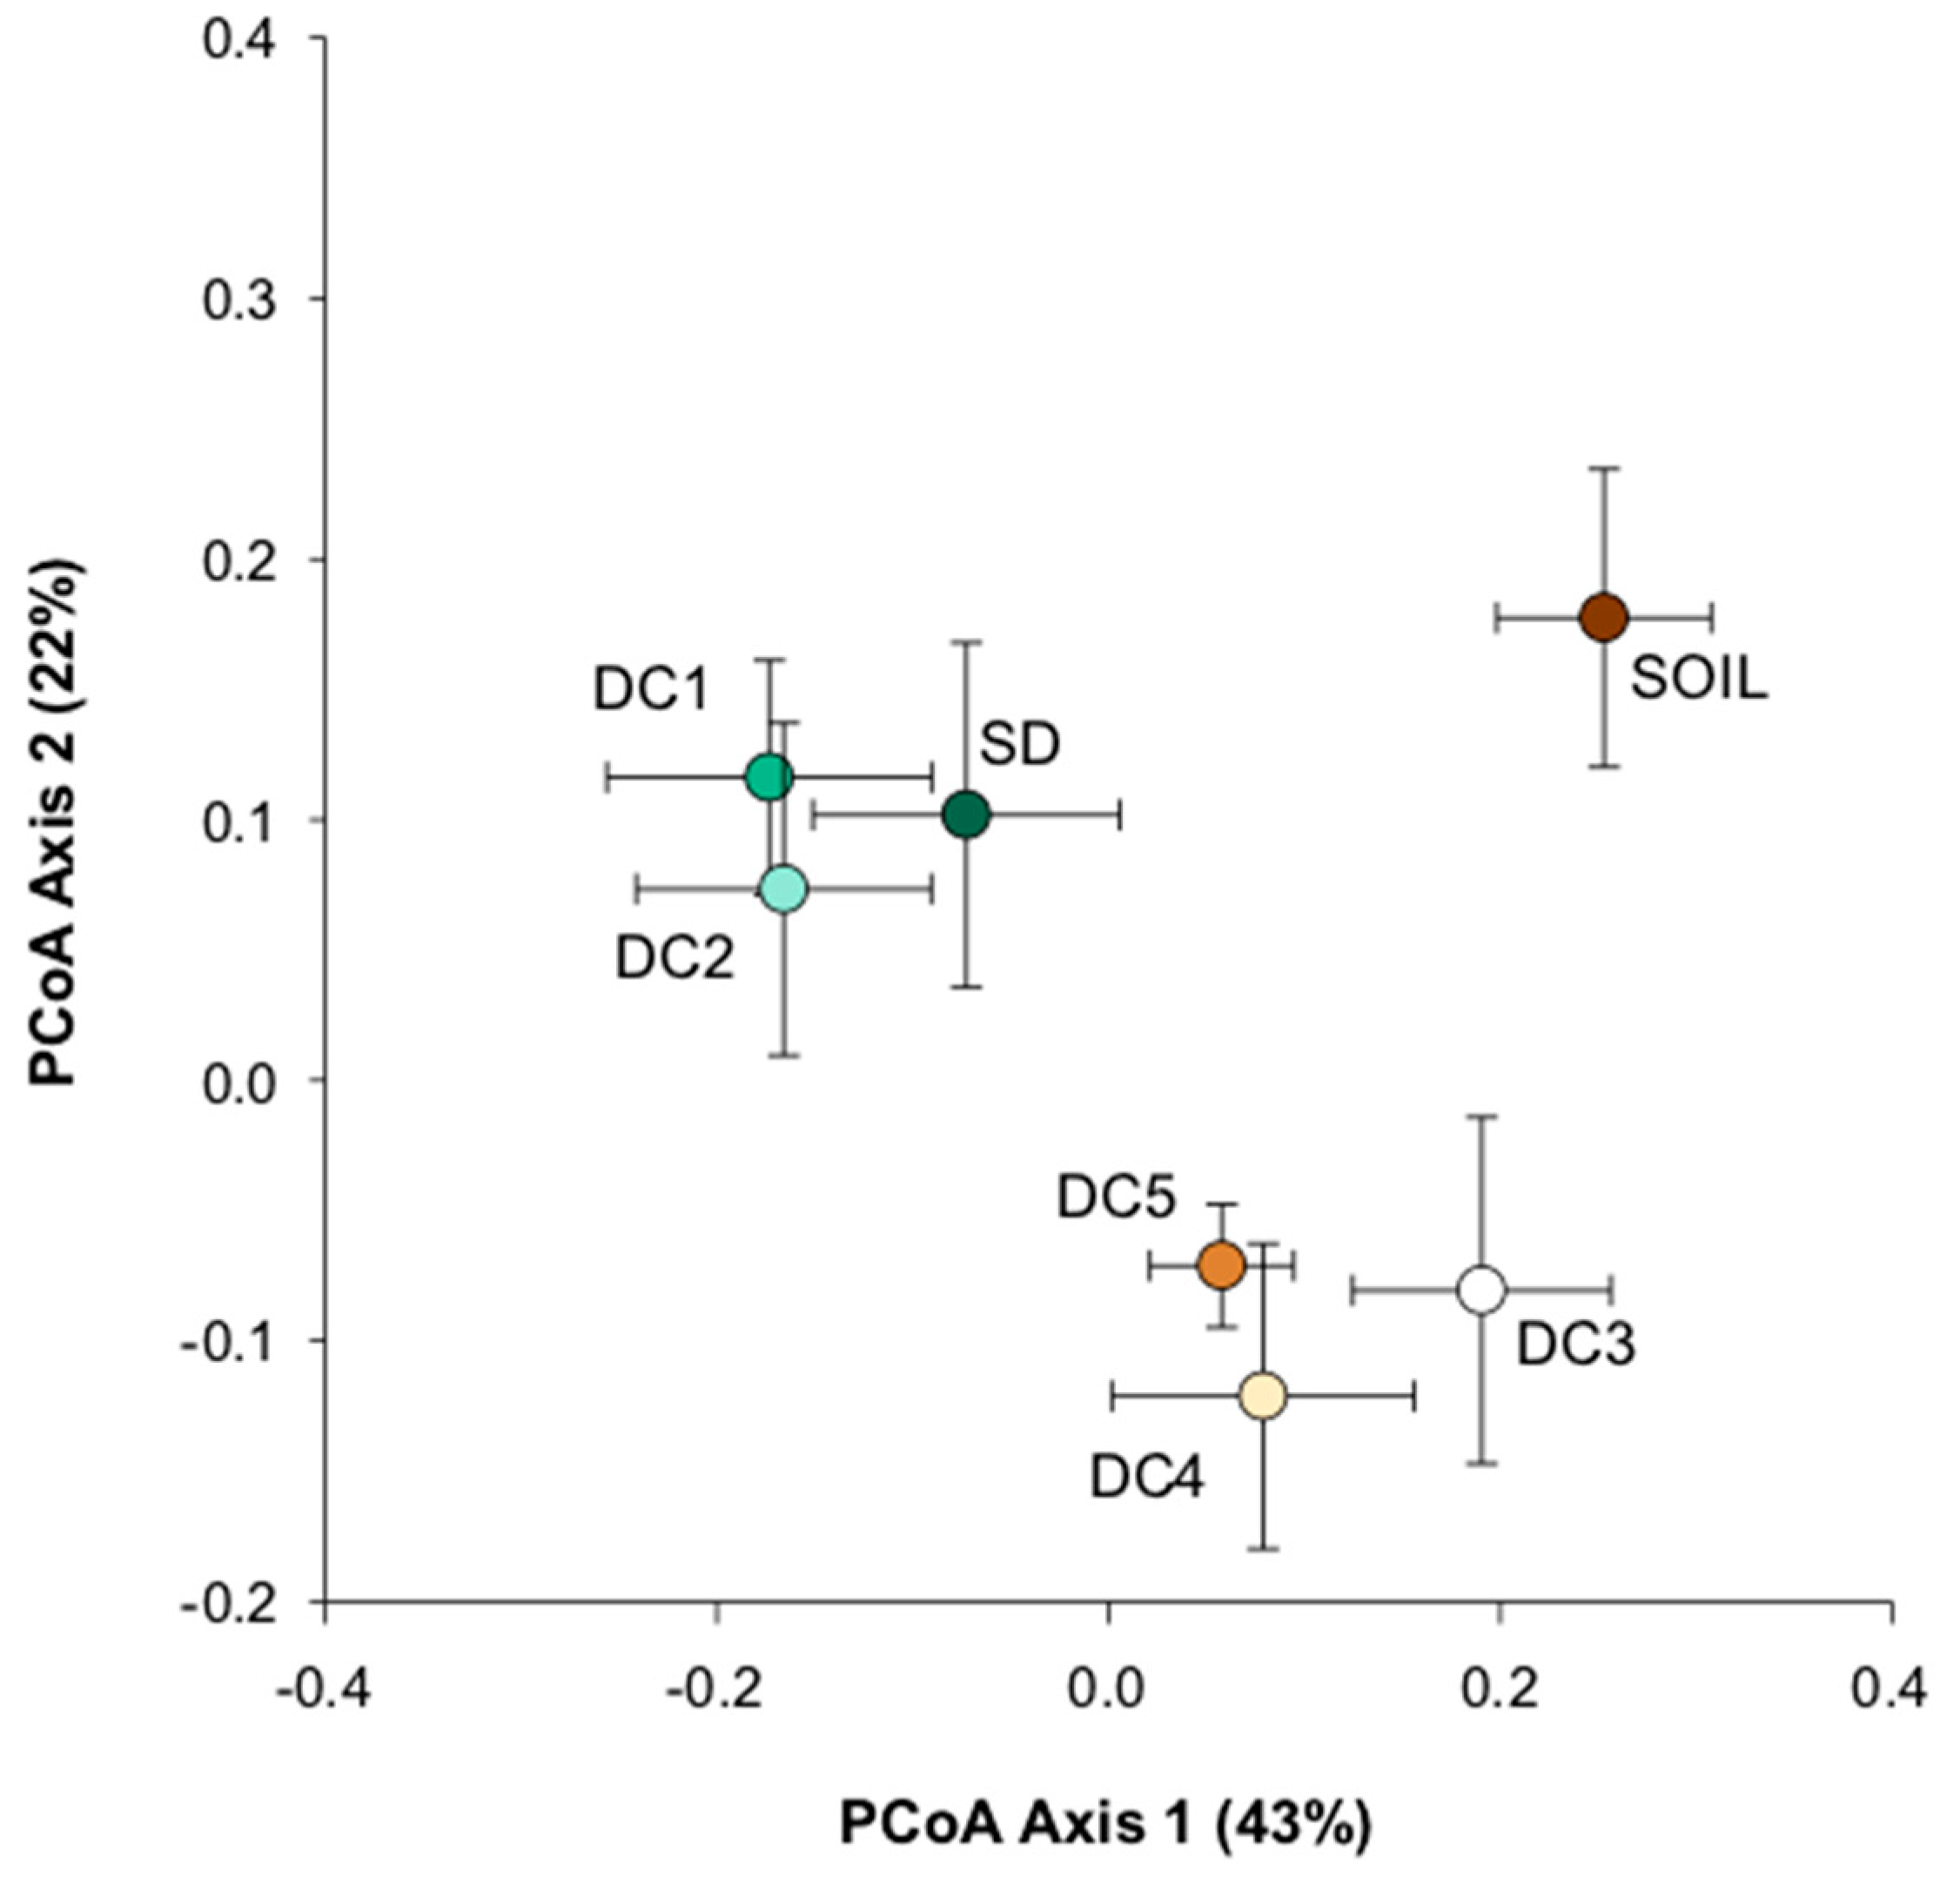
3.1. Fungal Community Structure

The quality filtered raw reads of fungi from wood and soil communities were assigned to a total of 1848 fungal OTUs spanning most major fungal phyla and subphyla (Ascomycota, Basidiomycota, Mucoromycota, and Chytridiomycota) (Supplemental Figure S2). Of these, 86.3%, 58.6%, 48.5%, and 37.5% could be taxonomically assigned to phylum, order, family, and genus, respectively. Out of the 1848 total OTUs, 26 accounted for 1% or more of total sequences across all samples, with only six accounting for more than 3%. The mean number of fungal OTUs per log was 588 (~106 s.d.). The number of fungal OTUs ranged from 809 in a DC 5 log to 371 in a DC1 log (Supplemental Table S3). There was a total of 6 and 59 OTUs that were only detected in SD and S, respectively. These SD-only and S-only OTUs were very rarely detected, with the most abundant of them representing 0.0035% of the total pooled communities.
Distinct community differences were detected between decay classes at both the species and order levels. The 20 most abundant fungal OTUs and their tentative genera/species identification showed a predominance of wood-decaying Agaricomycetes and yeasts (Supplemental Table S4). Rigidoporus corticola was the most abundant OTU overall, with several yeasts including an unclassified saccharomycetous yeast, Scheffersomyces shehatae, and Rhodoturula lignophila as the next most abundant species. These were predominantly represented in standing dead and early decay stage (DC1–DC2) samples. The Saccharomycetales was the most abundantly represented order followed by the Polyporales and Auriculariales. The Saccharomycetales, Hymenochaetales and Sporidiobolales were dominant orders in early decay stages (SD–DC2) while the Agaricales, Trichosporonales and mycorrhizal taxa in the Thelephorales and Russulales established in later decay stages (DC3–DC5) (Figure 1). The Polyporales were strongly represented in early decay stages and remained persistent members of successional communities until a precipitous drop off in member association in late decay stages (DC4–DC5). Despite these community differences, an ANOVA on the alpha diversity indices showed no statistical difference between any decay class or between wood and soil (Supplemental Figure S3).
A PCoA analysis of the fungal communities shows a general clustering within decay class treatments, with late stages (DC4–5) separating from earlier stages. There was a general trend of decay class overlapping predominantly with neighboring classes, with the first two axes explaining 10% and 9% of the clustering, respectively (Supplemental Figure S4). A between-class analysis (BCA) with the sole explanatory variable being the decay stage explained 30% of the total variability in fungal community composition along a gradient of decay (Figure 2A) and showed similar clustering and overlap as observed in the PCoA. In both analyses, soil samples were distinctly separated from the CWD samples. We found significant structural differences in fungal communities between decay stages using an AMOVA (p < 0.01). A Tukey post hoc analysis revealed that all CWD samples were significantly different from the soil community (Table 1, all p < 0.028). Within CWD samples, fungal communities in the early decay stage (SD) were distinctly different from communities in the later decay stages (DC3-DC5). Though pairwise comparisons were only significant for SD, it is worth noting that DC 1 showed a strong trend in differentiation in community structure from DC4 and DC5 (p = 0.059 and p = 0.082, respectively; Table 1). There were no significant differences between any of the remaining decay stages.
A SIMPER analysis of community dissimilarity revealed that, on average, ~75% of dissimilarity between soil and all decay class communities can be explained by differences in the abundance of the top 10 taxonomic orders. However, between soil and DC5, the stage closest to incorporation into the soil, only ~50% of dissimilarity could be explained by the top 10 contributors to community difference. Early stages of decay (i.e., SD and DC1) had a high diversity of Saccharomycetales and Hymenochaetales, differentiating them from later decay stages and soil. Taxa in these orders were responsible for ~23% of community dissimilarity between SD samples and logs from later decay stages (DC3–DC5). Saccharomycetales, being highly represented in DC1, accounted for ~25% of community dissimilarity between DC1 and both DC4 and DC5.
At the OTU level, most of the community dissimilarity between classes could be attributed to the most abundant OTUs of each decay class. The SIMPER analysis identified two OTUs assigned to Russula sp. and Cortinarius sp. that were found predominantly in soil and responsible for ~25% of community dissimilarity between soils and all stages of CWD. The top 10 species across all soil vs. wood comparisons accounted for ~57% of community dissimilarity, highlighting the marked differences between these communities. On average, the top 10 OTUs responsible for community dissimilarity between SD and DC3–5 accounted for 48% of differences. Six of these OTUs among the top 10 were found predominantly in SD (Trichaptum biforme, 2 unclassified Saccharomycetales, Bjerkandera sp., a Pichia sp. and an unclassified Hypocreaceae) and accounted for ~29% of community dissimilarity between SD and DC3–5. Similarly, in comparisons between DC1 and late decay stages DC4–5, 6 OTUs (an unclassified Saccharomycete, Scheffersomyces shehatae, Rhodotorula lignophila, Pichia, Phanerochaete sordida, and an unclassified fungus) were found predominantly in DC1 and accounted for ~34% of community dissimilarity.

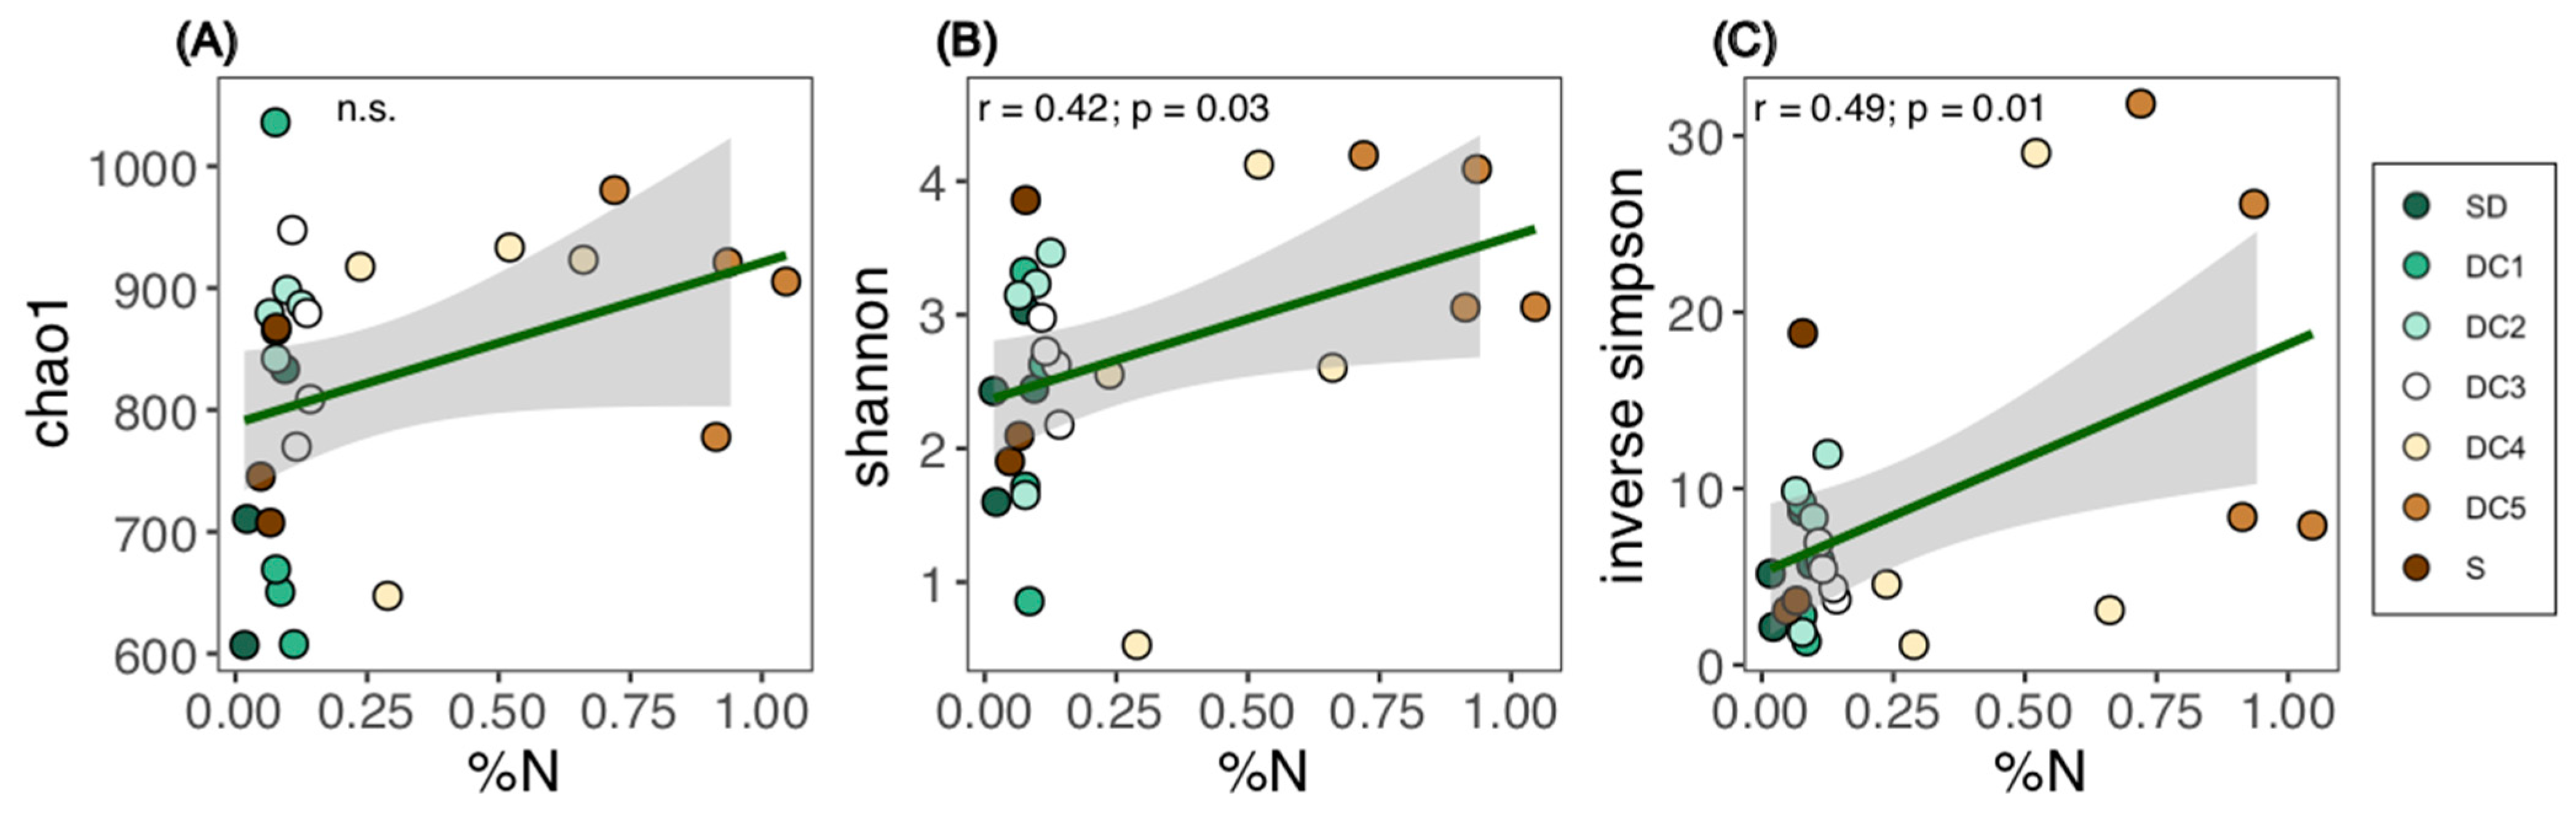
3.2. Wood Chemical Composition and Fungal Succession

Chemical profiles for early decay stages (SD, DC1–2) were similar in makeup and were characterized by relatively low %N, low moisture, high C:N ratios, and a low δ15N (Figure 3). As logs progressed through mid-decay (DC3) and toward later decay stages, we observed an increase in δ15N, %N, and moisture while C:N ratios begin to decline. An ANOVA and Tukey post hoc pairwise test revealed significantly higher %N, δ15N, and moisture and lower C:N in the late stages of decay (DC4–5) relative to all earlier stages of decay. No significant differences in pH were detected between decay classes or standing dead trees and soil (Supplemental Table S5; mean across all samples: 4.99, standard error: 0.11). Across all classes of decay, pH varied 100-fold from roughly 4.0 to 6.0, though in a stochastic manner.
While there was a general average trend towards decreasing pH from 5.53 in DC1 logs to 4.64 in DC5 logs (7.6× more acidic), variability within decay classes was considerable. For example, variation within DC1 logs ranged from 4.79 to 6.0, representative of the average differences within each decay class. Our average pH values for Populus match those of other studies in Fagus [27,32] and other hardwood species [11].
A BCA examining the effects of decay stage on wood chemical composition indicated that 65% of the variation is explained by decay class and showed clustering of DC4–DC5 separate from earlier decay classes (Figure 2B). Soil was distinctly different in chemical profiling than any decay class. Overall, diversity measures were positively correlated with increasing levels of %N (Figure 4).

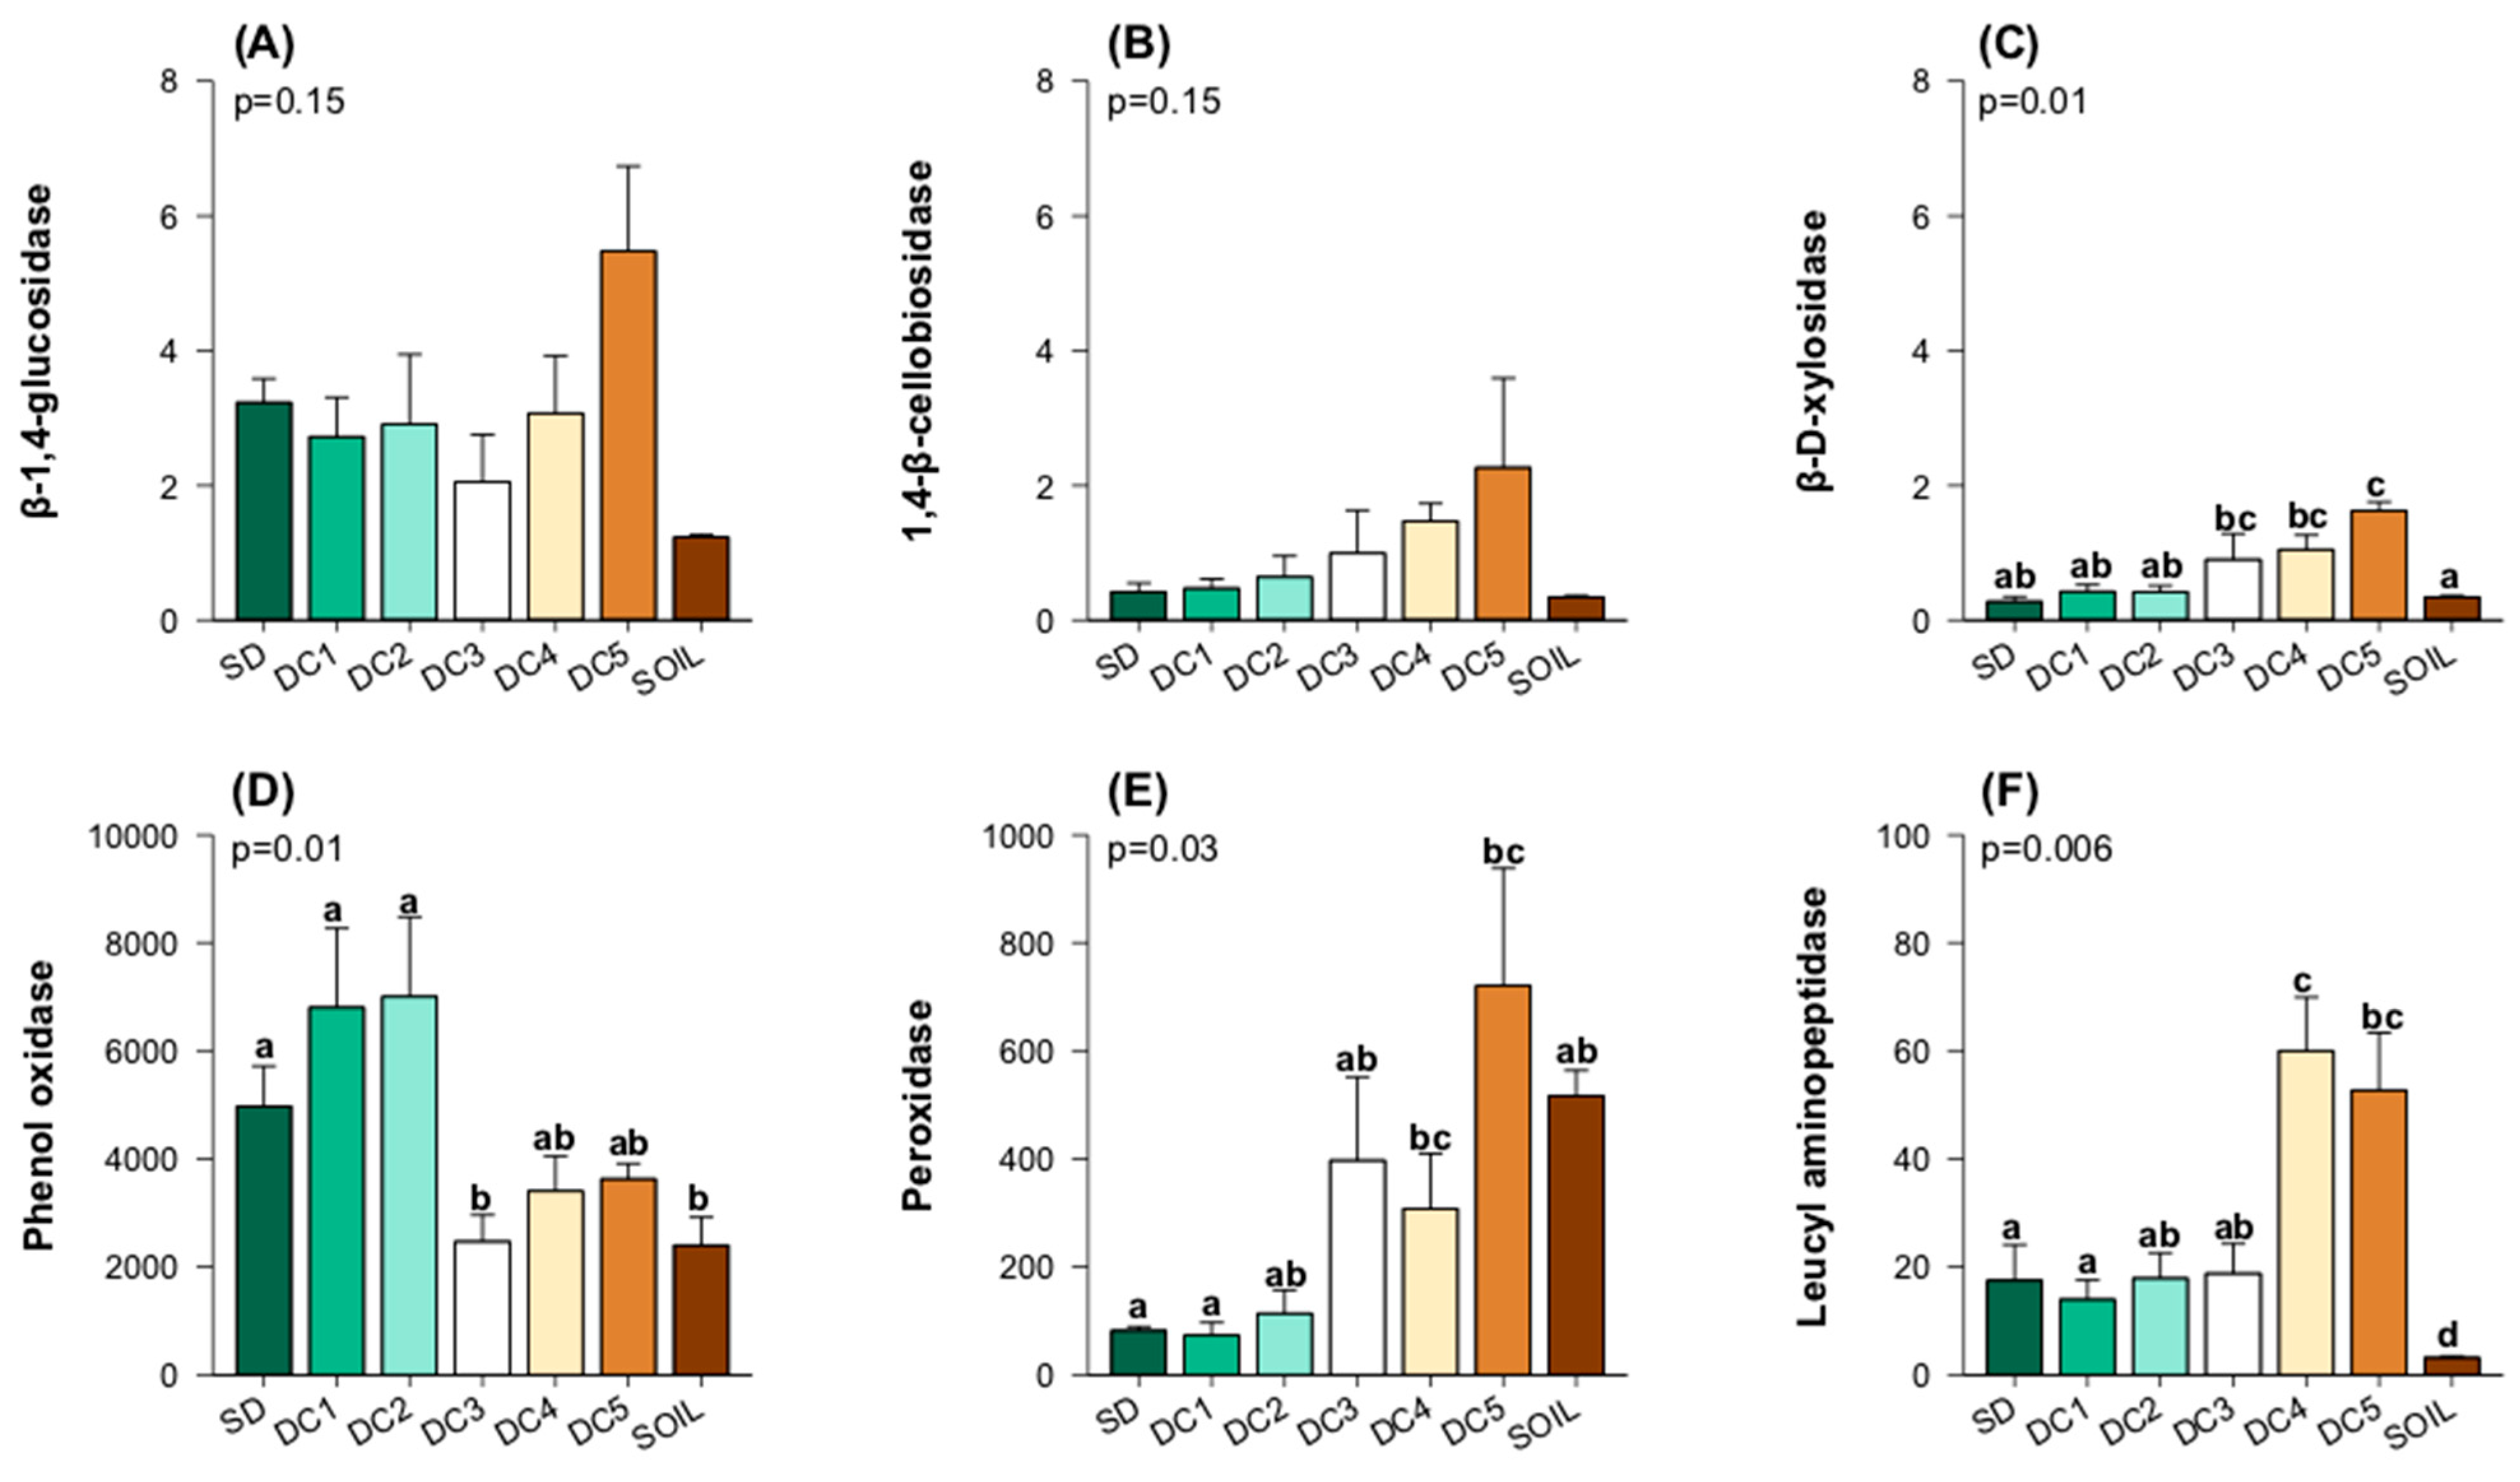
3.3. Enzyme Activity

The enzyme assays revealed differences in the activity between decay stages, with the strongest treatment effects evident for enzymes that break down more complex organic polymers (Figure 5). A Kruskal–Wallis test revealed no differences in extracellular enzyme activity (EEA) associated with cellulose degradation (β-1,4-glucosidase and 1,4-β-cellobiosidase) across decay classes and soil, though there is a trend toward higher activity in later decay stages, especially for 1,4-β-cellobiosidase in DC3–5. Enzymes used in the degradation of hemicellulose (β-D-xylosidase) and for N-acquisition from polypeptides (leucyl aminopeptidase) increased in activity in late stages relative to early decay stages (SD–DC2) and peaked in DC4–5 (Figure 5). For EEA associated with lignin breakdown, we saw two different patterns. Phenol oxidase (laccase) activity peaked in the early stages of decay (SD–DC2) whereas peroxidase activity increased in the later stages (DC3–5). A PCoA using Bray–Curtis metric showed three distinct clusters of enzyme profiles separating early decay stages (SD–DC2), late decay stages (DC3-DC5), and soil, with the first two axes accounting for ~65% of the variation (Figure 6). Correlation analyses revealed a significant positive relationship between %N and the activity of all enzymes except phenol oxidase (Supplemental Table S6). In contrast, we found no significant correlations between any of the enzyme data and pH (all |r| < 0.39 and all p > 0.06) and only a few relationships with C:N (all |r| < 0.38 and all p > 0.05 except peroxidase (r = −0.45, p = 0.03)) and δ15N (all |r| < 0.36 and all p > 0.09 except phenol oxidase (r = −0.47, p = 0.01)). Correlations with moisture were not evaluated since data were normalized per g dry weight of materials.

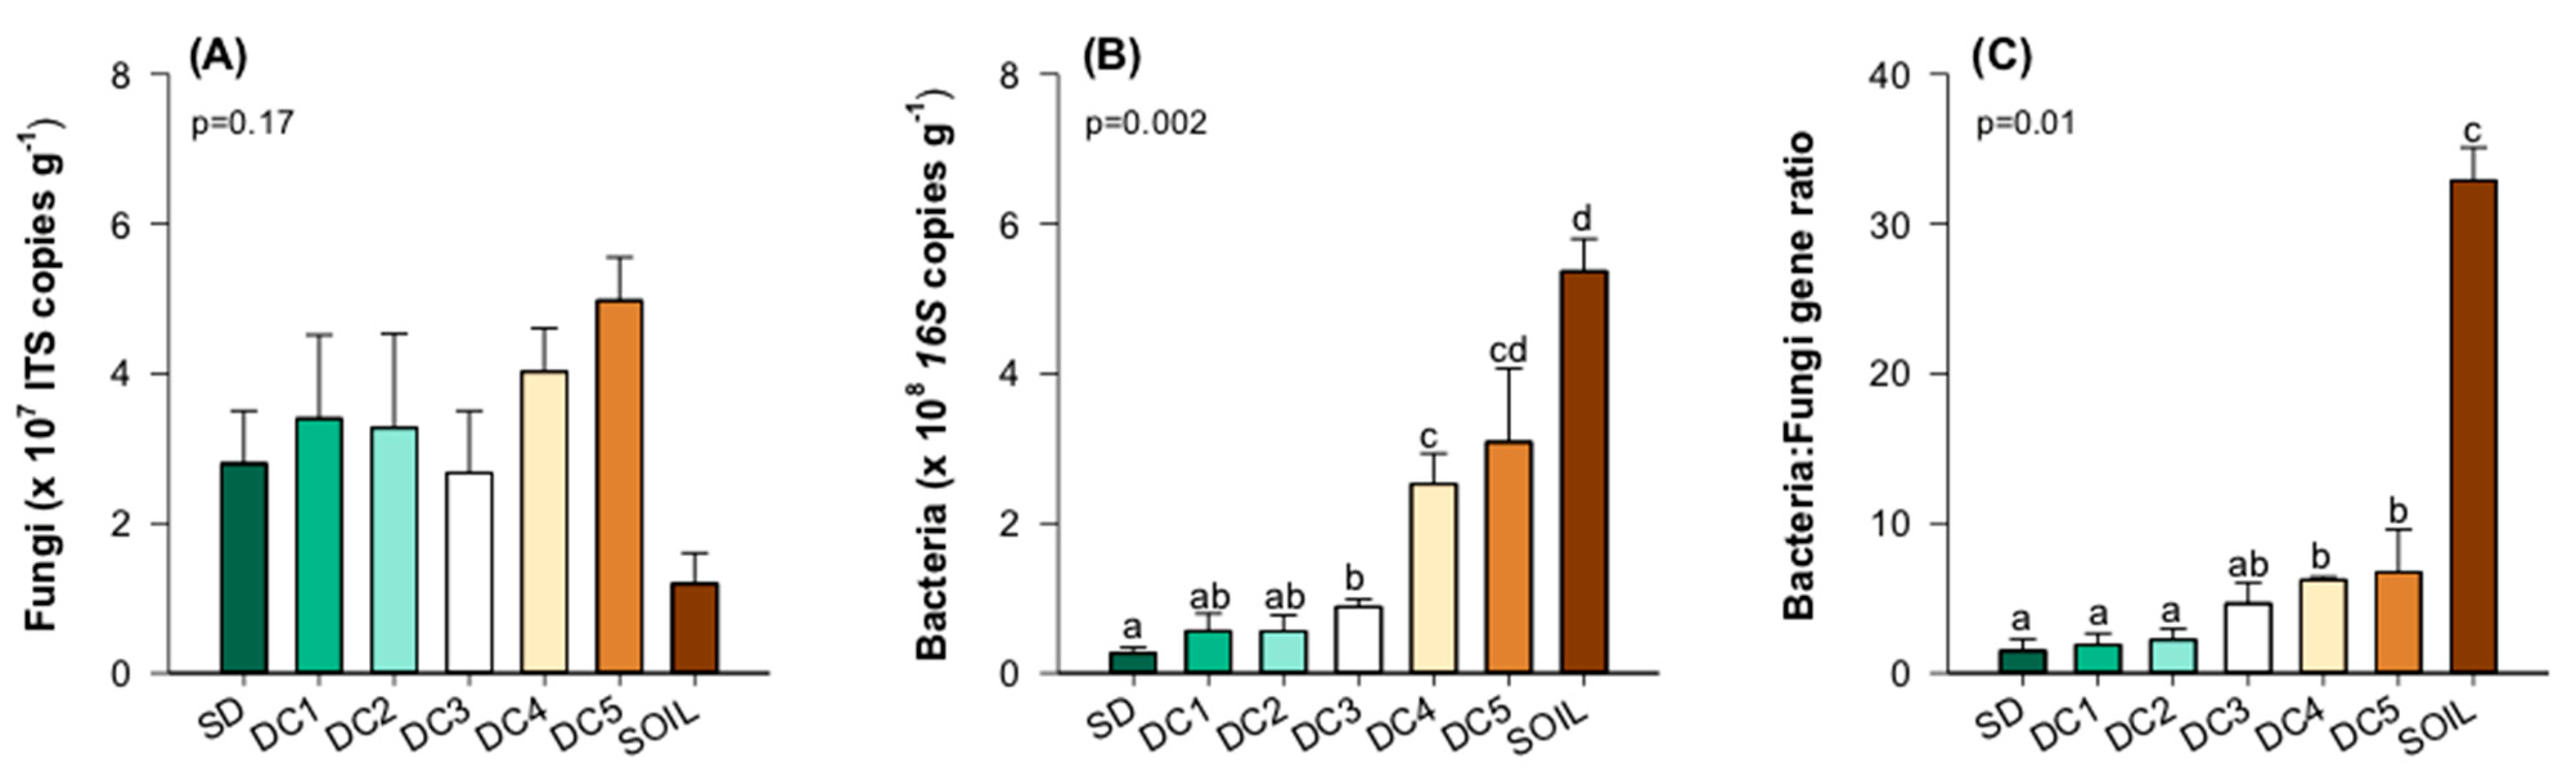
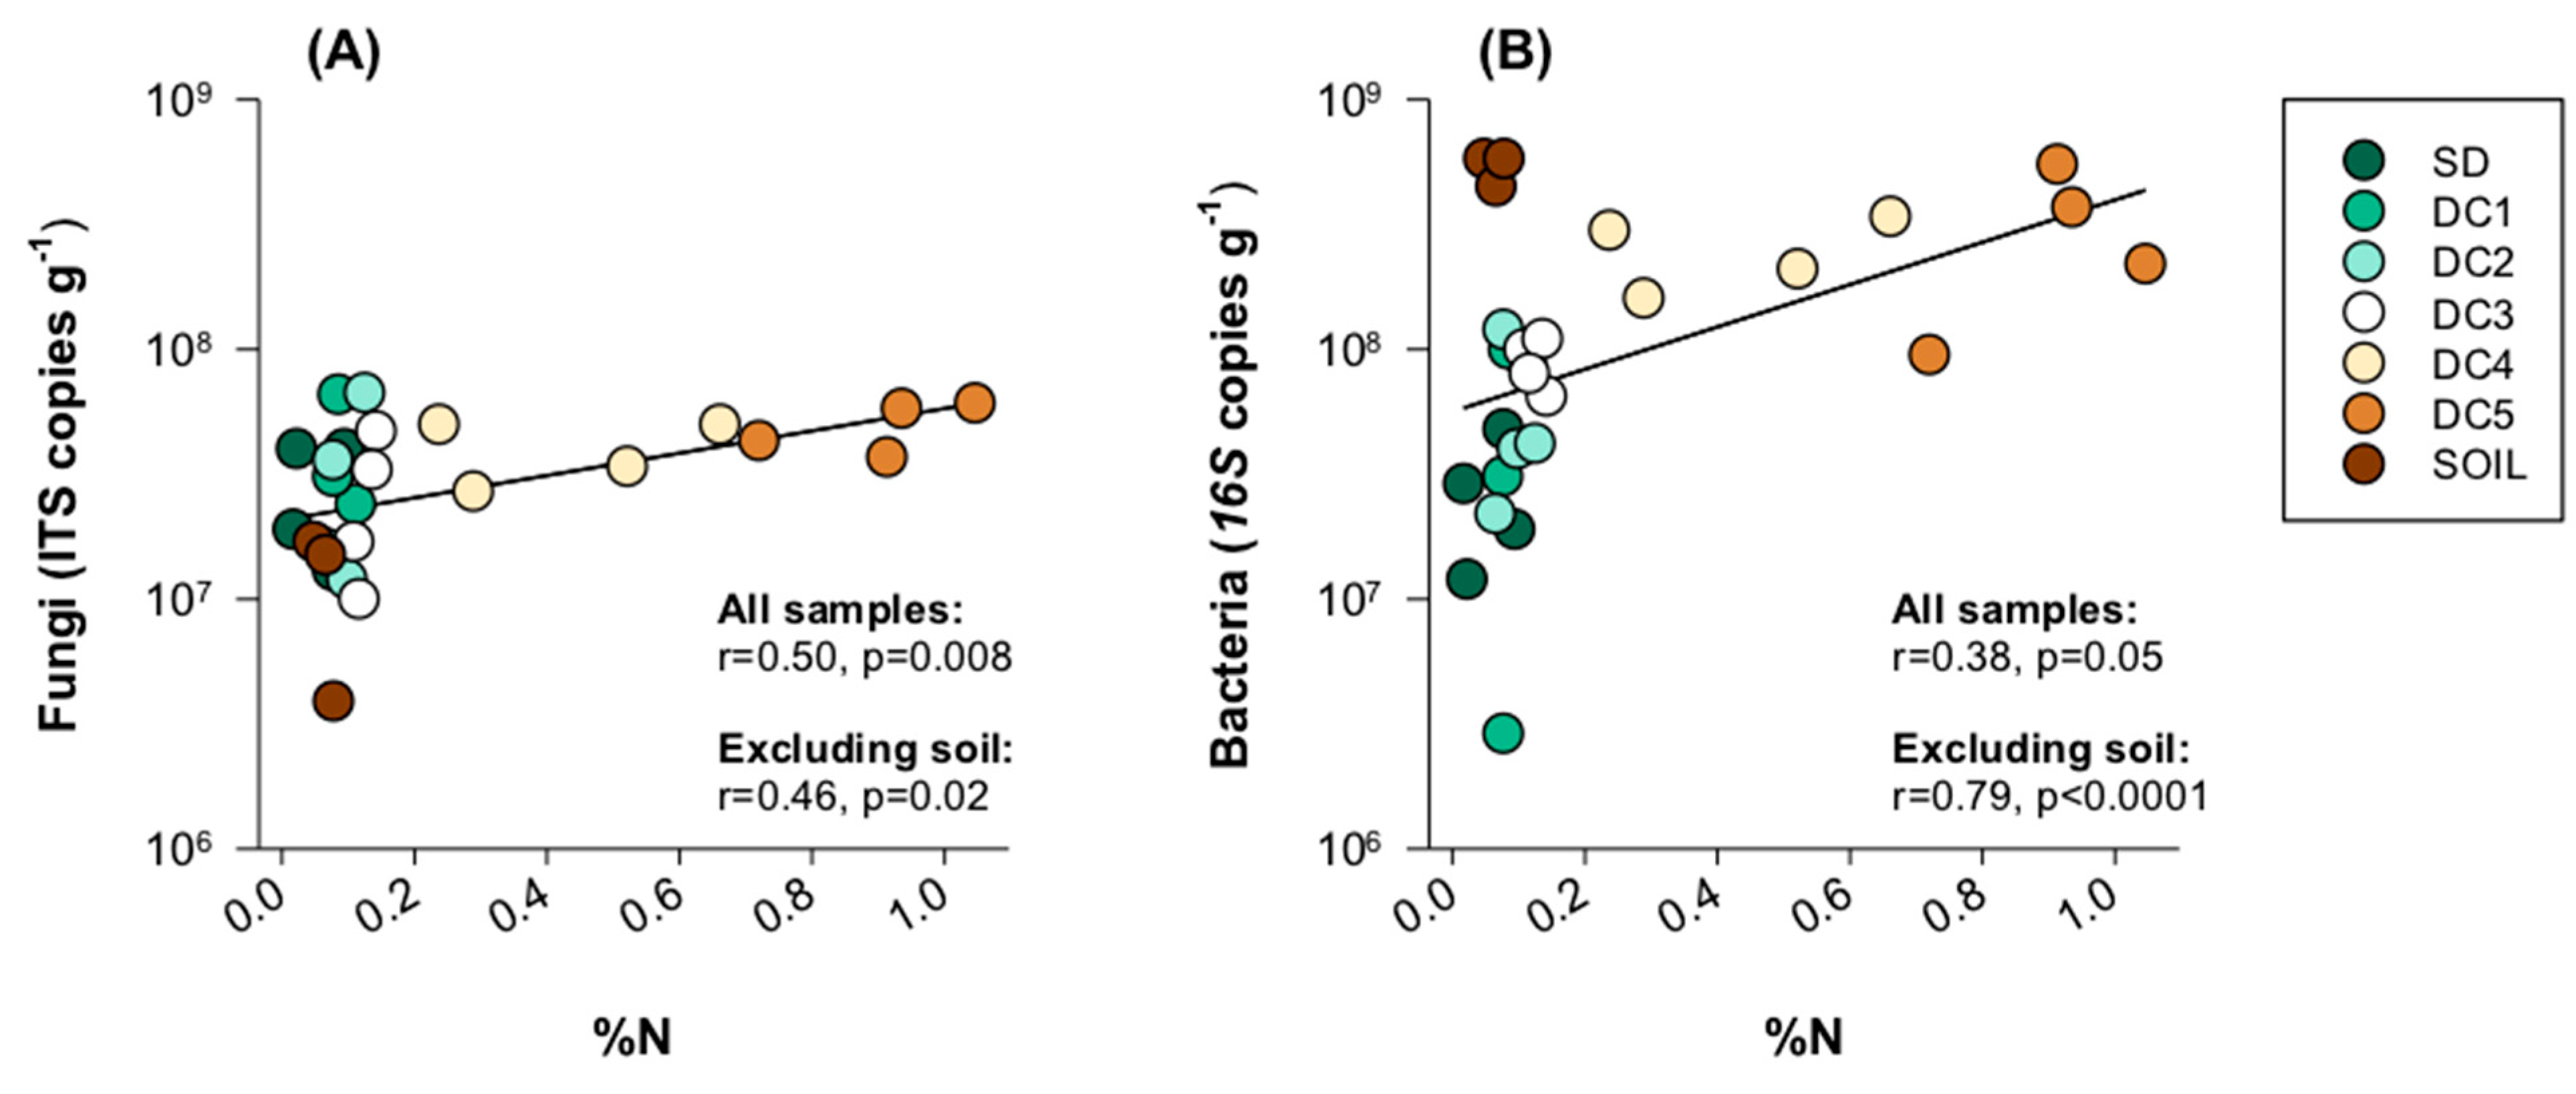
3.4. Fungal and Bacterial Interactions

Gene copy abundance (either ITS or 16S rRNA) was used as a proxy to examine how fungal and bacterial population size changed with the decay stage. Fungal gene abundance was consistently higher in CWD compared to soil, by 3-fold on average, but did not differ significantly across decay classes (Figure 7A). This is in stark contrast to bacterial gene copies where Kruskal–Wallis followed by Dunn’s post hoc tests revealed bacteria significantly increased in abundance with the decomposition stage (p = 0.002, Figure 7B). As a result, coincident with the increase in bacterial abundance, a gradual increase in the bacteria:fungi ratio was observed along the decomposition gradient. Bacteria:fungi ratios in wood were significantly lower than those of soil, a pattern that was driven in large part by the relatively lower abundance of fungi in soil samples. Within the CWD series, we found lower ratios in the early decay classes (SD, DC1–3) compared to the later ones (DC3–5). Correlation analysis revealed a significant positive relationship between fungal abundance and %N (Figure 8A), but no significant correlation with other chemical properties (all |r| < 0.33 and all p > 0.21). For bacteria, a strong positive correlation with %N was also evident (Figure 8B).
To further assess fungal and bacterial community co-variation, we compared the fungal community composition data presented here with our prior published bacterial data [33]. The suite of co-inertia analyses revealed that fungal and bacterial communities have a stronger co-variance with each other (0.66) than either does with substrate chemistry (0.51 and 0.52, respectively), suggesting a strong influence of fungal–bacterial interactions along the successional gradient of wood decay.

4. Discussion

Our study provides an extensive taxonomic view of the complexity of fungal community succession and associated chemical substrate changes along a ~60-year successional continuum of P. grandidenta wood decomposition, from standing dead trees to the soil. This was possible because of the utilization of newly designed degenerate primers for amplification of the fungal ITS2 region that allowed for more enhanced coverage of fungal communities than was previously available [44].
No differences in evenness, richness, or fungal abundances were found along the SD to DC5 gradient (Supplementary Figure S3). In contrast, prior studies have reported increasing measures of diversity as decomposition proceeds within Fagus sylvatica, Picea abies, and Pinus sylvestris logs [19,28,29,32]. Mäkipää et al. [28] also found that soil fungal communities were more species rich compared to wood communities, which was not consistent with our findings. However, similar to our findings, Baldrian et al. [27] did not find a clear trend in diversity with increasing decomposition in Fagus sylvatica, suggesting that additional studies are required to determine how fungal diversity responds to decomposition in various host tree species in different ecosystems. In a time-point comparison, Leonardt et al. (2019) found mean fungal species richness in logs of Populus to be the second highest of 13 studied species. They identified 143 OTUs in a 6-year old log (comparable to our DC1 logs), while we identified 506 OTUs. This is likely in part because of the different primers used across studies and highlights the importance of primer choice in monitoring environmental microbiomes. While we found no differences in fungal diversity within our examined logs, measures of bacterial species diversity in those same logs increased over the course of the succession [33], suggesting a complex pattern of microbial dynamics. As was found in other studies [19,27,45,46,47], a general pattern of fungal community composition was difficult to summarize succinctly, as it is likely that initial fungal establishment, which is probably highly stochastic, may set each individual log on a unique successional trajectory.
While no differences in evenness, richness or fungal abundances were found along the SD to DC5 gradient, we did detect changes in fungal community structure, enzyme activity and substrate chemistry. Abiotic factors such as moisture content, %N, and δ15N tended to increase while C:N decreased in later decay stages, an indication of more porous, highly decomposed wood [5,48]. Shifts in these abiotic factors have been shown to correspond with shifts in growth rate and community composition of wood decay fungi [49]. In our study, these associated changes in chemistry were accompanied by changes in fungal communities at various taxonomic levels.
Notably, we found fungal and bacterial community succession [33] was closely coupled. As wood decay progresses, bacterial communities became less influenced by changes in resource availability and more affected by interactions with other bacterial species and fungal species. Previously, Kuramae et al. [33] observed a significant increase in both the proportion (+9.3%) and intensity (+62.3%) of interspecific interactions during the later stages of decomposition in our study system, indicating the development of a more intricate community structure. In the current study, we identified a transition from early stages of decay (SD to DC1–2), which are mainly composed of non-filamentous yeasts, heart rot fungi, and white-rot fungi, to later stages of succession that resemble soil communities and exhibit significant presence of mycorrhizal taxa and yeasts commonly found in leaf litter and soil. Both fungi and bacteria displayed a strong, positive correlation between abundance and %N. The combined data highlight the dynamic and complex nature of microbial community succession during wood decay and suggest a strong relationship between N-fixing bacterial species and fungal community succession developing during early succession [30,50,51,52] that contributes to further fungal-bacterial interaction, and perhaps interdependence, as decay proceeds. Further studies disentangling the roles of fungi and bacteria in wood decomposition will contribute to a better understanding of ecosystem functioning and the development of sustainable forest management practices.
At the phylum level, we found the greatest diversity was accounted for by the Basidiomycetes and Ascomycetes, with approximately 90% of OTUs at all stages of decay belonging to these two phyla. Early decay stages, particularly SD and DC1, had large abundances of ascomycetous fungi. Members of these early ascomycete-dominated communities belonged predominately to the Saccharomycetales, a group of saprotrophic yeasts [53]. Similarly, much of the basidiomycete community in early decay stages was comprised of non-filamentous yeasts, which were also strongly represented in standing dead trees, illustrating early colonization and establishment by yeasts prior to felling. Similar results showing bacterial species present in standing dead trees contribute to patterns of bacterial community establishment and early successional trends suggest the need for all future studies to also sample live trees as a part of the decomposition continuum [33].
Although both ascomycetous and basidiomycetous yeasts are commonly associated with the early stages of wood decay and can be isolated easily from bark [54], they are often considered non-wood decay fungi because they target simple sugars in the bark and callous tissue prior to colonization by filamentous basidiomycetous fungi that break down more recalcitrant woody substrates [55,56]. Colonization and establishment in the early stages of decay are likely a combination of arrival via dispersal by wind and precipitation [25] but their persistence through the decay process suggests a role in the decomposition process. These yeasts are restricted to localized decomposition in the portion of the log in which they become established and may assimilate nutrients made available from the decomposition of hyphae during the early stages of decay [57].
Yeasts were accompanied in early stage dominance by sap- and heart rot species in the Hymenochaetales (e.g., the sapwood-rotter Trichaptum biforme) as well as white-rot taxa in the Polyporales. Our standing dead samples had a strong representation of asco- and basidomycetous yeasts as well as filamentous basidiomycetes from the Polyporales and Hymenochaetales. Both orders contain fungi important in the colonization and decomposition of CWD prior to the deadfall of standing boles. Hymenochaetales contains species that saptrophically decay dead wood following tree mortality, as well as species, that cause heart rot in living trees [58]. Invasion and early decomposition of SD boles by wood rotters in the Polyporales and Hymenochaetales may facilitate colonization by Saccharomycetes. Although the yeasts and wood decay fungi may be spatially separated, yeasts can establish in tracheid cell walls that have been previously decayed by basidiomycetous hyphae [59]. One mechanism for this facilitation is the use of phenol oxidases by white-rots to degrade lignin compounds that, in turn, free up more readily degradable compounds like cellulose and xylan. Our study confirms high phenol oxidase activity early in the decay process, particularly in standing dead wood and logs from DC1 and DC2.
As Populus logs transition into mid-successional decay stages, we detected a shift in saprotrophic communities, marked by a precipitous decline in representation of yeasts in the Saccharomycetales and Sporidiobolales while species in the Polyporales maintain abundance in DC3. This decline in ascomycetous yeasts may be due, at least in part, to increased competition with basidiomycetes that out compete them for substrates through mycelial growth and expiration of simple sugars readily available in early decay [60]. Trending with the Saccharomycetales, there is decline in the Hymenochaetales order compared to DC1 and SD logs, emphasized by the disappearance of Trichaptum biforme, a degrader of lignin and one of the most abundant taxa in early decay stages. Trichaptum biforme may be outcompeted in later successional stages of decay as its primary substrate, sap wood, declines rapidly with increasing decay.
In late decay stages (DC4–DC5), taxa that were previously dominant begin to be replaced by the functionally diverse Agaricales that are often associated with wood decay, along with several ectomycorrhizal taxa (Russulales and Thelephorales) and basidiomycetous yeasts in the Trichosporonales. Members of the Trichosporonales have been shown to be abundant in both litter and soil where they likely degrade hemicelluloses and produce antifungal cellobiose lipids that can suppress the growth of other yeast species [61,62,63]. An increase in ectomycorrhizal fungi (ECM) in late decay stages is likely driven by the foraging of this guild for the N-rich substrate made available by the decomposer community [64,65]. It is of great interest to understand the role ECM fungi play in the wood decay process, given that they lack most enzymes for wood decomposition [66].
A shift in wood chemistry accompanies community changes in later stages of decay with sharp increases in %N and moisture during decay stages 4 and 5, a product of fungal and bacterial processing of wood in prior successional stages [48]. The progressive enrichment of CWD nitrogen that we observed is consistent with previous findings, resulting from the combined effects of bacterial N-fixation, mineralization, and mycelial networks translocating N from surrounding soils to aid in further degradation of C compounds remaining in logs [33,60]. The presence of N-fixing bacteria in the early stages of succession along with our 15N data suggest that N-fixation is occurring in our system and may be critical in the early phases of decomposition, providing nitrogen to other bacterial and fungal species that follow in succession [33]. The elevated %N in wood was positively correlated with an increase in the activity of all enzymes except phenol oxidase (Supplemental Table S6). This drop-off in phenol oxidase activity is concurrent with that of polypore abundances, underpinning the C recalcitrance bottleneck that white-rot fungi overcome, with the end result of making the labile C and N components of lignocellulose accessible to other decomposers. In both fungal and bacterial succession, nitrogen availability is correlated with species diversity, suggesting that it is a main driver of microbial succession in these ecosystems [33].
The observed changes in fungal taxa with decay class are consistent with the extracellular enzyme assays we performed, as white-rot taxa representation and phenol oxidase activity both declined in later stages of decay. Interestingly, as lignin is broken down in early decay stages, the activities of all the hydrolytic enzymes we measured increased with the decay class, such as those targeting the more readily degradable hemicellulose molecules (p = 0.01). This could correspond to changes in the fungal community composition and shifts in taxa associated with polysaccharide degradation. Alternatively, because the ability to decompose cellulose and hemicellulose is also common in bacteria, this shift could reflect increased bacterial contributions to the extracellular enzyme pool in dead wood. Supporting this, we found a strong positive correlation between total bacterial abundance (16S gene copies via qPCR) and EEA associated with breakdown of cellulose (β-1,4-glucosidase: r = 0.68, p < 0.001; 1,4-β-cellobiosidase: r = 0.78, p < 0.001), hemicellulose (β-D-xylosidase: r = 0.57, p = 0.004), and polypeptides (leucyl aminopeptidase: r = 0.77, p < 0.001) across the wood decay sequence (i.e., excluding soil samples). Moreover, the strong correlation of bacterial and fungal communities that we observed suggest strongly that the two groups work in concert during the decay process. Likely, this involves inter-domain consortia of heterotrophic organisms that utilize each other’s secreted enzymes [51]. The relative contribution of bacteria versus fungi to hydrolytic enzyme production in deadwood is poorly understood and will likely require additional study using proteomic and transcriptomic approaches to resolve.
We observed stark differences between wood (SD-DC5) and soil fungal communities (Figure 2) and how they relate to bacterial changes previously reported [33]. These differences in fungal communities are not surprising given the large contrasts in soil and wood chemical composition, with soil substrates containing less than half the standard moisture levels (mean + SE for wood: 58.8 + 2.5, soil: 19.3 + 3.0) and an order of magnitude less %C (wood: 48.1 + 0.2, soil: 2.8 + 0.4). Soils in our study also had a much higher δ15N value indicating internal cycling of N in soil substrates, as the enzymes of fungal decomposers discriminate against the heavier 15N isotope. The soil was also starkly different than CWD in bacteria:fungi ratios, as soils had both a much lower abundance of fungi and a much greater abundance of bacteria than any of the wood samples. These ratios are likely driven by differences in both the quantity (<5% in soil compared to >47% in wood) and the quality of organic material. Though not measured in this study, the latter may be particularly important since bacterial and fungal decomposition rates are sensitive to the biochemical composition and quality of the organic matter [67,68,69].
The fact that we did not find significant differences in pH between decay classes or standing dead trees and soil contradicts reports from Fagus sylvatica [27] measured over an equivalent time sequence as our study. In our study, the high variability of pH within each decay class may be a natural consequence of differences in chemistry at various points along and within a log. For example, Moll et al. [11] showed significant differences in the pH of Populus measured between the heartwood and sapwood. Because our study sampled across these two wood compartments creating a composite sample, it is possible that we failed to detect pH changes that were occurring within these wood compartments over the time series that we examined. Thus, in contrast to findings from other fungal and bacterial studies, the role of pH as a driver of succession is less clear in our study system [11,27]. However, the relationship between pH and microbial community structure, species richness, and succession remains obscure [70]. Baldrian et al. [27] found that pH was a significant predictor of fungal community composition, though they were not able to disentangle the impact of pH from N content because these factors were significantly correlated. While Moll et al. [11] found that pH was the most important driver of bacterial community structure, this was based on differences between 13 species and measured only at a single time point (six-year-old logs). And, while the majority of bacteria are strongly affected by the pH [11], Rousk et al. [71] and Nacke et al. [72] have shown that bacteria are generally more affected by pH than fungi.

5. Conclusions

In conclusion, our research fills a critical knowledge gap, demonstrating that fungal community structure changes substantially and in a functionally predictable way over the course of wood decomposition despite no changes in overall diversity. We show that fungal communities are dynamic before, during, and after the decay class continuum, colonizing while trees are still standing and continuing to shift throughout incorporation into SOM. We documented a shift in community composition from early decay stages (SD to DC1–2), which are dominated by non-filamentous yeasts, heart-rot fungi, and white-rot fungi, to late-successional stage communities with strong representations of ectomycorrhizal taxa and yeasts typically found in leaf litter and soil. Additionally, we note that N appears to be a particularly important driver of enzymatic activity in fungal and bacterial communities and highlights the importance of bacteria:fungi interactions along a continuum of decay. Our study provides a strong foundation for further research in this direction, and we encourage future investigations to explore the integration of bacterial and fungal data to gain a more comprehensive understanding of the complex processes that govern wood decay. We emphasize the need for further studies examining both the relative contributions of bacteria vs. fungi in hydrolytic enzyme activity and available C compounds in late stages of decay to further disentangle fungal and bacterial contributions to decay.

Supplementary Materials

The following supporting information can be downloaded at: https://www.mdpi.com/article/10.3390/f14102086/s1, Figure S1: Log sampling locations; Figure S2: Average abundances of fungal phyla; Figure S3: Diversity indices; Figure S4: Principal coordinates analysis of fungal communities; Table S1: CWD classification and estimated ages; Table S2: Measured enzymes; Table S3: Number of observed OTUs by log; Table S4: Twenty most abundant OTUs; Table S5: Correlations between enzymes and %N. Table S6: Correlations comparing activity of individual enzymes versus %N indicates a significant increase for all enzymes except phenol oxidase. References [38,73] are cited in Supplementary Materials.

Author Contributions

Conceptualization, C.M.G., J.S., B.T.C. and T.Y.J.; methodology, C.M.G., J.S., B.T.C., T.Y.J., E.E.K. and R.B.F.; formal analysis, C.M.G., J.S., B.T.C., E.E.K., R.B.F., K.R.A. and M.F.A.L.; investigation, B.T.C., L.F., J.S. and C.M.G.; resources, C.M.G. and J.S.; data curation, B.T.C.; writing—original draft preparation, B.T.C., J.S., C.M.G., L.F., R.B.F. and E.E.K.; writing—review and editing, B.T.C., C.M.G. and J.S.; funding acquisition, C.M.G. and J.S. All authors have read and agreed to the published version of the manuscript.

Funding

This research was supported by the University of Michigan Rackham Graduate School, UM Department of Ecology and Evolutionary Biology, and the University of Michigan Biological Station. We thank Linfield College for funding of student researchers and laboratory supplies. Funding for Ameriflux core site was provided by the U.S. Department of Energy’s Office of Science. Chris Gough was supported by the National Science Foundation Award 1353908 and 2219695.

Data Availability Statement

All raw data have been submitted to the NCBI Short Read Archive (SRA, https://www.ncbi.nlm.nih.gov/sra/) and are accessible under the numbers SRR26222449-SRR26222475.

Acknowledgments

We also thank Tim Vevrica (UofM), Ella Balasa (VCU) and Michael Kammerman (VCU) for assistance with lab work.

Conflicts of Interest

The authors declare no conflict of interest.

References

  1. Harmon, M.E.; Franklin, J.F.; Swanson, F.J.; Sollins, P.; Gregory, S.V.; Lattin, J.D.; Anderson, N.H.; Cline, S.P.; Aumen, N.G.; Sedell, J.R.; et al. Ecology of coarse woody debris in temperate ecosystems. Adv. Ecol. Res. 1986, 15, 133–302. [Google Scholar] [CrossRef]
  2. Forrester, D.I.; Pretzsch, H. Tamm Review: On the strength of evidence when comparing ecosystem functions of mixtures with monocultures. For. Ecol. Manag. 2015, 356, 41–53. [Google Scholar] [CrossRef]
  3. Brais, S.; Sadi, R.; Bergeron, Y.; Grenier, Y. Coarse woody debris dynamics in a post-fire jack pine chronosequence and its relation with site productivity. For. Ecol. Manag. 2005, 220, 216–226. [Google Scholar] [CrossRef]
  4. Gough, C.M.; Vogel, C.S.; Kazanski, C.; Nagel, L.; Flower, C.E.; Curtis, P.S. Coarse woody debris and the carbon balance of a north temperate forest. For. Ecol. Manag. 2007, 244, 60–67. [Google Scholar] [CrossRef]
  5. Forrester, J.A.; Mladenoff, D.J.; D’Amato, A.W.; Fraver, S.; Lindner, D.L.; Brazee, N.J.; Clayton, M.K.; Gower, S.T. Temporal trends and sources of variation in carbon flux from coarse woody debris in experimental forest canopy openings. Oecologia 2015, 179, 889–900. [Google Scholar] [CrossRef] [PubMed]
  6. Schmid, A.V.; Vogel, C.S.; Liebman, E.; Curtis, P.S.; Gough, C.M. Coarse woody debris and the carbon balance of a moderately disturbed forest. For. Ecol. Manag. 2016, 361, 38–45. [Google Scholar] [CrossRef]
  7. Harmon, M.E.; Bond-Lamberty, B.; Tang, J.W.; Vargas, R. Heterotrophic respiration in disturbed forests: A review with examples from North America. J. Geophys. Res. Biogeosci. 2011, 116, G00k04. [Google Scholar] [CrossRef]
  8. Toljander, Y.K.; Lindahl, B.D.; Holmer, L.; Högberg, N.O. Environmental fluctuations facilitate species co-existence and increase decomposition in communities of wood decay fungi. Oecologia 2006, 148, 625–631. [Google Scholar] [CrossRef]
  9. Valentin, L.; Rajala, T.; Peltoniemi, M.; Heinonsalo, J.; Pennanen, T.; Mäkipää, R. Loss of diversity in wood-inhabiting fungal communities affects decomposition activity in Norway spruce wood. Front. Micro. 2014, 5, 230. [Google Scholar] [CrossRef]
  10. Kirk, T.K.; Cowling, E.B. Degradation by white rot fungi of phenolic model compounds related to lignin. Phytopathology 1968, 58, 1055. [Google Scholar]
  11. Moll, J.; Kellner, H.; Leonhardt, S.; Stengel, E.; Dahl, A.; Bässler, C.; Buscot, F.; Hofrichter, M.; Hoppe, B. Bacteria inhabiting deadwood of 13 tree species are heterogeneously distributed between sapwood and heartwood. Environ Microbiol. 2018, 20, 3744–3756. [Google Scholar] [CrossRef]
  12. Floudas, D. Evolution of lignin decomposition systems in fungi. Wood degradation and ligninolytic fungi. Adv. Bot. Res. 2021, 99, 37–76. [Google Scholar] [CrossRef]
  13. Van der Wal, A.; Geydan, T.D.; Kuyper, T.W.; de Boer, W. A thready affair: Linking fungal diversity and community dynamics to terrestrial decomposition processes. FEMS Microbiol. Rev. 2013, 37, 477–494. [Google Scholar] [CrossRef]
  14. Gonzalez-Perez, E.; Yanez-Morales, M.J.; Santiago-Santiago, V.; Montero-Pineda, A. Fungi biodiversity on pepper wilt and some related factors, in Tlacotepec de Jost Manzo, El Verde, Puebla. Agrociencia 2004, 38, 653–661. [Google Scholar]
  15. Bonnarme, P.; Jeffries, T.W. MN(II) Regulation of lignin peroxidases and manganese-dependent peroxidases from lignin-degrading white rot fungi. Appl. Environ. Microbiol. 1990, 56, 210–217. [Google Scholar] [CrossRef]
  16. Hatakka, A. Lignin-modifying enzymes from selected white-rot fungi—Production and role in lignin degradation. FEMS Microbiol. Rev. 1994, 13, 125–135. [Google Scholar] [CrossRef]
  17. Eisenlord, S.D.; Freedman, Z.; Zak, D.R.; Xue, K.; He, Z.L.; Zhou, J.Z. Microbial mechanisms mediating increased soil C storage under elevated atmospheric N deposition. Appl. Environ. Microbiol. 2013, 79, 1191–1199. [Google Scholar] [CrossRef] [PubMed]
  18. Hu, X.Y.; Wang, Y.M.; Zhang, L.L.; Xu, M. Morphological and mechanical properties of tannic acid/PAAm semi-IPN hydrogels for cell adhesion. Polym. Test. 2017, 61, 314–323. [Google Scholar] [CrossRef]
  19. Kubartová, A.; Ottosson, E.; Dahlberg, A.; Stenlid, J. Patterns of fungal communities among and within decaying logs, revealed by 454 sequencing. Mol. Ecol. 2012, 21, 4514–4532. [Google Scholar] [CrossRef]
  20. Song, Z.W.; Kennedy, P.G.; Liew, F.J.; Schilling, J.S. Fungal endophytes as priority colonizers initiating wood decomposition. Funct. Ecol. 2017, 31, 407–418. [Google Scholar] [CrossRef]
  21. Fukami, T.; Dickie, I.A.; Wilkie, J.P.; Paulus, B.C.; Park, D.; Roberts, A.; Buchanan, P.K.; Allen, R.B. Assembly history dictates ecosystem functioning: Evidence from wood decomposer communities. Ecol. Lett. 2010, 13, 675–684. [Google Scholar] [CrossRef]
  22. Holmer, L.; Stenlid, J. Diffuse competition for heterogeneous substrate in soil among six species of wood-decomposing basidiomycetes. Oecologia 1996, 106, 531–538. [Google Scholar] [CrossRef]
  23. Jonsson, M.; Wardle, D.A. Context dependency of litter-mixing effects on decomposition and nutrient release across a long-term chronosequence. Oikos 2008, 117, 1674–1682. [Google Scholar] [CrossRef]
  24. Boddy, L.; Tordoff, G.M.; Wood, J.; Hynes, J.; Bebber, D.; Jones, T.H.; Fricker, M. Mycelial foraging strategies of saprotrophic cord-forming basidiomycetes. In Proceedings of the 8th International Mycological Congress of the International-Mycological-Association (IMC8), Cairns, Australia, 20–25 August 2006. [Google Scholar]
  25. Boddy, L.; Hynes, J.; Bebber, D.P.; Fricker, M.D. Saprotrophic cord systems: Dispersal mechanisms in space and time. Mycoscience 2009, 50, 9–19. [Google Scholar] [CrossRef]
  26. Hamzeh, M.; Dayanandan, S. Phylogeny of Populus (Salicaceae) based on nucleotide sequences of chloroplast TRNT-TRNF region and nuclear rDNA. Am. J. Bot. 2004, 91, 1398–1408. [Google Scholar] [CrossRef]
  27. Baldrian, P.; Zrůstová, P.; Tláskal, V.; Davidová, A.; Merhautová, V.; Vrška, T. Fungi associated with decomposing deadwood in a natural beech-dominated forest. Fungal Ecol. 2016, 23, 109–122. [Google Scholar] [CrossRef]
  28. Mäkipää, R.; Rajala, T.; Schigel, D.; Rinne, K.T.; Pennanen, T.; Abrego, N.; Ovaskainen, O. Interactions between soil-and dead wood-inhabiting fungal communities during the decay of Norway spruce logs. ISME J. 2017, 11, 1964–1974. [Google Scholar] [CrossRef] [PubMed]
  29. Rajala, T.; Tuomivirta, T.; Pennanen, T.; Mäkipää, R. Habitat models of wood-inhabiting fungi along a decay gradient of Norway spruce logs. Fungal Ecol. 2015, 18, 48–55. [Google Scholar] [CrossRef]
  30. Hoppe, B.; Kahl, T.; Karasch, P.; Wubet, T.; Bauhus, J.; Buscot, F.; Krüger, D. Network analysis reveals ecological links between N-fixing bacteria and wood-decaying fungi. PLoS ONE 2014, 9, e88141. [Google Scholar] [CrossRef]
  31. Sun, H.; Terhonen, E.; Kasanen, R.; Asiegbu, F.O. Diversity and community structure of primary wood-inhabiting bacteria in boreal forest. Geomicrobiol. J. 2014, 31, 315–324. [Google Scholar] [CrossRef]
  32. Arnstadt, T.; Hoppe, B.; Kahl, T.; Kellner, H.; Krüger, D.; Bässler, C.; Bauhus, J.; Hofrichter, M. Patterns of laccase and peroxidases in coarse woody debris of Fagus sylvatica, Picea abies and Pinus sylvestris and their relation to different wood parameters. Eur. J. For. Res. 2016, 135, 109–124. [Google Scholar] [CrossRef]
  33. Kuramae, E.E.; Leite, M.F.A.; Suleiman, A.K.A.; Gough, C.M.; Castillo, B.T.; Faller, L.; Franklin, R.B.; Syring, J. Wood decay characteristics and interspecific interactions control bacterial community succession in Populus grandidentata (Bigtooth Aspen). Front. Microbiol. 2019, 10, 979. [Google Scholar] [CrossRef] [PubMed]
  34. Yuan, Y.S.; Zhao, W.Q.; Xiao, J.; Zhang, Z.L.; Qiao, M.F.; Liu, Q.; Yin, H. Exudate components exert different influences on microbially mediated C losses in simulated rhizosphere soils of a spruce plantation. Plant Soil. 2017, 419, 127–140. [Google Scholar] [CrossRef]
  35. Gough, C.M.; Vogel, C.S.; Hardiman, B.; Curtis, P.S. Wood net primary production resilience in an unmanaged forest transitioning from early to middle succession. For. Ecol. Manag. 2010, 260, 36–41. [Google Scholar] [CrossRef]
  36. Lapin, M.; Barnes, B.V. Using the landscape ecosystem approach to assess species and ecosystem diversity. Conserv. Biol. 1995, 9, 1148–1158. [Google Scholar] [CrossRef]
  37. Nave, L.E.; Sparks, J.P.; Le Moine, J.; Hardiman, B.S.; Nadelhoffer, K.J.; Tallant, J.M.; Vogel, C.S.; Strahm, B.D.; Curtis, P.S. Changes in soil nitrogen cycling in a northern temperate forest ecosystem during succession. Biogeochemistry 2014, 121, 471–488. [Google Scholar] [CrossRef]
  38. Harmon, M.E.; Fasth, B.G.; Yatskov, M.; Kastendick, D.; Rock, J.; Woodall, C.W. Release of coarse woody detritus-related carbon: A synthesis across forest biomes. Carbon Balance Manag. 2020, 15, 1. [Google Scholar] [CrossRef] [PubMed]
  39. Morrissey, E.M.; Berrier, D.J.; Neubauer, S.C.; Franklin, R.B. Using microbial communities and extracellular enzymes to link soil organic matter characteristics to greenhouse gas production in a tidal freshwater wetland. Biogeochemistry 2014, 117, 473–490. [Google Scholar] [CrossRef]
  40. Schloss, P.D.; Westcott, S.L.; Ryabin, T.; Hall, J.R.; Hartmann, M.; Hollister, E.B.; Lesniewski, R.A.; Oakley, B.B.; Parks, D.H.; Robinson, C.J.; et al. Introducing mothur: Open-source, platform-independent, community-supported software for describing and comparing microbial communities. Appl. Environ. Microbiol. 2009, 75, 7537–7541. [Google Scholar] [CrossRef] [PubMed]
  41. Kõljalg, U.; Nilsson, R.H.; Abarenkov, K.; Tedersoo, L.; Taylor, A.F.S.; Bahram, M.; Bates, S.T.; Bruns, T.D.; Bengtsson-Palme, J.; Callaghan, T.M.; et al. Towards a unified paradigm for sequence-based identification of fungi. Mol. Ecol. 2013, 22, 5271–5277. [Google Scholar] [CrossRef]
  42. Dray, S.; Dufour, A.B. The ade4 package: Implementing the duality diagram for ecologists. J. Stat. Softw. 2007, 22, 1–20. [Google Scholar] [CrossRef]
  43. Orsello, C.E.; Lauffenburger, D.A.; Hammer, D.A. Molecular properties in cell adhesion: A physical and engineering perspective. Trends Biotechnol. 2001, 19, 310–316. [Google Scholar] [CrossRef] [PubMed]
  44. Toju, H.; Tanabe, A.S.; Yamamoto, S.; Sato, H. High-coverage ITS primers for the DNA-based identification of ascomycetes and basidiomycetes in environmental samples. PLoS ONE 2012, 7, e40863. [Google Scholar] [CrossRef]
  45. Ottosson, E.; Kubartova, A.; Edman, M.; Jönsson, M.; Lindhe, A.; Stenlid, J.; Dahlberg, A. Diverse ecological roles within fungal communities in decomposing logs of Picea abies. FEMS Microbiol. Ecol. 2015, 91, fiv012. [Google Scholar] [CrossRef] [PubMed]
  46. Kubartova, A.; Ottosson, E.; Stenlid, J. Linking fungal communities to wood density loss after 12 years of log decay. FEMS Microbiol. Ecol. 2015, 91, fiv032. [Google Scholar] [CrossRef]
  47. Van der Wal, A.; Ottosson, E.; de Boer, W. Neglected role of fungal community composition in explaining variation in wood decay rates. Ecology 2015, 96, 124–133. [Google Scholar] [CrossRef]
  48. Brischke, C.; Rapp, A.O. Influence of wood moisture content and wood temperature on fungal decay in the field: Observations in different micro-climates. Wood Sci. Technol. 2008, 42, 663–677. [Google Scholar] [CrossRef]
  49. Blanchette, R.A. Delignification by wood-decaying fungi. Annu. Rev. Phytopathol. 1991, 29, 381–398. [Google Scholar] [CrossRef]
  50. Bowman, D.; Balch, J.K.; Artaxo, P.; Bond, W.J.; Carlson, J.M.; Cochrane, M.A.; D’Antonio, C.M.; DeFries, R.S.; Doyle, J.C.; Harrison, S.P.; et al. Fire in the earth system. Science 2009, 324, 481–484. [Google Scholar] [CrossRef]
  51. Johnston, S.R.; Boddy, L.; Weightman, A.J. Bacteria in decomposing wood and their interactions with wood-decay fungi. FEMS Microbiol. Ecol. 2016, 92, fiw179. [Google Scholar] [CrossRef]
  52. TlÁskal, V.; Brabcová, V.; Větrovský, T.; Jomura, M.; López-Mondéjar, R.; Monteiro, L.M.O.; Saraiva, J.P.; Human, Z.R.; Cajthaml, T.; Nunes da Rocha, U.; et al. Complementary roles of wood-inhabiting fungi and bacteria facilitate deadwood decomposition. Msystems 2021, 6, 10–1128. [Google Scholar] [CrossRef]
  53. Suh, S.O.; Blackwell, M.; Kurtzman, C.P.; Lachance, M.A. Phylogenetics of Saccharomycetales, the ascomycete yeasts. Mycologia 2006, 98, 1006–1017. [Google Scholar] [CrossRef]
  54. Sampaio, J.P.; Gonçalves, P. Natural populations of Saccharomyces kudriavzevii in Portugal are associated with oak bark and are sympatric with S. cerevisiae and S. paradoxus. Appl. Environ. Microbiol. 2008, 74, 2144–2152. [Google Scholar] [CrossRef]
  55. Bhadra, B.; Rao, R.S.; Singh, P.K.; Sarkar, P.K.; Shivaji, S. Yeasts and yeast-like fungi associated with tree bark: Diversity and identification of yeasts producing extracellular endoxylanases. Curr. Microbiol. 2008, 56, 489–494. [Google Scholar] [CrossRef] [PubMed]
  56. Kurtzman, C.P.; Fell, J.W.; Boekhout, T. Definition, classification and nomenclature of the yeasts. In Yeasts: A Taxonomic Study, 5th ed.; Elsevier: Amsterdam, The Netherlands, 2011; Volume 1–3, pp. 3–5. [Google Scholar] [CrossRef]
  57. Johnson, M.; East, D.A.; Mulvihill, D.P. Formins determine the functional properties of actin filaments in yeast. Curr. Biol. 2014, 24, 1525–1530. [Google Scholar] [CrossRef] [PubMed]
  58. Viner, I.; Spirin, V.; Zíbarová, L.; Larsson, K.H. Additions to the taxonomy of Lagarobasidium and Xylodon (Hymenochaetales, Basidiomycota). Mycokeys 2018, 41, 65–90. [Google Scholar] [CrossRef]
  59. Blanchette, R.A.; Shaw, C.G. Associations among bacteria, yeasts, and basidiomycetes during wood decay. Phytopath 1978, 68, 631–637. [Google Scholar] [CrossRef]
  60. Fricker, M.D.; Bebber, D.; Boddy, L. Mycelial networks: Structure and dynamics. In British Mycological Society Symposia; Ecol of Saprotrophic Basidiomycetes; Academic Press: Cambridge, MA, USA, 2008; Volume 28, pp. 3–18. [Google Scholar]
  61. Mašínová, T.; Bahnmann, B.D.; Větrovský, T.; Tomšovský, M.; Merunková, K.; Baldrian, P. Drivers of yeast community composition in the litter and soil of a temperate forest. FEMS Microbiol. Ecol. 2017, 93, fiw223. [Google Scholar] [CrossRef] [PubMed]
  62. Middelhoven, W.J.; Scorzetti, G.; Fell, J.W. Trichosporon porosum comb. nov., an anamorphic basidiomycetous yeast inhabiting soil, related to the loubieri/laibachii group of species that assimilate hemicelluloses and phenolic compounds. FEMS Yeast Res. 2001, 1, 15–22. [Google Scholar]
  63. Yurkov, A.; Krüger, D.; Begerow, D.; Arnold, N.; Tarkka, M.T. Basidiomycetous yeasts fromboletales fruiting bodies and their interactions with the mycoparasite Sepedonium chrysospermum and the Host Fungus Paxillus. Microb. Ecol. 2012, 63, 295–303. [Google Scholar] [CrossRef]
  64. Averill, C. Slowed decomposition in ectomycorrhizal ecosystems is independent of plant chemistry. Soil Biol. Biochem. 2016, 102, 52–54. [Google Scholar] [CrossRef]
  65. Zak, D.R.; Pellitier, P.T.; Argiroff, W.A.; Castillo, B.; James, T.Y.; Nave, L.E.; Averill, C.; Beidler, K.V.; Bhatnagar, J.; Blesh, J.; et al. Exploring the role of ectomycorrhizal fungi in soil carbon dynamics. New Phytol. 2019, 223, 33–39. [Google Scholar] [CrossRef] [PubMed]
  66. Pellitier, P.T.; Zak, D.R. Ectomycorrhizal fungi and the enzymatic liberation of nitrogen from soil organic matter: Why evolutionary history matters. New Phytol. 2018, 217, 68–73. [Google Scholar] [CrossRef] [PubMed]
  67. Bossuyt, H.; Denef, K.; Six, J.; Frey, S.D.; Merckx, R.; Paustian, K. Influence of microbial populations and residue quality on aggregate stability. Appl. Soil Ecol. 2001, 16, 195–208. [Google Scholar] [CrossRef]
  68. Lauber, C.L.; Strickland, M.S.; Bradford, M.A.; Fierer, N. The influence of soil properties on the structure of bacterial and fungal communities across land-use types. Soil Biol. Biochem. 2008, 40, 2407–2415. [Google Scholar] [CrossRef]
  69. Six, J.; Frey, S.D.; Thiet, R.K.; Batten, K.M. Bacterial and fungal contributions to carbon sequestration in agroecosystems. Soil Sci. Soc. Am. J. 2006, 70, 555–569. [Google Scholar] [CrossRef]
  70. Hoppe, B.; Krüger, D.; Kahl, T.; Arnstadt, T.; Buscat, F.; Bauhus, J.; Wubet, T. A pyrosequencing insight into sprawling bacterial diversity and community dynamics in decaying deadwood logs of Fagus sylvatica and Picea abies. Sci. Rep. 2015, 5, 9456. [Google Scholar] [CrossRef]
  71. Rousk, J.; Brookes, P.C.; Bååth, E. Investigating the mechanisms for the opposing pH relationships of fungal and bacterial growth in soil. Soil Biol. Biochem. 2010, 42, 926–934. [Google Scholar] [CrossRef]
  72. Nacke, H.; Goldmann, K.; Schöning, I.; Pfeiffer, B.; Kaiser, K.; Castillo-Villamizar, G.A.; Schrumpf, M.; Buscot, F.; Daniel, R.; Wubet, T. Fine spatial scale variation of soil microbial communities under european beech and Norway spruce. Front. Microbiol. 2016, 7, 2067. [Google Scholar] [CrossRef]
  73. Kahl, T.; Arnstadt, T.; Baber, K.; Bässler, C.; Bauhus, J.; Borken, W.; Buscot, F.; Floren, A.; Heibl, C.; Hessenmöller, D.; et al. Wood decay rates of 13 temperate tree species in relation to wood properties, enzyme activities and organismic diversities. 2017. For. Ecol. Manag. 2017, 391, 86–95. [Google Scholar] [CrossRef]
Figure 1. Fungal orders with groups that peak across varying decay stages and soil. Panes (AD) are orders with known wood decay fungi or yeasts that are most abundant in early decay stages and decline during successional decay stages. Auriculariales (Pane (E)) showed consistent representation across decay classes and soil. Panes (FI) represent orders of fungi that peaked in late decay stages. Whiskers represent maximum and minimum values (non-outlier range), and black dots indicate outliers. (SD = standing dead, DC1 = decay class 1, DC2 = decay class 2, DC3 = decay class 3, DC4 = decay class 4, DC5 = decay class 5, S = soil). N = 27 (4 per decay stage of log 3 soil).
Forests 14 02086 g001
Figure 2. Between Class Analyses (BCA) of (A) fungal community in wood decay stages and soil, and (B) substrate chemistry (%N, δ15N, %C, C:N, % moisture and pH), due solely to decay stage. SD, DC1–5, and Soil represent decay stage classification along a successional gradient with DC1 being least decomposed to increasing levels of decomposition toward DC5 (SD = standing dead, DC1 = decay class 1, DC2 = decay class 2, DC3 = decay class 3, DC4 = decay class 4, and DC5 = decay class 5). N = 27 (4 per decay stage of log, 3 soil). A total of 30% of total variability in fungal community (A) and 65% of total variability in substrate chemistry (B) is explained by the differences in decay stage.
Forests 14 02086 g002
Figure 3. Chemical composition along a gradient of wood decay from (SD) to (DC1–DC5) and in soil (S). Moisture content, %N and δ15N all tend to increase in later decay stages. Meanwhile there is a trend toward lower C:N ratios. Data points marked with the same letter did not differ statistically (Dunn’s test for post hoc comparisons with α = 0.05). (SD = standing dead, DC1 = decay class 1, DC2 = decay class 2, DC3 = decay class 3, DC4 = decay class 4, and DC5 = decay class 5, S = soil). N = 27 (4 per decay stage of log, 3 soil). Error bars represent standard deviation.
Forests 14 02086 g003
Figure 4. Correlation of fungal diversity indices, (A) chao1, (B) shannon, and (C) inverse simpson, in CWD stages and soil against the %N ratio of the wood. For those correlations that are significant, r and p-values are provided in the upper left of each panel (n.s. = non-significant). (SD = standing dead, DC1 = decay class 1, DC2 = decay class 2, DC3 = decay class 3, DC4 = decay class 4, DC5 = decay class 5, and s = soil). N = 27 (4 per decay stage of log 3 soil).
Forests 14 02086 g004
Figure 5. Panels (AF) depict enzyme activity associated with cellulose (β-1,4-glucosidase, 1,4-β-cellobiosidase; (A,B), hemicellulose (β-D-xylosidase), (C), lignin (Phenol oxidase and Peroxidase), (D,E), and polypeptide breakdown (Leucyl aminopeptidase), (F) expressed as mU g−1 dry weight of the substrate. Bars are means + S.E. p-values are from Krustal–Wallis tests, and bars marked with the same letter did not differ statistically (Dunn’s test for post hoc comparisons with α = 0.05). (SD = standing dead, DC1 = decay class 1, DC2 = decay class 2, DC3 = decay class 3, DC4 = decay class 4, and DC5 = decay class 5). N = 27 (4 per decay stage of log 3 soil).
Forests 14 02086 g005
Figure 6. Principal Coordinate Analysis (PCoA) applied to the enzyme data using the Bray–Curtis coefficient. Results are presented as means (points) + S.E. Three general groupings are evident corresponding to early decay stages (SD (standing dead), DC1, and DC2), late decay stages (DC3–DC5), and soil. The PCoA explains 65% of the total variation in enzyme activity.
Forests 14 02086 g006
Figure 7. (A) Fungal ITS and (B) bacterial 16S rRNA gene abundances reported as copies per g dry weight of substrate, along with (C) bacterial-to-fungal gene ratios. Results are presented as means + S.E. for standing dead wood (SD), all five decay classes (DC1–DC5), and soil. Means marked with the same letter did not differ statistically (Krustal–Wallis tests followed by Dunn’s post hoc with α = 0.05).
Forests 14 02086 g007
Figure 8. Positive correlation of %N with abundance of both (A) fungal ITS and (B) bacterial 16S genes, expressed as gene copies per g dry weight of substrate. (SD = standing dead, DC1 = decay class 1, DC2 = decay class 2, DC3 = decay class 3, DC4 = decay class 4, and DC5 = decay class 5). N = 27 (4 per decay stage of log and 3 soil samples).
Forests 14 02086 g008
Table 1. Results (p values) for Analysis of Molecular Variance (AMOVA) comparing fungal community composition and structure between each soil and wood sample. Significant (p < 0.05) post hoc pairwise comparisons are identified with **. Marginally significant trends (0.05 < p < 0.10) are marked as *.
SDDC1DC2DC3DC4DC5
Soil0.03 **0.02 **0.02 **0.02 **0.03 **0.03 **
SD-0.750.120.03 **0.04 **0.03 **
DC1--0.580.320.06 *0.08 *
DC2---0.770.610.62
DC3----0.750.22
DC4-----0.88
Disclaimer/Publisher’s Note: The statements, opinions and data contained in all publications are solely those of the individual author(s) and contributor(s) and not of MDPI and/or the editor(s). MDPI and/or the editor(s) disclaim responsibility for any injury to people or property resulting from any ideas, methods, instructions or products referred to in the content.

