Article

Study on Forest and Grassland Ecological Space Structure in Eyu Mining Area and Potential Alternatives for Enhancing Carbon Sequestration

1
Beijing Key Laboratory of Precision Forestry, Beijing Forestry University, Beijing 100083, China
2
Wyoming Geographic Information Science Center, University of Wyoming, Laramie, WY 82071, USA
*
Author to whom correspondence should be addressed.
Forests 2023, 14(8), 1587; https://doi.org/10.3390/f14081587
Submission received: 1 July 2023 / Revised: 27 July 2023 / Accepted: 2 August 2023 / Published: 4 August 2023
(This article belongs to the Section Forest Ecology and Management)

Abstract

:
Optimizing the connectivity-carbon sequestration coupling coordination of forest and grassland ecological spaces (F&GES) is a crucial measure to enhance carbon sequestration effectively in mining areas. However, the prevailing strategies for optimizing F&GES often overlook the connectivity-carbon sequestration coupling coordination of the network. Therefore, this study aimed to propose a novel restoration plan to improve the connectivity-carbon sequestration coupling coordination of existing networks. Taking a typical mining area in northwestern China (Eyu County) as an example, we extracted the existing F&GES based on remote sensing ecological indicators and ecological risk assessments. Subsequently, we optimized the network using the connectivity-carbon sequestration coupling coordination degree (CSCCD) model from the perspective of connectivity-carbon sequestration coupling coordination, proposed potential alternative optimization schemes, and evaluated the optimization effects. The results showed that the range of Eyu County’s F&GES structure had been determined. Ecological source sites with better carbon sequestration effects were primarily distributed in the central and northeastern parts of Eyu County. After optimization, the network added 26 ecological patches, and the added area reached 641.57 km2. Furthermore, the connectivity robustness, edge restoration robustness, and node restoration robustness of the optimized network were significantly improved, and the carbon sequestration effect of the forest and grassland ecological space was increased by 6.78%. The contribution rate of ecological source sites was 97.66%, and that of ecological corridors was 2.34%. The CSCCD model proposed in this study can effectively improve the carbon sequestration effect in mining areas, promote carbon neutrality, and save network optimization time while improving efficiency. This restoration strategy is also applicable to forest and grassland ecosystem management and optimization of ecological spaces in other mining areas, which has positive implications for promoting ecological civilization construction and sustainable development.

1. Introduction

Escalating global climate change has prompted the entire world to shoulder the collective responsibility of mitigating and adapting to the situation [1]. Among the various measures aimed at mitigating climate change, carbon sequestration has garnered substantial attention [2]. Nevertheless, mining activities in mining areas constitute one of the primary anthropogenic factors responsible for the colossal annual global carbon emissions [3]. The mining industry is estimated to contribute between 1.9 × 10¹² and 5.1 × 10¹² tons of carbon emissions annually, accounting for approximately 28% of the global carbon emissions and significantly impacting the global carbon budget [4]. Moreover, mining exacerbates the reduction of F&GES, leading to the degradation of their structure and function, thereby compromising their carbon sequestration potential [5]. This phenomenon is particularly pronounced in mining areas situated in the Yellow River Basin of China [6]. Therefore, comprehending the structure of F&GES, safeguarding and optimizing their structure, and implementing effective measures to enhance carbon sequestration capacity are pressing issues that require immediate attention in mining areas [7].
F&GES, comprising ecosystems such as forests and grasslands, represents a natural space with the potential to maximize the functionality and services of ecosystems [8]. Forests and grasslands are capable of absorbing substantial amounts of carbon dioxide through photosynthesis, converting it into organic matter, and simultaneously releasing oxygen, making them natural carbon sinks [9]. Therefore, optimizing F&GES is considered an effective means of enhancing carbon sequestration [10]. Specifically, this involves reinforcing the restoration and protection of existing ecosystems to ensure their integrity and stability [11]. Measures such as afforestation, grassland restoration, and ecological remediation can augment the carbon sequestration effect of forest and grassland ecosystems, thereby preserving their integrity and stability [12]. Additionally, optimizing the ecological layout of F&GES is crucial. Rational planning and layout of the ecosystem, accompanied by improvements in complexity and stability, can lead to further enhancement of the carbon sequestration effect [13]. Consequently, optimizing forest and grassland ecological space stands out as a key measure among various approaches to achieve carbon sequestration goals [14].
F&GES refers to the creation of an interconnected and interdependent ecosystem network by constructing ecological corridors and habitat networks to link dispersed forest and grassland ecosystems [15]. This network structure has the potential to enhance ecosystem connectivity, stability, and adaptability, while promoting biodiversity conservation and the provision of ecosystem services [16]. Previous research has demonstrated that the F&GES is an essential tool for protecting biodiversity, maintaining the ecological environment, and promoting ecological economy [17]. Scholars have conducted extensive research and practical applications in the construction, ecological functions, and optimization strategies of F&GES, achieving considerable results. However, the relationships between ecosystem service functions and the structure of F&GES are closely intertwined [18]. Therefore, optimizing the structure of F&GES and the coupling coordination of carbon sequestration represents an important approach to promoting ecosystem carbon cycling and climate change adaptation [19]. Currently, researchers employ various methods, such as remote sensing technology, geographic information systems, morphological spatial pattern analysis, the minimum spanning path algorithm (MSPA), and landscape ecological risk assessment based on the theory of complex networks and landscape patterns to monitor and evaluate F&GES [20]. They have successfully constructed cross-regional F&GES and studied their ecological functions, including biodiversity conservation, soil and water conservation, atmospheric regulation, and carbon sequestration [21]. Additionally, they have evaluated the importance of various ecosystem services through ecological network construction zoning schemes, management strategies, the MCR model, and circuit theory [22]. However, the relationship between ecosystem service functions and the structure of F&GES is still relatively underexplored [23]. In summary, optimizing the structure of F&GES and the coupling coordination of carbon sequestration represents a key measure to maximize ecosystem service functions and promote ecosystem carbon cycling and climate change adaptation [24].
Eyu, located in the middle reaches of the Yellow River Basin, is a significant mining area in northern China. However, it is situated in a transitional zone between desert and oasis, making it one of the most vulnerable ecosystems globally, with severe issues such as land desertification, sandstorms, soil erosion, and grassland degradation [25]. In response, this study aimed to assess the coupling coordination degree between the connectivity of F&GES and carbon sequestration in Eyu County. The study also aimed to propose strategies to enhance the connectivity and carbon sequestration ability of F&GES structure, which would enable the achievement of carbon neutrality goals. The research focused on determining the spatial location of F&GES structure, including ecological source sites and ecological corridors, and analyzed their connectivity and topological characteristics. Furthermore, the study assessed the carbon sequestration capacity of various ecosystems and analyzed the coupling coordination relationship between connectivity and carbon sequestration using the proposed CSCCD model. The research team developed multiple optimization strategies to improve F&GES structure and carbon sequestration ability. Additionally, the effectiveness of potential alternative optimization schemes was verified through robustness tests and changes in carbon sequestration capacity. This study aims to provide scientific evidence and technical support to manage forest and grassland ecosystems and achieve carbon neutrality goals in the Eyu district. The findings of this research will contribute to the advancement of forest science and also promote ecological civilization construction and sustainable development.

2. Materials and Methods

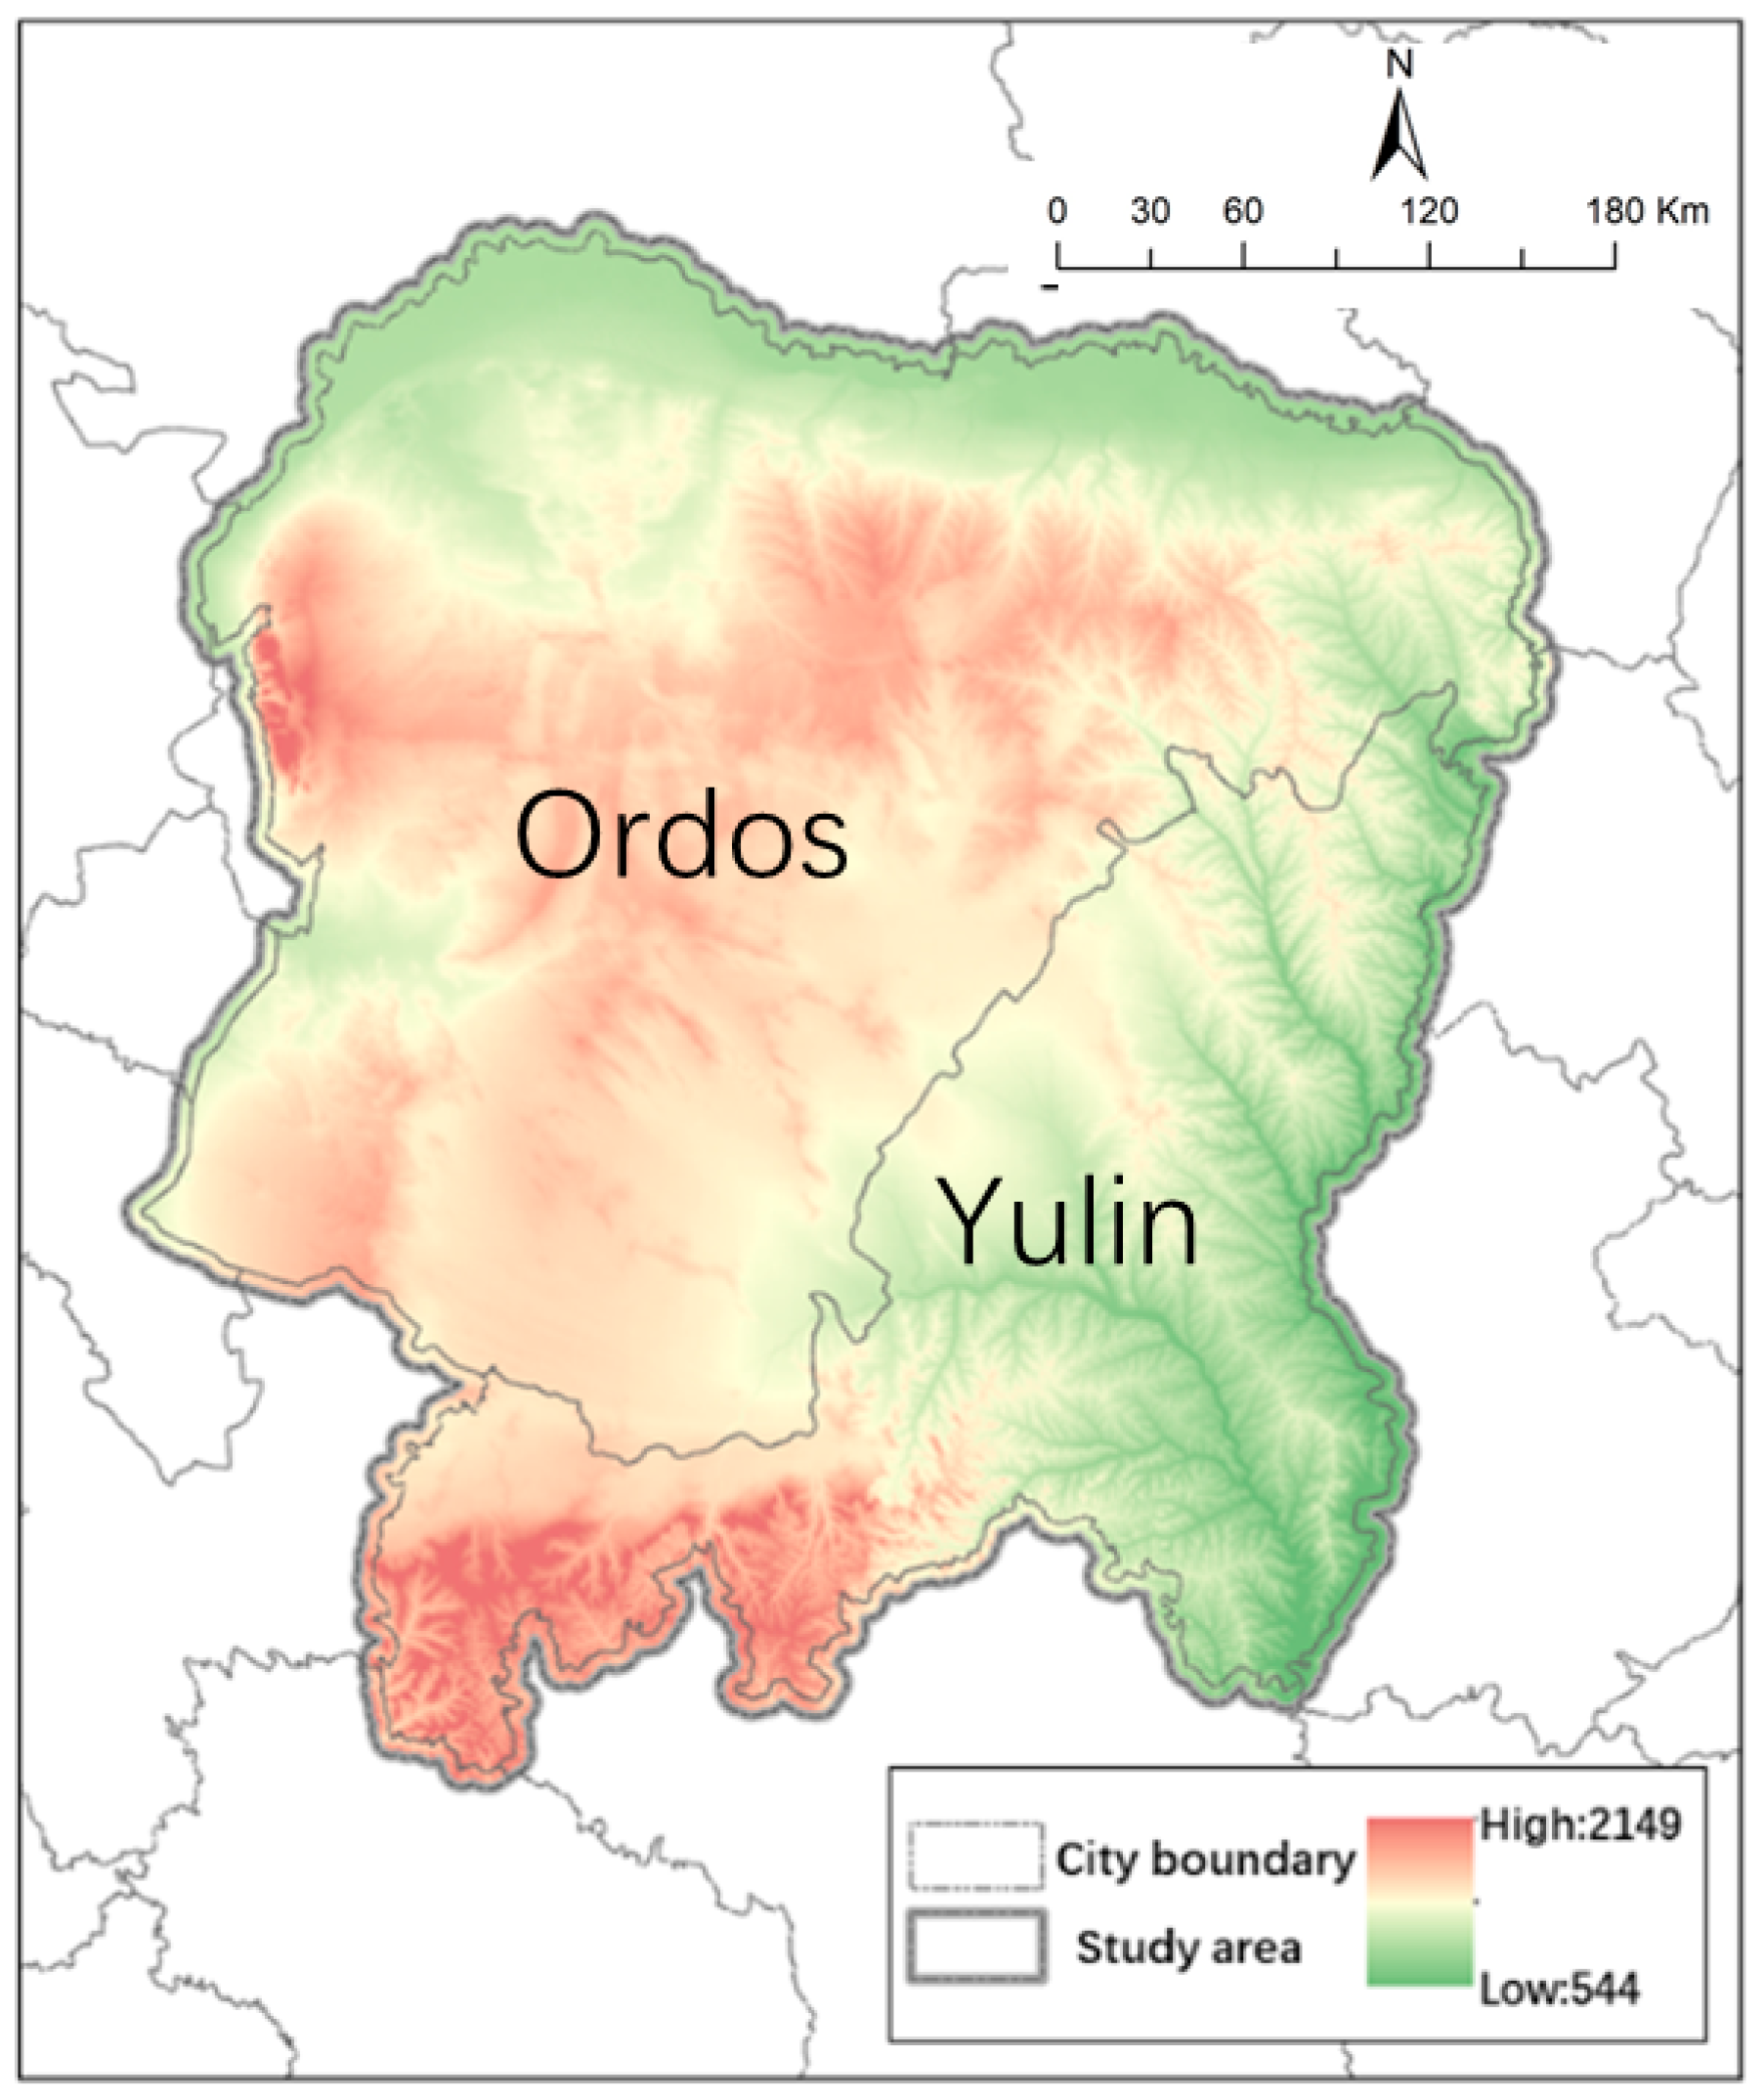
2.1. Overview of the Study Area

The study area is situated at the intersection of the Yellow River’s upper and middle reaches, in the transitional zone between the Loess Plateau and Inner Mongolia Plateau in China (Figure 1). It encompasses 21 districts (counties or banners) in Ordos City, Inner Mongolia Autonomous Region and Yulin City, Shaanxi Province, collectively referred to as Eyu [26]. Among these, nine districts (banners), including Dongsheng District, Kangbashen District, and Dalat Banner, are located in Ordos, while the remaining 12 districts (counties), such as Yuyang District, Hengshan District, and Fugu County, are located in Yulin. The geographic coordinates of the study area range from 106°42′40″ E to 111°27′20″ E and 36°57′04″ N to 40°51′40″ N. Eyu’s climate is characterized as a northern temperate continental semi-arid climate, with low annual precipitation and high evaporation rates. The average annual temperature ranges between 5.3 and 8.7 °C, while the wind speed is typically between 2.7 and 3.7 m/s. There are significant variations in temperature and precipitation between seasons, with an average annual temperature of 7.7 °C and an average annual precipitation of 366.7 mm. The Kubuqi and Maowusu deserts in the central region of Eyu are vital components of the northern anti-desertification barrier zone. Strengthening ecological construction in the desertification source areas is crucial for promoting high-quality development of the Yellow River Basin. However, severe land desertification is prevalent in the northwestern region of Eyu, while soil and water loss issues exist in the eastern and southern regions [27]. These problems, along with grassland degradation, resource exploitation, and sandstorms, have made Eyu one of the most ecologically fragile regions worldwide. Additionally, Eyu boasts abundant mineral resources, with more than 50 types of mineral deposits identified, including coal, oil, natural gas, and rock salt. The coal reserves alone have reached 317.6 billion tons, equivalent to approximately one-third of the national total. Therefore, investigating the construction and optimization of F&GES in mining cities and enhancing their carbon sequestration capacity using Eyu as a case study is of significant theoretical, practical, typical, and popular value for exploring F&GES optimization and carbon neutrality in mining areas [28].

2.2. Data Source and Processing
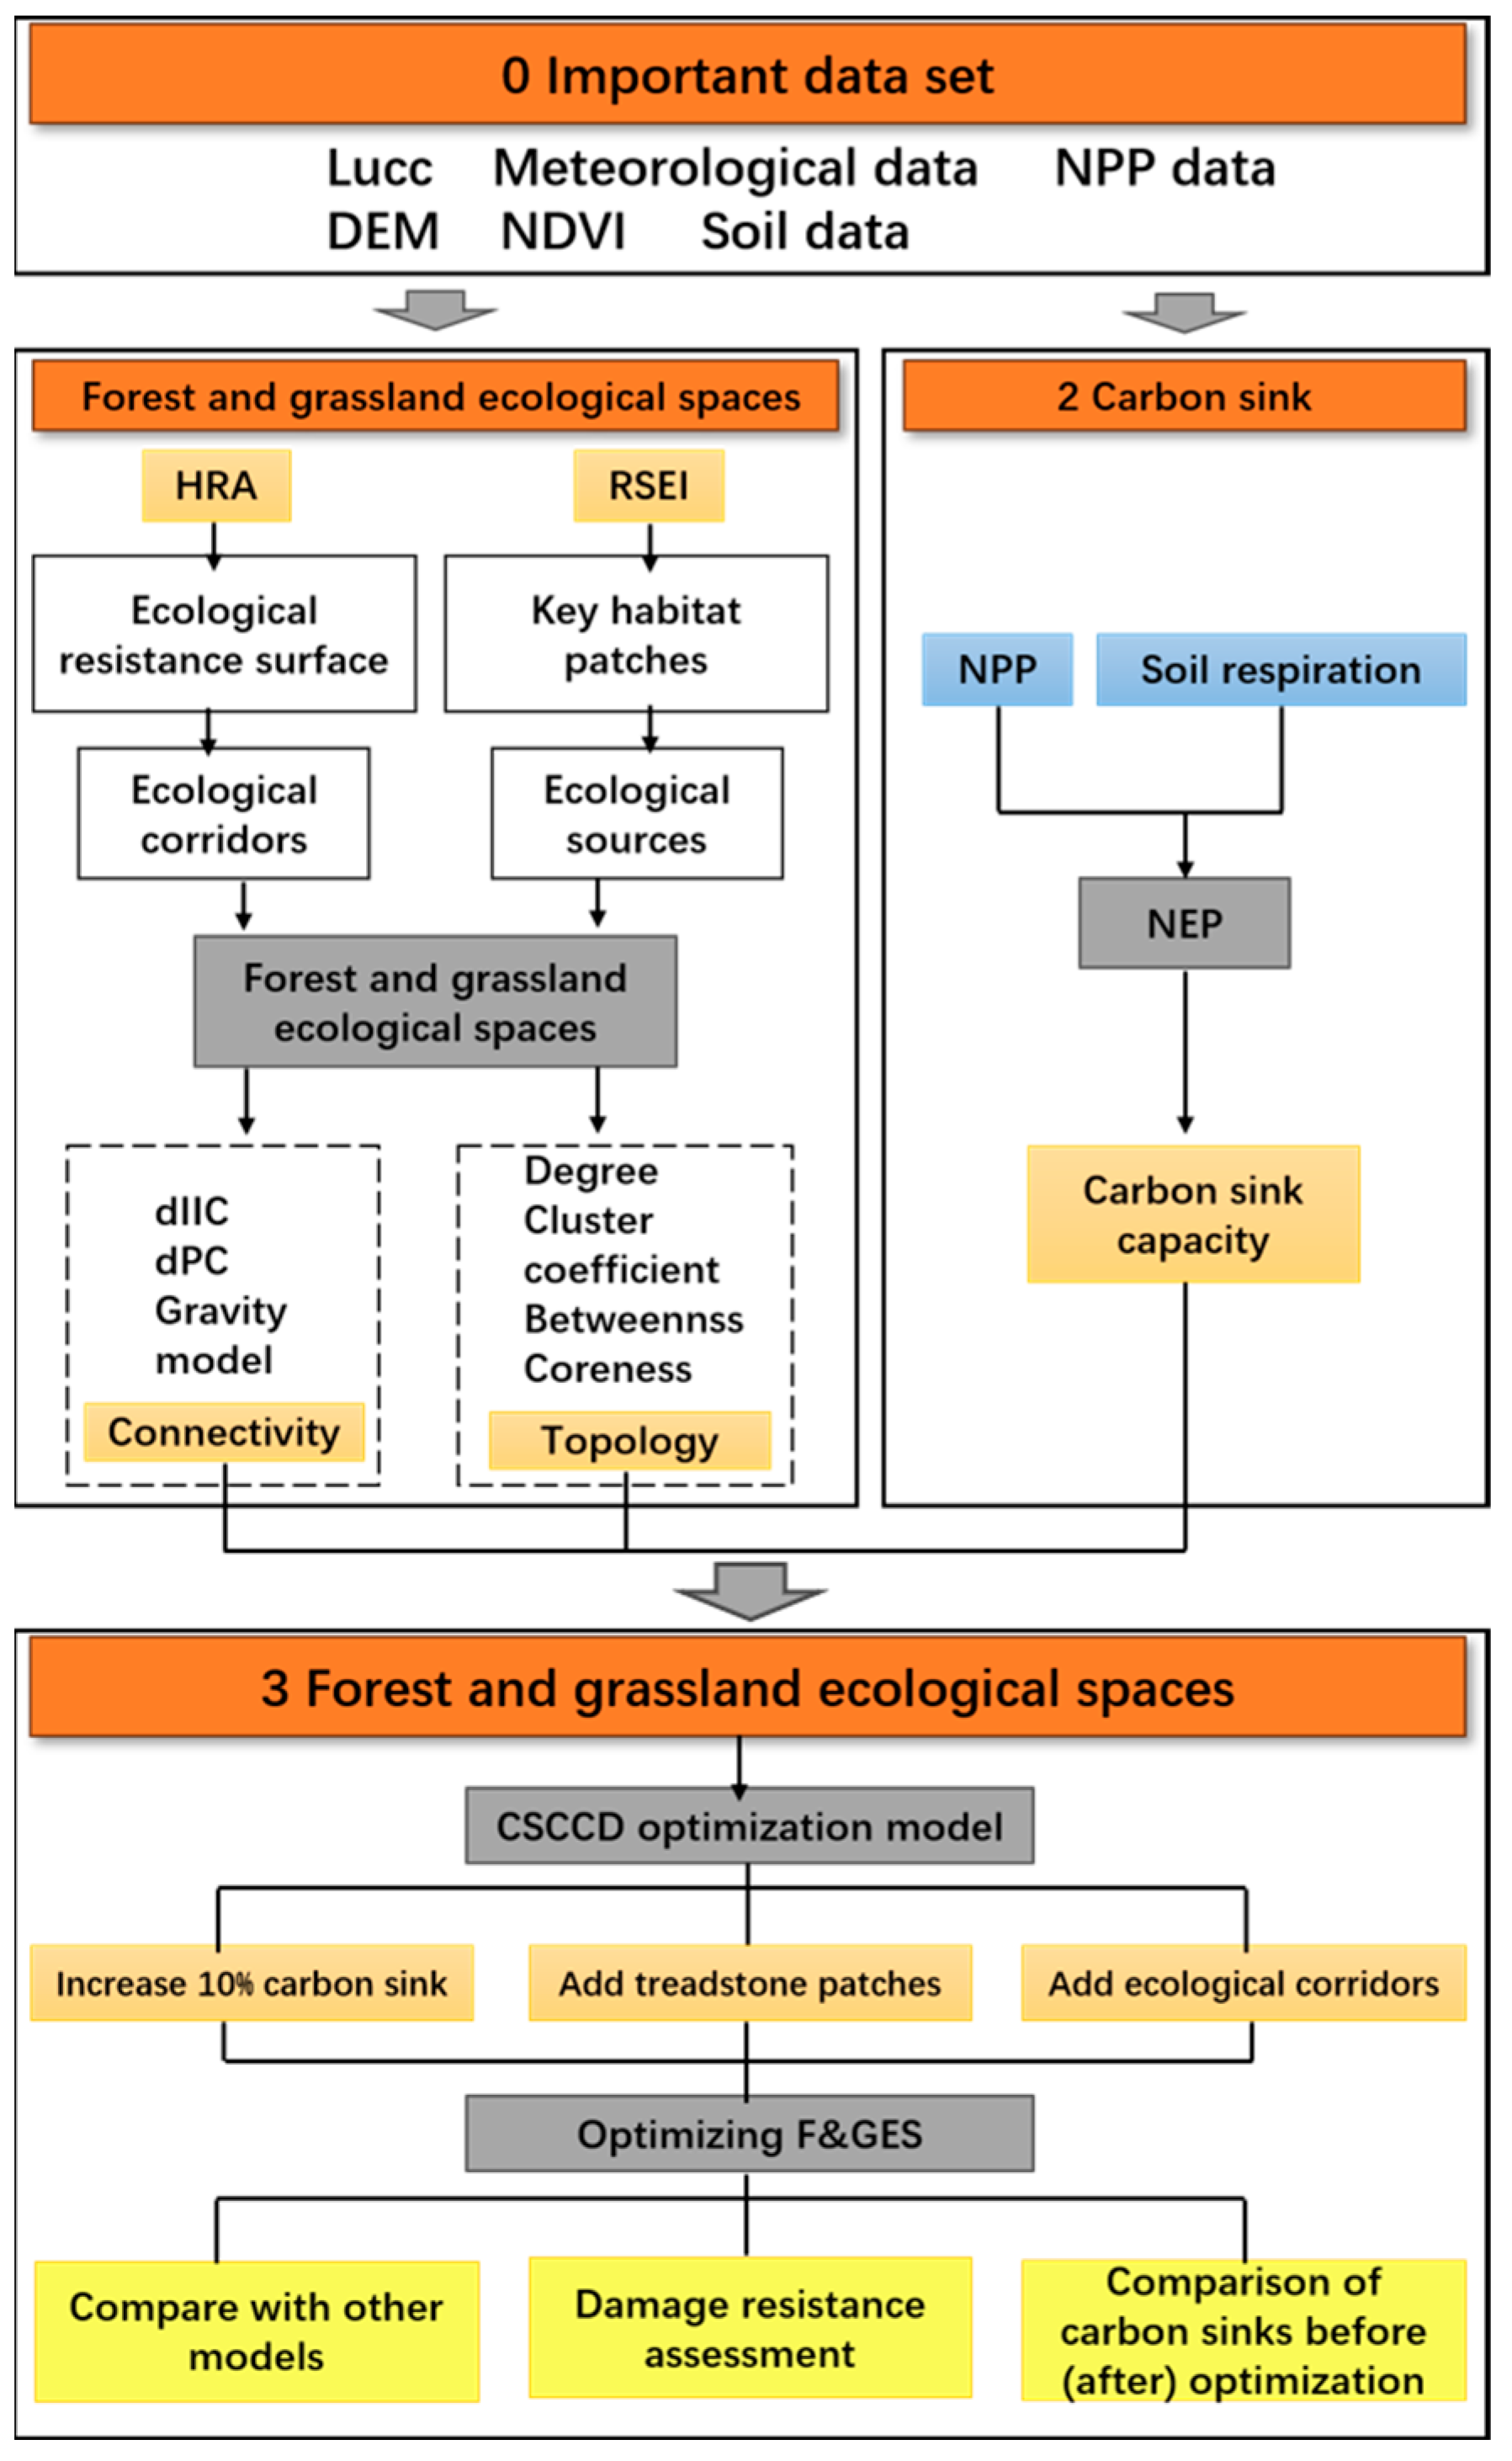
The present study utilized the GlobalL and 30 dataset of 2020 to obtain land use/cover data for the study area URL (accessed on 8 October 2022), encompassing six categories, namely cropland, forestland, grassland, water bodies, residential areas, and unused land. The spatial extent of the study area was extracted using ArcGIS 10.8 software. Additionally, Digital Elevation Model (DEM) data were acquired from the GDEMV3 dataset of the geographic spatial data cloud for the study area, and slope data were derived using ArcGIS software. Furthermore, the Landsat 8 surface reflectance tier 1 dataset was processed on the Google Earth Engine platform by computing the normalized difference vegetation index (NDVI) URL (accessed on 8 October 2022). Daily precipitation data for the study area in 2020 were obtained from the China Meteorological Data Service Center. Soil sand content, silt content, and clay content data for the study area were sourced from the World Soil Database. Finally, the Net Primary Productivity (NPP) product of the MOD17 vegetation land surface from the MODIS dataset was employed, and the Moderate Resolution Imaging Spectroradiometer Toolkit (MRT) was utilized for batch processing to obtain the NPP raster data for the study area in 2020 URL (accessed on 10 October 2022).

2.3. Methods

The disturbance caused by mining activities in the Eyu region frequently results in a reduction in the carbon sequestration capacity of ecosystems such as forests and grasslands. This, in turn, engenders a host of ecological security issues, including diminished habitat areas for wildlife, land desertification, and soil erosion. Therefore, building and optimizing F&GES represents a crucial strategy for mitigating these ecological security threats [29].
In order to achieve carbon neutrality in mining cities situated in semi-arid agricultural-pastoral transitional zones, it is essential to strengthen the integrity and connectivity of key elements in F&GES. On this basis, we should further enhance the coordination between carbon sequestration and connectivity of these key elements. F&GES in mining cities comprises three components: ecological source areas, ecological corridors, and ecological nodes. The optimization scheme proposed in this study can improve the coupling coordination between carbon sequestration and connectivity in mining areas, enhance carbon sequestration effectiveness, and thus achieve better ecological benefits.
The methodological framework of this study comprises three distinct steps, as illustrated in Figure 2. The first step involves identifying the structure of F&GES, which encompasses the matrix with the largest area and the best connectivity in F&GES, as well as two other critical components: ecological source areas and ecological corridors. To this end, we employed remote sensing ecological index analysis to identify ecological source areas by selecting habitat patches with high remote sensing ecological index values. We constructed an ecological resistance surface using the Habitat Risk Assessment (HRA) model and applied the Minimum Cumulative Resistance (MCR) model to compute the minimum cumulative resistance surface aimed at identifying ecological corridors.
The second step involves optimizing the current F&GES structure using the CSCCD model. Key elements in this model include the coupling coordination index between carbon sequestration and connectivity and topological features. The coupling coordination degree between carbon sequestration and connectivity was used to determine optimization schemes for different ecological source areas. For ecological source areas with poor carbon sequestration effectiveness, ecological restoration methods were employed to improve their carbon sequestration capacity by 10%. Meanwhile, for ecological source areas with poor connectivity, the low-topology priority principle was followed, and measures such as tree planting and grassland restoration were implemented to increase the number of new ecological source areas and corridors.
The third step involves comparing the carbon sequestration effectiveness and robustness of the optimized F&GES. Our findings indicate that after optimization, both carbon sequestration and the coordination degree between carbon sequestration and connectivity were enhanced, which suggests that the optimized structure has a higher carbon sequestration efficiency and is more conducive to achieving carbon neutrality. Furthermore, the optimized structure exhibited improved robustness, which suggests that it is more stable and possesses stronger resistance to destruction. In the following sections, we will provide a detailed description of each step in the research process.

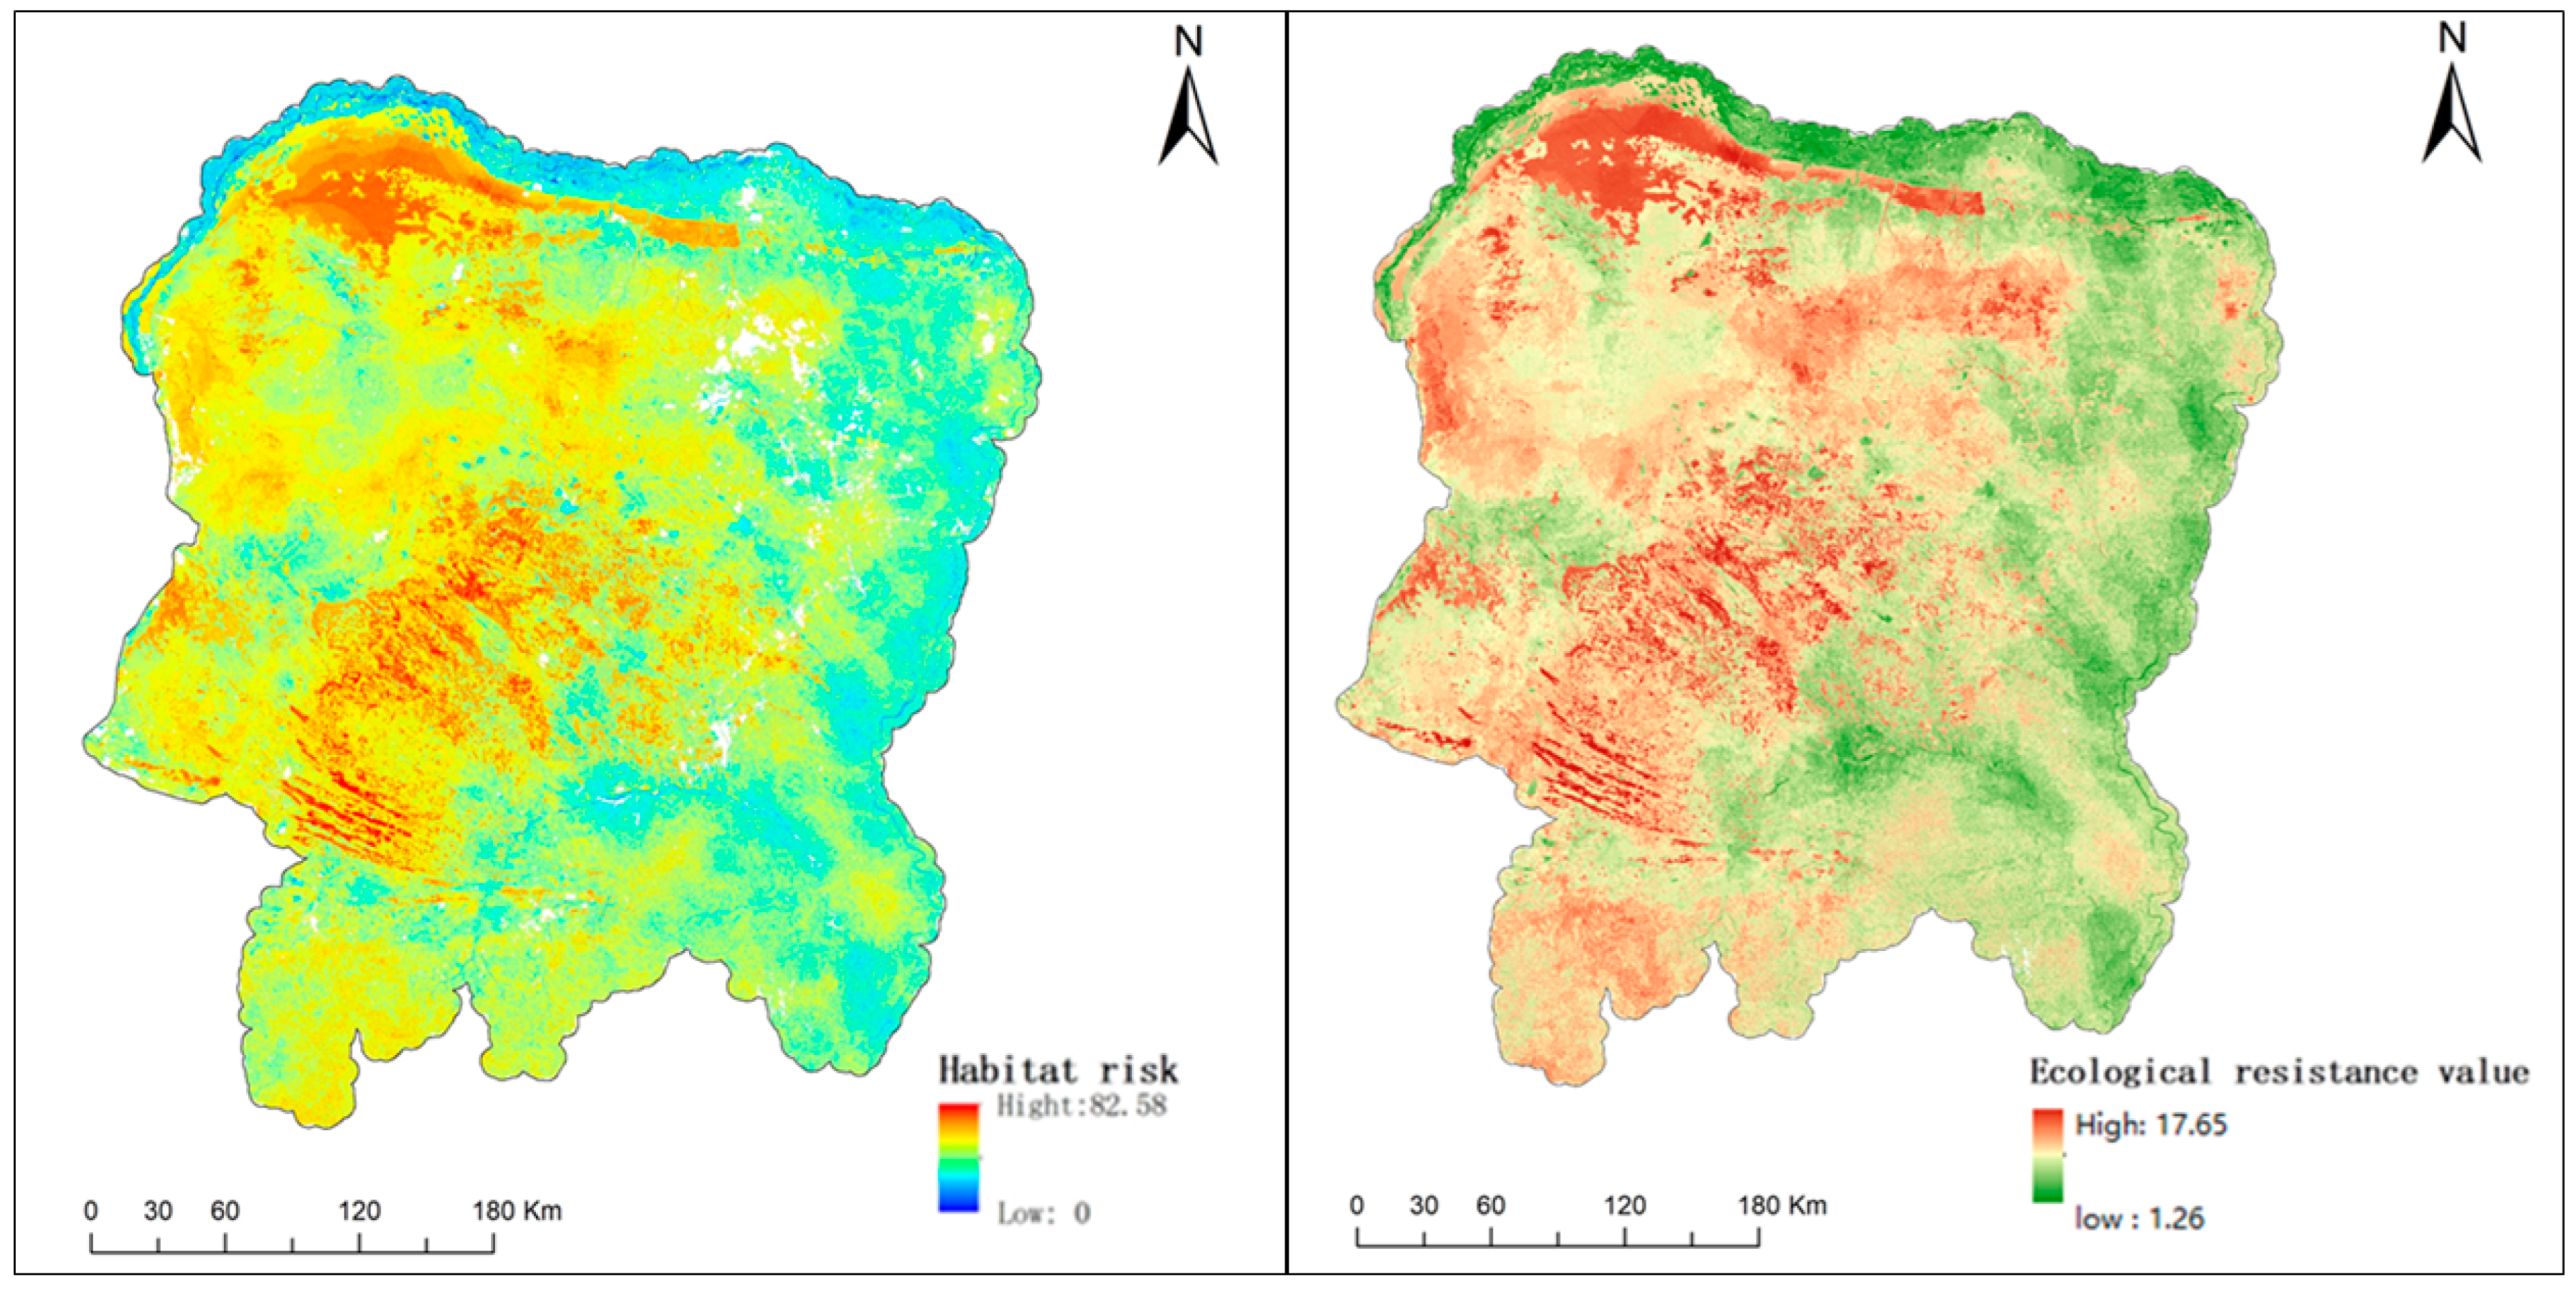
2.3.1. Identifying the Spatial Extent of F&GES
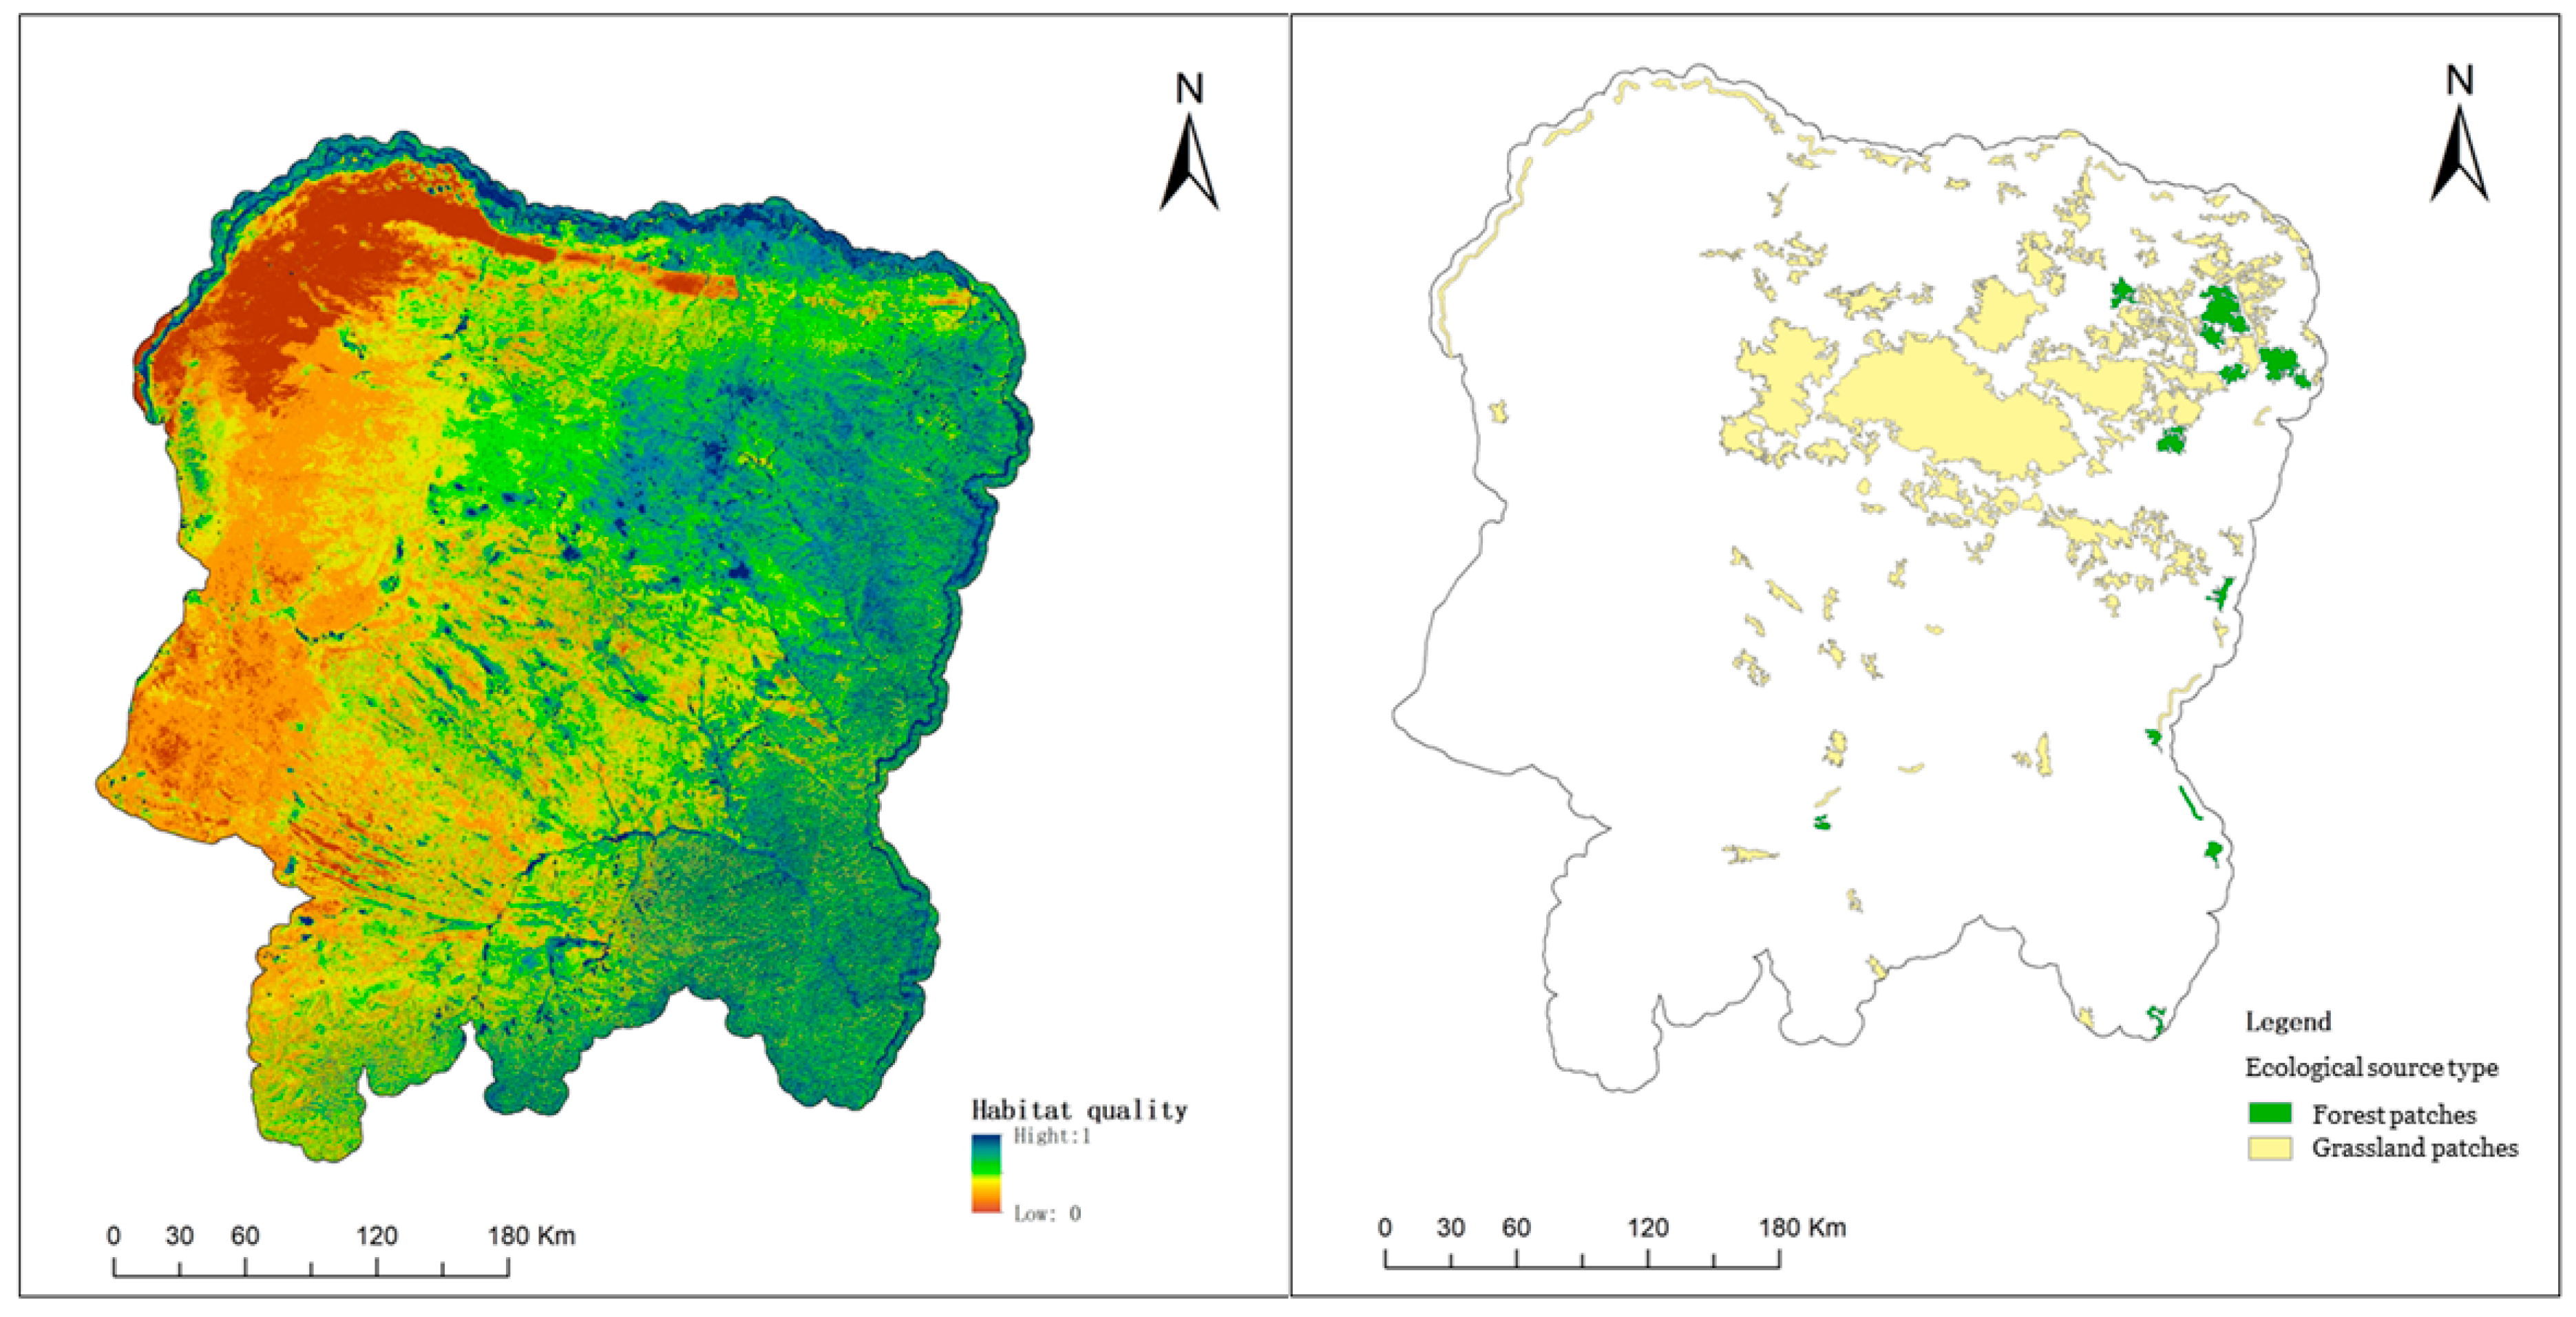
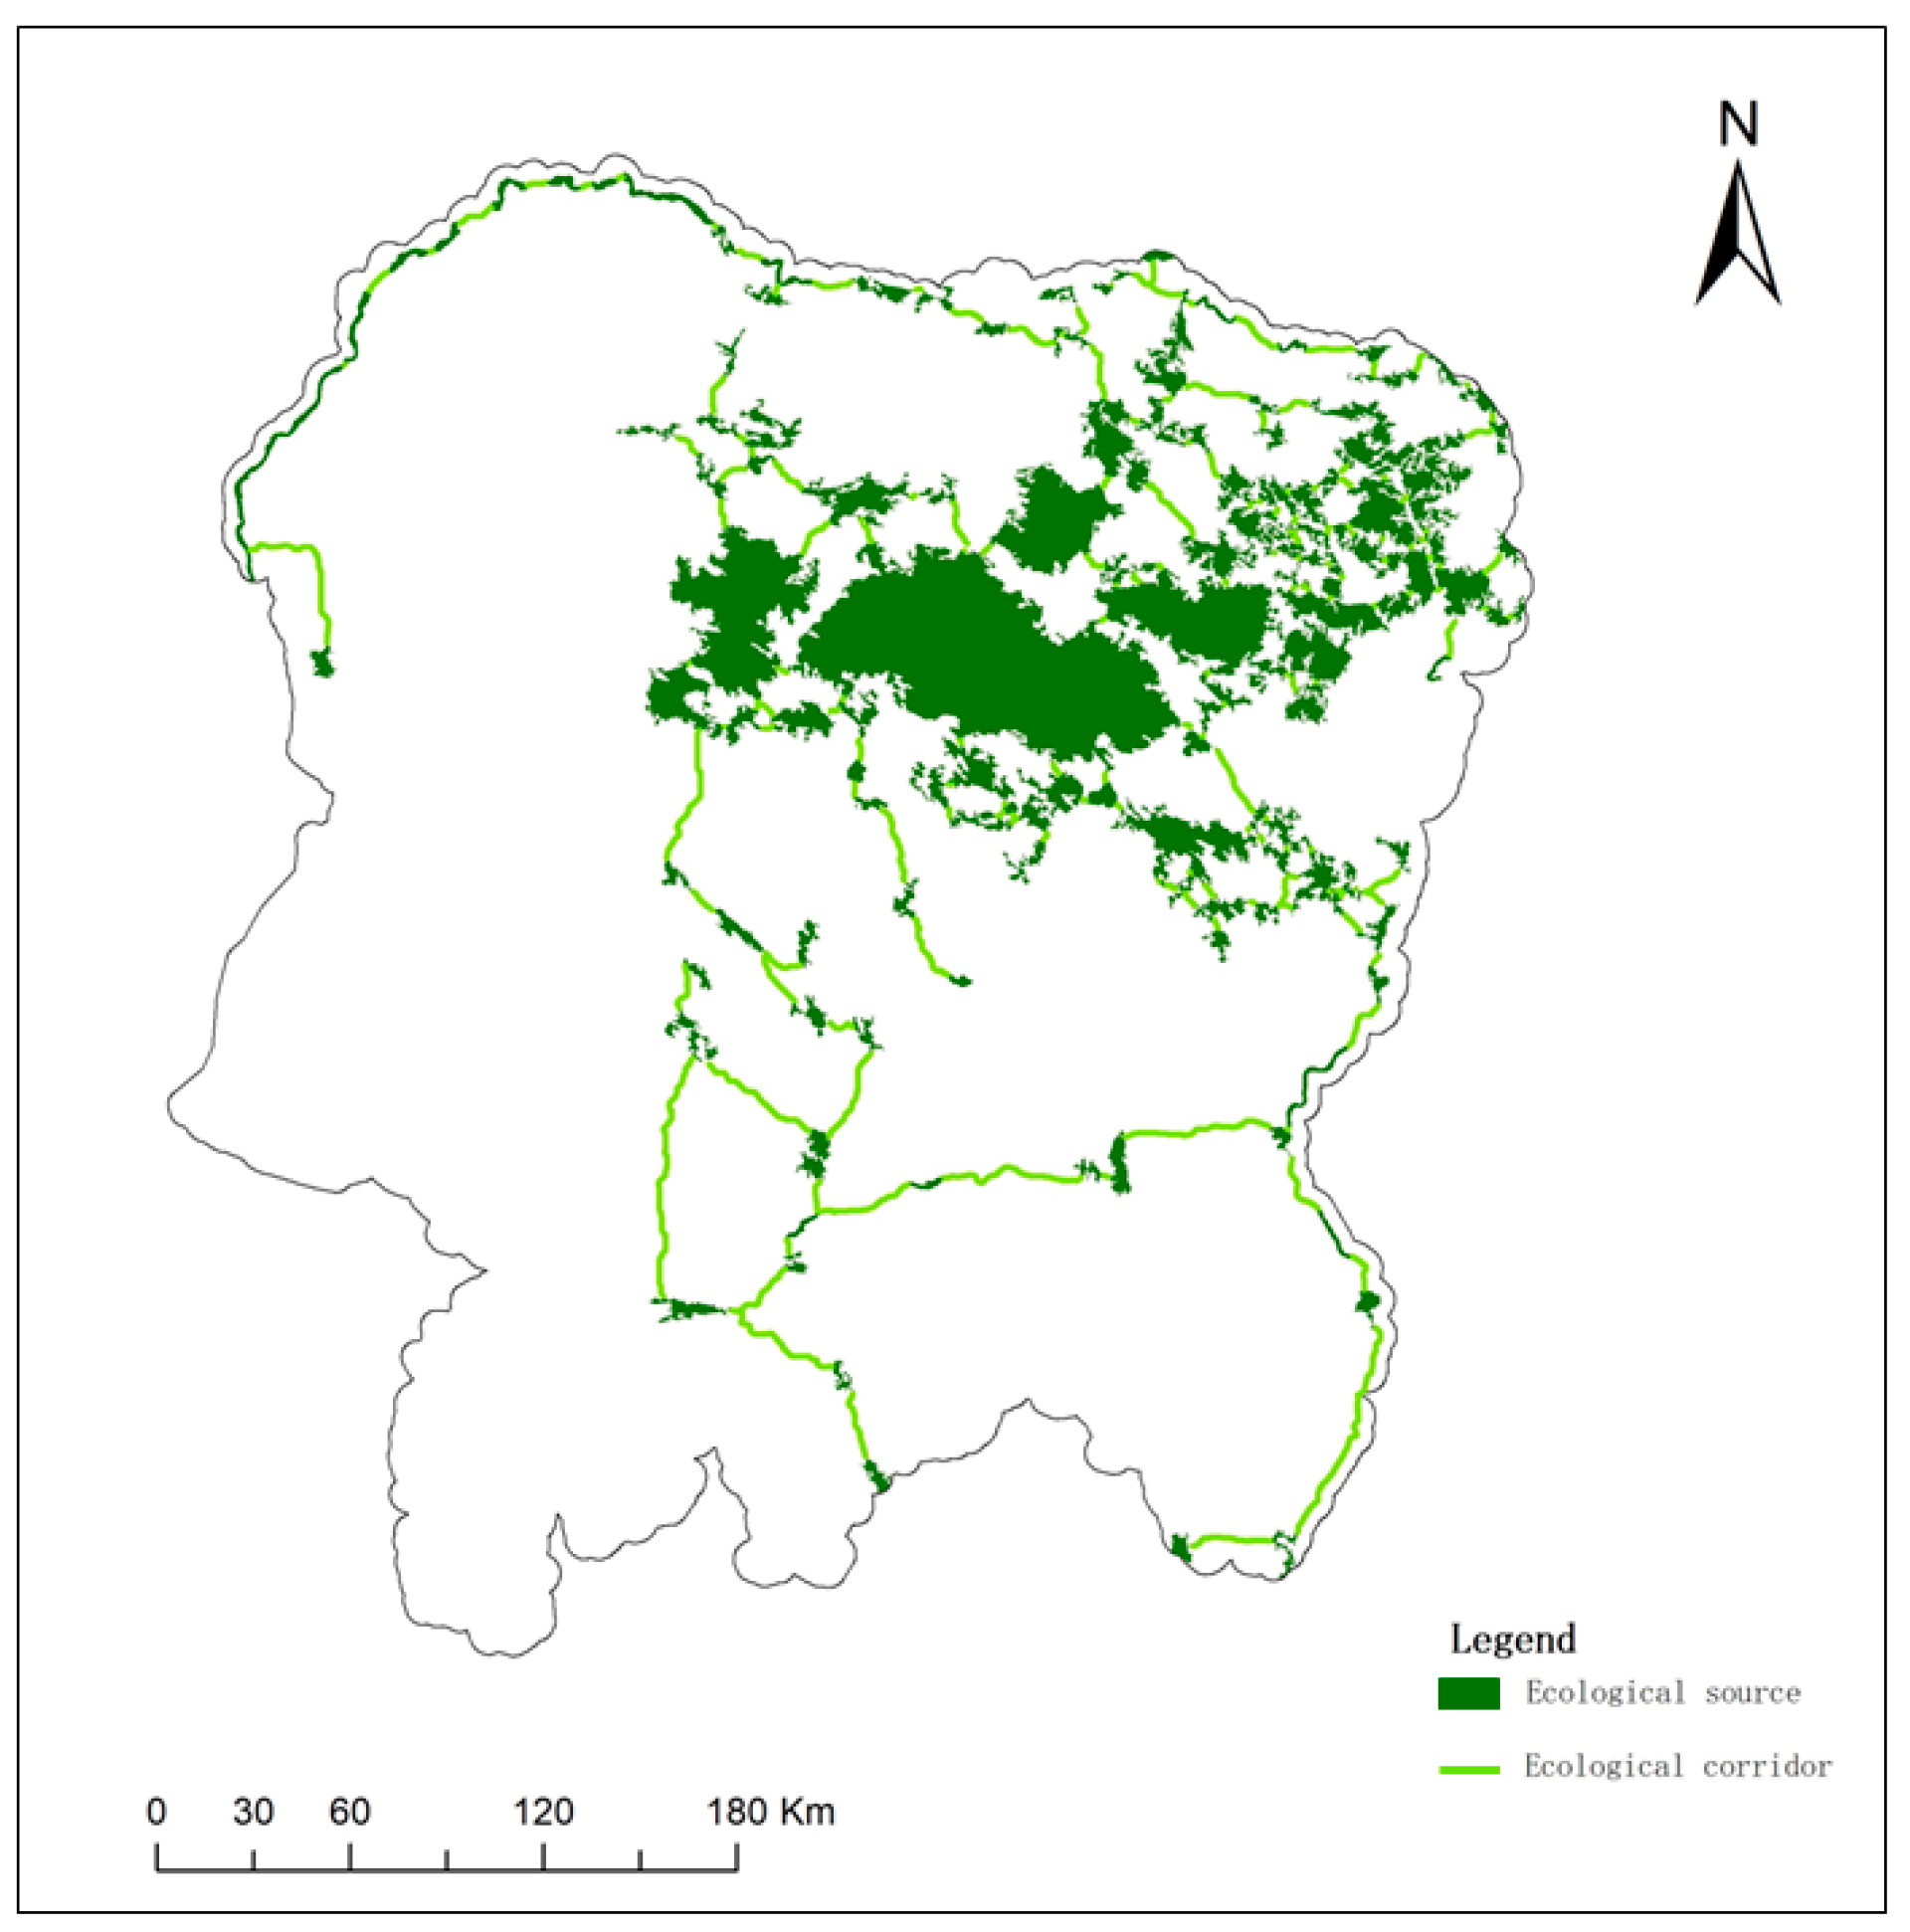
F&GES is a network system that comprises various types of ecosystems and organisms. This network system encompasses multiple ecological processes and maintains their integrity by connecting critical ecological source areas. Ecological corridors, on the other hand, function as pathways for material cycling and energy flow between different source areas, which jointly protect biodiversity and reduce human disturbance of habitats. In this study, we adopted the method of ecological space network construction and divided the basic paradigm of F&GES construction into three steps: ecological source area acquisition, ecological resistance surface construction, and ecological corridor extraction. These steps enable us to construct and maintain F&GES more effectively, thereby achieving the integrity of ecological processes and the protection of biodiversity.

Ecological Sources

The remote sensing ecological index (RSEI) is a methodology that leverages remote sensing technology to perform a comprehensive analysis of the quality of regional ecological environments [30]. In comparison to traditional methodologies, RSEI boasts a wide detection range, fast data acquisition, and reduced limitations imposed by ground conditions. It can provide a comprehensive, objective, and efficient evaluation of ecological environment quality. The study area, Eyu, is located in a semi-arid climate region characterized by a complex terrain, large areas of sand and dust, dense coal mine distribution, low vegetation coverage, frequent natural disasters such as soil erosion and sandstorms, damaged biodiversity, and an extremely fragile ecosystem. Ecological source areas are the primary spatial range for biological survival and the primary site for multiple ecological processes. As such, assessing habitat quality is a prerequisite for determining ecological patches. In this study, the RSEI model was employed to evaluate the ecological environment quality of different habitats. Given the ecological environment conditions in Eyu, four remote sensing ecological indicators were selected: wetness (WET), greenness (NDVI), dryness (NDBSI), and thermal environment (LST). These indicators can reflect various aspects of the ecological environment, providing crucial data support for the identification of ecological source areas [31].
The greenness index is an indicator that reflects the vegetation coverage status, typically measured by the normalized vegetation index (NDVI) and vegetation spatial distribution and density. These indicators exhibit linear correlations and can reflect the coverage situation of various vegetation types, including forests, shrubs, and grasslands [32]. Thus, in this study, we have chosen NDVI as the greenness indicator in the remote sensing ecological index (RSEI). The formula for NDVI is as follows (Formular (1)):
I NDVI = ρ NIR ρ RED ρ NIR + ρ RED
In this context, ρ N I R denotes the reflectance in the near-infrared band, and ρ R E D denotes the reflectance in the red band.
Utilizing the Laplacian pyramid transform method, we performed data compression and redundancy removal, yielding three components: “brightness”, “greenness”, and “third component”. The “third component” was selected as the wetness index due to its significance as an ecological indicator reflecting the changes in soil and vegetation moisture status in the environment, and its ability to better capture humidity changes in the ecological system [33]. The formula for calculating the wetness index (WET) is presented below (Formular (2)):
I W E T = 0.151 ρ B l u e + 0.197 ρ G r e e n + 0.328 ρ R e d + 0.341 ρ N I R 0.712   ρ s w i r 1 0.456   ρ s w i r 2
In this context, ρ B l u e denotes the reflectance in the blue band, ρ G r e e n denotes the reflectance in the green band, ρ R e d denotes the reflectance in the red band, ρ N I R denotes the reflectance in the near-infrared band, and ρ s w i r 1 and ρ s w i r 2 denote the reflectance in mid-infrared bands 1 and 2, respectively.
Land surface temperature (LST) is an important ecological indicator that can reflect vegetation coverage, surface water circulation, and urban ecosystem conditions [34]. Typically, the calculation of LST requires the use of multiple remote sensing data, such as NDVI, surface emissivity, and thermal radiance, to obtain a comprehensive calculation. In this study, we have employed LST to represent the thermal factor in the RSEI index, in order to reflect the changes in temperature in the ecological environment. The calculation formula for LST is presented below (Formular (3)):
I L S T = T 1 + ( λ T α ) ·   l n ε 273
In this context, T represents the temperature value of the sensor, ε denotes the surface emissivity, λ refers to the central wavelength of 11.435   μ m , and α is 1.438 × 10 2   m · K .
Aridity refers to the extent of dryness resulting from natural or anthropogenic modifications to the land and is a crucial element in evaluating the ecological environment’s quality. Eyu is situated in a semi-arid region that is used for farming and pastoralism, and human activities like coal mining significantly affect the land [35]. Hence, in this study, we have opted to employ the normalized difference bare soil index (NDBSI) as the aridity indicator in the RSEI to denote the changes in aridity in the ecological environment. NDBSI is a frequently used remote sensing index, and its calculation formula is presented below (Formular (4)):
I N D B S I = I I B I + I S I 2
This study is based on the ecological conditions of the Eyu region, where four ecological indicators, namely humidity, greenness, aridity, and thermal status, were selected and synthesized using principal component analysis. Due to the low vegetation coverage, scarce precipitation, and extremely fragile ecosystem in this area, the first principal component was adopted as the remote sensing ecological index (RSEI) to comprehensively represent the ecological environment quality, with a value range between 0 and 1, where a higher RSEI value highlights a better ecological condition of the habitat patch.
This study employed the RSEI model to conduct an ecological quality assessment of forest and grassland ecological patches within the Eyu district. The model selected four indicators that can be easily retrieved through remote sensing methods and automatically weighted based on data characteristics, ensuring the objectivity and reproducibility of the results. By combining the research achievements of numerous scholars in ecological environment monitoring in northwestern China, we found that the RSEI index is well-suited for monitoring the ecological environment at the urban scale [36]. In this study, we categorized the forest and grassland ecological patches into five levels based on their RSEI values using the maximum likelihood method and only retained patches falling under the fourth and fifth levels [37]. Furthermore, we incorporated an area threshold (greater than 5 km2) and merged adjacent habitat patches to further refine the scope of the forest and grassland ecological source areas. This evaluation method not only considered the RSEI value level division but also incorporated various factors, such as regional characteristics and surrounding environmental factors, to provide a more comprehensive and objective assessment of ecological quality.

Ecological Corridors

Prior research has typically employed indicators such as land use, topography, and vegetation coverage to depict the level of ecological resistance to flow and has relied on expert scoring methods to ascertain ecological resistance values for each indicator. However, this approach disregards the variations that exist across different regions for the same indicators, such as the extent of development and human-induced disturbances for identical land use types [38]. Especially in large-scale regions, landscape differences between various areas are significant. Consequently, determining ecological resistance values using expert scoring methods may fail to objectively and accurately reflect the level of ecological resistance to flow in different landscapes. To address this limitation, this study introduces the habitat risk assessment module and calculates ecological resistance using the InVEST model to more precisely evaluate ecological resistance levels in different regions.
The HRA model integrates multiple stressors, including human activities that disturb habitats, to evaluate the cumulative risks and recovery capability of habitat patches, and to assess the degree of harm caused by various types of disturbances to habitat patches [39]. The model comprises three essential components: the relative impact of ecological threats, the distance between habitat patches and threats, and the relative sensitivity of habitat types to ecological threats. Initially, we determined the relative impact of each threat. The findings indicated that mining land had the greatest impact on surrounding habitat quality, followed by urban construction land, whereas forests and grasslands had a relatively smaller impact, and water bodies and wetlands had the least impact on habitat quality. Consequently, we assigned corresponding weights to different land use types, which represented the relative destructive power of threat r to all habitats, with values ranging from 0 to 1. Specifically, the weight of mining land was 0.8, urban construction land was 0.7, grassland was 0.5, forests were 0.4, wetlands were 0.3, and water bodies were 0.1.
The assumption that ecological threat decreases with increasing distance is based on a comprehensive evaluation of the field investigation conducted in the Eyu district, the InVEST model user manual [40], and relevant research findings from domestic and foreign scholars [41]. Numerous ecological and environmental studies have revealed that the impact of ecological threats gradually diminishes with increasing distance. This phenomenon can be attributed to the physical isolation and ecological processes that occur with distance, which weaken the ecological threat [42]. Hence, it is reasonable to assume that ecological threat decreases with increasing distance in our study. In Eyu district, we conducted a field investigation and model analysis, which led to the conclusion that the impact of mining land on the habitat decreases with increasing distance. Based on this, we employed a linear distance decay function to describe the decay of threats with distance, which accurately reflects the distance relationship between ecological threat and habitat grid in our model. The formula used for this purpose is as follows (Formular (5)):
i r x y = 1 ( d x y d r m a x )
In this context, i r x y denotes the influence of threat r on the habitat grid at location x from the threat at grid y, d x y refers to the linear distance between grids x and y, and d r m a x represents the maximum effective distance of threat r.
Subsequently, it was imperative to ascertain the relative sensitivity of various habitat types to each threat. In the Eyu district, the effects of mining land, urban construction land, and deserts on different habitats varied. As such, each habitat type might exhibit dissimilar responses to threats, necessitating the computation of relative sensitivity and the subsequent modification of previous calculations. The formula utilized to calculate relative sensitivity is as follows (Formular (6)):
D x j = r = 1 R y = 1 Y r ( w r r = 1 R w r ) r y i r x y β x S j r
In this context, D x j corresponds to the cumulative threat level at grid x for the jth habitat type, y encompasses all grids on the threat r grid map, Y r pertains to the grids located within the grid cell of threat r, and S j r [ 0 , 1 ] denotes the sensitivity of LULC to threat r, with values closer to 1 indicating greater sensitivity. Lastly, the habitat quality Q x j for grid x in habitat type j is computed based on the aforementioned values, employing the following formula (Formular (7)):
Q x j = H j ( 1 ( D x j z D x j z + k z ) )
In this context, z is assigned a value of 2.5, whereas k serves as a scaling factor.
Ecological processes, including material cycling, information exchange, and energy flow, occur among diverse forest and grassland ecological source areas. Ecological flow serves as a representation of the ecological processes in landscape ecology, but the flow between different source areas is impeded by various factors. Ecological resistance denotes the degree to which an ecological system or habitat obstructs ecological flow. Ecological resistance generally comprises factors such as human activities and natural interactions. Typically, ecological resistance increases with greater terrain slope, lower vegetation cover, and higher road network density. Moreover, different land cover types exhibit varying degrees of ecological resistance, with forest, grassland, and water bodies exhibiting lower resistance, while buildings, deserts, and bare land exhibit higher resistance [43].
In the Eyu district, forest and grassland ecological space is disrupted by human activities, including coal mining and urban development, as well as natural factors such as deserts. The greater the disruption to the habitat caused by human activities, the higher the risk to the habitat, and the greater the probability that ecological flow will be obstructed, resulting in increased ecological resistance. Therefore, land cover type, altitude, slope, vegetation cover, water network density, road network density, and habitat risk factors were chosen as constraint factors to characterize ecological resistance in Eyu. Each ecological resistance factor was classified utilizing the maximum likelihood method and then weighted to generate a composite ecological resistance surface.
In order to extract ecological corridors, we employed the MCR model, which is primarily founded on three elements: ecological patches, resistance surfaces, and accumulated resistance. Ecological corridors were obtained by identifying the path of minimum accumulated resistance for ecological flows between patches. The mathematical formulation of the model is expressed as follows (Formular (8)):
M C R = f m i n j = n i = m ( D i j × R i )
Within the aforementioned equation, MCR signifies the minimum accumulated resistance value, f m i n is a distance-dependent function utilized to evaluate the minimum accumulated resistance value from any grid cell to various ecological source sites within the landscape, D i j refers to the spatial distance from ecological source site j to ecological patch i, and R i   represents the resistance value of ecological source site i. By computing the accumulated resistance value of ( D i j × R i ) , we can gauge the accessibility of ecological flows between different ecological source sites. Consequently, the magnitude of the minimum accumulated resistance value can be employed to assess the likelihood of source site expansion, reflecting the connectivity and similarity between various source sites within a specified region.
Ecological source areas are a type of land that facilitates ecological processes, while ecological resistance surfaces are surfaces that inhibit such processes [44]. The minimum cost distance is the amount of cost or work required to travel from one ecological source area, passing through the ecological resistance surface, and reach another source area. An ecological corridor is a set of minimum cost distances between different ecological source areas, and optimal ecological benefits are generated by the flow of energy through these corridors in the ecosystem. Multiple paths exist for ecological flow to travel from a specific ecological source area, passing through the resistance surface, and reach another ecological source area. The ecological corridor is the optimal path selected from among these paths. It represents the cumulative minimum resistance encountered by ecological flow and is not equivalent to the Euclidean distance between two source areas.
In the Eyu district, frequent coal mining has led to large areas of fragmented ecological patches, including forests, grasslands, and water bodies that have been adversely affected. To ensure the integrity of ecological processes, such as carbon and water cycling, animal migration, and nutrient transfer between ecological source areas, it is necessary to construct ecological corridors to connect different ecological source areas. To achieve this goal, this study employed the minimum cost path model in ArcGIS to extract ecological corridors between different source areas. This model can identify channels with the cumulative minimum ecological resistance between ecological source areas, thereby ensuring the optimality of the ecological corridors.

2.3.2. Evaluation of the Structure of F&GES

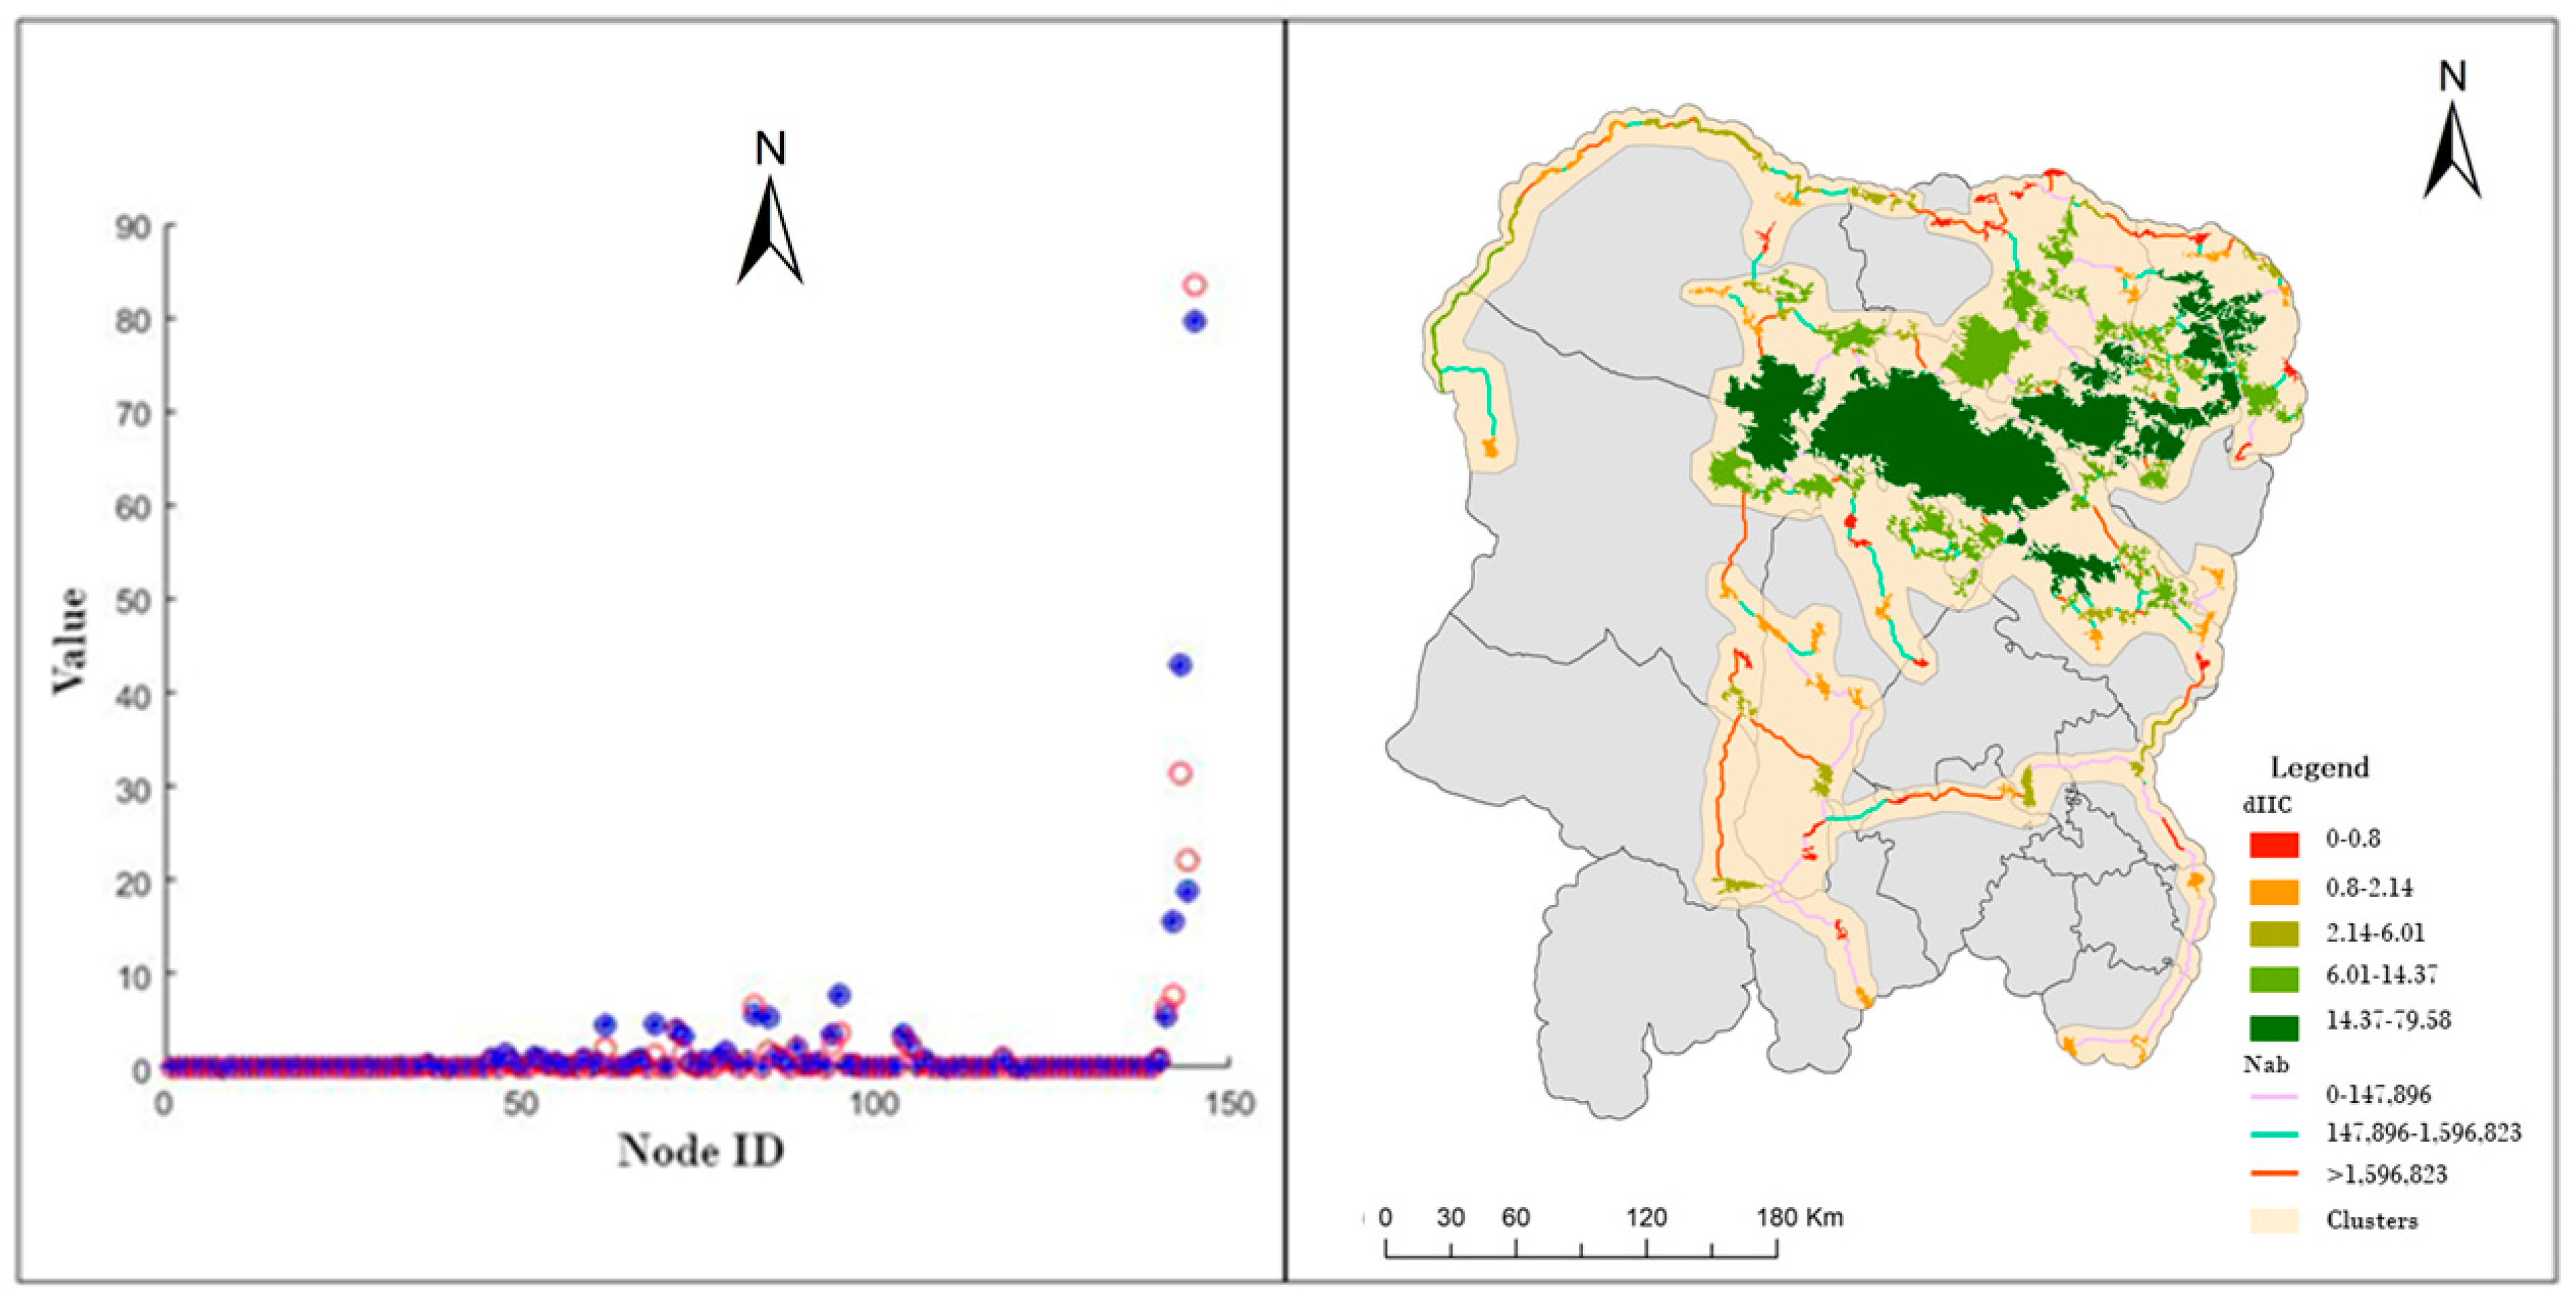
Evaluation of Connectivity

Connectivity serves as a metric for quantifying the degree of ecological process movement between F&GES sites and reflects the connectivity of F&GES in ecological functionality [45]. In the Eyu region, habitat fragmentation has resulted in the fragmentation of F&GES, leading to decreased connectivity between ecological source sites. This reduction in connectivity has resulted in a decline in material cycling and energy flow between ecological source sites, thus affecting the ecological function of carbon sequestration in the Eyu region. To analyze the connectivity level between different ecological source sites, the present study adopted connectivity indices based on graph theory and utilized the integral index of connectivity (IIC) and probability of connectivity (PC) as measures of connectivity. The formulas are expressed as follows (as in Formulas (9) and (10)):
I I C = i = 1 n j = 1 n a i × a j 1 + n l i j A L 2 n
P C = i = 1 n j = 1 n a i × a j × p i j * A L 2
In the aforementioned equations, n denotes the total number of ecological source sites, a i and a j represent the area of ecological source site i and j, n l i j indicates the number of ecological source sites that are connected by the shortest path between ecological source sites i and j, A L denotes the cumulative area of all ecological source sites, and p i j * refers to the maximum probability of ecological processes flowing between ecological source sites i and j. The integral index of connectivity (IIC) varies between 0 and 1, where IIC = 0 implies zero connectivity between ecological patches, while IIC = 1 indicates complete connectivity between ecological patches. The probability of connectivity (PC) lies between 0 and 1, with an increase in PC corresponding to an increase in the connectivity of ecological patches.
In the present study, we calculated the importance values of each forest and grassland ecological source site in the spatial network using the integral index of connectivity (IIC) and probability of connectivity (PC) indices, which were represented by dIIC and dPC, respectively. A higher value of these indices indicates the greater significance of a given ecological source site in enhancing the connectivity of the network structure. To address the differences in data scale among various indices, normalization of the indices was performed using the following Formulas (11)–(13):
d I I C = I I C I I C I I C × 100 %
d P C = P C P C P C × 100 %
y = d I I C m i n V a l u e m a x V a l u e m i n V a l u e
The indices dIIC and dPC quantify the alterations in the structural connectivity of F&GES following the removal of a specific ecological patch, thereby providing insights into the ecological patch’s importance in maintaining the network’s structural connectivity. The indices I I C and P C represent the landscape spatial structure’s connectivity after the removal of a particular ecological patch. The normalized value of dIIC is denoted by y.
The connectivity of ecological corridors provides a means of characterizing the extent of interaction between ecological source sites and assessing the relative importance of corridors. In practice, the gravity model is commonly used to quantify the connectivity and relative importance of ecological corridors. The specific formula for the gravity model is as follows (Formular (14)):
G a b = N a N b D a b 2 = | 1 P a × ln ( S a ) | | 1 P b × ln ( S b ) | ( L a b L m a x ) 2 = L m a x 2 ln ( S a S b ) L a b 2 P a P b
In the aforementioned formula, G a b represents the interaction force between ecological patches a and b, while N a and N b denote the weight values assigned to ecological source sites a and b, respectively. P a and P b indicate the resistance values of ecological source sites a and b, while D a b signifies the resistance value of the corridor connecting ecological source sites a and b. L a b represents the cumulative resistance value of ecological processes flowing through the corridor between ecological source sites a and b, and L m a x refers to the maximum resistance value of corridors in the network structure.

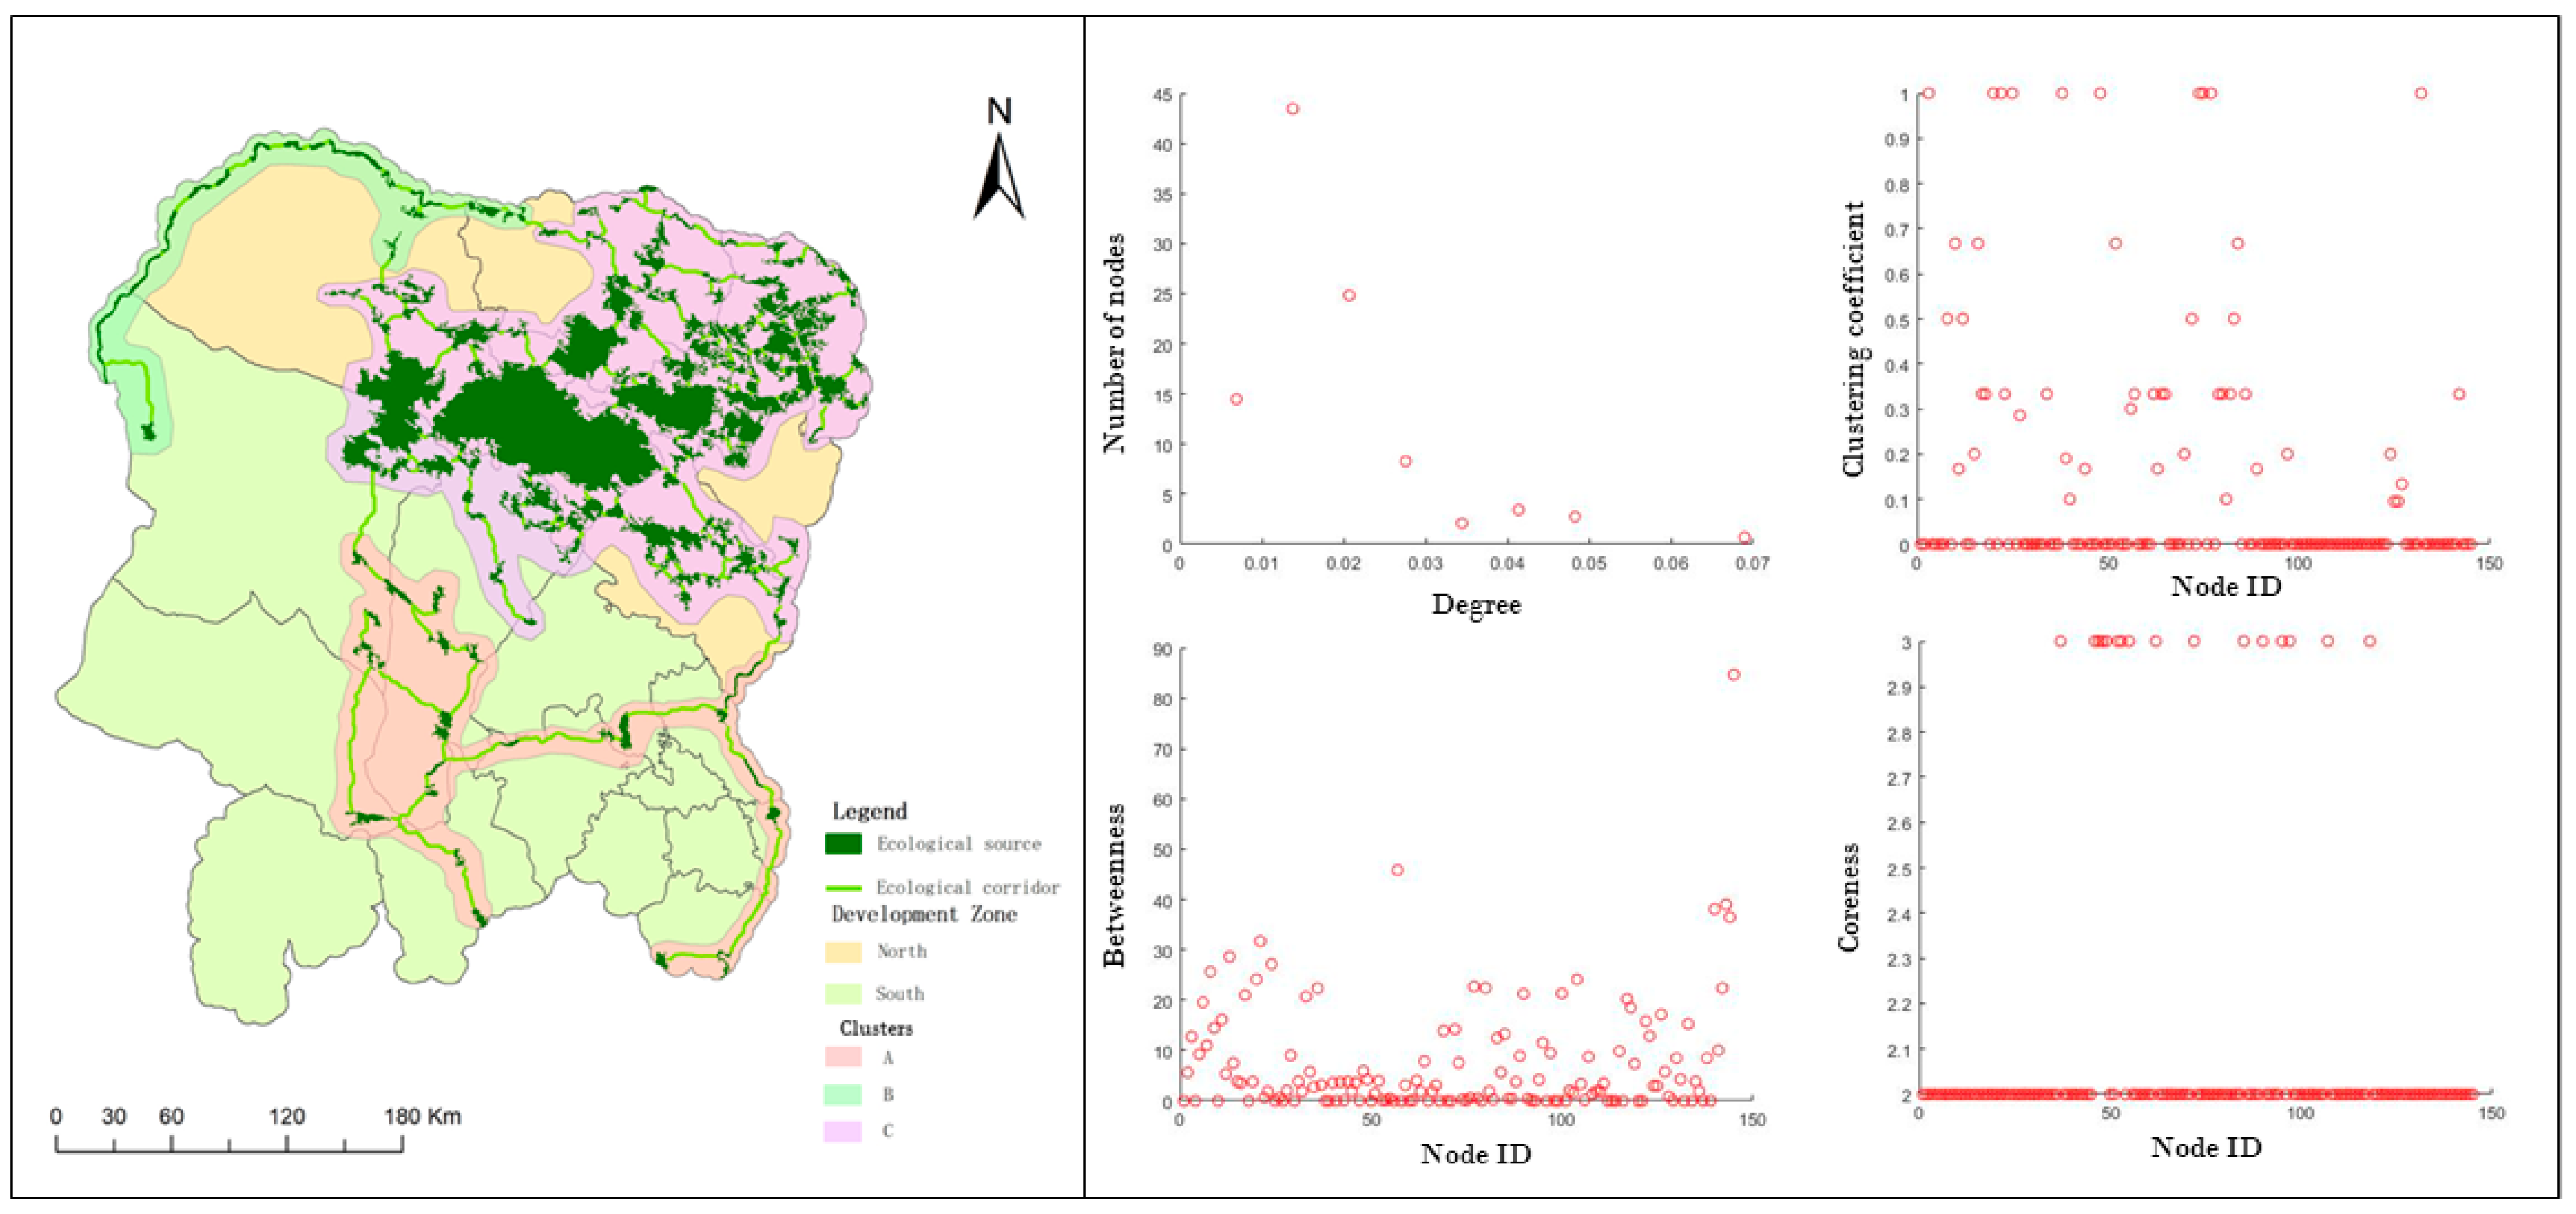
Evaluation of Topological Characteristics of F&GES Structure

F&GES plays a crucial role in maintaining the normal functioning and expression of ecological processes and functions among different ecological source sites through the connectivity provided by ecological corridors [46]. This connectivity can be viewed as a topological relationship within a complex network, representing a simple complex network in space. Thus, this study performed an analysis of F&GES using static indices of complex network theory. Ecological source sites were abstracted as nodes in the complex network, and ecological corridors were represented as edges connecting different nodes. Four topological indices were selected to describe the topological characteristics of F&GES.
In the context of a complex network, the degree of a node denotes the number of nodes directly linked to it. It is evident that the connectivity of nodes in a complex network can differ, and nodes with higher degrees are considered more important in the network structure. The degree of a node can be calculated using the following Formula (15):
k i = i = 1 n a i j
Within the aforementioned formula, k i represents the degree of node i, which is the number of edges incident to node i, while a i j denotes the total number of nodes that are connected to node i.
Centrality measures such as betweenness centrality can provide an intuitive means of assessing the importance of nodes in complex networks. Betweenness centrality, a type of centrality measure, refers to the proportion of shortest paths in the network that pass through a given node. A higher betweenness centrality value for a node suggests that it plays a more significant role in enabling communication between other nodes, and thus possesses greater importance in the network. The formula for computing betweenness centrality can be expressed as follows (Formular (16)):
C b = k i j n k j ( i ) n k j i = 1 N k i j n k j ( i ) n k j
Within the aforementioned formula, n k j represents the count of shortest paths between nodes k and j, whereas n k j ( i ) refers to the count of shortest paths between nodes k and j that traverse node i.
In a complex network, the clustering property refers to the possibility that two nodes connected to the same node may also be connected to each other. The clustering coefficient is a measure that reflects the level of interconnectivity between adjacent nodes in the structure of a complex network. It is defined as the ratio of the number of connections between node i and other nodes in its local neighborhood to the maximum possible number of connections. The formula for computing the clustering coefficient can be expressed as follows (Formular (17)):
C i = 2 E i k i ( k i 1 )
Within the aforementioned formula, C i denotes the clustering coefficient of a specific node i, E i is the count of actual edges that interconnect the k i neighboring nodes of node i, and k i represents the degree of node i.
In the context of complex networks, the k-core refers to a subgraph obtained by removing all nodes with degrees less than k. If a node belongs to the k-core but not the (k + 1)-core, its core number is defined as k. The core number of a network is the maximum core number among all nodes in the network. The core number of a node can be used to indicate its depth within the complex structure, thereby characterizing the hierarchical features of the topology.

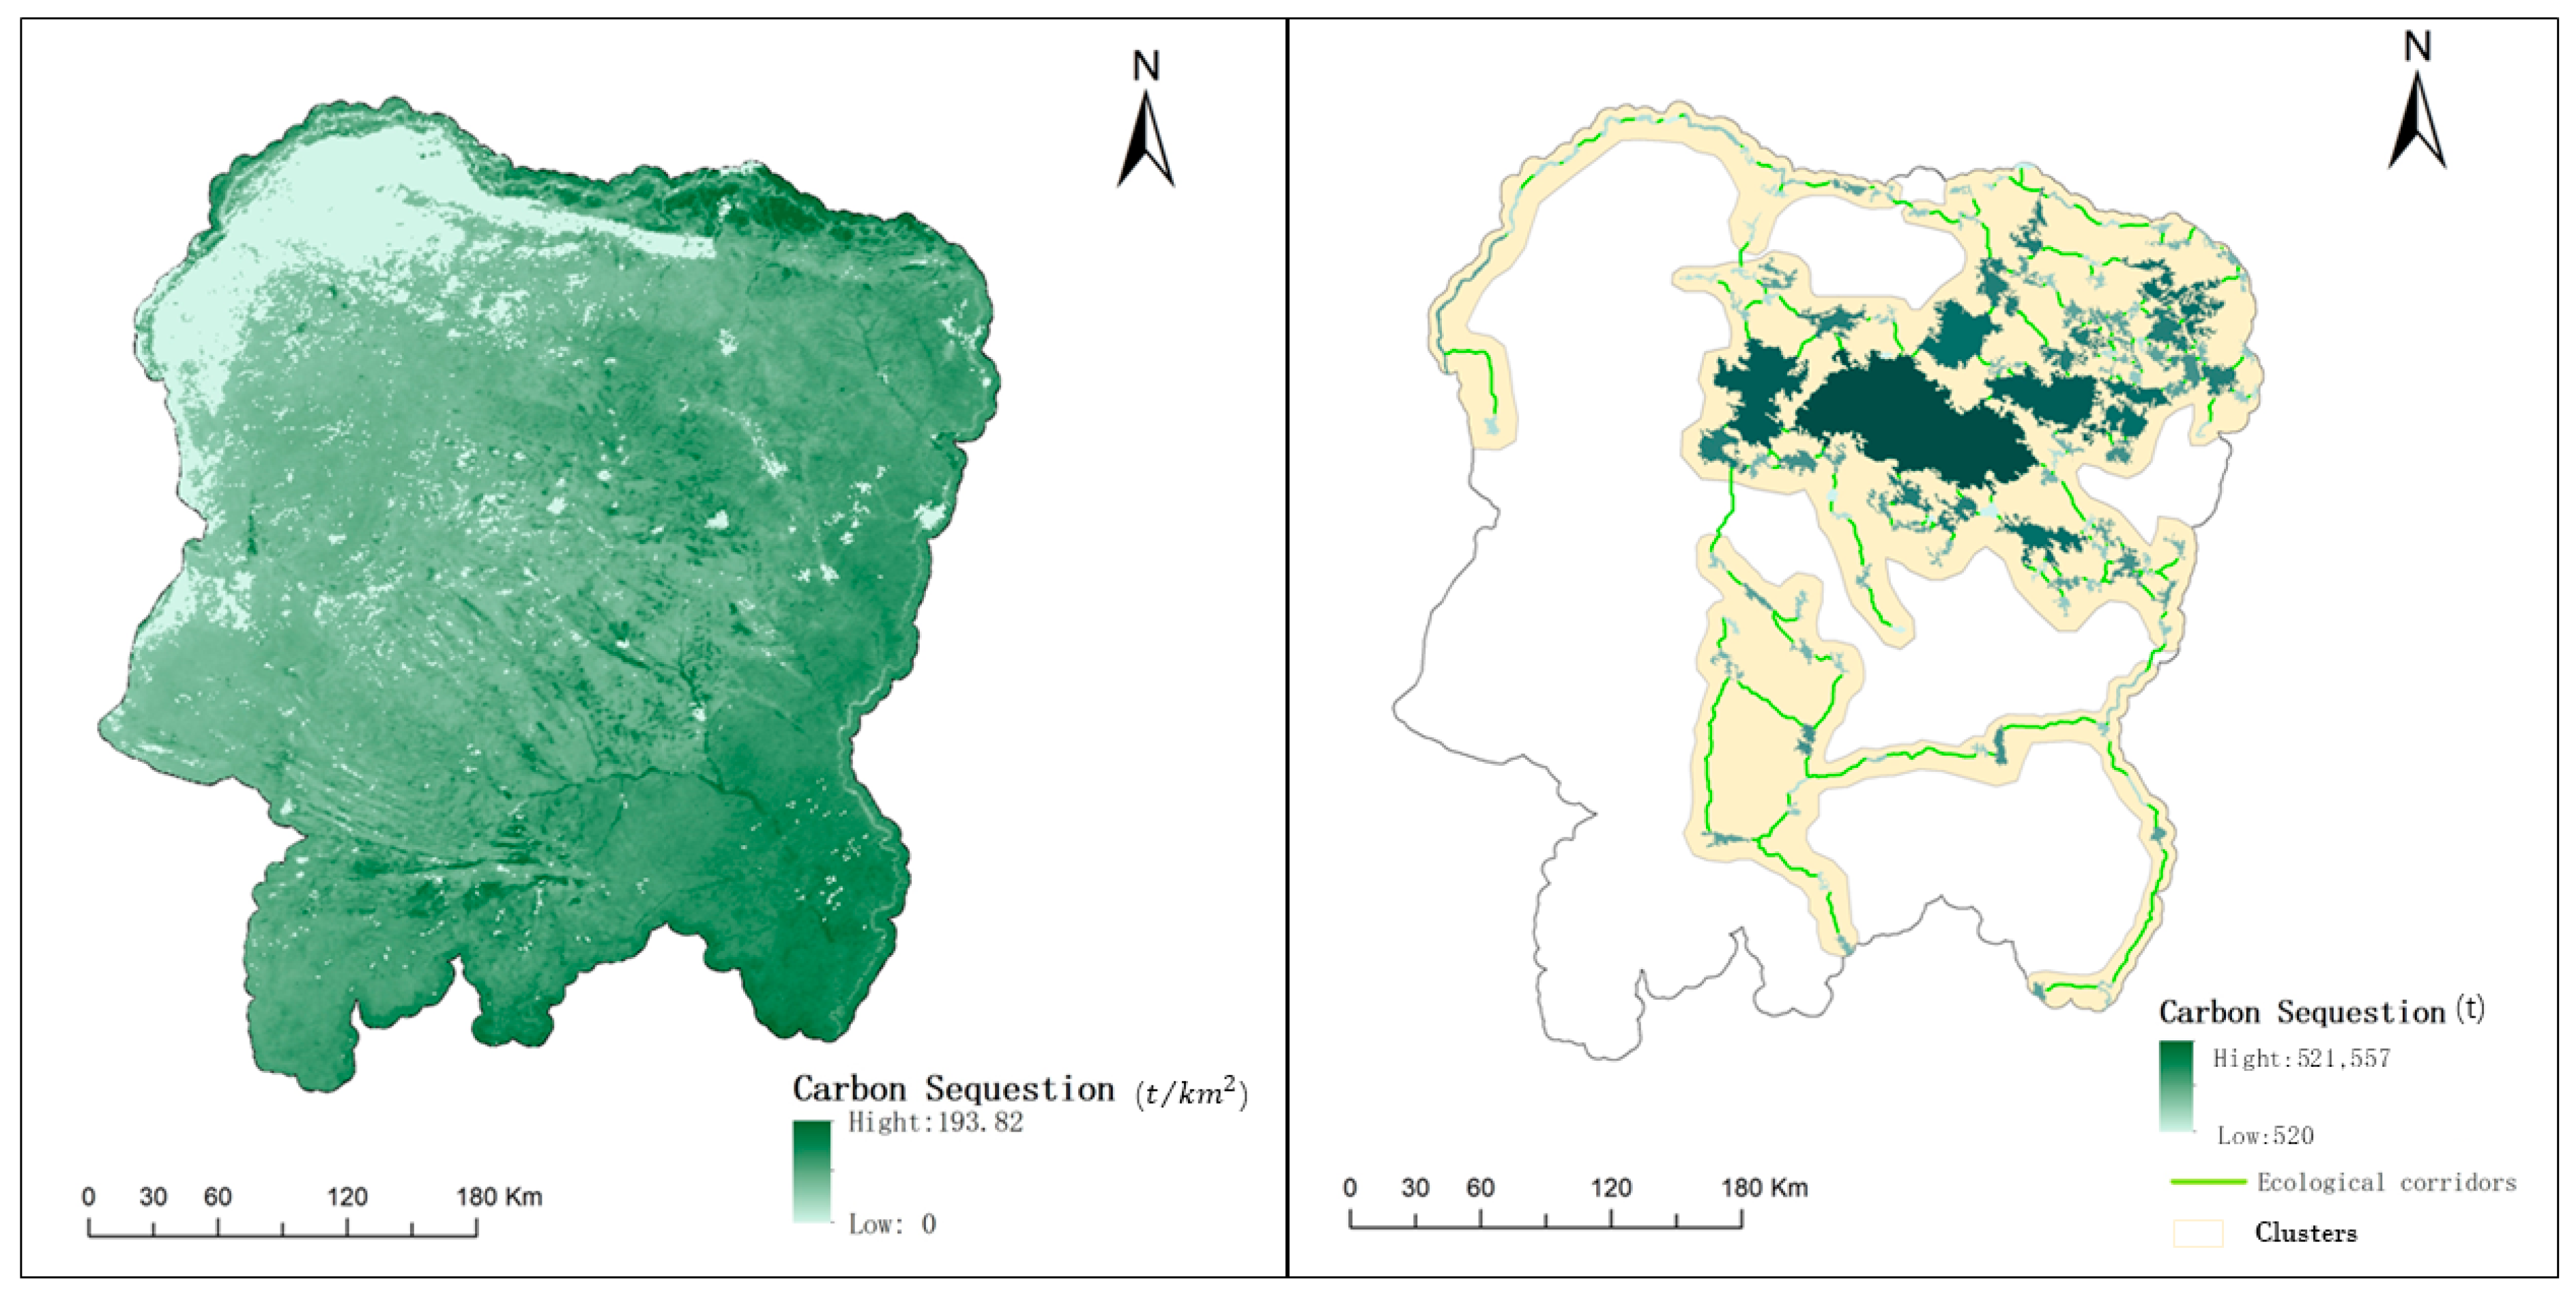
2.3.3. Evaluation of Carbon Sequestration Effects of F&GES

NEP, which is a significant metric utilized to describe the carbon sequestration effect of vegetation in a region, can indicate the discrepancy between the net primary productivity (NPP) of vegetation and soil heterotrophic respiration. In this study, we employed the MODIS MOD17A3HGF product to acquire NPP data in the Eyu region [47]. This product has been extensively utilized in vegetation NPP research in northwestern China. To compute soil respiration ( R H ), we employed an empirical formula established in previous studies by scholars that has been verified in the field and has been demonstrated to be suitable for the Eyu region. The explicit formula for computing NEP is as follows (Formulas (18) and (19)):
N E P ( x , t ) = N P P ( x , t ) R H ( x , t )
      R H = 0.22 × [ e ( 0.0913 × T ) + l n ( 0.3145 × P + 1 ) ] × 30 × 46.5 %
Within the given formula, R H represents the annual soil respiration ( g · C · m 2 ), T denotes the average temperature throughout the year ( ), and P designates the total annual precipitation (mm).

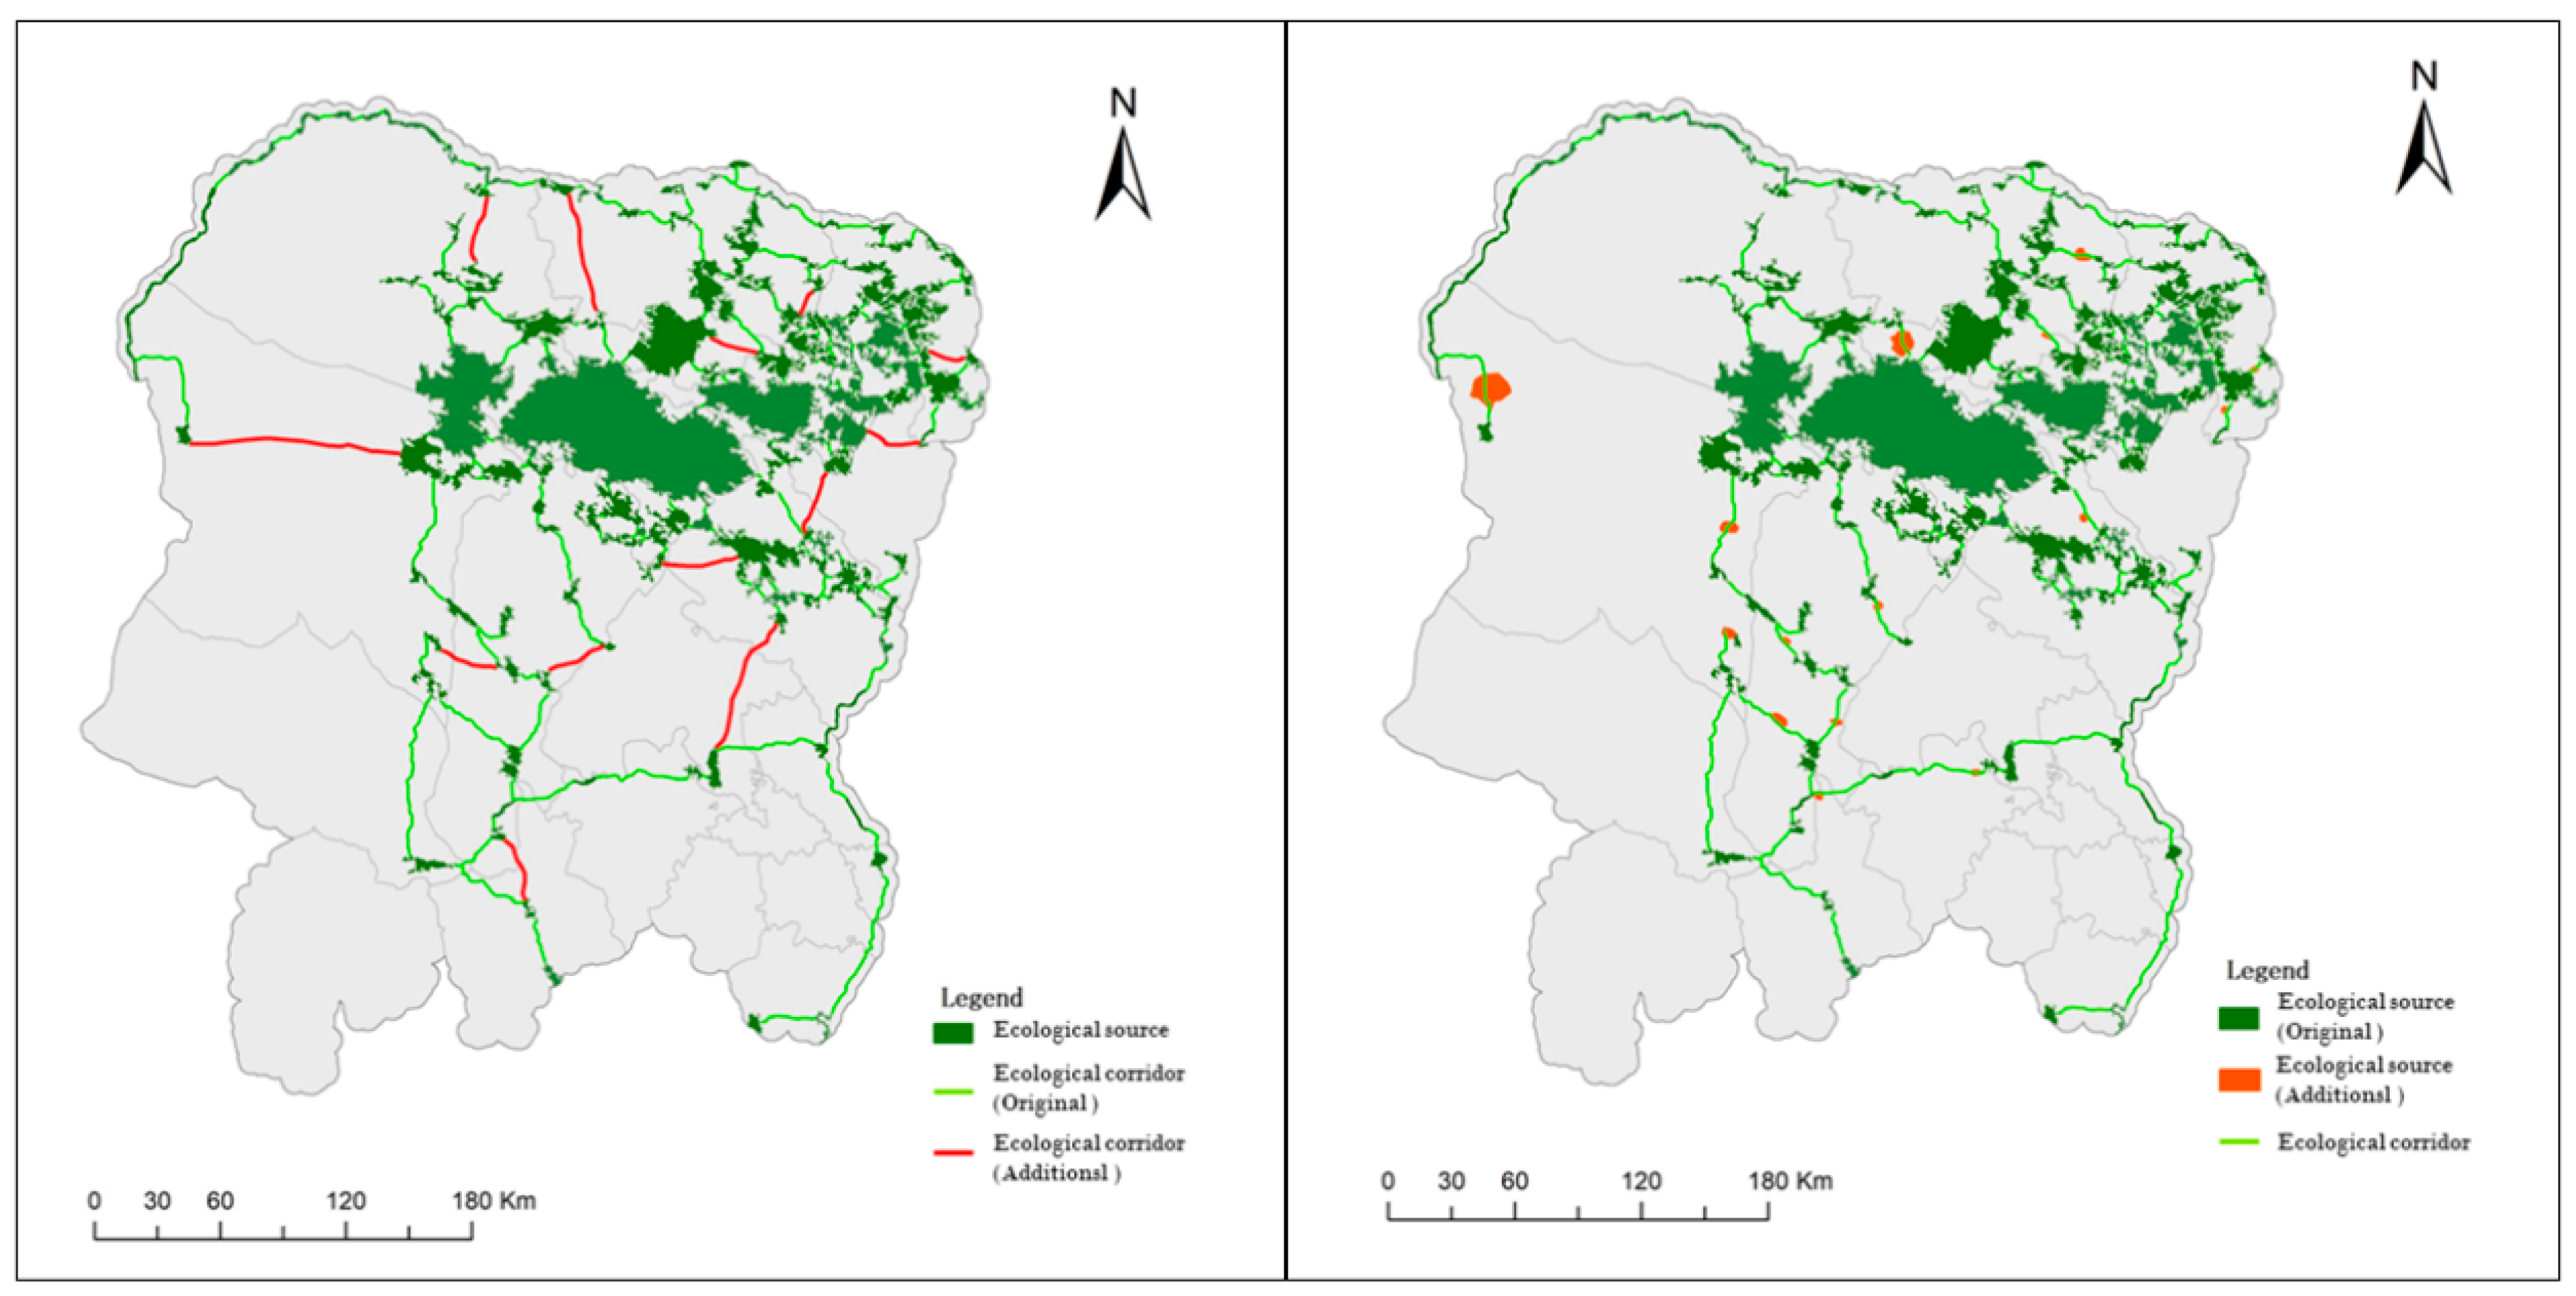
2.3.4. Optimization of F&GES

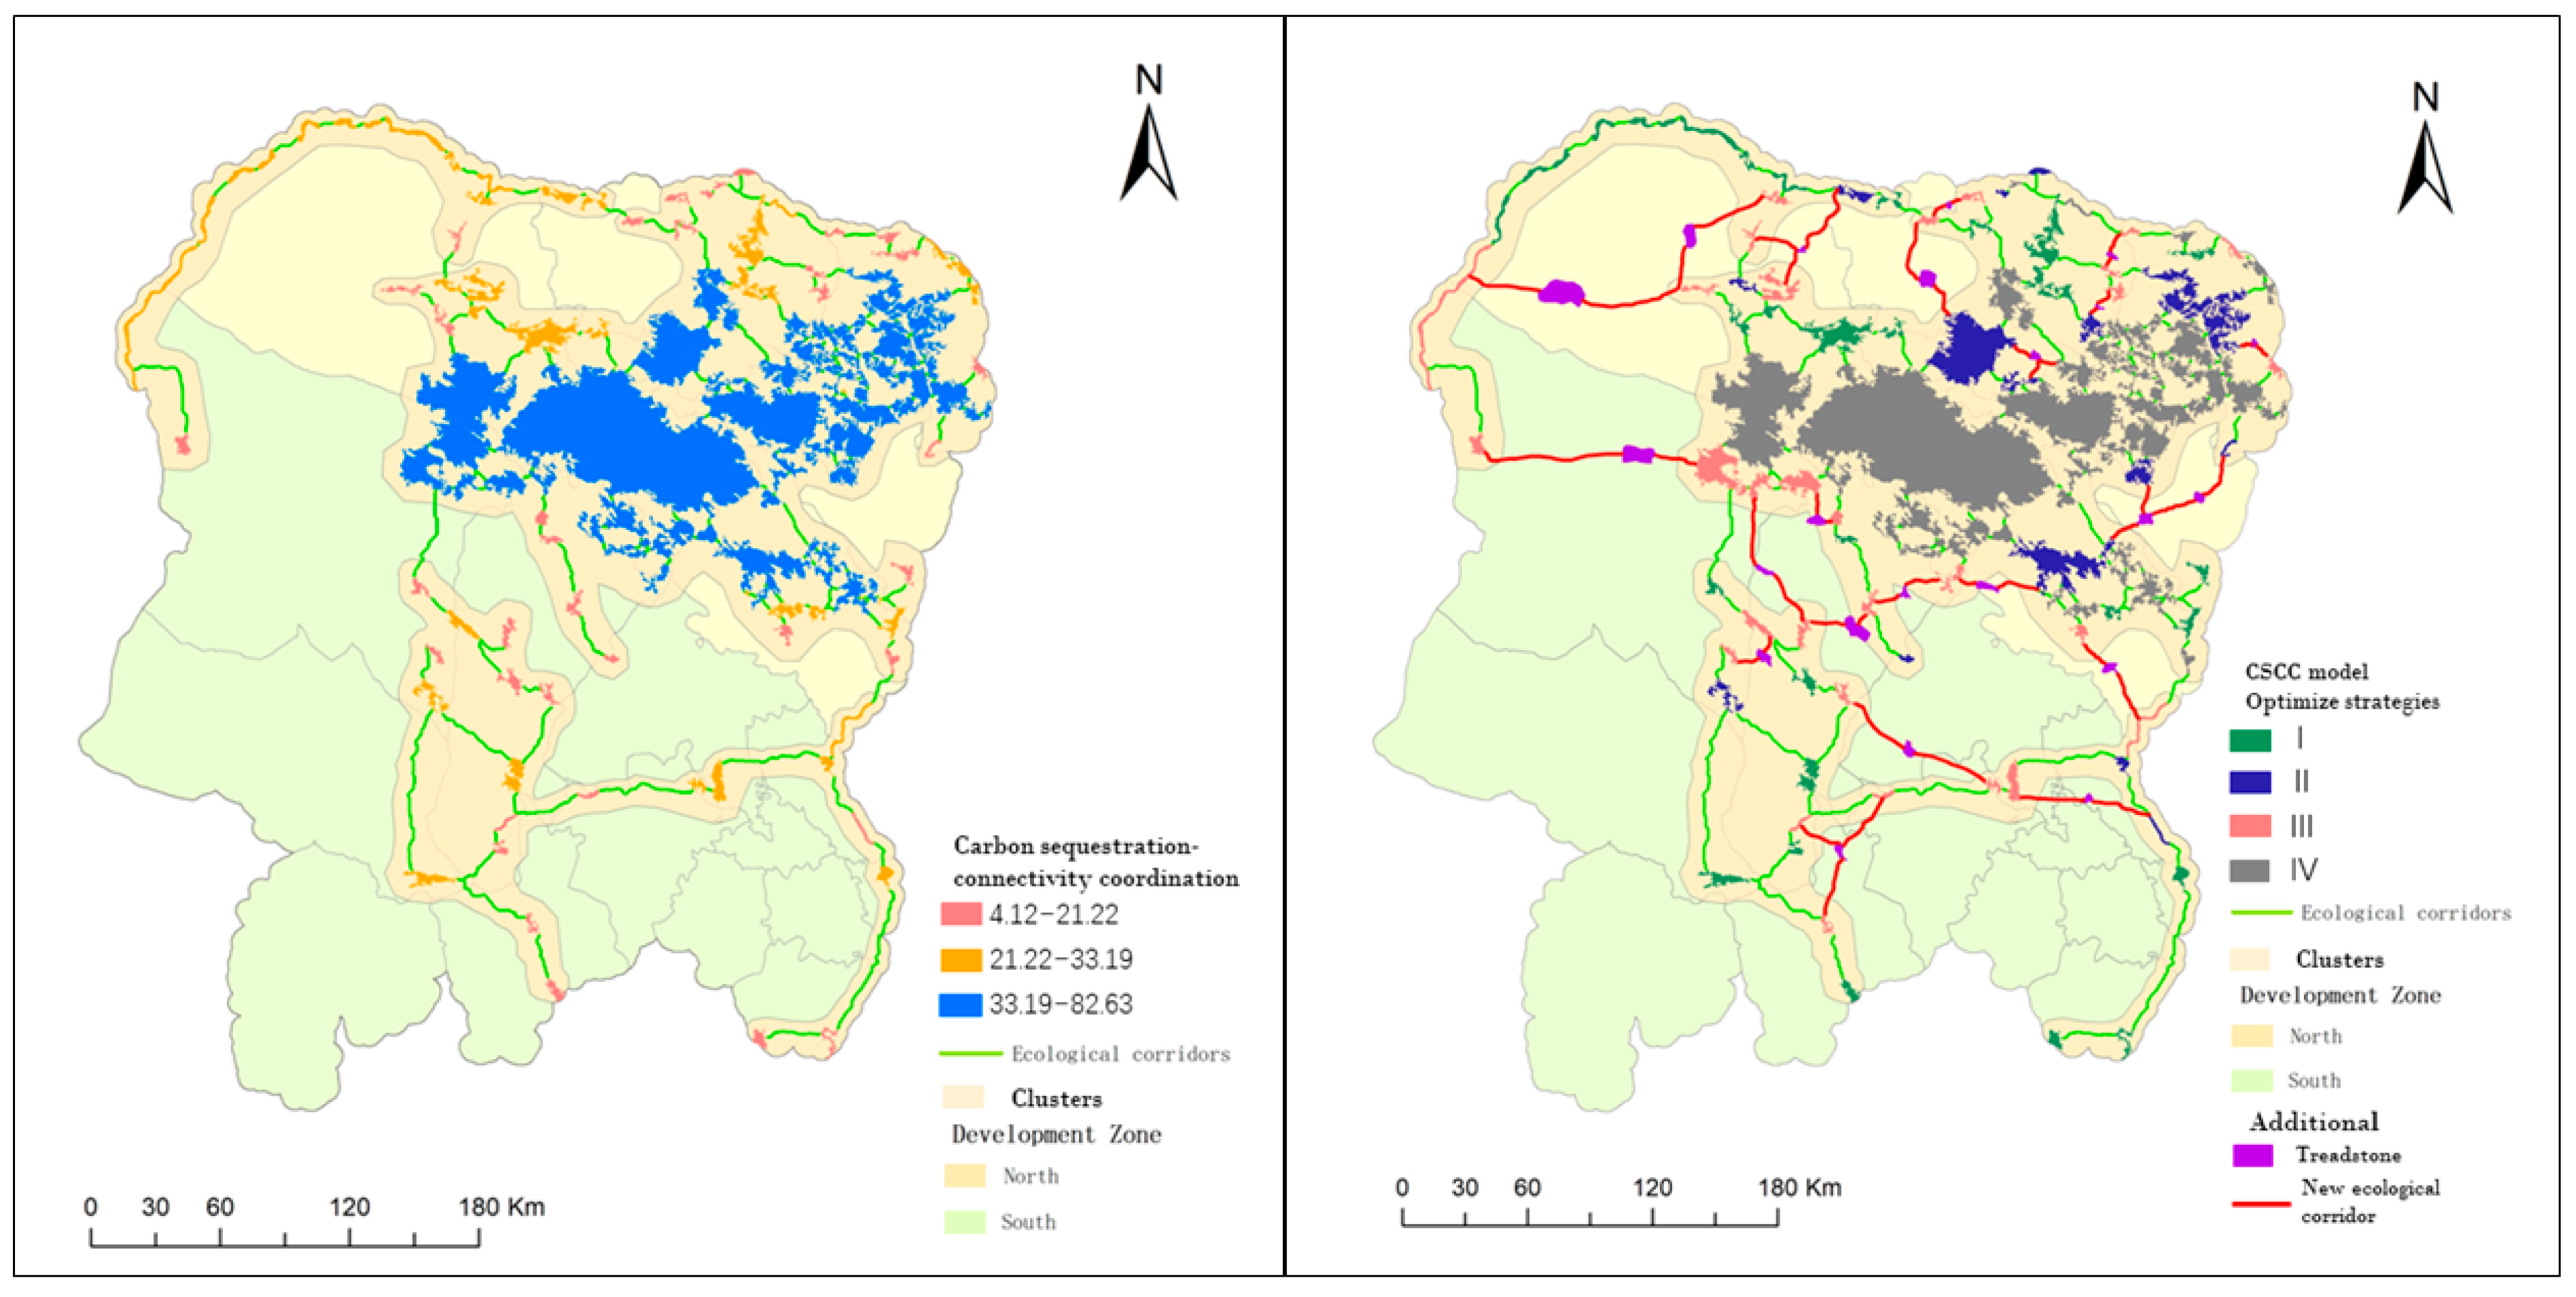
Evaluation of the Coordination Degree between Carbon Sequestration and Connectivity in F&GES

The connectivity of F&GES can serve as an indicator of the significance of ecological source areas and corridors in the connectivity process, while also playing an important role in carbon sequestration [48]. However, there may be a lack of coherence between the carbon sequestration effects and connectivity of ecological source areas and corridors within the network. Specifically, there may exist four types of ecological source areas and corridors: those with strong connectivity and carbon sequestration effects, those with strong connectivity but weak carbon sequestration effects, those with weak connectivity but strong carbon sequestration effects, and those with weak connectivity and carbon sequestration effects. The latter three situations can have a notable impact on the normal functioning of the network, as low connectivity may impede ecological processes and ecosystem services, leading to a decrease in the carbon sequestration effects of different network elements. Therefore, in this study, we introduced the concept of carbon-sequestration-connectivity coupling coordination to assess the degree of match between carbon sinks and connectivity.
The objective of this study was to enhance the carbon sequestration effects of forest and grassland ecological spaces, with NEP being used to represent carbon sequestration effects, and the normalized patch dIIC value chosen as the measure of connectivity. As the connectivity index is a dimensionless quantity, we normalized NEP and reduced dimensions using the geometric mean. The specific formula for calculating the carbon-sequestration-connectivity coupling coordination is presented below (Formulas (20) and (21)):
C = C b C b m i n C b m a x C b m i n × 100 %
X = H ^ × C ^
Within the given formula, X denotes the index of carbon-sequestration-connectivity coupling coordination, where C stands for the carbon sequestration capacity indicator, H stands for the connectivity indicator, and C b stands for the normalized NEP value.

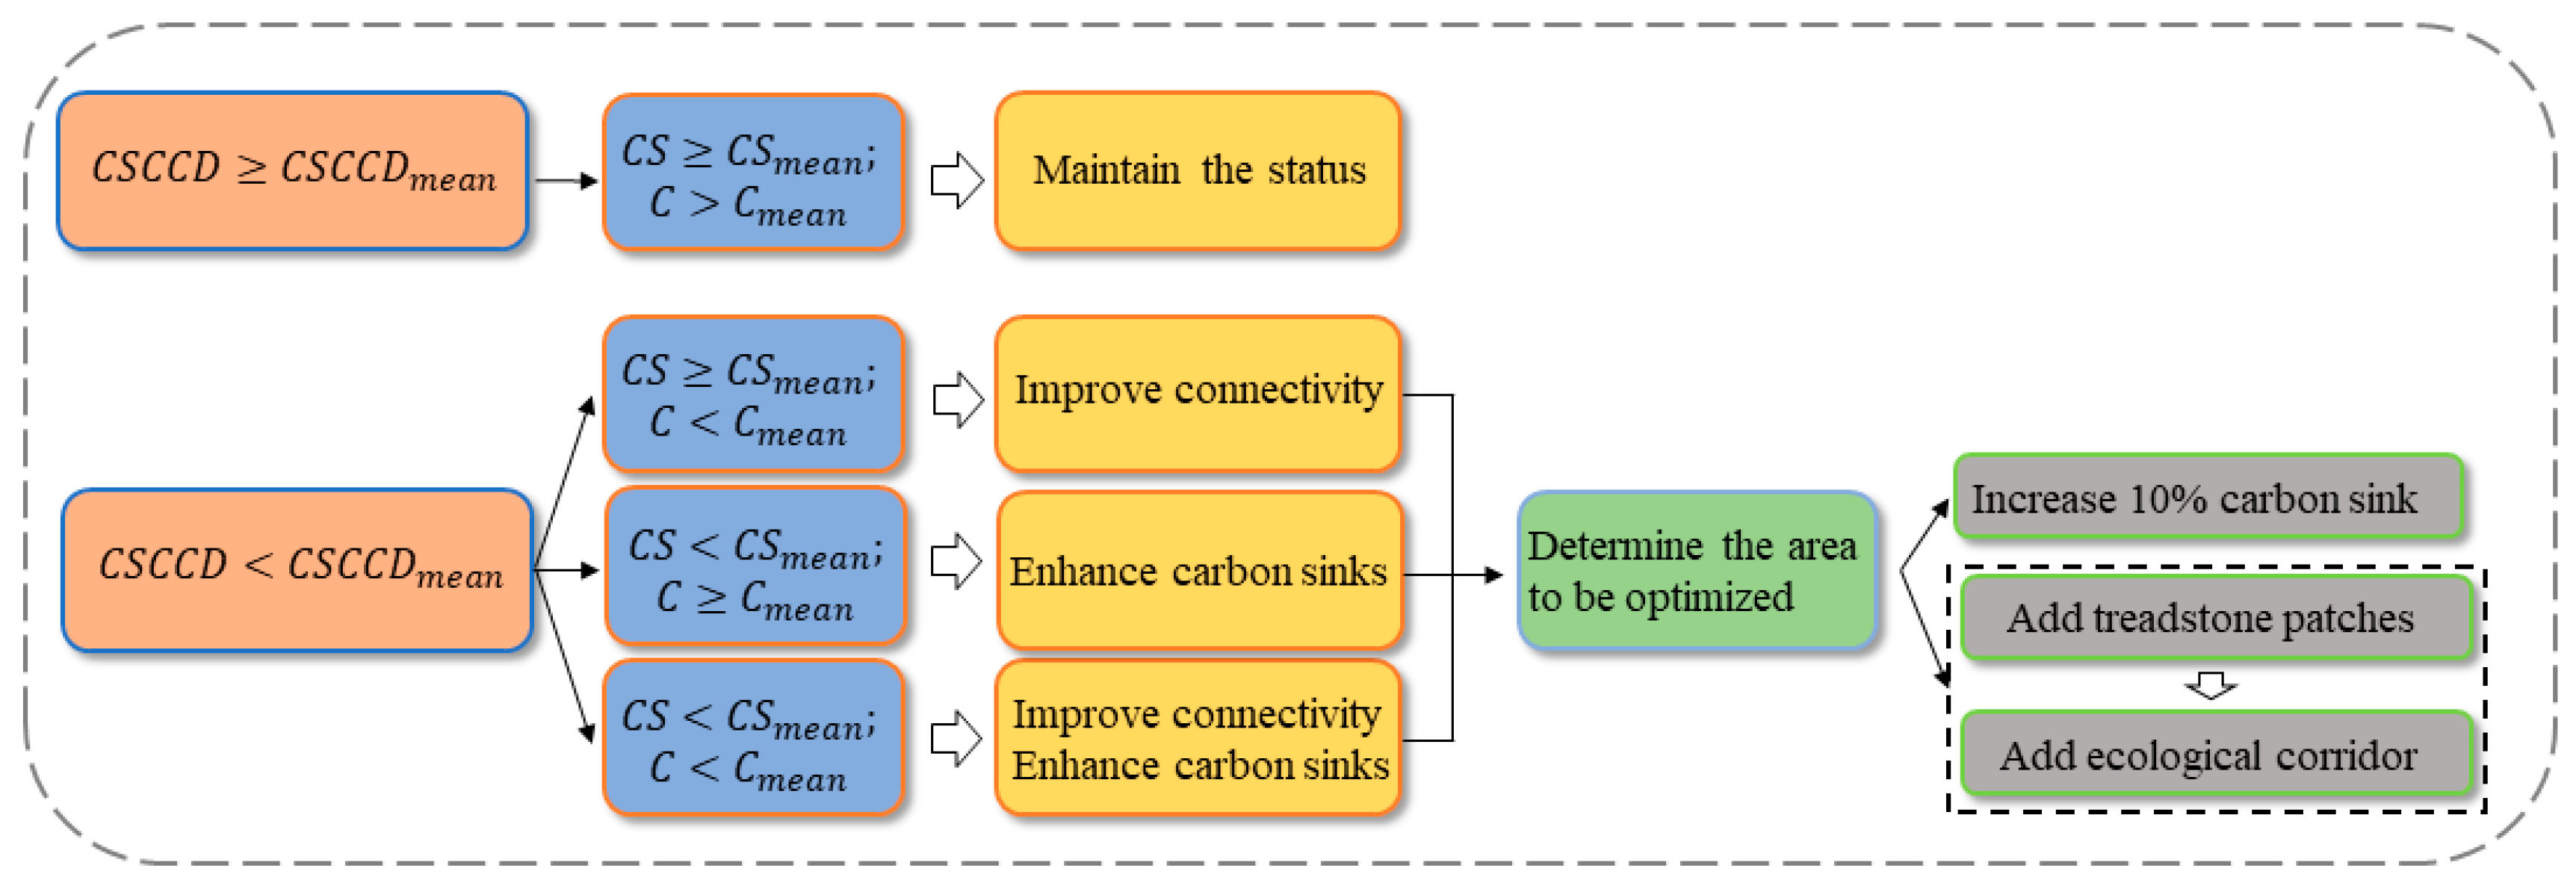
2.3.5. Optimization Model of the Coordination Degree between Carbon Sequestration and Connectivity in F&GES

In the context of F&GES, the coupling relationship between carbon sequestration and connectivity of various elements can be categorized into two types: positive coupling and negative coupling [49]. Positive coupling signifies that both the carbon sequestration capacity and landscape connectivity of each element are relatively high, while negative coupling indicates the presence of mutual constraints between the two, such as elements with excellent carbon sequestration capacity having poor connectivity, or elements with high connectivity having inadequate ecological functions, or even both. Appropriate optimization strategies must be developed for different scenarios to enhance the functionality and services of the ecosystem.
(1) Based on the calculation results of the carbon-sequestration-connectivity coupling coordination index ( C S C C D ) in Section 3.4.1, all ecological source areas within the Eyu region were evaluated, and the average value of their C S C C D index, denoted as C S C C D m e a n , as well as the mean values of connectivity ( C S m e a n ) and carbon sequestration capacity ( C m e a n ), were obtained. The ecological space of forest and grassland is characterized by its fragility and susceptibility to mining activities. In response, we devised multiple schemes aimed at restoring both the connectivity and carbon sequestration capacity of the ecological space. The mean values of connectivity and carbon sequestration capacity can be utilized as a benchmark for evaluating the quality of forest and grassland ecological patches within a given region. This benchmark can effectively reflect the overall state of the forest and grassland ecological space within the region. The specific results are shown in Figure 3.
(2) When C S C C D C S C C D m e a n , and C S C S m e a n ,   C C m e a n , it is necessary to take measures to protect and maintain the ecological functions and connectivity of these areas that possess good carbon sequestration effects and connectivity as ecological source areas and corridors.
(3) When C S C C D < C S C C D m e a n , and C S C S m e a n and C < C m e a n , measures should be taken based on the principle of zonal suitability for those areas with poor carbon sequestration effects but good connectivity. For example, for forest and grassland patches, reasonable vegetation coverage should be increased, and protective forests should be planted. For wetland patches, water quality should be improved, river channels should be restored, and biodiversity conservation should be conducted. According to previous studies on vegetation carrying capacity in the study area, the ecological functions of ecological source areas can be improved by 10%.
(4) When C S C C D < C S C C D m e a n , and C S < C S m e a n and C C m e a n , measures can be taken to improve the connectivity of areas with good carbon sequestration effects but poor connectivity by combining the degree-increasing edge addition principle and rationally deploying “stepping stones” near areas with low degree in ecological source areas to increase the degree of the source area, thereby enhancing the network connectivity. In addition, low-coverage grasslands and bare lands can be selected for restoration and can act as ecological “stepping stones”. Protective forests can be established, and water channels can be constructed near ecological corridors to ensure their connectivity.
(5) When C S C C D < C S C C D m e a n , and C S < C S m e a n and C < C m e a n , the optimization strategies mentioned above can be employed for areas with both poor carbon sequestration effects and connectivity, including increasing vegetation coverage, planting protective forests, improving water quality, restoring grasslands and bare lands, constructing protective forests, and other measures to enhance their carbon sequestration capacity and connectivity.

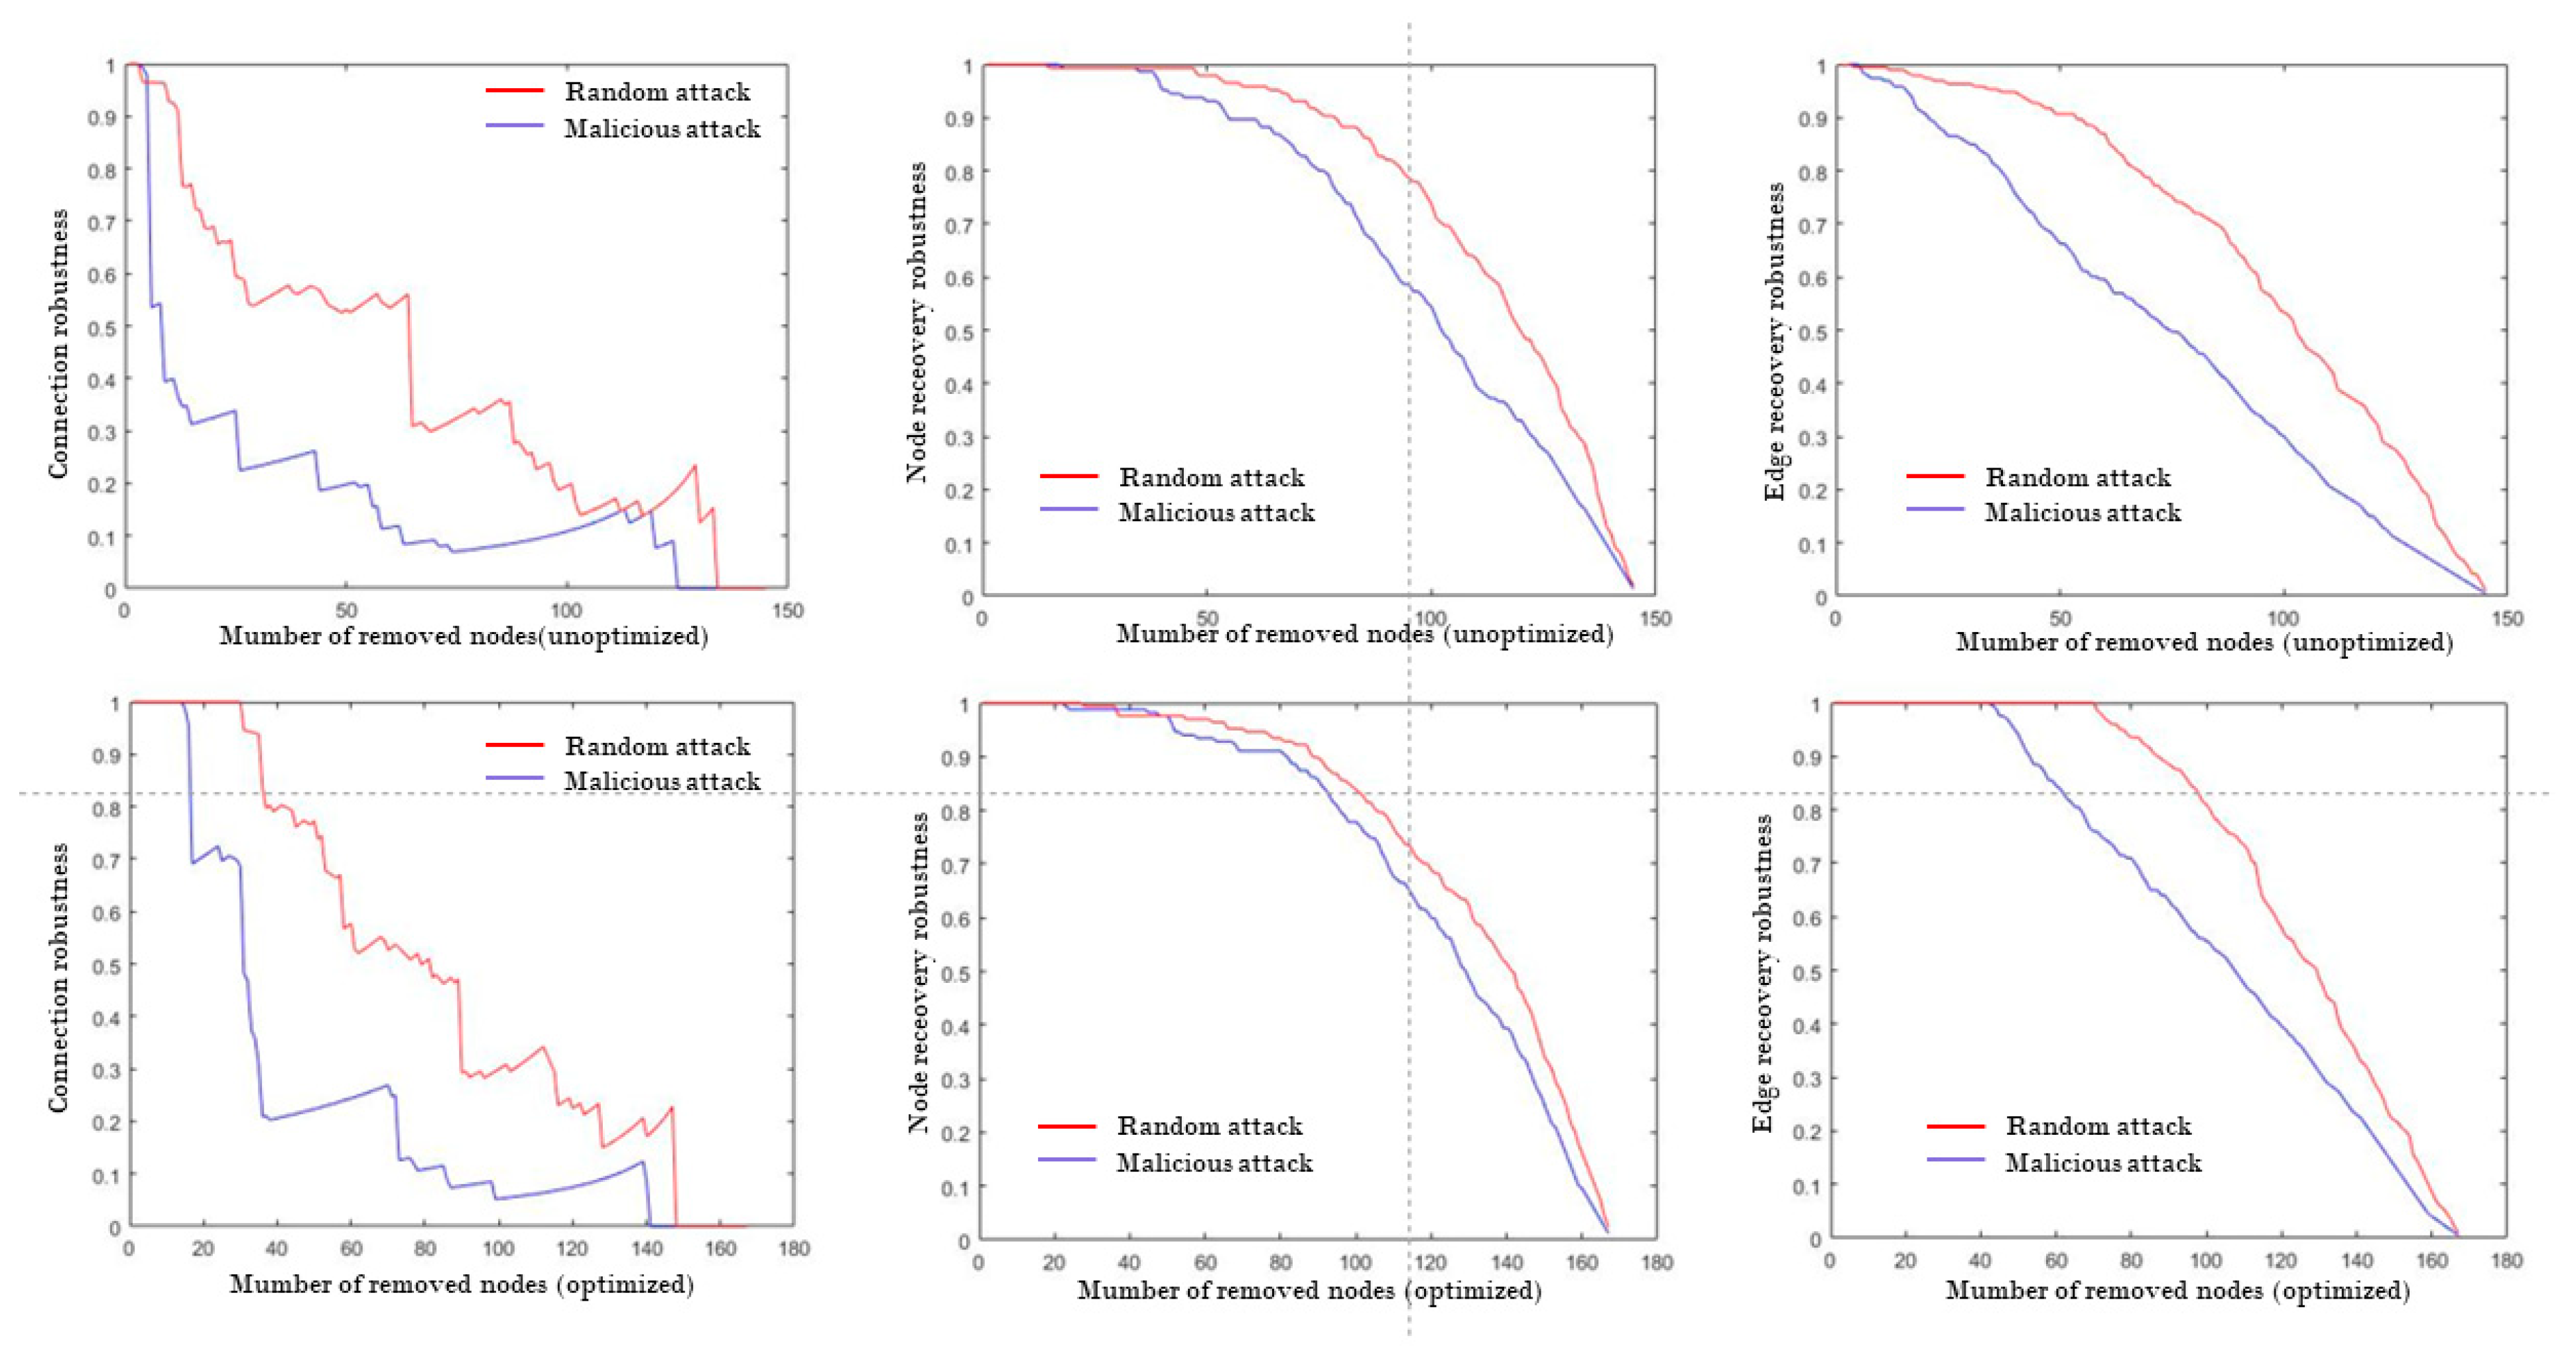
2.3.6. Robustness Analysis of F&GES Structure

The concept of robustness in complex networks refers to their ability to maintain their intended functionality or properties despite being subjected to external interference. Connectivity robustness and recovery robustness are two commonly used measures to assess a network’s resistance and recovery capabilities [4]. Connectivity robustness describes the network’s ability to remain connected even when some of its components, such as nodes or edges, are damaged. Recovery robustness refers to the network’s ability to restore its functionality after certain elements have been damaged, utilizing recovery strategies. To evaluate the efficacy of potential alternative solutions for improving connectivity, we conducted a robustness test. Specifically, we performed simulation experiments that disrupted F&GES using both random and malicious attacks. Random attacks were designed to mimic the degradation of the landscape spatial structure due to factors such as desertification or climate change, while malicious attacks simulated the destructive effects of human activities, such as mining, on F&GES. Malicious attacks posed a greater threat to the forest and grassland ecological network structure than random attacks. In each type of attack, a node or an edge was removed at every step. In malicious attacks, nodes were sorted based on their degree centrality, and the node with the highest degree centrality was removed at each step. In contrast, in random attacks, a node or an edge was removed randomly. The specific Formulas (22)–(24) used in the simulations are presented below:
R = C N N r
D = 1 N r N d N
E = 1 M r M e M
In the present study, connectivity robustness is defined as the ability of a network to maintain its connectivity under damage, which is denoted as R . Node recovery robustness is defined as the network’s ability to recover its functionality after certain nodes are damaged using a specific recovery strategy, denoted as D . Edge recovery robustness refers to the network’s ability to restore its functionality after certain edges are damaged, using a particular recovery strategy, denoted as E . Here, N represents the number of nodes in the network before the attack, N r represents the number of nodes that are removed from the network, C represents the number of nodes in the largest connected component of the network after the attack, and N d represents the number of nodes that are recovered using a specific recovery strategy. M represents the number of edges in the network before the attack, M r represents the number of edges that are removed from the network, and M e represents the number of edges that are recovered using a specific recovery strategy.

3. Results

3.1. F&GES in Eyu

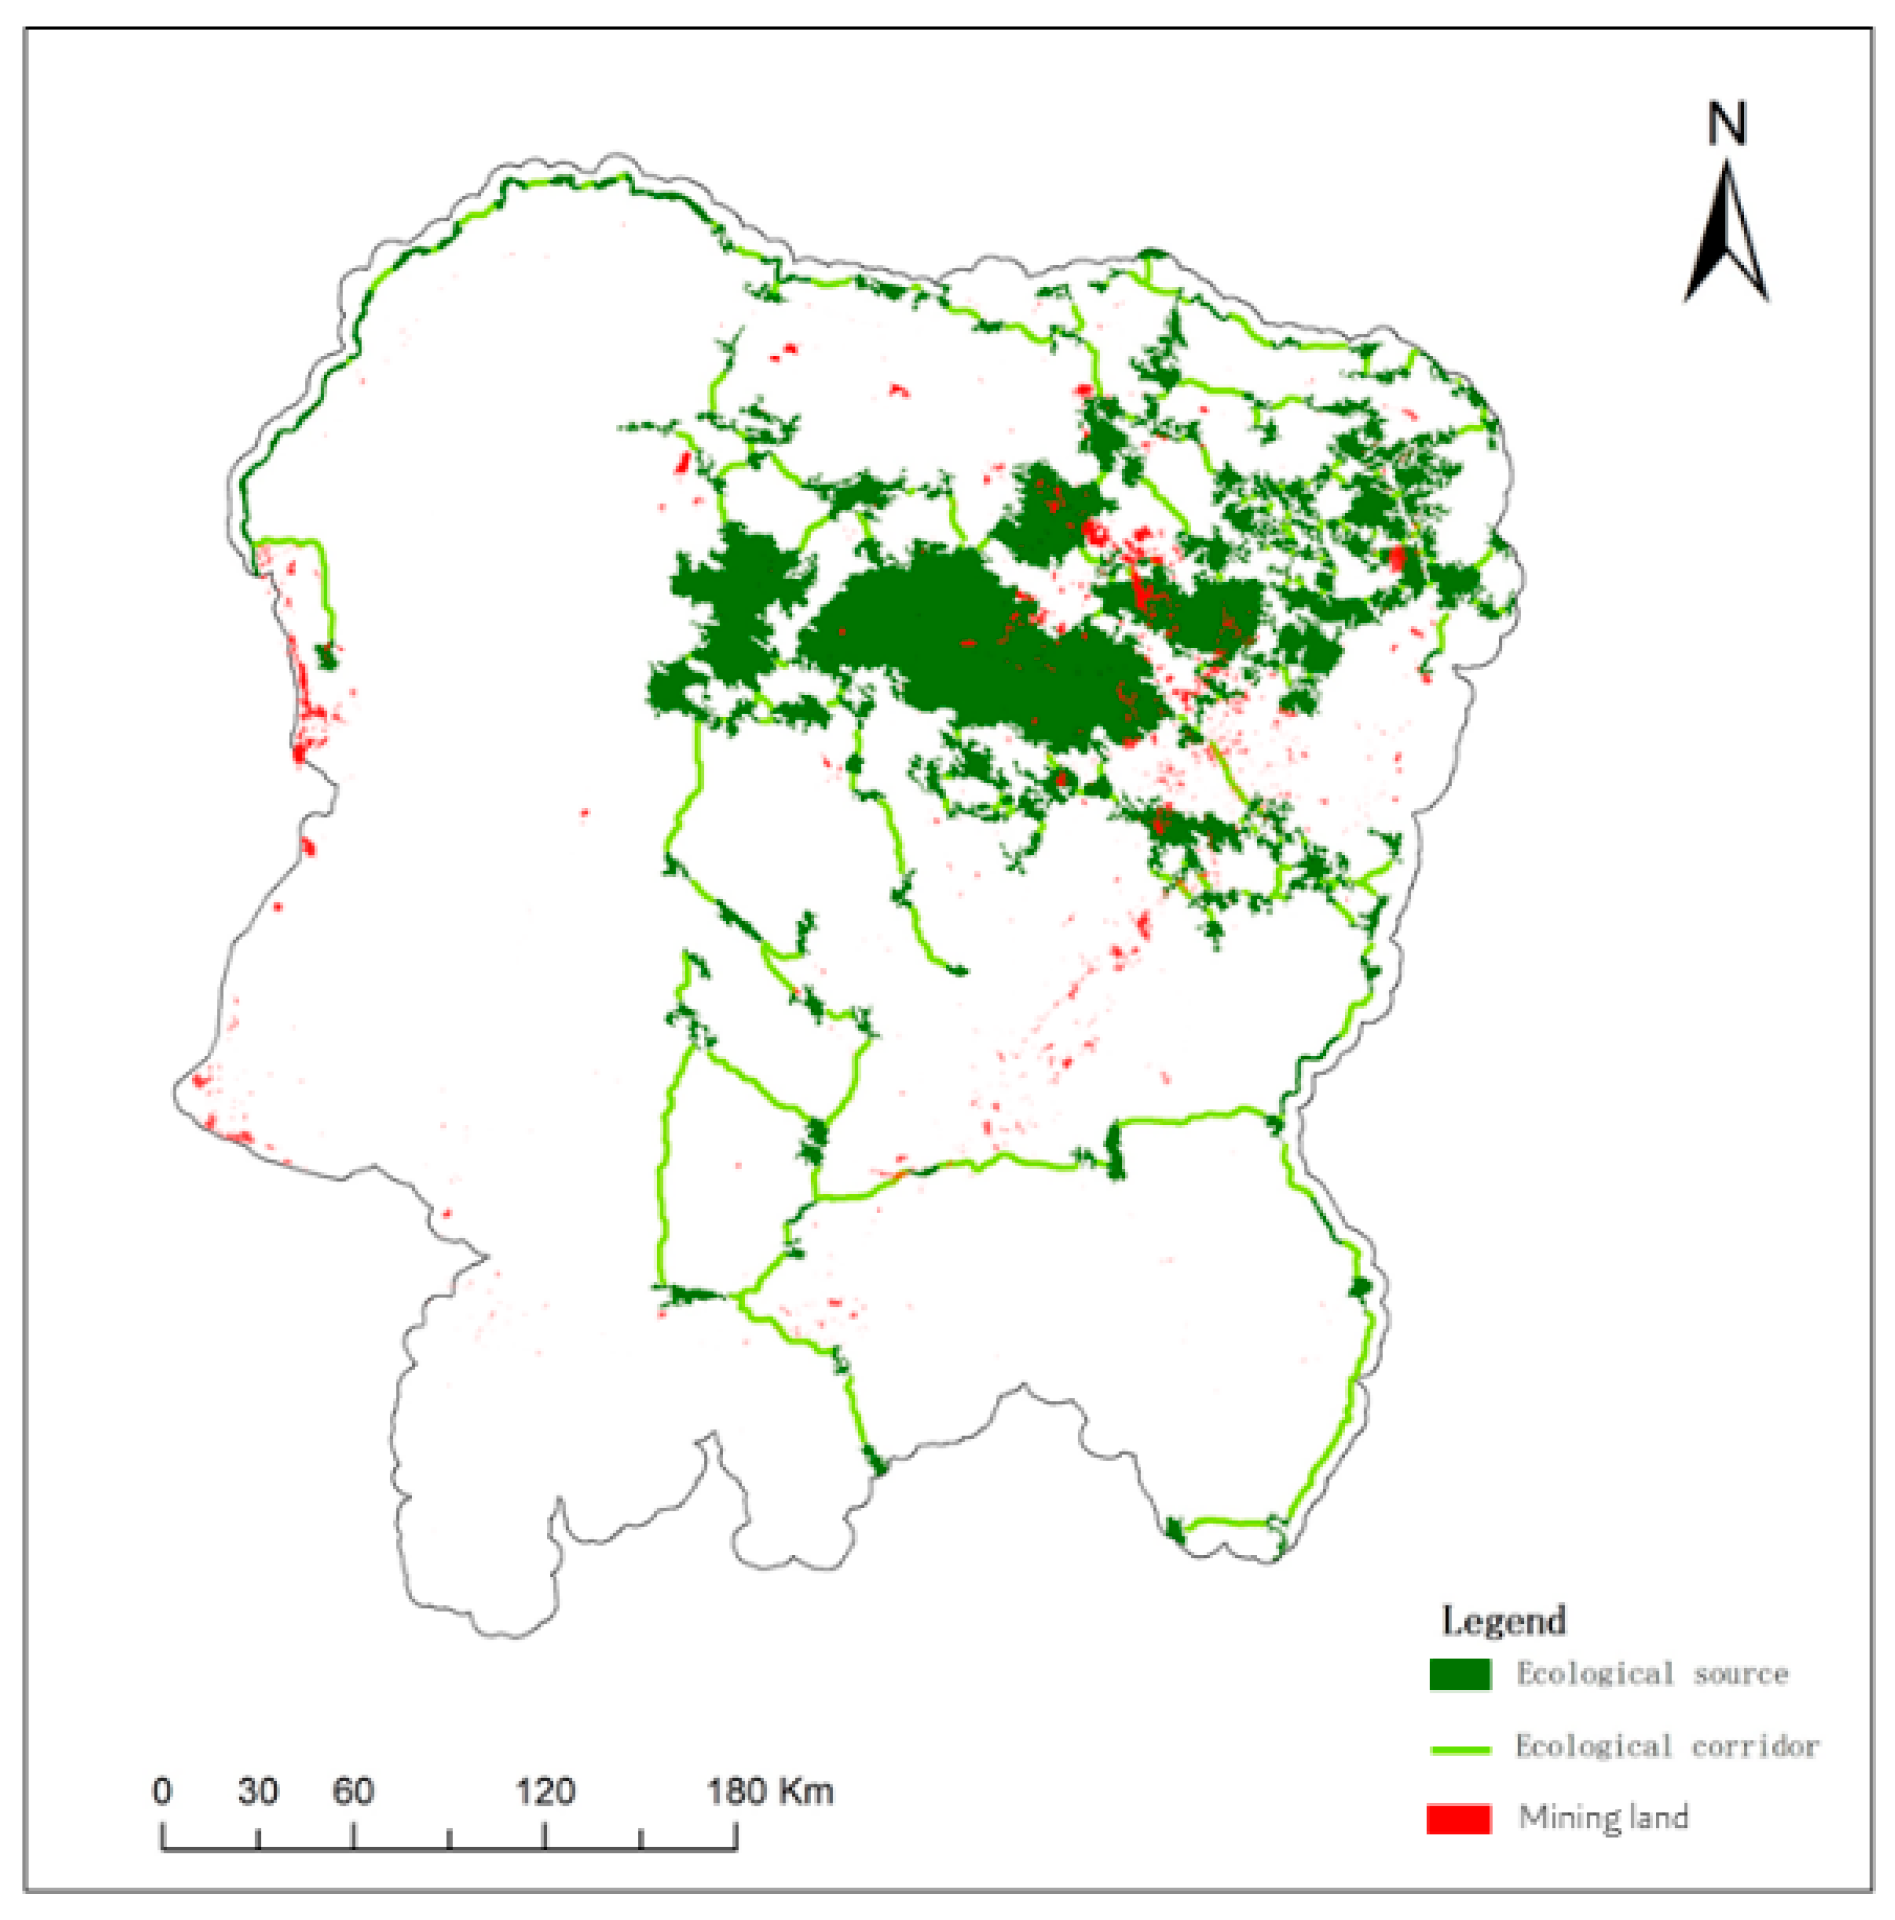
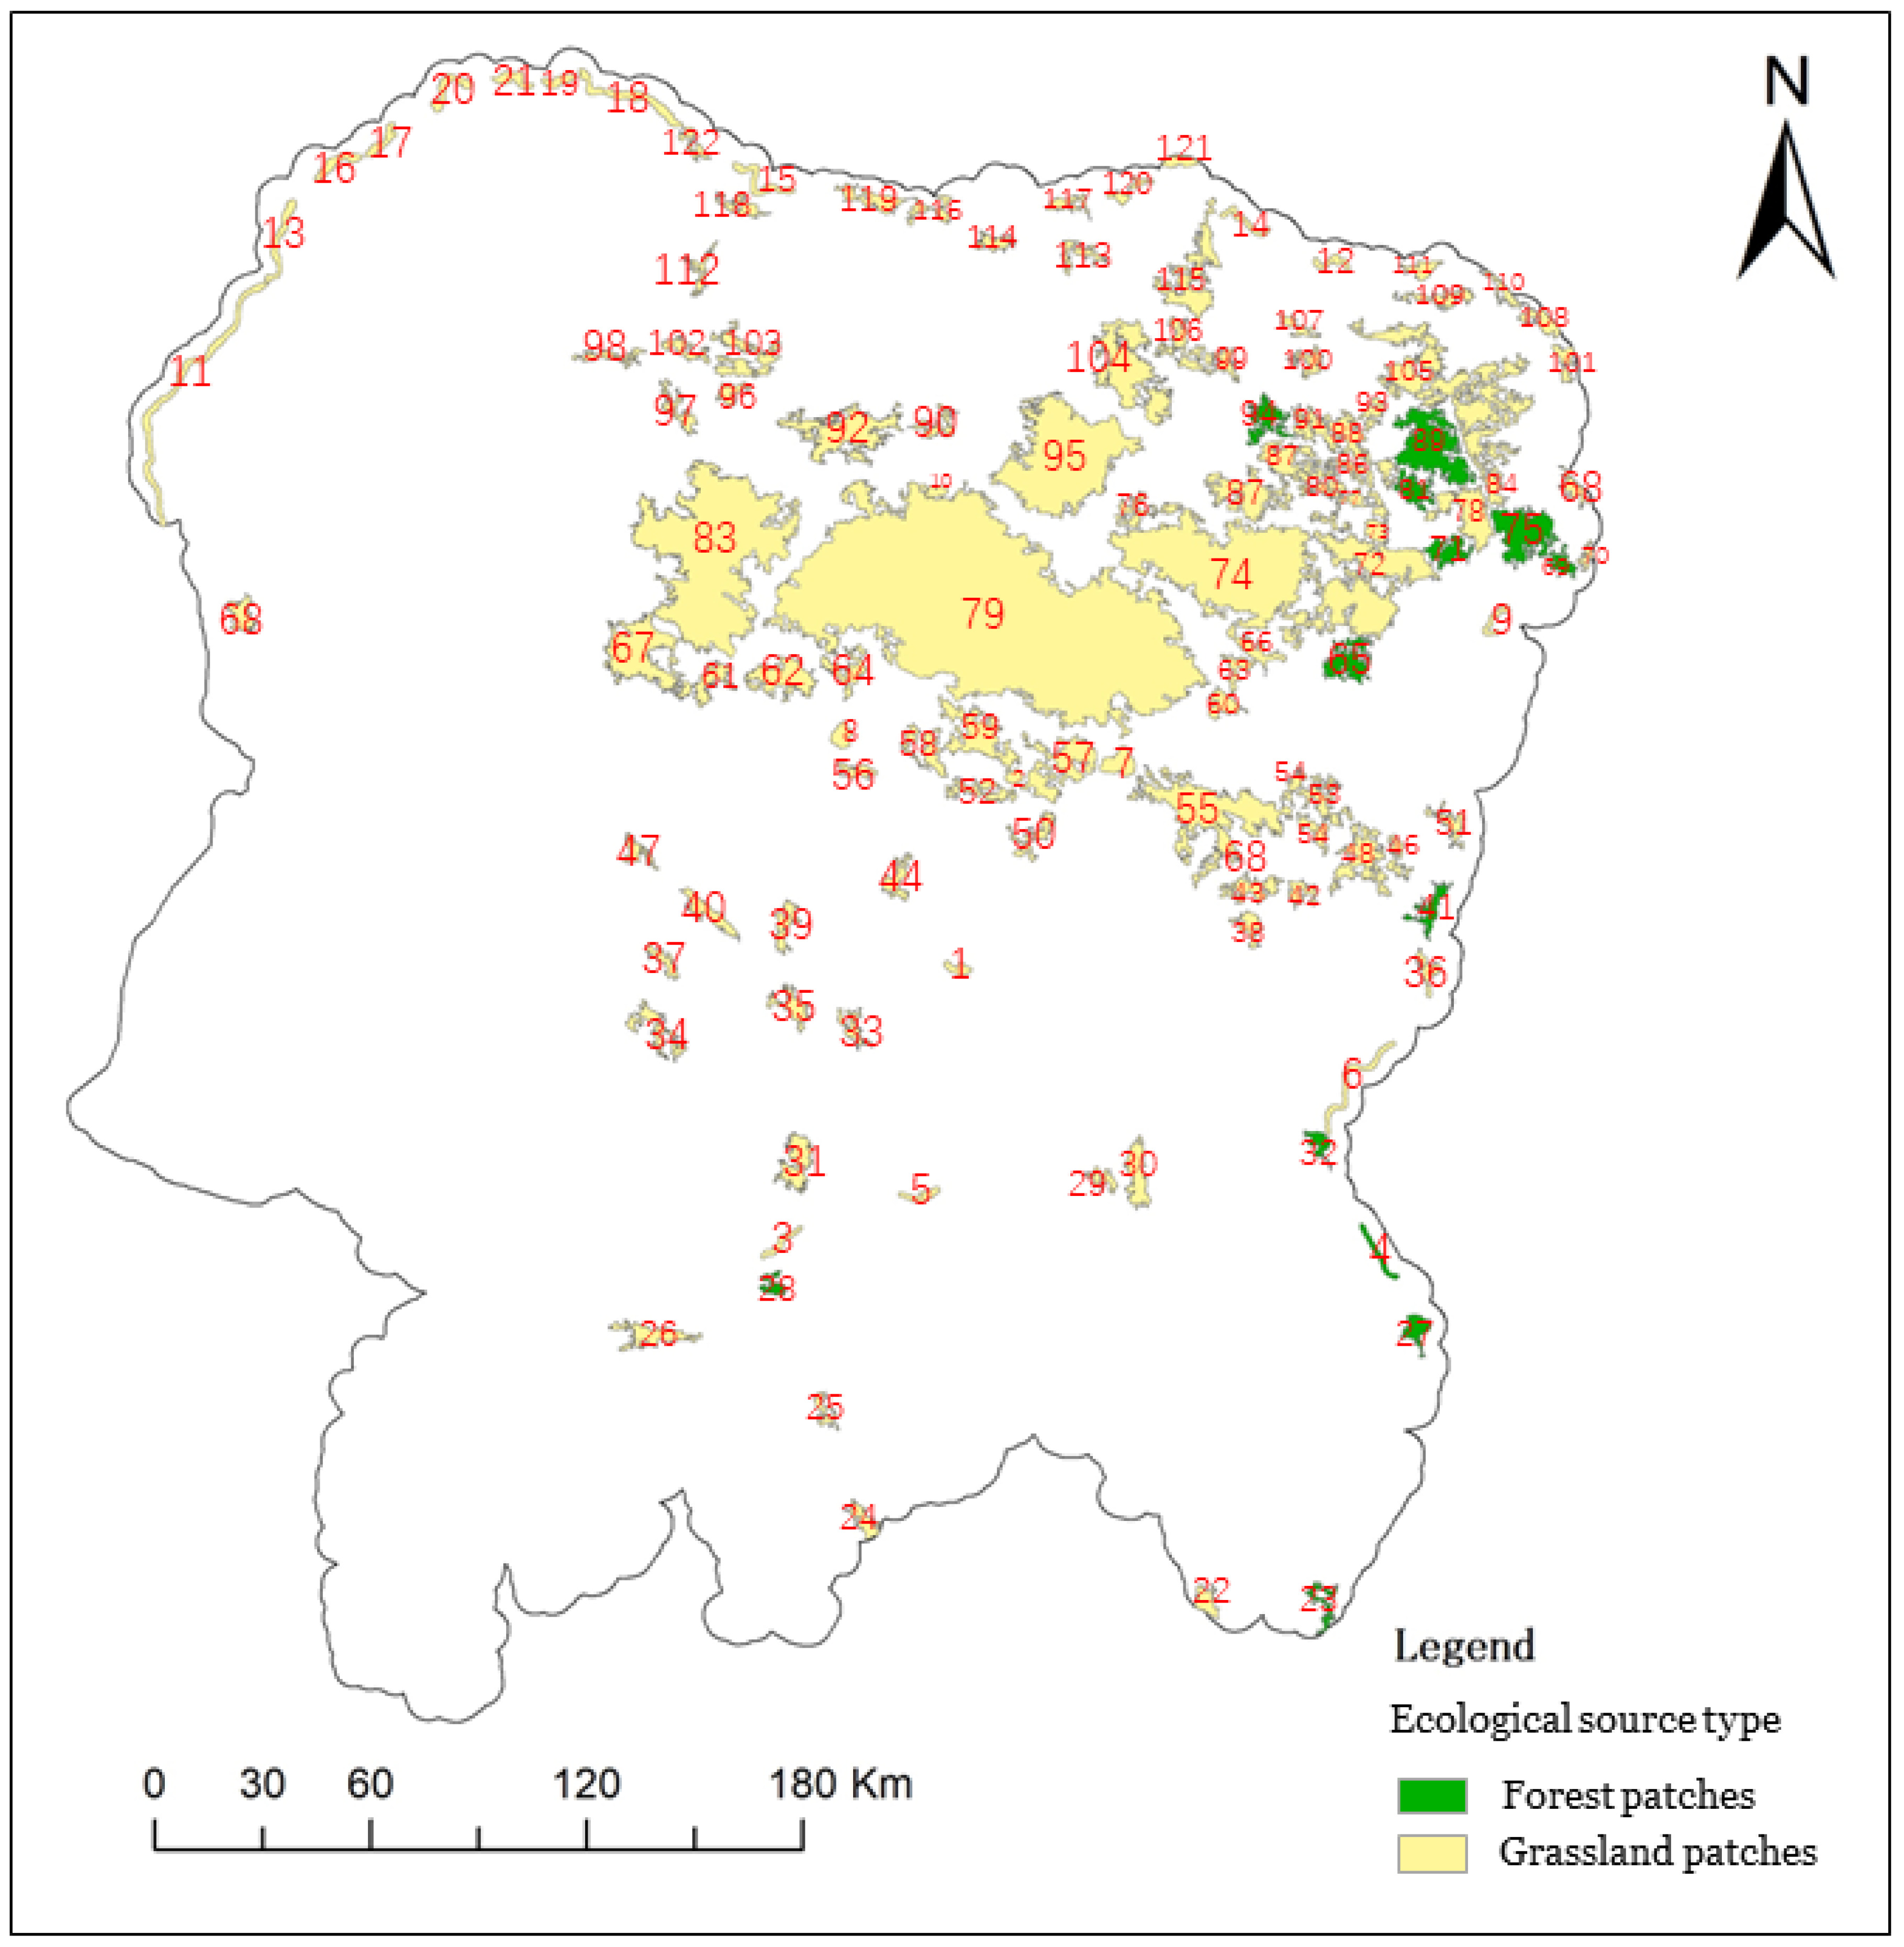
3.1.1. Structure and Spatial Extent of F&GES

The findings of this study demonstrate that the RSEI index exhibits a spatial distribution with high values (Figure 4), ranging from 0 to 1. Regions with high habitat quality are distributed in the northeastern, eastern, and southeastern parts of Eyu, encompassing areas in Hangjin Banner, Darhan Muminggan Joint Banner, Junggar Banner, Dongsheng District, Shenmu City, and Jia County. The results reveal that ecological patches of a certain size possess a certain level of resilience to external disturbances and damage. In this study, regions with a habitat quality greater than 0.6 were designated as high-quality ecological patches, and an area threshold of 5 square kilometers was established based on prior related research. These adjacent high-quality ecological patches were merged, leading to the identification of 123 ecological patches. These patches are predominantly concentrated in the northeastern part of Eyu, including regions in Yijinhuoluo Banner, Dongsheng District, Junggar Banner, and Shenmu City, with ecological patch sizes decreasing from north to south. The proximity of the Yellow River to the northern and eastern parts of Eyu has resulted in the presence of ecological patches with higher habitat quality and stronger ecological functions in these areas. Conversely, the Kubuqi and Mu Us deserts, which are located in the northwest and west of Eyu, suffer from sparse precipitation, low vegetation coverage, and a considerable distance from wetlands, leading to a relatively sparse distribution of ecological patches in these regions, comprising areas in Hangjin Banner, Etoke Banner, Etoke Front Banner, and Dingbian County.
The results of the habitat risk assessment in this study are presented in Figure 5(left). The maximum and minimum habitat risk values in Eyu County were 82.58 and 0, respectively, with an average value of 22.1. The northwestern and central regions of Eyu County were identified as having relatively higher habitat risk, with the highest value located in the northeastern part of Hangjin Banner and the lowest in the northwestern part of Dalad Banner. Forests were predominantly distributed in the northeastern part of Eyu County, characterized by higher vegetation coverage and generally lower habitat risk values. The habitat risk values demonstrated a declining trend from east to west, with higher values observed in proximity to the desert areas, which acted as significant barriers to ecological flow. The eastern regions of Eyu County exhibited relatively higher habitat risk values, attributed to extensive urban and mining development, high levels of human activity, and frequent ecological disturbances, leading to significant impediments to ecological flow.
Utilizing data on land cover, elevation, slope, vegetation coverage, water network density, road network density, and habitat risk factors, the ecological resistance factors for Eyu County were constructed (see Appendix B). Each ecological resistance factor was then classified and weighted to generate a composite ecological resistance surface, as depicted in Figure 5(right). The ecological resistance values in Eyu County ranged from 1.26 to 17.65, with the highest values concentrated in the desert areas of the northwestern and central regions. Notably, high ecological resistance values showed a clustering distribution pattern in the Kubuqi and Mu Us deserts. Regions characterized by urban development and coal mining activities exhibited relatively high ecological resistance values, which significantly impeded ecological flow.
The present study utilized the MCR model for minimum cumulative resistance surface extraction, revealing high-value areas of cumulative resistance concentrated in the northern and western parts of Eyu (as shown in Figure 6). These areas encompass regions adjacent to the Kubuqi and Mu Us deserts, as well as mining areas, with the highest cumulative resistance value of 386,535 located in the northern part of Darhan Muminggan Joint Banner. The regions exhibit sparse vegetation and low surface water content, resulting in significant ecological barriers and a high risk of ecological degradation. Employing the least-cost path method for ecological corridor extraction, a total of 193 corridors were identified, with the longest corridor spanning 79.86 km and situated in the eastern part of Etoke Front Banner. The northeastern region of Eyu displays a dense distribution of ecological patches, accompanied by a high density of ecological corridors and short distances between them, which promotes the flow of ecological processes and facilitates connectivity between ecological source areas. Conversely, the western and southern parts of Eyu have relatively few ecological source areas, and long distances between them result in a low density of ecological corridors and longer corridors. Ecological corridors in the western part of Eyu play a crucial role in resisting the eastward movement of the Mu Us desert, thereby maintaining connectivity between ecological patches.

3.1.2. Topological Relationships of F&GES

In this study, F&GES structure was abstracted as a complex network using Gephi 0.10 software. A total of 123 nodes and 193 edges were identified, with an average degree of 2.662, indicating that each node was connected to an average of 2.662 nodes. The degree centrality of the node distribution followed a power-law distribution, with most nodes having small degrees and low-degree centrality values, while a few hub nodes had large degrees and high-degree centrality values. The network exhibited strong scale-free characteristics, with a small number of hub nodes, making it highly resistant to random attacks. However, if hub nodes were maliciously attacked, the network structure would be vulnerable to disruption. The network’s average clustering coefficient was 0.176, indicating that nodes in the network were not interconnected. Regions with high clustering coefficients were mainly located in the northeastern part of Eyu, including Zunghar Banner, Darhan Muminggan Joint Banner, and Hangjin Banner. Based on the clustering relationship of the network, the ForceAtlas algorithm was used for grouping and clustering, resulting in two zones and three groups (Figure 7(left)). Group C was located in the southeastern part of Eyu, with fewer and more distant ecological patches, while groups A and B were located in the north of Eyu, with a greater number of, and more densely distributed, ecological patches. The majority of the node betweenness centrality values in the network ranged from 0 to 30, with only nodes 113, 104, 95, 74, 83, and 79 having betweenness centrality values greater than 30. The locations and numbering of the patches are shown in Figure A1 in Appendix A. These nodes were primarily located in the northern part of Eyu, including the southwest of Zunghar Banner, the south of Darhan Muminggan Joint Banner, Dongsheng District, Yijinhuoluo Banner, and the southern part of Hangjin Banner. The network only contained nodes with a coreness of 2 or 3, indicating clear hierarchical characteristics, with an obvious division into two layers. Nodes with a coreness of 3 were located in the central layer of the network, primarily located in the northeastern part of Eyu, including the northeast of Zunghar Banner and the northeast of Shenmu City.

3.1.3. Connectivity

In the Eyu region, the dIIC and dPC values of ecological patches were generally low, as depicted in Figure 8. The majority of ecological source areas exhibited connectivity values ranging between 0 and 10, and the distribution trends of dIIC and dPC values were similar. Notably, ecological patch 79 had the highest connectivity values, with dIIC and dPC values of 83.43 and 79.58, respectively. This patch, situated in proximity to Yijinhuoluo Banner, was the largest ecological source area in F&GES and played a pivotal role as a hub. Clustering zones B and C displayed higher connectivity values of ecological source areas, while clustering zone A exhibited lower values. Consequently, F&GES in Eyu was partitioned into north and south, with higher connectivity in the north. The north and south were interconnected by only two ecological corridors. Evaluation of the connectivity importance of the corridors using the gravity model revealed that the connectivity of internal corridors in clustering zone C was relatively low, whereas the connectivity of ecological corridors on the edge was higher. Most of these edge corridors connected ecological source areas in external regions, which was crucial for maintaining ecological processes both inside and outside the clustering zones. The connectivity of corridors between different clustering zones was high, and these corridors served as the “bridges” linking different clustering zones.

3.2. Carbon Sequestration Effect of F&GES in Eyu County

The areas with high-value carbon sequestration service per unit area in Eyu were mainly concentrated in the northern, central, and southeastern regions, encompassing the vicinity of the Yellow River in the northern part of the study area, the eastern periphery of the Mu Us desert, and the hilly terrain in the southern region of Eyu. These regions displayed a significantly improved habitat quality, were in closer proximity to the river, featured better water conditions, and possessed a higher vegetation coverage, thereby resulting in a greater carbon sequestration service value per unit area. Conversely, regions with a lower carbon sequestration service per unit area were primarily distributed in the northwest edge of the Kubuqi desert and the Mu Us desert. These regions were characterized by a considerable amount of sandy and barren land, low vegetation coverage, scant precipitation, and a remote location from the river, leading to a diminished carbon sequestration service in these areas. The total annual carbon sequestration amount of various ecological source areas was determined, as illustrated in Figure 9. The larger the ecological source area, the higher the carbon sequestration amount. Given that clustering zone C boasted the largest number and area of ecological source areas, it exhibited the highest carbon sequestration amount. Conversely, clustering zone A harbored the minimum number and smallest area of ecological source areas, thereby resulting in the lowest carbon sequestration amount. Significantly, ecological source area 79 recorded the highest carbon sequestration amount, reaching 521,577.89 tons, thereby contributing the most to the overall carbon sequestration service of forest and grassland ecological spaces in Eyu.

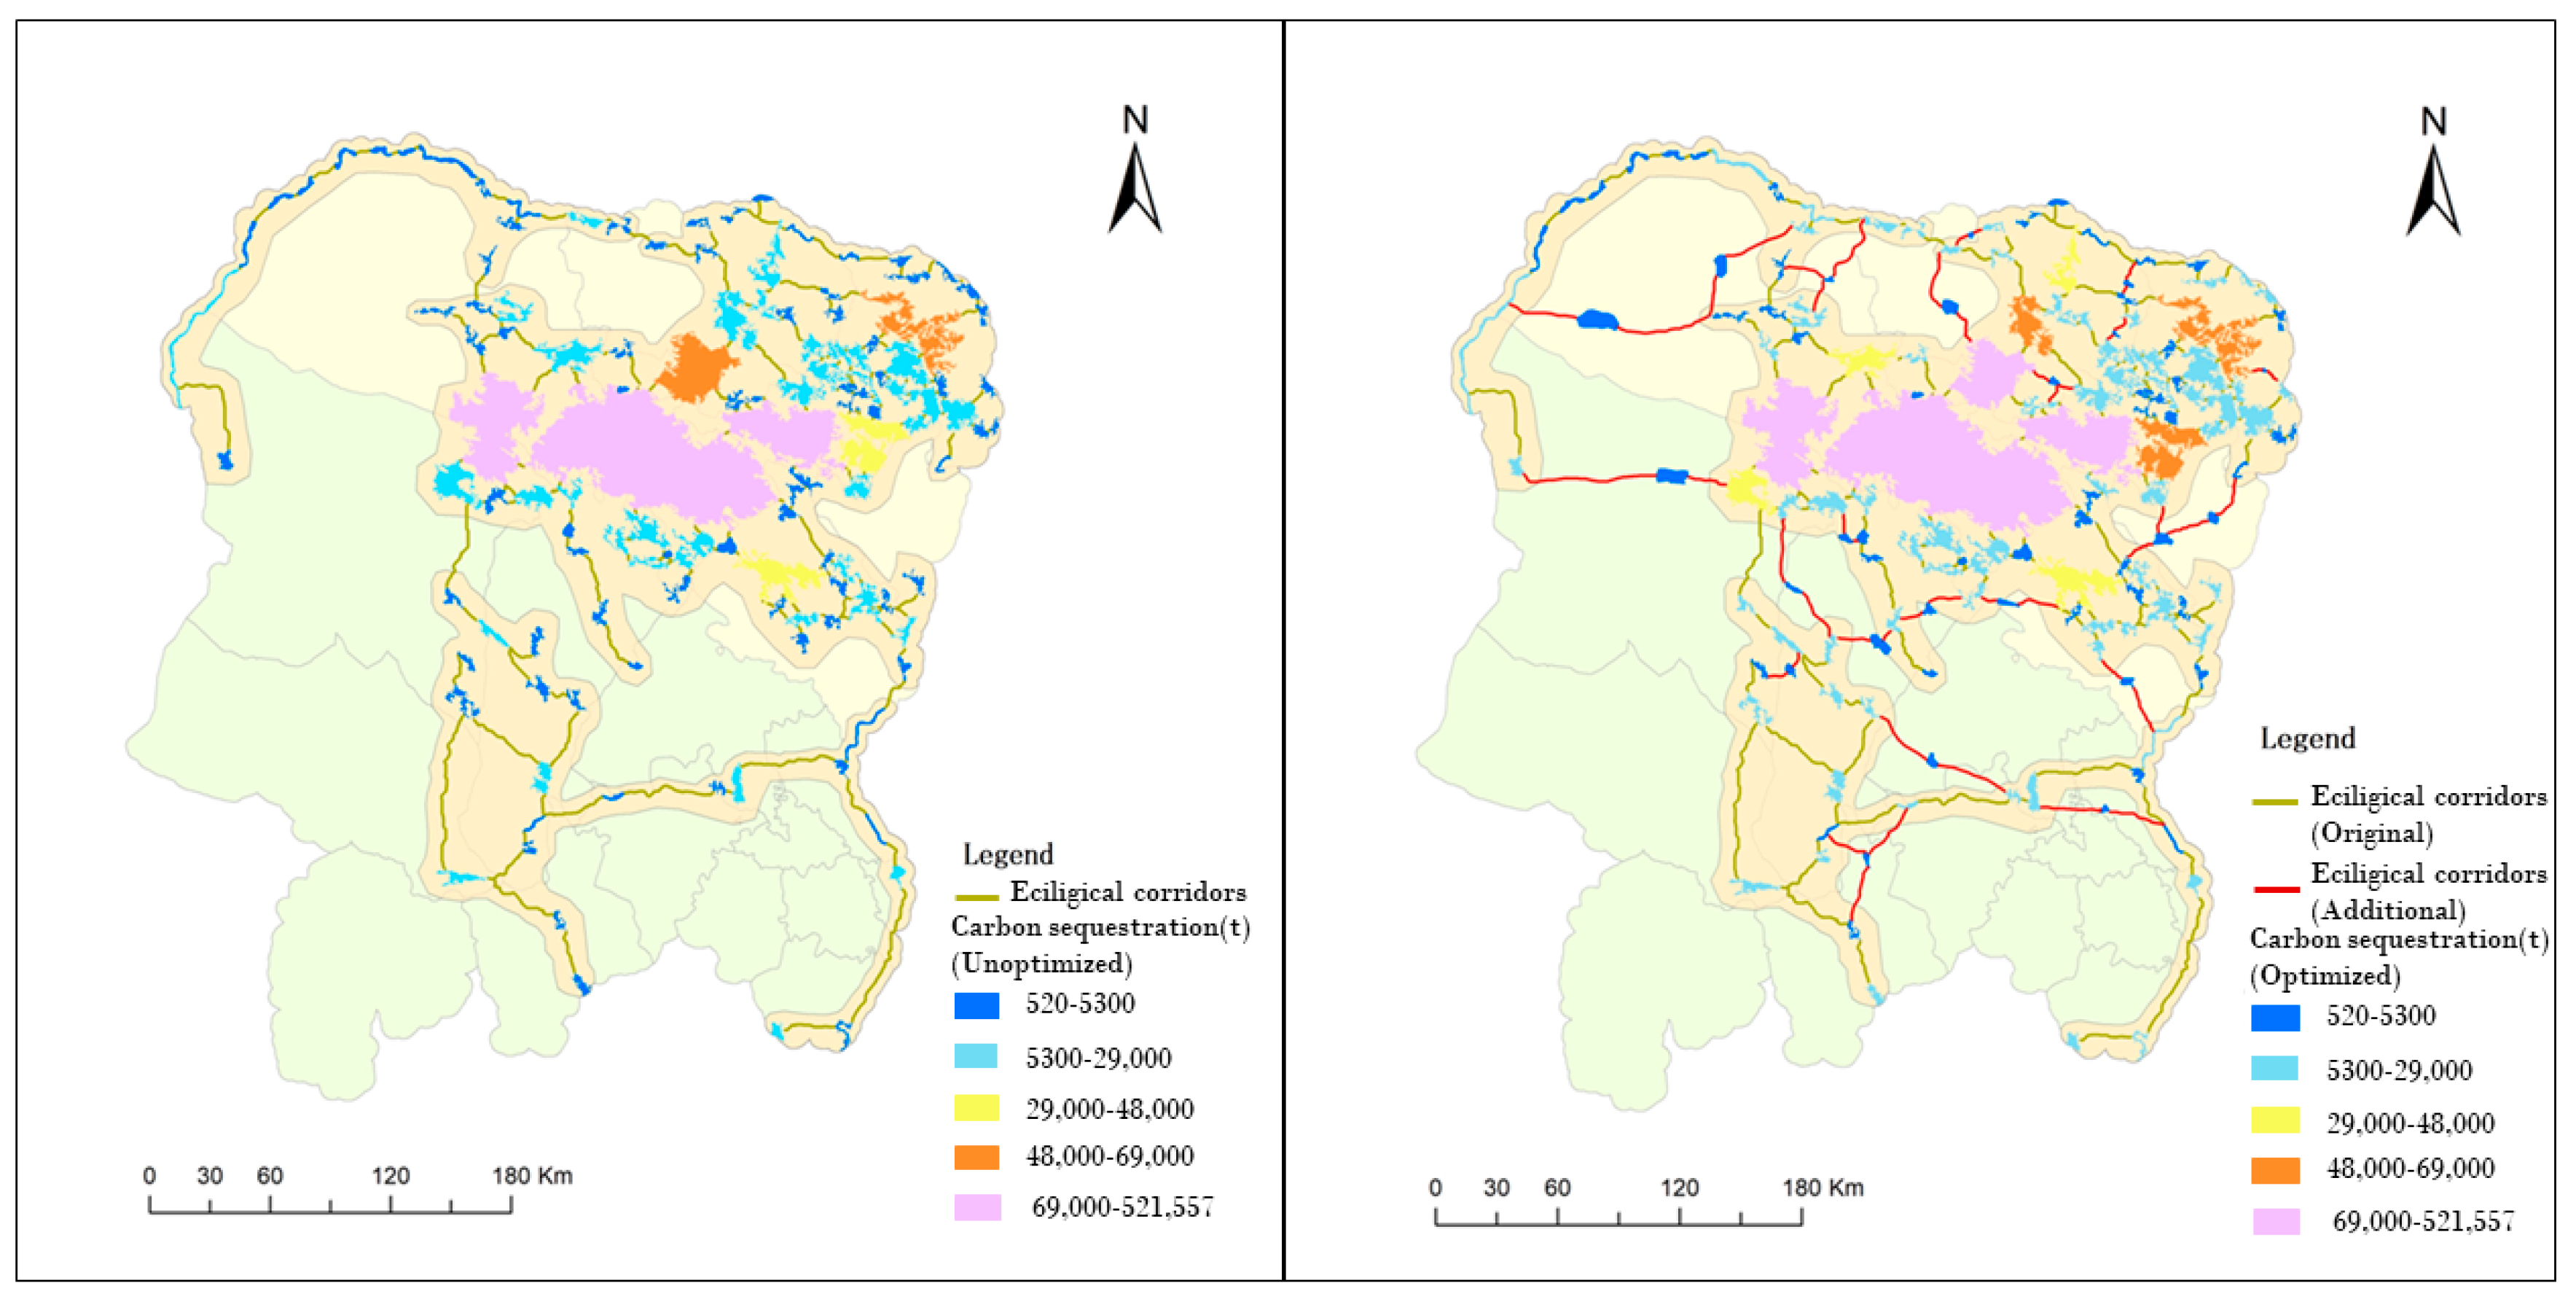
3.3. Optimization of F&GES Structure in Eyu County

The findings of the coupling coordination index calculation between carbon sequestration and the connectivity of ecological source areas are presented in Figure 10. The coordination levels of source areas in zones A and B were generally low, while those in zone C were relatively high. It is noteworthy that all ecological source areas with coordination levels ranging from 33.19 to 82.63 were located in clustering zone C, primarily concentrated in the northeast region of Eyu, including Yijinhuoluo Qi and Zhungeer Qi. These regions generally exhibited better ecological environment quality and higher ecological source area connectivity and facilitated the circulation of ecological flows. Conversely, source areas with low coordination levels were predominantly distributed in the northwest and southeast regions of Eyu, encompassing Etoke Qi, Hangjin Qi, Wushen Qi, Jingbian County, and Qingjian County. Most of these areas were situated on the desert periphery and characterized by poor ecological environment quality and low landscape connectivity, which impeded the flow of ecological processes. Based on the coordination index results, different strategies were employed to optimize F&GES, where (1) represented maintaining the current state, (2) represented enhancing functions, (3) represented improving connectivity, and (4) represented enhancing ecological functions and connectivity. In the northern F&GES, source areas with high coordination levels, such as source areas 74, 83, and 79, only necessitated current state protection. Although source areas with high connectivity, such as source areas 104, 105, 99, and 59, had low carbon sequestration capacity, they could be optimized and improved through strategy (2). Source areas 62, 58, 56, 67, and 66 were located in the transition zone between the north and south F&GES structures, linking the north and south F&GES structures and possessing high structural importance, and could be optimized and improved through strategy (4). With regard to the optimization of ecological corridors, priority was given to increasing patches in highly important ecological corridors. Building ecological patches in ecological lands near ecological nodes or inefficient industrial lands was feasible and reduced construction costs. This study added a total of 26 forest ecological patches, with a combined area of 641.57 square kilometers.

3.4. Evaluation of Optimization Effects

To assess the effectiveness of model optimization, this study employed the following methods: firstly, a comparison was made between the optimization effects and implementation feasibility of the CSCCD model and those of other optimization models; secondly, an evaluation of F&GES structural resistance to destruction was conducted; finally, the carbon sequestration effects after implementing optimization measures were compared. For the first evaluation objective, the optimization effects and implementation feasibility of the CSCCD model were compared with those of other optimization models. The findings revealed that the CSCCD model had superior optimization effects and implementation feasibility in optimizing F&GES. For the second evaluation objective, an evaluation of F&GES resistance to destruction was conducted. The results showed that, in the optimized F&GES, indicators such as forest and grass coverage area, ecological corridor connectivity, and ecological patch area were enhanced, indicating that the optimized F&GES had stronger resistance to destruction. For the third evaluation objective, a comparison was made between the carbon sequestration effects before and after implementing optimization measures. The results demonstrated that, after adopting optimization strategies, the carbon sequestration effects in the optimized forest and grassland ecological space network were significantly improved, indicating that the optimized F&GES had better carbon fixation effects. In summary, this study employed multiple evaluation methods to assess the CSCCD model and demonstrated its superiority in optimizing F&GES.

3.4.1. Comparison with Other Models

Figure 11 provides a comparative analysis of the optimization effects of two other models. Specifically, Figure 11(left) adopts an optimization strategy of incorporating “stepping stones” at ecological nodes, which represent points with the highest accumulated resistance along the corridor. However, due to the poor ecological environment quality in the vicinity of these nodes, the feasibility of adding “stepping stones” is limited. While this intervention can improve the carbon sequestration capacity of the landscape spatial structure, it does not enhance its connectivity. Figure 11(right) employs an optimization strategy of increasing the ecological corridor degree. This approach is only capable of adding ecological corridors between adjacent patches and is unable to establish corridors between ecological source areas. For instance, patches 32 and 4 obstruct the ecological corridor between patch 38 and 27, making it impossible to add ecological corridors. As a result, the added corridors merely enhance the connectivity of F&GES structure, but have a limited effect on enhancing carbon sequestration. In summary, the CSCCD model exhibits higher optimization effects and implementation feasibility compared to the other two models, and can simultaneously enhance both the carbon sequestration capacity and connectivity of F&GES structure. Additionally, the CSCCD model can optimize across ecological source areas, thereby making it more widely applicable.

3.4.2. Resilience Assessment

Figure 12 presents the outcomes of the anti-destruction evaluation of F&GES structure before and after optimization. The optimized ecological network exhibits a significantly enhanced connectivity robustness and recovery robustness. In this study, as the number of destroyed nodes increases, both the connectivity robustness and recovery robustness before and after optimization display a decreasing trend when attacking a node. The decreasing trend of connectivity robustness approximates a concave curve, with the connectivity robustness of F&GES structure gradually declining as the number of attacked ecological nodes increases. The decreasing curves for node and edge recovery robustness approximate a convex curve, with an increase in the rate of decrease in node and edge recovery robustness as the number of attacked ecological nodes increases. The connectivity robustness and recovery robustness after optimization exhibit lower decreasing rates than before optimization. Overall, this study verified the effectiveness of the CSCCD model in optimizing the forest and grassland ecological spatial network through anti-destruction assessment. The optimized F&GES has a stronger anti-destruction capability, indicating that the CSCCD model can improve the sustainability of F&GES and safeguard the stability and healthy development of the ecosystem.
The initial connectivity robustness was 1, and as the number of attacked nodes increased, the network’s robustness significantly decreased. Specifically, when the 8th node was maliciously attacked and the 64th node was randomly attacked, the network’s robustness dropped to 0.50, representing a 50% decrease. At this point, the network’s connectivity level was severely disrupted, and the destruction of some nodes resulted in the network’s inability to maintain normal material circulation and energy flow. The connectivity robustness threshold of the network was 0.5, indicating the lower limit of network robustness. Through optimization using the CSCCD model, the network’s robustness reached the threshold when the 30th node was maliciously attacked or the 78th node was randomly attacked. The optimized F&GES showed a significantly enhanced robustness. In summary, the optimization of the CSCCD model has a significant effect on improving the robustness of F&GES. The optimized F&GES has higher stability and sustainability when facing malicious attacks or random destruction, which ensures the stability and healthy development of the ecosystem.
The initial values of node and edge recovery robustness were both set to 1. As the number of attacked nodes increased, the network’s robustness decreased. Nevertheless, optimization using the CSCCD model led to a significant improvement in the connectivity robustness of nodes and edges when facing malicious attacks. When the connectivity robustness of the network dropped to the threshold of 0.5, the proportion of attacked nodes and edges increased to 87% and 77%, respectively. This result indicates that the optimized network can more efficiently restore the functionality of damaged nodes and edges, while maintaining higher stability when facing attacks. Overall, the optimization of the CSCCD model greatly enhances the robustness and resilience of F&GES, enabling it to better cope with external interference and attacks. This improvement contributes to the sustainability and stability of the ecosystem, providing robust support for ecological conservation and sustainable development.

3.4.3. Comparison of Carbon Sequestration Effects

Ecological source areas and corridors constitute vital components of F&GES (Figure 13). Ecological source areas possess high-quality habitats and strong carbon sequestration capacities, while ecological corridors connect crucial habitat patches, facilitate ecological flow between diverse patches, and possess certain carbon sequestration capabilities. In this study, we conducted an assessment of the carbon sequestration of F&GES before and after optimization, and the results are presented in Table 1. Following optimization, the total carbon sequestration of ecological source areas increased by 112,613.87 t, representing an increase of 6.67%, while the carbon sequestration of ecological corridors increased by 2701.97 t, representing an increase of 20%. The total carbon sequestration increase in the Eyu region after optimization was 115,315.84 t, with source areas contributing 97.66% and corridors contributing 2.34%. The spatial distribution of carbon sequestration of F&GES before and after optimization is depicted in the figures and charts. After optimization, 71 ecological source areas exhibited increased carbon sequestration levels in the ecological spatial network, with 26 newly added ecological source areas. Although the carbon sequestration increase in some areas was not particularly significant, the Eyu region is situated in an area where desert, agricultural, and pastoral areas intersect, and there are numerous mining regions. The region has low rainfall, and the low groundwater level results in sparse vegetation cover, primarily consisting of grasslands.

4. Discussion

4.1. Optimization Strategies to Enhance Connectivity and Carbon Sequestration in F&GES

This study aimed to investigate the coupling coordination between connectivity and carbon sequestration in F&GES of the Eyu district, and to propose optimization strategies to enhance the connectivity and carbon sequestration capacity of forest and grassland ecological spaces. The results of this study are highly significant for the field of forestry science. By constructing the CSCCD model, which considers the perspective of connectivity-carbon sequestration coupling coordination, we proposed optimization strategies for F&GES in the Eyu that improve the connectivity and carbon sequestration effect of these ecological spaces. Our research findings indicate that the optimized network increased by 26 ecological patches, with an additional area of 641.57 km2, and the carbon sequestration effect of F&GES increased by 6.78%. Furthermore, the robustness levels of network connectivity, edge recovery, and node recovery were all significantly improved after applying the optimization strategy. The CSCCD model proposed in this study can effectively enhance the carbon sequestration effect in mining areas, promoting carbon neutrality.
Building on previous research [3], this study proposes a novel method to enhance the carbon sequestration capacity of forest and grassland ecological spaces by investigating the coupling coordination between connectivity and carbon sequestration in their structural organization. Despite the fact that planting trees and grass can increase carbon sequestration, there are still some issues to be considered, such as whether the natural environment (soil, climate, etc.) in the area is suitable for the growth of forests and grass [7]. To address these challenges, this study combined the principles of ecological networks and complex networks to simplify and quantify the structure of forest and grassland ecological spaces in Eyu, and used indices such as connectivity to reflect the topological characteristics of forest and grassland ecological spaces. We calculated the carbon sequestration capacity of F&GES and analyzed the coupling coordination between connectivity and carbon sequestration. For forest and grassland ecological patches with low connectivity-carbon sequestration coupling coordination, we proposed potential alternative plans to improve their connectivity and carbon sequestration capacity. Additionally, we verified the effectiveness of these alternative plans by conducting robustness tests and analyzing changes in carbon sequestration capacity.

4.2. Optimization of F&GES Contributes to Forest and Grassland Management in Mining Areas

The optimization of F&GES is a crucial aspect of mining area forest and grassland management. The challenge of balancing economic development and environmental protection has been a persistent issue in mining areas. Conventional mining practices often lead to irreversible ecological damage, resulting in ecological degradation, the loss of ecological functions, and a deteriorating ecological environment [34]. However, the optimization of F&GES can enable environmentally sustainable mining area development. Foremost, the optimization of F&GES can improve the ecological environment of mining areas, enhancing the stability and anti-interference ability of ecological systems [6]. By appropriately planning and designing F&GES, the green coverage in mining areas can be increased, air quality can be improved, and issues such as land and soil erosion and desertification can be reduced, thereby enhancing the stability and anti-interference capacity of the ecological system. Secondly, the optimization of F&GES can enhance the carbon sequestration effect of mining areas and promote the development of a low-carbon economy [9]. The forest and grassland ecological system in mining areas serves as a vital carbon sink. Through rational management and optimization, carbon sequestration can be improved, greenhouse gas emissions can be reduced, and the development of a low-carbon economy can be facilitated [16]. Moreover, the optimization of F&GES can bolster the diversity and stability of mining area ecosystems. By increasing the quantity and quality of F&GES, species diversity and functional diversity of the ecological system can be improved, the stability and resilience of the ecological system can be enhanced, and better adaptability to environmental changes and natural disasters can be achieved [18]. In conclusion, the optimization of F&GES plays a crucial role in mining area ecosystem management. By optimizing F&GES, the ecological environment of mining areas can be improved, the carbon sequestration effect can be enhanced, the diversity and stability of ecological systems can be promoted, and technical and theoretical support can provide for the sustainable development of mining areas [20].
Mineral resources are vital natural resources that can facilitate social and economic development through large-scale exploitation [8]. Within the Eyu region, there are abundant mineral resources, such as coal, oil, natural gas, and rock salt, which have played a significant role in promoting economic and social development. However, mining activities have also resulted in numerous ecological and environmental problems, including subsidence and fractures, soil erosion, and vegetation degradation, leading to substantial changes in the landscape pattern of mining areas, impeding ecological flow, and impacting ecosystem services [27]. To investigate these issues, this study employed ArcGIS to superimpose industrial and mining land, such as factories, mines, oil fields, and salt fields, with F&GES (as depicted in Figure 14). The findings revealed that the area of industrial and mining land accounted for 2.1% of the total F&GES, which could increase ecological resistance and reduce landscape connectivity [9,18]. To safeguard the connectivity and ecosystem services of F&GES, additional funding is required to restore and reconstruct damaged F&GES. On the one hand, mining activities in ecological source areas should be gradually phased out. On the other hand, mining and economic development should be prohibited in the vicinity of ecological source areas and buffer zones. From the ecological function and connectivity perspective, the utilization of the CSCCD model and optimization strategies can offer theoretical support for the management of mining area ecosystems, while limiting unsuitable mining activities [26].

4.3. Optimizing F&GES to Increase Carbon Sequestration in Mining Areas

The Chinese government has set forth a strategic objective to achieve carbon neutrality by 2060, with a target of peaking carbon emissions by 2030. To achieve this objective, enhancing the carbon sequestration capacity of ecosystems is a crucial aspect [36]. Nevertheless, mining activities in mining areas can result in significant losses of soil and vegetation carbon sequestration, consequently diminishing the effectiveness of carbon sequestration. Research has demonstrated that mining development has caused a decline in forest and grassland carbon sinks. However, policies such as returning farmland to forests and grasslands and land reclamation have supported an increasing trend in carbon sinks in mining areas [26]. Nevertheless, studies also suggest that the carbon sequestration capacity of vegetation in mining areas has declined considerably in recent decades, highlighting the urgent need for proactive measures to safeguard the ecosystem and carbon sequestration capacity. Optimizing forest and grassland ecological spaces in mining areas can enhance the ecological quality of the mining region. Moreover, the increased carbon sequestration can offset carbon emissions from mining activities, which is critical for mining areas to achieve carbon neutrality [30].
This study employed ArcGIS software and other methods to analyze the total carbon emissions in the Eyu region (see Figure 15). The findings indicated that total carbon emissions in the Eyu region have been increasing over the past 20 years, with significant contributions from energy activities, industrial production, and waste treatment [14]. However, in the last decade, the Eyu region has achieved a notable reduction in the growth rate of carbon emissions by optimizing its energy and industrial structure. Despite this progress, the ecological carbon sequestration capacity in the Eyu region remains relatively low. Notably, the present study demonstrated that optimizing F&GES can enhance ecological protection efficiency and carbon sequestration in the mining area [4,18]. This study proposed and experimentally validated optimization strategies for the connectivity and ecosystem integrity of forest and grassland ecological spaces. The optimized measures resulted in a 6.67% increase in the carbon sequestration capacity of the forest and grassland ecological spaces. Moreover, this study recommended highly feasible protection and carbon sequestration enhancement measures tailored to different types of forest and grassland ecological spaces [24,26]. It is worth noting that optimizing the forest and grassland ecological space structure can also improve ecosystem services, such as water retention and soil conservation, thereby contributing positively to the reduction of current carbon emissions. However, achieving carbon emission reduction goals requires the integration of efficient energy use and carbon capture technologies with the optimization of F&GES [14,15].

4.4. Limitations and Future Research Directions

In this study, we utilized remote sensing ecological indices to assess habitat quality and extracted forest and grassland ecological patches based on both habitat quality and area indicators. We improved the ecological resistance surface by incorporating habitat risk assessment results and used the MCR model to identify ecological corridors [19,21]. Based on the connectivity and carbon sequestration capacity of forest and grassland ecological patches, we developed the CSCCD model and applied various optimization strategies. The implementation of these strategies resulted in improved connectivity and resistance to destruction in the forest and grassland ecological patches, as well as increased carbon sequestration, providing a new potential solution for enhancing carbon sequestration in mining areas [34,37].
Compared with previous studies [49], we found spatial and environmental similarities between forest and grassland ecological patches in the northern and eastern parts of Eyu. However, unlike previous studies, we emphasized the enhancement of connectivity and the coordinated coupling of carbon sequestration. By proposing potential alternative solutions for optimizing forest and grassland ecological patches, we aimed to improve ecosystem services needed by humans, such as carbon sequestration. In this study, we emphasized the systematic nature of forest and grassland ecological patch optimization strategies and focused on addressing regional ecological issues [23,26]. Through optimizing forest and grassland ecological infrastructure, we can demonstrate the developmental aspect of ecological conservation [28,29]. Therefore, optimizing F&GES is an important direction for development that can enhance ecosystem functionality and resistance to destruction, maintain and improve habitat quality, and provide essential ecosystem services, such as carbon sequestration [3,34].
However, this study does have some limitations. In the southwestern and southern parts of Eyu, there are relatively fewer forest and grassland ecological patches. Therefore, it may be less feasible to add source areas and corridors to these regions in practical operations [10,11]. In addition, due to the lower habitat quality, the distance between ecological source areas and corridors is greater, which further increases the difficulty of adding new ecological source areas and corridors. To address this, we developed optimization strategies for adding new source areas and corridors near the most critical habitat patches. In future studies, it will be necessary to formulate new optimization strategies that consider the characteristics of regions with lower habitat quality [13,17]. In this study, we constructed an ecological resistance surface based on habitat risk and identified the spatial location of ecological corridors to connect ecological source areas and reduce isolated habitat patches. Ecological corridors are a vital component of forest and grassland ecological spaces. To ensure the ecological functionality of ecological corridors, we need to determine an appropriate effective width for protecting them and control the construction of new corridors [25,28]. In the next step of research, we will incorporate habitat risk and use models such as circuit theory and ant colony algorithms to investigate the heterogeneity of habitat risk and mutation sites on either side of the corridor, in order to further study the effective width of ecological corridors [28]. Referring to previous research on improving carbon sequestration capacity in China’s northwestern mining areas [49], we set a carbon sequestration enhancement goal of 10% in the potential alternative solution. In future studies, we will verify whether 10% is the optimal carbon sequestration enhancement goal for the Eyu mining area.

5. Conclusions

The objective of this study was to develop an optimized potential alternative plan that aims to enhance the ecological system protection and carbon sequestration ability of forest and grassland ecological spaces in mining areas. To this end, we proposed a carbon sequestration optimization model based on the structure of forest and grassland ecological spaces and landscape connectivity, which we applied to the Eyu district. Our research findings indicate that our optimized plan can effectively enhance the ecological system of Eyu, including its landscape connectivity, the resilience of the forest and grassland ecological space structure, and carbon sequestration ability. This study provides an appropriate optimized potential alternative plan that can support the construction and management of forest and grassland ecological spaces in Eyu and other mining areas. Consequently, our research contributes to the advancement of related technical and theoretical knowledge in the field.

Author Contributions

G.W.: Conceptualization, Methodology, Investigation, Formal analysis, Writing—original draft, Visualization. C.X.: Validation, Resources. Q.Y.: Writing—review and editing. F.W.: Supervision, Software, Methodology. D.Y. (Di Yang): Resources, Formal analysis. D.Y. (Depeng Yue): Formal analysis, Investigation. All authors have read and agreed to the published version of the manuscript.

Funding

This research was funded by the National Natural Science Foundation of China Project (No. 420071237) and Youth Science Foundation of National Natural Science Foundation of China, grant number No. 42001211.

Data Availability Statement

Not applicable.

Acknowledgments

We are grateful to the graduate students and staff of the Beijing Key Laboratory of Precise Forestry, Beijing Forestry University.

Conflicts of Interest

The authors declare that they have no known competing financial interests or personal relationships that could have appeared to influence the work reported in this paper.

Appendix A. Location, Brief Geographical Features, Landscape and Ecological Characteristics of Ecological Patches of Forest and Grassland in Eyu

In the present study, high-quality ecological patches in Eyu County were carefully selected and merged to extract a total of 123 patches, which comprised 13 forest patches and 120 grassland patches. The numbers in Figure A1 indicate the numbers of forest and grass patches. These ecological patches were predominantly distributed in the northeastern part of Eyu County and exhibited a gradual decrease in size from north to south. The locations and numbering of these ecological patches were delineated based on their geographical coordinates and are presented in Figure A1. The forest patches covered a total area of 952.23 square kilometers, while the grassland patches spanned 14,340.32 square kilometers. The proximity of the Yellow River in the north and east of Eyu County contributed to higher habitat quality and ecological functions in the ecological patches located closer to this river. However, the occurrence of the Kubuqi and Mu Us Deserts in the northwest and west of Eyu County, characterized by low precipitation, low vegetation coverage, and remoteness from wetlands, resulted in a relatively sparse distribution of ecological patches in these regions. Forest ecological patches in Eyu County were mainly distributed in the western mountainous and central sandy areas, representing forest and desert ecosystems, respectively. The primary vegetation types in the forest patches were coniferous and broad-leaved forests, with coniferous forests mainly occurring in the western mountainous region and broad-leaved forests predominantly found in river valleys and mountain basins. In contrast, grassland ecological patches were distributed in the central part of Eyu County, which is the most vulnerable area in the region and has been impacted by factors such as soil erosion and overgrazing, leading to a gradual reduction in their size over time.
Figure A1. Location distribution and patch numbers of forest and grass patches.
Forests 14 01587 g0a1

Appendix B

Table A1. Evaluation of ecological resistance factors.
Factor WeightLevelValueFactorWeightLevelValue
DEM(m) 1544–1059Habitat risk 2061.52–82.58
51059–1206 1552.29–61.52
0.07101206–13330.191045.72–52.29
151333–1482 537.98–45.72
201482–2149 10–37.98
Road Network
Density
10–2.57Water Network
Density
200–2.15
52.57–6.48 152.15–6.10
0.09106.48–10.780.12106.10–10.71
1510.78–16.74 510.71–17.77
2016.74–30.05 117.77–31.11
NDVI 20−0.13–0.24SLOPE ( ° ) 10–3.94
150.24–0.37 53.94–9.08
0.18100.37–0.510.09109.08–16.05
50.51–0.67 1516.05–24.53
10.67–1 2024.53–77.52
LUCC 1Water
Wetland
5Forest
Grassland
Shrubland
0.2610Cultivated land
15Artificial
Surface
20Bare land

References

  1. Devi, N.B.; Lepcha, N.T. Carbon sink and source function of Eastern Himalayan forests: Implications of change in climate and biotic variables. Environ. Monit. Assess. 2023, 195, 843. [Google Scholar] [CrossRef] [PubMed]
  2. Liu, J.; Gao, W.; Liu, T.; Dai, L.; Wu, L.; Miao, H.; Yang, C. A Bibliometric Analysis of the Impact of Ecological Restoration on Carbon Sequestration in Eco-systems. Forests 2023, 14, 1442. [Google Scholar] [CrossRef]
  3. Chen, Z.; Chen, J.; Xu, G.; Sha, Z.; Yin, J.; Li, Z. Estimation and Climate Impact Analysis of Terrestrial Vegetation Net Primary Productivity in China from 2001 to 2020. Land 2023, 12, 1223. [Google Scholar] [CrossRef]
  4. He, N.; Wen, D.; Zhu, J.; Tang, X.; Xu, L.; Zhang, L.; Hu, H.; Huang, M.; Yu, G. Vegetation carbon sequestration in Chinese forests from 2010 to 2050. Glob. Chang. Biol. 2016, 23, 1575–1584. [Google Scholar] [CrossRef]
  5. Wang, Z.; Li, R.; Guo, Q.; Wang, Z.; Huang, M.; Cai, C.; Chen, B. Learning ensembles of process-based models for high accurately evaluating the one-hundred-year carbon sink potential of China’s forest ecosystem. Heliyon 2023, 9, e17243. [Google Scholar] [CrossRef]
  6. Li, H.; Gao, W.; Liu, Y.; Yuan, F.; Wu, M.; Meng, L. Attributing the impacts of ecological engineering and climate change on carbon uptake in Northeastern China. Landsc. Ecol. 2023, 1–16. [Google Scholar] [CrossRef]
  7. Zhao, J.; Ma, J.; Zhu, Y.-F.; Yu, H.-C.; Zhang, Q.; Chen, F. Effects of Vegetation Types on Carbon Cycle Functional Genes in Reclaimed Soil from Open Pit Mines in the Loess Plateau. Huan Jing Ke Xue Huanjing Kexue 2023, 44, 3386–3395. [Google Scholar] [CrossRef]
  8. Heikkala, E. The Effects of Land-Use Changes on Forest Carbon Storage—The Case of New Building Scenario 2016–2050 for the Uusimaa Region. Master’s Thesis, Aalto University, Espoo, Finland, 2023. [Google Scholar]
  9. Chen, X.; Zhang, Y. Impacts of climate, phenology, elevation and their interactions on the net primary productivity of vegetation in Yunnan, China under global warming. Ecol. Indic. 2023, 154, 110533. [Google Scholar] [CrossRef]
  10. Xu, C.; Zhang, Q.; Yu, Q.; Wang, J.; Wang, F.; Qiu, S.; Ai, M.; Zhao, J. Effects of land use/cover change on carbon storage between 2000 and 2040 in the Yellow River Basin, China. Ecol. Indic. 2023, 151, 110345. [Google Scholar] [CrossRef]
  11. Tu, H.; Jiapaer, G.; Yu, T.; Zhang, L.; Chen, B.; Lin, K.; Li, X. Effects of Land Cover Change on Vegetation Carbon Source/Sink in Arid Terrestrial Ecosystems of Northwest China, 2001–2018. Remote. Sens. 2023, 15, 2471. [Google Scholar] [CrossRef]
  12. Landi, P.; Minoarivelo, H.O.; Brännström, U.; Hui, C.; Dieckmann, U. Complexity and stability of ecological networks: A review of the theory. Popul. Ecol. 2018, 60, 319–345. [Google Scholar] [CrossRef]
  13. Wei, S.; Pan, J.; Liu, X. Landscape ecological safety assessment and landscape pattern optimization in arid inland river basin: Take Ganzhou District as an example. Hum. Ecol. Risk Assess. Int. J. 2020, 26, 782–806. [Google Scholar] [CrossRef]
  14. Luo, J.; Fu, H. Construct the future wetland ecological security pattern with multi-scenario simulation. Ecol. Indic. 2023, 153, 110473. [Google Scholar] [CrossRef]
  15. Borrett, S.R.; Sheble, L.; Moody, J.; Anway, E.C. Bibliometric review of ecological network analysis: 2010–2016. Ecol. Model. 2018, 382, 63–82. [Google Scholar] [CrossRef]
  16. An, Y.; Liu, S.; Sun, Y.; Shi, F.; Beazley, R. Construction and optimization of an ecological network based on morphological spatial pattern analysis and circuit theory. Landsc. Ecol. 2021, 36, 2059–2076. [Google Scholar] [CrossRef]
  17. Wang, X.; Sun, Y.; Liu, Q.; Zhang, L. Construction and Optimization of Ecological Network Based on Landscape Ecological Risk Assessment: A Case Study in Jinan. Land 2023, 12, 743. [Google Scholar] [CrossRef]
  18. Wang, C.; Yu, W.; Ma, L.; Ye, X.; Erdenebileg, E.; Wang, R.; Huang, Z.; Indree, T.; Liu, G. Biotic and abiotic drivers of ecosystem multifunctionality: Evidence from the semi-arid grasslands of northern China. Sci. Total. Environ. 2023, 887, 164158. [Google Scholar] [CrossRef]
  19. Mei, Y.; Sun, Y.; Wang, Q.; Liu, Q.; Zhang, L. Construction of Green Space Ecological Network in Jinan City Based on MSPA and MCR Model. Pol. J. Environ. Stud. 2022, 31, 3701–3711. [Google Scholar] [CrossRef]
  20. Cui, L.; Wang, J.; Sun, L.; Lv, C. Construction and optimization of green space ecological networks in urban fringe areas: A case study with the urban fringe area of Tongzhou district in Beijing. J. Clean. Prod. 2020, 276, 124266. [Google Scholar] [CrossRef]
  21. Zhu, L.; Sun, W.; Wu, J.; Fan, D. Spatiotemporal Distribution of Carbon Sink Indicators—NPP and Its Driving Analysis in Ordos City, China. Appl. Sci. 2023, 13, 6457. [Google Scholar] [CrossRef]
  22. Barabás, G.; Michalska-Smith, M.J.; Allesina, S. Self-regulation and the stability of large ecological networks. Nat. Ecol. Evol. 2017, 1, 1870–1875. [Google Scholar] [CrossRef] [PubMed] [Green Version]
  23. Hu, G.-Z.; Ha, G.; Li, M.-J.; Yu, P.-D.; Ga, Q.-Z. Study on the simulation of soil carbon sink in grassland ecological management in China—Based on IPCC inventory method. Adv. Clim. Change Res. 2023, 19, 371. [Google Scholar]
  24. Lu, R.; Yu, W.; Lü, J.; Xue, A. Synchronization on complex networks of networks. IEEE Trans. Neural Netw. Learn. Syst. 2014, 25, 2110–2118. [Google Scholar] [CrossRef] [PubMed]
  25. Domínguez-García, V.; Dakos, V.; Kéfi, S. Unveiling dimensions of stability in complex ecological networks. Proc. Natl. Acad. Sci. USA 2019, 116, 25714–25720. [Google Scholar] [CrossRef]
  26. Guo, Y.; Ren, Z.; Dong, Y.; Zhang, P.; Wang, C.; Ma, Z.; He, X. Multifunctionality can be promoted by increasing agriculture-dominated heterogeneous landscapes in an agro-forestry interlacing zone in northeast China. Landsc. Urban Plan. 2023, 238, 104832. [Google Scholar] [CrossRef]
  27. Jia, X.; Han, H.; Feng, Y.; Song, P.; He, R.; Liu, Y.; Wang, P.; Zhang, K.; Du, C.; Ge, S.; et al. Scale-dependent and driving relationships between spatial features and carbon storage and sequestration in an urban park of Zhengzhou, China. Sci. Total Environ. 2023, 894, 164916. [Google Scholar] [CrossRef]
  28. Triviño, M.; Juutinen, A.; Mazziotta, A.; Miettinen, K.; Podkopaev, D.; Reunanen, P.; Mönkkönen, M. Managing a boreal forest landscape for providing timber, storing and sequestering carbon. Ecosyst. Serv. 2015, 14, 179–189. [Google Scholar] [CrossRef]
  29. Xu, H.; Zhang, Z.; Yu, X.; Li, T.; Chen, Z. The construction of an ecological security pattern based on the comprehensive evaluation of the importance of ecosystem service and ecological sensitivity: A case of Yangxin County, Hubei Province. Front. Environ. Sci. 2023, 11, 1154166. [Google Scholar] [CrossRef]
  30. Shin, G.; Kim, H.-R.; Jang, S.-R.; Kim, H.-Y.; Rho, P. Evaluating the Criteria and Weight Value for Ecological Network Connectivity of Baekdudaegan Mountain Range on Taebaeksan National Park. Korean J. Environ. Ecol. 2019, 33, 292–302. [Google Scholar] [CrossRef]
  31. Yupan, Z.; Huan, Y.; Guangbin, L.; Ainong, L.; Jinhu, B.; Xi, N. Identification of Ecological Network in Mekong River Basin based on Ecological Risk Assessment. Remote Sens. Technol. Appl. 2023, 38, 116–128. [Google Scholar]
  32. Riviere, M.; Caurla, S. Landscape implications of managing forests for carbon sequestration. Forestry 2021, 94, 70–85. [Google Scholar] [CrossRef]
  33. Lin, Y.; Cong, N.; Xiao, J.; Kou, Y.; Li, Y.; Yu, X.; Qi, G.; Gou, C.; Bai, Y.; Ren, P. Projecting future aboveground carbon sequestration rate of alpine forest on the eastern Tibetan Plateau in response to climate change. Front. Plant Sci. 2023, 14, 1212406. [Google Scholar] [CrossRef]
  34. Wu, M.M.; Liang, Y.; Taubert, F.; Huth, A.; Zhang, M.; Wang, X. Sensitivity of forest composition and productivity to climate change in mixed broadleaved-Korean pine forest of Northeastern China. Ecol. Model. 2023, 483, 110434. [Google Scholar] [CrossRef]
  35. Kang, J.; Qing, Y.; Lu, W. Construction and optimization of the Saihanba ecological network. Ecol. Indic. 2023, 153, 110401. [Google Scholar] [CrossRef]
  36. Straus, H.; Podvinšek, S.; Klopčič, M. Identifying Optimal Forest Management Maximizing Carbon Sequestration in Mountain Forests Impacted by Natural Disturbances: A Case Study in the Alps. Forests 2023, 14, 947. [Google Scholar] [CrossRef]
  37. Yu, Q.; Yue, D.; Wang, Y.; Kai, S.; Fang, M.; Ma, H.; Zhang, Q.; Huang, Y. Optimization of ecological node layout and stability analysis of ecological network in desert oasis: A typical case study of ecological fragile zone located at Deng Kou County (Inner Mongolia). Ecol. Indic. 2018, 84, 304–318. [Google Scholar] [CrossRef]
  38. Xu, W.; Wang, J.; Zhang, M.; Li, S. Construction of landscape ecological network based on landscape ecological risk assessment in a large-scale opencast coal mine area. J. Clean. Prod. 2020, 286, 125523. [Google Scholar] [CrossRef]
  39. Guo, H.; Sun, Y.; Wang, Q.; Wang, X.; Zhang, L. Construction of Greenspace Landscape Ecological Network Based on Resistance Analysis of GeoDetector in Jinan. Stoch. Environ. Res. Risk Assess. 2023, 37, 651–663. [Google Scholar] [CrossRef]
  40. Sharp, R.; Douglass, J.; Wolny, S.; Arkema, K.; Bernhardt, J.; Bierbower, W.; Chaumont, N.; Denu, D.; Fisher, D.; Glowinski, K.; et al. InVEST 3.9.0 User’s Guide [M/OL]. 2020. Available online: http://releases.naturalcapitalproject.org/invest-userguide/latest/index.html (accessed on 12 December 2020).
  41. Wyatt, K.H.; Griffin, R.; Guerry, A.D.; Ruckelshaus, M.; Fogarty, M.; Arkema, K.K. Habitat Risk Assessment for Regional Ocean Planning in the US Northeast and Mid-Atlantic. PLoS ONE 2017, 12, e0188776. [Google Scholar] [CrossRef]
  42. Nie, X.R.; Hu, Z.Q.; Zhu, Q.; Ruan, M.Y. Research on temporal and spatial resolution and the driving forces of ecological environment quality in coal mining areas considering topographic correction. Remote Sens. 2021, 13, 2815. [Google Scholar] [CrossRef]
  43. Xu, H.Q.; Wang, Y.F.; Guan, H.D.; Shi, T.T.; Hu, X.S. Detecting ecological changes with a remote sensing based ecological index (RSEI) produced time series and change vector analysis. Remote Sens. 2019, 11, 2345. [Google Scholar] [CrossRef] [Green Version]
  44. Liang, X.; Liu, Z.; Zhai, L.; Ji, L.; Feng, Y.; Sang, H. Spatial terrestrial carbon emissions/sequestrations evolution based on ecological network analysis in Bei-jing-Tianjin-Hebei urban agglomeration. Ecol. Eng. 2023, 189, 106914. [Google Scholar] [CrossRef]
  45. Lü, L.; Pan, L.; Zhou, T.; Zhang, Y.-C.; Stanley, H.E. Toward link predictability of complex networks. Proc. Natl. Acad. Sci. USA 2015, 112, 2325–2330. [Google Scholar] [CrossRef] [PubMed]
  46. Wu, J.; Fan, X.; Li, K.; Wu, Y. Assessment of ecosystem service flow and optimization of spatial pattern of supply and demand matching in Pearl River Delta, China. Ecol. Indic. 2023, 153, 110452. [Google Scholar] [CrossRef]
  47. Lü, L.; Chen, D.; Ren, X.-L.; Zhang, Q.-M.; Zhang, Y.-C.; Zhou, T. Vital nodes identification in complex networks. Phys. Rep. 2016, 650, 1–63. [Google Scholar] [CrossRef]
  48. Chen, Y.Q.; Li, Y.F.; Qi, X.H.; Chen, W.H.; Lin, J.H. Assessing ecosystem risk in coastal wetland of the South Fujian Golden Delta using a habitat risk assessment model based on the land-use effect on tidal flat wetland. Acta Ecol. Sin. 2018, 38, 4214–4225. [Google Scholar]
  49. Guo, H.; Yu, Q.; Pei, Y.; Wang, G.; Yue, D. Optimization of landscape spatial structure aiming at achieving carbon neutrality in desert and mining areas. J. Clean. Prod. 2021, 322, 129156. [Google Scholar] [CrossRef]
Figure 1. Location map of the study area.
Forests 14 01587 g001
Figure 2. Schematic diagram of the research framework.
Forests 14 01587 g002
Figure 3. Structural diagram of the CSCCD model.
Forests 14 01587 g003
Figure 4. Spatial distribution of habitat quality (left) and ecological source areas (right) in Eyu County.
Forests 14 01587 g004
Figure 5. Spatial distribution of habitat risks (left) and ecological resistance values (right) in Eyu County.
Forests 14 01587 g005
Figure 6. Spatial distribution map of F&GES in Eyu County.
Forests 14 01587 g006
Figure 7. Cluster spatial distribution (left) and node topological characteristics (right) of forest and grassland ecological space in Eyu County.
Forests 14 01587 g007
Figure 8. Connectivity and spatial distribution map of F&GES in Eyu County.
Forests 14 01587 g008
Figure 9. Spatial distribution map of carbon sequestration services (left) and spatial distribution map of carbon sequestration in ecological source areas (right) in Eyu County.
Forests 14 01587 g009
Figure 10. Distribution of carbon sequestration-connectivity coordination index in Eyu F&GES before (left) and after (right) implementation of optimization strategies.
Forests 14 01587 g010
Figure 11. Optimization results of adding stepping stones at weak points in ecological corridors (left) and increasing ecological corridor strategy by degree (right).
Forests 14 01587 g011
Figure 12. Resilience of F&GES in Eyu County before optimization (upper) and after optimization (lower).
Forests 14 01587 g012
Figure 13. Comparison of carbon sequestration services in F&GES in Eyu County before optimization (left) and after optimization (right).
Forests 14 01587 g013
Figure 14. Distribution map of F&GES and industrial and mining land in Eyu County.
Forests 14 01587 g014
Figure 15. Changes in total carbon emissions in Eyu County from 1997 to 2018.
Forests 14 01587 g015
Table 1. Comparison of carbon sequestration in F&GES before and after optimization.
Status of F&GESCarbon Sequestration in Ecological Sources (t)Carbon Sequestration in Ecological Corridors (t)Total Carbon Sequestration (t)
Before optimization1,688,44813,5071,701,956
After optimization1,801,06216,2091,817,272
Disclaimer/Publisher’s Note: The statements, opinions and data contained in all publications are solely those of the individual author(s) and contributor(s) and not of MDPI and/or the editor(s). MDPI and/or the editor(s) disclaim responsibility for any injury to people or property resulting from any ideas, methods, instructions or products referred to in the content.

