Article

A 250-Year Winter Minimum Temperature Reconstruction Based on Tree Rings from Luoji Mountain, Southwest China

1
College of Geography and Environmental Science, Henan University, Kaifeng 475004, China
2
Key Laboratory of Earth System Observation and Modeling of Henan Province, Henan University, Kaifeng 475004, China
3
Department of Geography, University of Hong Kong, Hong Kong SAR, China
4
HKU Shenzhen Institute of Research and Innovation, Shenzhen 518057, China
5
School of Geographical Sciences, Guangzhou University, Guangzhou 510006, China
*
Author to whom correspondence should be addressed.
Forests 2023, 14(8), 1555; https://doi.org/10.3390/f14081555
Submission received: 12 June 2023 / Revised: 20 July 2023 / Accepted: 26 July 2023 / Published: 29 July 2023

Abstract

:
Annually resolved temperature records spanning the past few centuries are limited in Southwest China. In this paper, we present a robust 250-year winter minimum temperature reconstruction based on the tree rings of Abies georgei Orr from Luoji Mountain, Southwest China. The tree rings exhibit significant correlations with winter minimum temperatures (Tmin) from the previous November to the current March (pNov–cMar). Based on this relationship, we reconstructed pNov-cMar Tmin from 1765 to 2014. This reconstruction accounts for 37.8% of the Tmin variance during the instrumental 1960–2014 period. Our reconstruction reveals five warm periods (1765–1785, 1795–1804, 1827–1883, 1901–1907, 1989–2014) and four cold periods (1786–1794, 1805–1826, 1884–1900, 1908–1988) over the past 250 years. Spectral analyses revealed several significant interannual (2.3–2.4a, 3.9–4.2a, 8.9–9.7a) and interdecadal (23.0–28.9a) cycles in our reconstruction series. Both spatial correlation analysis and the inter-comparison of paleoclimate records revealed that the winter Tmin reconstruction had significant positive correlations with the Atlantic Multidecadal Oscillation (AMO), with relatively consistent warm and cold periods in their variations over the past 250 years.

1. Introduction

The latest Intergovernmental Panel on Climate Change (IPCC) report indicates that the global average air temperature was 1.09 °C higher in 2011–2020 than in 1850–1900 [1]. The continuous increase in air temperature will exacerbate the impact of heat stress on natural ecosystems and human society. The Tibetan Plateau is one of the most sensitive and vulnerable regions to global climate change [1,2,3]. From 1961 to 2017, the air temperature on the Tibetan Plateau increased significantly, with an average increase of 0.32 °C every 10 years [4]. Previous studies have shown that the increasing rate of minimum temperature is greater than that of maximum temperature on the Tibetan Plateau [5]. Nonetheless, few long temperature records are available to assess the nature of recent temperature anomalies on the southeast edge of the Tibetan Plateau, Southwest China. This region is the transition area from the Tibetan Plateau to the Sichuan Basin and features complex terrain and ecosystems, making it an ideal place to study climate change.
Tree rings are one of the key proxies for paleoclimate research owing to their precise dating, annual resolution, and high sensitivity to climate in many regions worldwide [6,7,8,9,10]. In recent years, several dendroclimatological studies have been conducted in the eastern part of the Tibetan Plateau for temperature reconstruction, such as mean temperature [11,12,13,14,15,16,17,18], maximum temperature [2,19,20], and minimum temperature [21,22,23,24]. However, most of these studies are located in the northern part of the Eastern Tibetan Plateau, with fewer on the southeast edge of the Tibetan Plateau, Southwest China.
Therefore, the main purposes of this study were to: (1) Develop a robust tree-ring-width chronology of Abies georgei Orr on the southeast edge of the Tibetan Plateau and identify the main limiting climate factors on tree growth; (2) perform a tree ring-based temperature reconstruction and analyze its long-term variability; (3) evaluate the links between regional temperature and large-scale climate change on the Eastern Tibetan Plateau.

2. Materials and Methods
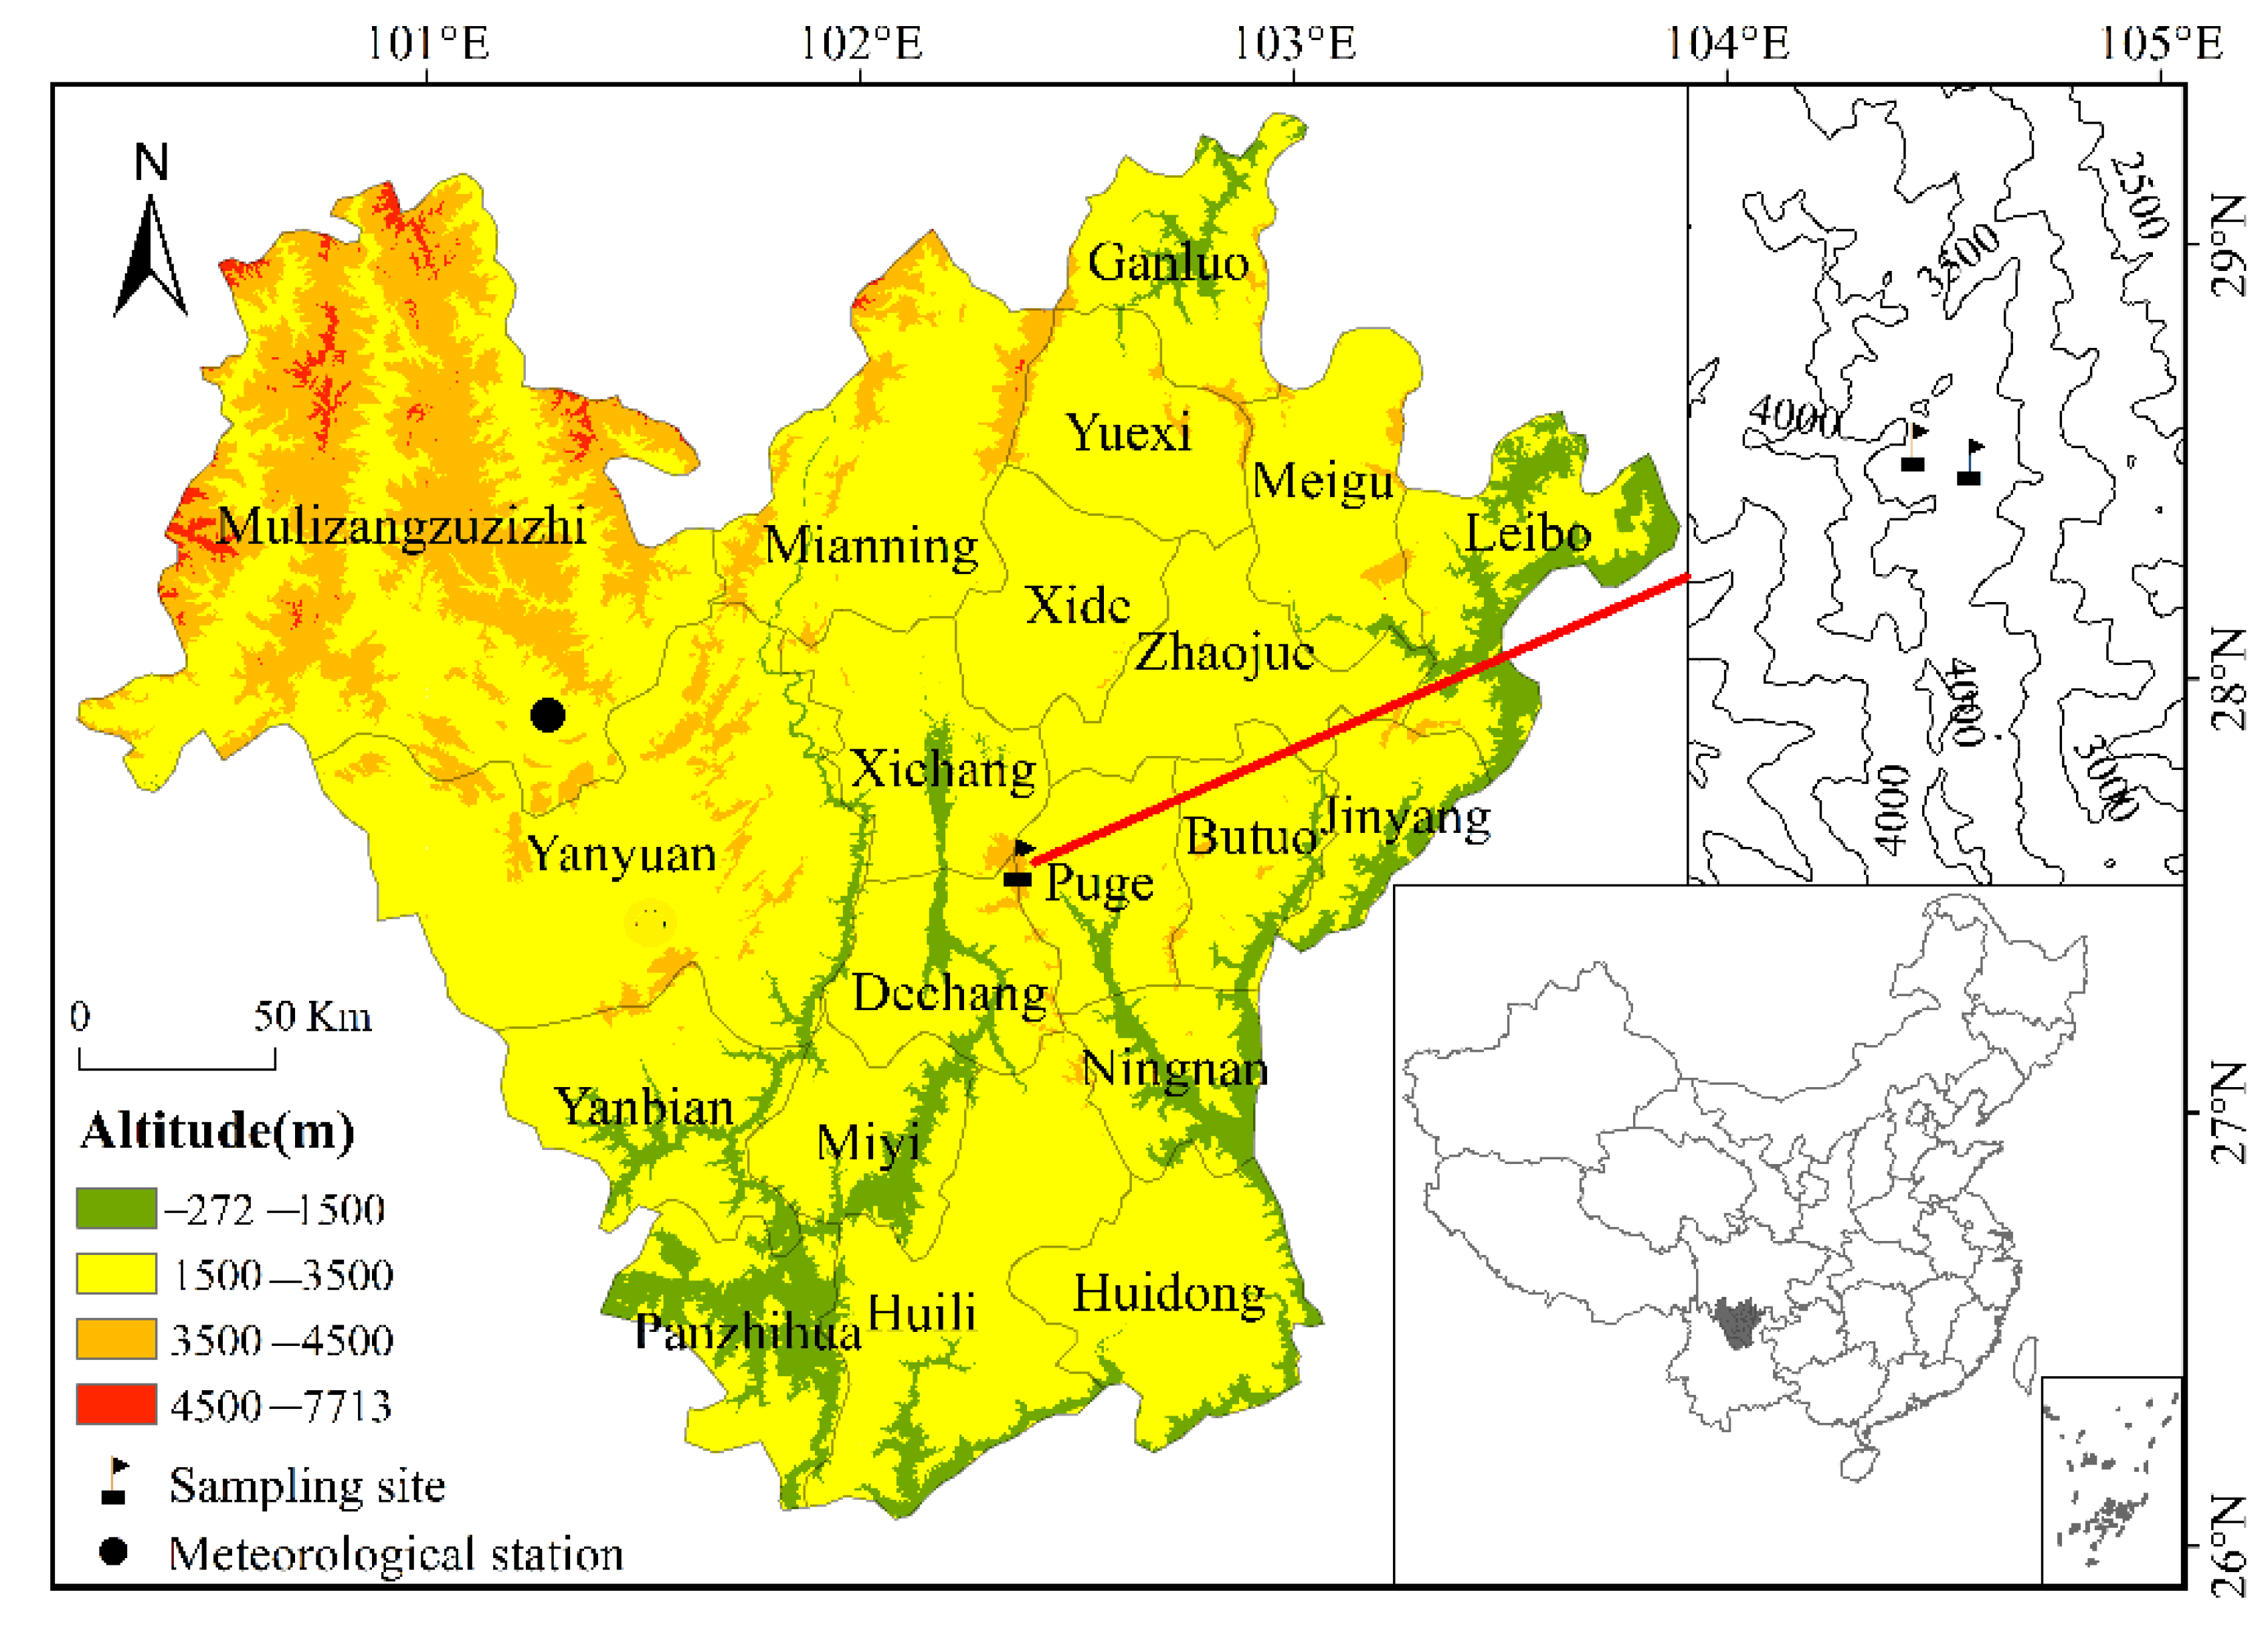
2.1. Study Area

Our sampling sites were in Luoji Mountain, Southern Sichuan Province, Southwest China (Figure 1). Luoji Mountain is part of the Hengduan Mountains on the southeast edge of the Tibetan Plateau, with a main peak of 4359 m above sea level (a.s.l). The climate is characterized by cool humid summers and cold dry winters, with distinct dry and wet seasons. The annual mean temperature ranges from −1.2 °C to 14.6 °C are due to variations in altitude, with the warmest and coldest months being July and January, respectively. The annual total precipitation is about 1000 mm, mainly concentrated from June to September. Due to differences in terrain elevation, Luoji Mountain has a complete spectrum of vertical forest types. Among them, the subalpine coniferous forests are distributed at an altitude of 3300 to 4000 m a.s.l, with A. forrestii and A. georgei as the main species. The dominant soil type is acidic soil with a relatively sticky texture.

2.2. Tree-Ring Data and Chronology Development

In April 2015, we collected tree-ring samples from two sites in the high-elevation areas of Luoji Mountain (Figure 1; Table 1). The two sampling sites are close to each other, and both are situated in subalpine coniferous forests. In general, two to three cores were sampled from large, healthy, and living trees of A. georgei at breast height (approximately 1.3 m above ground level) using 5.15 mm increment borers. In total, 70 cores from 33 trees and 68 cores from 33 trees were retrieved at the sites of LJH and LJS, respectively (Table 1).
All tree-ring samples were air-dried, mounted, polished, and cross-dated in the laboratory. Each ring width was measured using the Velmex measuring system (Bloomfield, NY, USA) with a precision of 0.001 mm. The quality of cross-dating and measurement accuracy was further evaluated by the COFECHA program [25]. Due to the close distance and same type of tree species, the samples of these two sites were merged to develop a regional composite chronology.
The ARSTAN program developed a composite tree-ring width chronology to retain more climatic information and remove non-climatic information related to tree age and stand dynamics [26] Raw tree-ring sequences were detrended using negative exponential curves or linear curves of any slope. Tree-ring indices were calculated as residuals between the raw measurement and curve fitting values, which can effectively avoid potential index value inflation caused by the ratio method [3,27]. Finally, three types of chronologies including standard (STD), residual (RES), and autoregressive (ARS) chronologies were generated using the ARSTAN program. STD chronology was used in this study as it contains low-frequency climate information indicated by high values of first-order autocorrelation (Table 2). Nonetheless, low-frequency variations should be interpreted with caution as there might be ecological disturbances at the sampling sites, as shown by the relatively low value of the mean inter-series correlation and mean correlation between trees. WE used an expressed population signal (EPS) [28] with a commonly accepted threshold value of 0.85 to identify the most reliable portion of the chronology (Figure 2).

2.3. Climate Data

Instrumental climate data spanning 1959–2014 were collected from the Yanyuan meteorological station (27°26′ N, 101°31′ E, 2545 m a.s.l) (Figure 1) and provided by the China Meteorological Data Sharing Service System (https://data.cma.cn/, accessed on 1 October 2019). The climatic parameters used in our study included monthly mean (Tmean), maximum (Tmax), minimum (Tmin) temperatures, and total precipitation (P). As shown in Figure 3, the annual Tmean is approximately 12.4 °C. The monthly Tmin is above 0 °C except in January and December. Annual precipitation is approximately 810 mm, largely concentrated from June to September.

2.4. Statistical Methods

We used DendroClim 2002 1.0 software [29] to perform a Pearson’s correlation analysis between the tree-ring width chronology and climate factors (Tmean, Tmax, Tmin, and P) from the previous May to the current October, in light of the chronology’s high auto-correlation (Table 2). To determine the best reconstruction period, the chronology’s correlation with seasonal and yearly climate factors was calculated in addition to monthly correlations. Finally, a linear regression model [26] between the chronology and climate factors was selected for reconstruction. We used the leave-one-out cross-validation (LOOCV) method to examine the reliability of the reconstruction in light of the short common period between climate data and tree-ring chronology [30] A positive value for reduction of error (RE) generally indicates model reliability. Moreover, 10-fold cross-validation [31] was performed to test the predictive skill of the model, which provided a pseudo-independent measure of mean absolute error (MAE), root mean square error (RMSE), and model efficiency (EF).
Spectral analyses were performed using a multi-taper method (MTM) [32] and wavelet analysis [33] to explore the periodic variation of the reconstruction series. We used KNMI climate explorer to investigate the spatial correlation of observed and reconstructed series with 0.5° × 0.5° gridded temperature data of CRU TS4.03 Tmin [34] and Hadley Centre HadSST3 global sea surface temperatures (SSTs) [35] to investigate spatial representation.

3. Results

3.1. Relationship between Tree Growth and Climate Factors

Correlation analysis between tree-ring chronology and monthly climate data (Tmean, Tmax, Tmin, and P) revealed the climate–growth relationship at the sampling sites in Luoji Mountain (Figure 4). We found significant negative correlations for Tmax from the previous May to July and for Tmean and Tmin in the prior July. We found significant positive correlations for Tmin in the prior November to the current April and for Tmean in the current January. No significant correlations were found for precipitation. These results indicate that temperature plays a key role in determining tree growth in the region. Therefore, we further analyzed the correlation between the tree-ring chronology and seasonal and yearly temperatures. Results show that the Tmin from the prior November to the current March (pNov–cMar) had the highest correlation (r = 0.62) with tree growth, indicating that winter (pNov–cMar) Tmin is the most critical limiting factor in the study area’s growth of A. georgei.

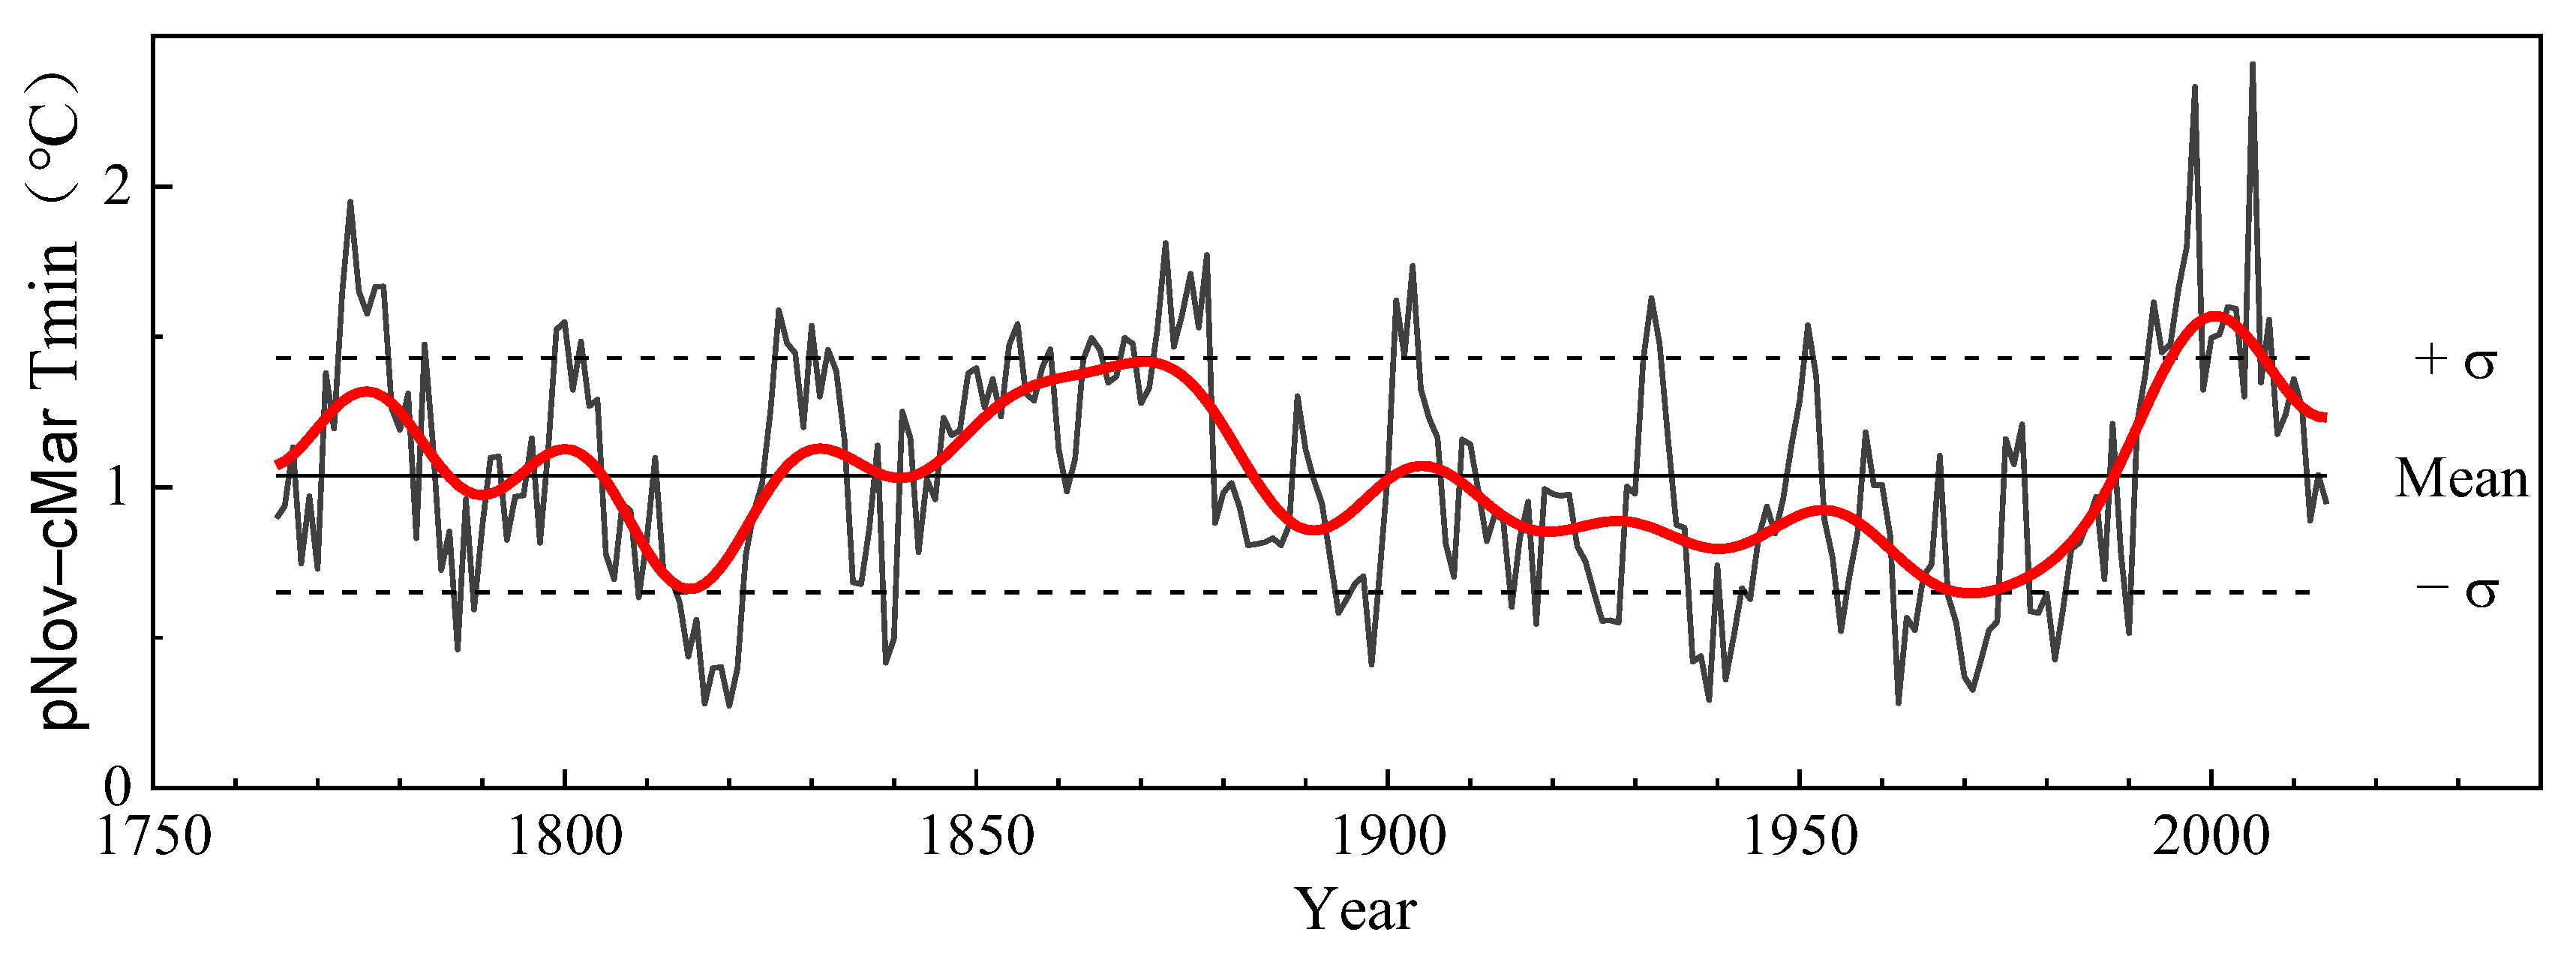
3.2. Winter Mean Minimum Temperature Reconstruction

Based on the above analyses, we used linear regression to reconstruct winter (pNov-cMar) Tmin in the study area. The Tmin reconstruction accounts for 37.8% (36.6% after adjusting for the degree of freedom) of the Tmin variance from 1960 to 2014 (Figure 5a), and the F statistic is 32.21 (p < 0.01). To evaluate the influence of trend on the regression function, we compared the original (Figure 5a), first-order difference (Figure 5b), and residuals of the observed and reconstructed series (Figure 5c). The results showed that the overall trend of the observed and reconstructed series was consistent, and the amplitude fluctuation of the residual series was relatively stable. Therefore, there was high coherence between the original and reconstructed series.
We used the LOOCV method to assess the reliability of the regression model [30]. The correlation coefficient between the observation and LOOCV-generated reconstruction is significantly positive (r = 0.575, p < 0.001), with a range of correlation for each iteration from 0.555 to 0.602. The highly positive RE value of 0.33 and the low RMSE value of 0.64 suggest the model’s reliability. The results of the 10-fold cross-validation procedure further indicate the predictive skill of the model, with a mean bias (MAE) of 0.34, RMSE of 0.58, and EF value of 0.14. The best fitting periods include 1961–1980, 1986–1991, and 2002–2014, which account for 70.9% of the whole instrumental period. Despite that, there are two large fitting gaps in 1981–1985 and 1992–2001 due to extremely low or high temperatures. However, the moving correlation analyses between chronology and pOct-cMay Tmin (Figure 6) for a 30-yr period show that most pNov-cMar Tmin has had significant positive correlations (light to dark red) since 1997.
Overall, there was high agreement between observation and reconstruction, indicating the statistical reliability of our reconstruction.
We reconstructed the winter (pNov–cMar) Tmin in Luoji Mountain from 1765 to 2014 (Figure 7). The mean value and standard deviation (σ) of the reconstruction are 1.04 °C and ± 0.39 °C, respectively. We define extremely warm/cold years as the temperature out of ±1.5 σ from the mean. Accordingly, the extremely warm years (>mean +1.5σ) were 1773–1775, 1777–1778, 1873, 1876, 1878, 1903, 1932, 1996–1998, and 2005. The extremely cold years (<mean −1.5σ) included 1815, 1817–1821, 1839, 1898, 1937–1939, 1941, 1962, 1970–1972, and 1981. In total, there were 14 extremely warm years and 17 extremely cold years, accounting for 5.6% and 6.8% of the past 250 years, respectively.
According to 10-year Fast Fourier Transformation (FFT) smoothed series, five warm periods (1765–1785, 1795–1804, 1827–1883, 1901–1907, 1989–2014) and four cold periods (1786–1794, 1805–1826, 1884–1900, 1908–1988) were identified in the reconstruction (Figure 7). The longest warm and cold periods lasted for 57 and 81 years, respectively.
MTM spectral results indicated several significant periodicities (p < 0.05) at 2.3–2.4a, 3.9a, 4.2a, 8.9–9.7a, and 23.0–28.9a (Figure 8). The wavelet analysis showed that interannual cycles existed for most of the reconstruction period, whereas the 23.0–28.9a cycle was most evident in 1765–1860 (Figure 9). In addition, both MTM and wavelet results indicated marked cycles on the centennial timescale. However, these results should be interpreted with caution since the reconstruction only covers the past 250 years.

4. Discussion

4.1. Climate-Tree Growth Relationships

Figure 4 shows that the radial growth of A. georgei had a similar response pattern to Tmean, Tmax, and Tmin. Among them, the most significant correlations were found with Tmin in the prior November to the current March (pNov–cMar). Meanwhile, the influence of precipitation on tree radial growth was weak, with no significant correlations identified between the prior and current years. Therefore, temperature was the major limiting factor in tree radial growth in the subalpine areas of Luoji Mountain. Similar results have been reported in many studies on the Eastern Tibetan Plateau [24,36,37,38], indicating coniferous trees’ coherent response to winter temperatures in the region.
From the perspective of plant physiology, low temperatures in winter may freeze liquid water inside tree tissues, causing cell dehydration and destroying cell membranes [39,40,41]. On the other hand, low temperatures freeze the soil and reduce internal water content, thereby increasing the roots’ resistance to water absorption or causing them to freeze to death [40,41,42]. Furthermore, they reduce the length of the growing season the following year [43]. Higher temperatures in winter can promote early cambium activity of trees, accelerate the melting of snow on shady slopes, and reduce the hazard of trees suffering from frost [12,21]. The temperatures in this area are low in November and tree growth basically stops. However, there are still weak physiological activities. Higher winter temperatures can promote photosynthesis and storage of organic matter, extend the growing season, and lay the foundation for tree growth the following year. Previous studies demonstrated that minimum temperature is a dominant control factor for fir growth in the Southeastern Tibetan Plateau [34,44].
Owing to higher altitudes and a climate featuring cool humid summers and cold dry winters, higher winter temperatures are generally beneficial to tree growth in the Eastern Tibetan Plateau. In fact, A. georgei is a shade-tolerant, cold-resistant species that prefers a cold and humid climate and grows in high-altitude areas (3400–4200 m). The coldest month in the growing environment can be <−3 °C; therefore, it responds well to temperature. The monthly average Tmin from the previous November to the current March in this area can barely meet the minimum temperature requirements for A. georgei, which helps extend the growth period of A. georgei to a certain extent and allows more time for nutrient storage. The same conclusion was reached for Picea likiangensis in Southwest Sichuan [24] and Abies chensiensis in Jiuzhaigou [22], both located in the Eastern Tibetan Plateau.

4.2. Spatial Representation of the Reconstruction

To assess the spatial representation of winter Tmin reconstructions, we determined spatial correlations between instrumental and reconstructed Tmin series with the 0.5° × 0.5° CRU gridded TS4.03 Tmin. Our results showed a similar spatial correlation pattern between instrumental and reconstructed Tmin series, albeit fewer correlations for the reconstructed series (Figure 10). Regions with high correlations (r > 0.5) are largely concentrated in the Southeastern Tibetan Plateau and Southwest China, suggesting that winter Tmin reconstructions can represent major features of Tmin in these regions [16].
To verify the winter Tmin reconstruction, we compared it to the annual Tmean reconstruction of the Southeastern Tibetan Plateau [16,45], winter Tmin in the Jiuzhaigou region [22], and winter Tmean in the Southeastern Tibetan Plateau [36]. Figure 11 shows similar variations between the four reconstructions, such as the warm periods of 1765–1785, 1798–1804, 1846–1852, 1872–1883, 1901–1907, and 1989–2014 and the cold periods of 1805–1825, 1908–1922, and 1965–1988. Among them, the pronounced warm period of 1989–2014 and the pronounced cold periods of 1806–1825 and 1965–1988 were also revealed in several other studies, such as the August Tmin reconstruction in the Southeastern Tibetan Plateau [46] and the annual Tmin reconstruction in the Eastern Central Tibetan Plateau [3].
The four temperature reconstructions were also consistent with the advance and retreat of the Hailuogou Glaciers on the Eastern Tibetan Plateau [17,47,48,49]. For example, the glaciers were in a relatively stable or advanced stage during the 1900s–1930s, corresponding to sustained low temperatures from 1909 to 1922 in the four reconstructions. From the 1960s to the mid-1980s, the glaciers were relatively stable, corresponding to a low-temperature period from 1965 to 1988 in the reconstructions. Since the mid-1980s, glaciers have been in a stage of serious retreat, coinciding with the pronounced warm period in the four reconstructions. Therefore, the temperature reconstructions based on tree rings were consistent with changes in Hailuogou Glaciers, proving the reliability of our winter Tmin reconstructions.

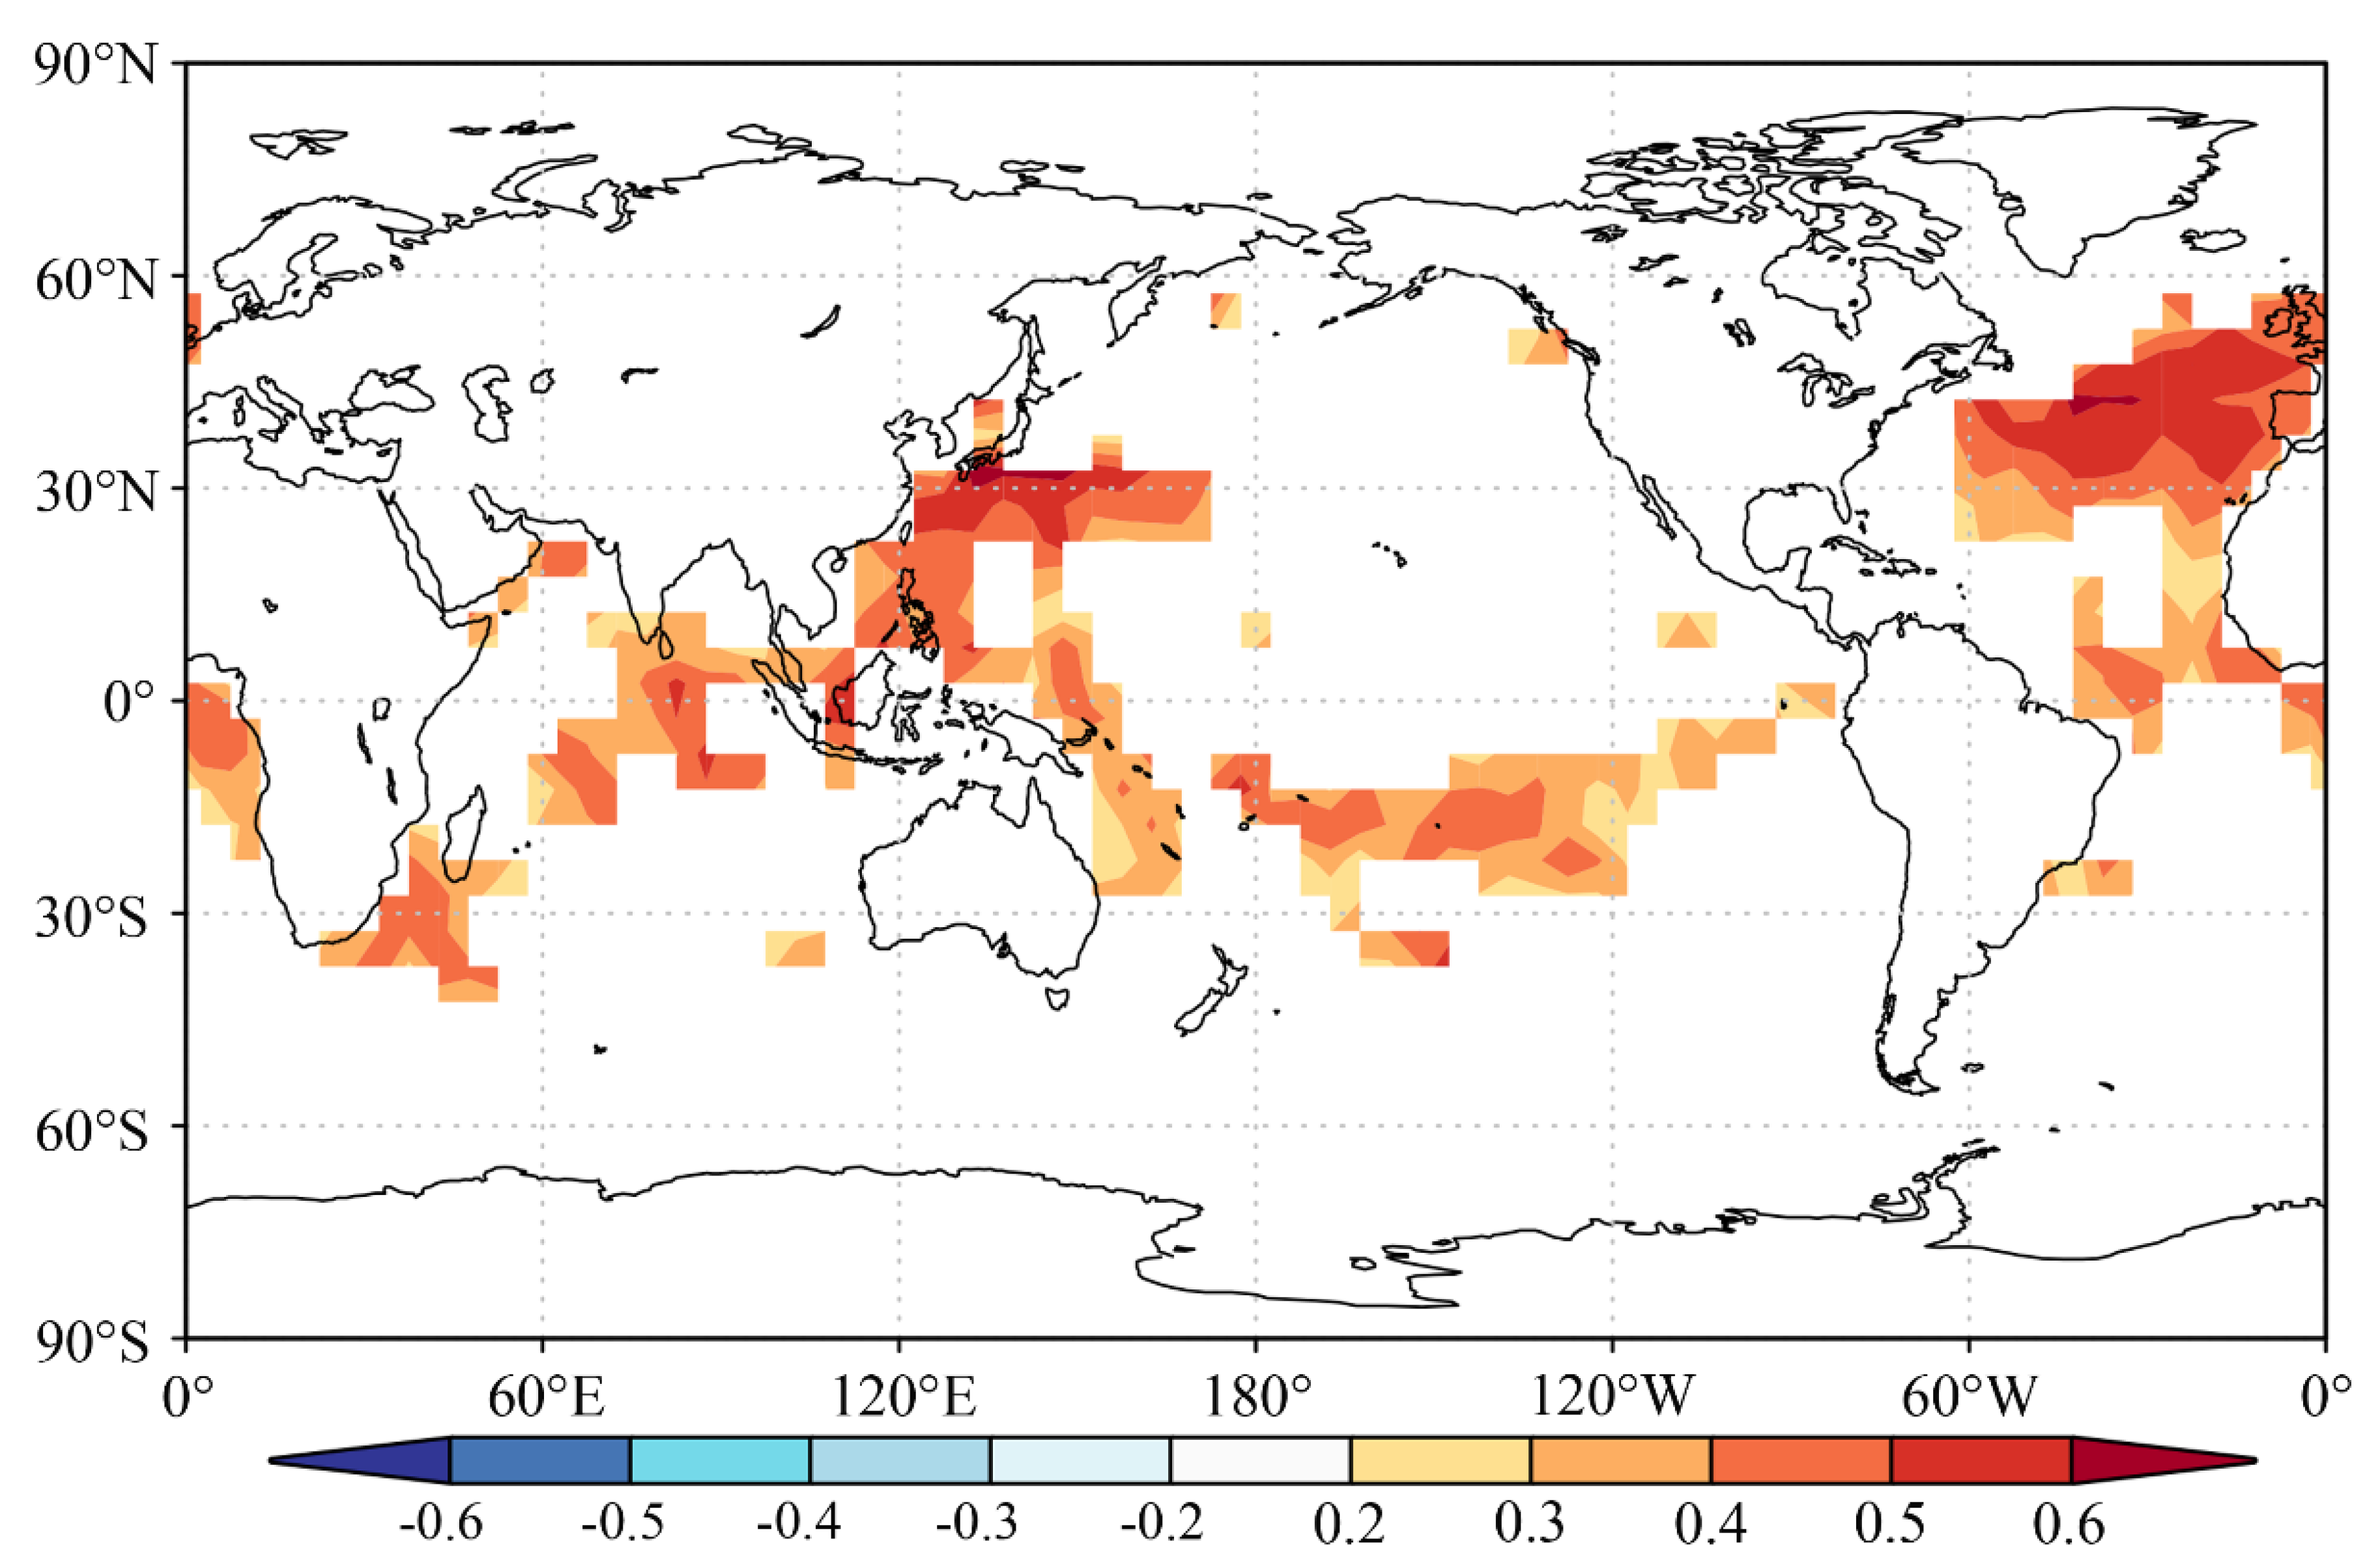
4.3. Possible Driving Mechanisms of the Winter Tmin

The 1817–1821 period was the coldest over the past 250 years and may be related to the tropical eruptions of Mt. Tambora in 1815 [36,50]. During the last cold period (1790–1890) of the Little Ice Age [51], there were three cold periods in our reconstruction, including 1786–1794, 1805–1826, and 1884–1900. Out of these, there were 38 cold years, indicating that this period corresponded well to the last cold period of the Little Ice Age on the hemispheric scale [13,52].
In our Tmin reconstruction, the 2.3–4.2a and 8.9–9.7a cycles were broadly consistent with the 3–7 year cycles of the El Niño/Southern Oscillation (ENSO) [2,12,20,22,23] and 11-year solar activity cycles [18,20], respectively. The 23.0–28.9a cycle may be related to the Pacific Decadal Oscillation (PDO) [53] and/or the Atlantic Multidecadal Oscillation (AMO) [54,55].
The spatial correlations between the reconstructed Tmin and global SSTs from 1960 to 2014 show that winter Tmin in Luoji Mountain was positively correlated with SSTs in the North Atlantic and Western Pacific (Figure 12). There was a strong relationship between the reconstructed Tmin and SSTs in the Pacific and Atlantic oceans, which may be related to internal climate forcing such as ENSO, PDO, and AMO. We calculated the correlations between the reconstructed Tmin and reconstructed ENSO, PDO, and AMO from [56] (http://climexp.knmi.nl/, accessed on 1 June 2023) from 1959 to 2006, and found that winter Tmin was significantly correlated with ENSO (r = 0.425, p < 0.01), PDO (r = 0.643, p < 0.001) and AMO (r = 0.715, p = 0.001). This finding suggests that AMO may crucially influence temperature changes in Luoji Mountain, located on the southeast edge of the Tibetan Plateau, Southwest China. Similar results were found in many regions of the Eastern Tibetan Plateau [2,3,44,57,58] and the Sichuan Basin [59]. North Atlantic SSTs influence the winter temperatures of the Southeastern Tibetan Plateau, suggesting that they are transported via the southern branch of the westerlies separated by the Tibetan Plateau. Nonetheless, the relationship between winter temperatures in the Eastern Tibetan Plateau and AMO remains to be studied through longer paleoclimate reconstructions and process-based modeling.

5. Conclusions

In this study, we developed a ring-width chronology of A. georgei using 138 cores of 66 trees from two sampling sites in Luoji Mountain on the southeast edge of the Tibetan Plateau, Southwest China. Based on the climate–growth relationship, we reconstructed the area’s winter (pNov-cMar) Tmin change from 1765 to 2014. Our reconstruction shows high agreement with other tree-ring-based temperature reconstructions as well as the Hailuogou Glaciers’ advance and retreat records in the Eastern Tibetan Plateau, which verify the reliability of our reconstruction. Our reconstruction revealed several major warm/cold periods in Luoji Mountain over the past 250 years that are generally consistent with the positive/negative phases of the AMO, suggesting that the AMO may strongly influence multidecadal temperature changes in the Southeastern Tibetan Plateau. Future work should explore older trees in Luoji Mountain and maximize the potential of reconstructing long-term climate change in the area. In this way, its link to the AMO can be explored further back in time.

Author Contributions

Formal analysis, J.P. and J.L. (Jingru Li); Investigation, T.L.; Resources, J.L. (Jingru Li) and T.L.; Writing—original draft, J.P. and J.L. (Jingru Li); Validation, T.L.; Writing—review & editing, J.L. (Jinbao Li). All authors have read and agreed to the published version of the manuscript.

Funding

This research was funded by the National Key Research and Development Program of China (No. 2018YFA0605601), Hong Kong Research Grants Council (No. 106220169), and National Natural Science Foundation of China (No. 42077417; 42105155; 41671042).

Data Availability Statement

Data available on request due to restrictions eg privacy or ethical.

Conflicts of Interest

The authors declare no conflict of interest.

References

  1. IPCC. Climate Change 2021: The Physical Science Basis. Contribution of Working Group I to the Sixth Assessment Report of the Intergovernmental Panel on Climate; Masson-Delmotte, V., Zhai, P., Pirani, A., Connors, S.L., Péan, C., Berger, S., Caud, N., Chen, Y., Goldfarb, L., Gomis, M.I., et al., Eds.; Cambridge University Press: Cambridge, UK; New York, NY, USA, 2021. [Google Scholar]
  2. Zhu, L.J.; Zhang, Y.D.; Li, Z.S.; Guo, B.D.; Wang, X.C. A 368-year maximum temperature reconstruction based on tree-ring data in the northwestern Sichuan Plateau (NWSP), China. Clim. Past 2016, 12, 1485–1498. [Google Scholar] [CrossRef] [Green Version]
  3. Li, T.; Li, J.B. A 564-year annual minimum temperature reconstruction for the east central Tibetan Plateau from tree rings. Glob. Planet. Chang. 2017, 157, 165–173. [Google Scholar] [CrossRef]
  4. Song, Y.; Wang, C.; Linderholm, H.W.; Tian, J.; Shi, Y.; Xu, J.; Liu, Y. Agricultural adaptation to global warming in the Tibetan Plateau. Int. J. Environ. Res. Public Health 2019, 16, 3686. [Google Scholar] [CrossRef] [PubMed] [Green Version]
  5. You, Q.L.; Kang, S.C.; Aguilar, E.; Yan, Y.P. Changes in daily climate extremes in the eastern and central Tibetan Plateau during 1961–2005. J. Geophys. Res. 2008, 113, D07101. [Google Scholar] [CrossRef] [Green Version]
  6. Fritts, H.C. Tree Rings and Climate; Academic Press: New York, NY, USA, 1976. [Google Scholar]
  7. Schweingruber, F.H. Tree Rings and Environment Dendroecology; Paul Haupt Publishers: Bern, Switzerland, 1996. [Google Scholar]
  8. Shao, X.M. Advancements in Dendrochronology. Quat. Sci. 1997, 17, 265–271. [Google Scholar]
  9. Gou, X.H.; Deng, Y.; Chen, F.H.; Yang, M.X.; Fang, K.Y.; Gao, L.L.; Yang, T.; Zhang, F. Tree ring based streamflow reconstruction for the upper Yellow River over the past 1234 years. Chin. Sci. Bull. 2010, 55, 4179–4186. [Google Scholar] [CrossRef]
  10. Peng, J.F.; Liu, Y.Z.; Wang, T. A tree-ring record of 1920’s–1940’s droughts and mechanism analyses in Henan Province. Acta Ecol. Sin. 2014, 34, 3509–3518. [Google Scholar]
  11. Duan, J.P.; Wang, L.L.; Li, L.; Chen, K.L. Temperature variability since A.D. 1837 inferred from tree-ring maximum density of Abies fabric in Gongga Mountains, China. Chin. Sci. Bull. 2010, 55, 1036–1042. [Google Scholar] [CrossRef]
  12. Li, Z.S.; Liu, G.H.; Zhang, Q.B.; Hu, S.J.; Liu, X.L.; He, F. Tree ring reconstruction of summer temperature variations over the past 159 years in Wolong National Natural Reserve, western Sichuan, China. Chin. J. Plant Ecol. 2010, 34, 628–641. [Google Scholar]
  13. Yu, S.L.; Yuan, Y.J.; Wei, W.S.; Zhang, T.W.; Shang, H.M.; Chen, F. Reconstructed Mean Temperature in Mearkang, West Sichuan in July and Its Detection of Climatic Period Signal. Plateau Meteorol. 2012, 31, 193–200. [Google Scholar]
  14. Xiao, D.M.; Qin, N.S.; Li, J.J.; Li, Y.Y. Variations of June air temperature derived from tree-ring records in 1713–2010 in Jinchuan, west Sichuan Plateau, China. Adv. Clim. Chang. Res. 2013, 9, 252–257. [Google Scholar]
  15. Deng, Y.; Gou, X.H.; Gao, L.L.; Yang, T.; Yang, M.X. Early summer temperature variations over the past 563 yr inferred from tree rings in the Shaluli Mountains, southeastern Tibet Plateau. Quat. Res. 2014, 81, 513–519. [Google Scholar] [CrossRef]
  16. Li, J.J.; Shao, X.M.; Li, Y.Y.; Qin, N.S. Annual temperature recorded in tree-ring from Songpan region. China Sci. Bull. 2014, 59, 1446–1458. [Google Scholar]
  17. Xiao, D.M.; Qin, N.S.; Huang, X.M. A 325-year reconstruction of July–August mean temperature in the north of west Sichuan derived from tree-ring. Quat. Sci. 2015, 35, 1134–1144. [Google Scholar]
  18. Xiao, D.M.; Qin, N.S.; Li, J.J.; Li, Y.Y.; Mu, L. Change of mean temperature from July to September in northeast of western Sichuan Plateau based tree-ring. Plateau Meteorol. 2015, 34, 762–770. [Google Scholar]
  19. Qin, N.S.; Shi, X.H.; Shao, X.M.; Wang, Q.C. Average maximum temperature change recorded by tree rings in west Sichuan Plateau. Plateau Mt. Meteorol. Res. 2008, 28, 18–23. [Google Scholar]
  20. Xiao, D.M.; Qin, N.S.; Li, J.J.; Li, Y.Y. Change of mean maximum temperature in July during 1506–2008 in Seda of west Sichuan Plateau according to reconstructed tree-ring series. J. Desert Res. 2013, 33, 1536–1543. [Google Scholar]
  21. Shao, X.M.; Fan, J.M. Past climate on west Sichuan Plateau as reconstructed from ring-widths of dragon spruce. Quat. Sci. 1999, 1, 81–89. [Google Scholar]
  22. Song, H.M.; Liu, Y.; Ni, W.M.; Cai, Q.F.; Sun, J.Y.; Ge, W.B.; Xiao, W.Y. Winter mean lowest temperature derived from tree-ring width in Jiuzhaigou region, China since 1750 A. D. Quat. Sci. 2007, 27, 486–491. [Google Scholar]
  23. Yu, S.L.; Yuan, Y.J.; Wei, W.S.; Shang, H.M.; Zhang, T.W.; Chen, F.; Zhang, R.B. Reconstruction of minimum temperature field in June-July during 1787–2005 in the west Sichuan Plateau. J. Desert Res. 2012, 32, 1010–1016. [Google Scholar]
  24. Xie, C.S.; Li, J.J.; Gao, Y.Y.; Shi, S.L.; Peng, P.H.; Yang, X.; Feng, W.N. Tree-ring width based autumn and winter mean temperature reconstruction and its variation over the past 137 years in southwestern Sichuan Province. Quat. Sci. 2020, 40, 252–263. [Google Scholar]
  25. Holmes, R.L. Computer-assisted quality control in tree-ring dating and measurement. Tree-Ring Bull. 1983, 43, 69–78. [Google Scholar]
  26. Cook, E.R.; Kairiukstis, L.A. Methods of Dendrochronology: Applications in the Environmental Sciences; Kluwer: Dordrecht, The Netherlands, 1990. [Google Scholar]
  27. Cook, E.R.; Peters, K. Calculating unbiased tree-ring indices for the study of climatic and environmental change. Holocene 1997, 7, 361–370. [Google Scholar] [CrossRef]
  28. Wigley, T.M.L.; Briffa, K.R.; Jones, P.D. On the average value of correlated time-series, with applications in dendroclimatology and hydrometeorology. J. Clim. Appl. Meteorol. 1984, 23, 201–213. [Google Scholar] [CrossRef]
  29. Biondi, F.; Waikul, K. Dendroclim2002: A C ++ program for statistical calibration of climate signals in tree-ring chronologies. Comput. Geosci. 2004, 30, 303–311. [Google Scholar] [CrossRef]
  30. Michaelsen, J. Cross-validation in statistical climate forecast models. J. Clim. Appl. Meteorol. Climatol. 1987, 26, 1589–1600. [Google Scholar] [CrossRef]
  31. Olson, D.; Delen, D. Advanced Data Mining Techniques; Springer: Berlin, Germany, 2008. [Google Scholar]
  32. Mann, M.E.; Lees, J.M. Robust estimation of background noise and signal detection in climatic time series. Clim. Chang. 1996, 33, 409–445. [Google Scholar] [CrossRef]
  33. Torrence, C.; Compo, G.P. A practical guide to wavelet analysis. Bull. Am. Meteorol. Soc. 1998, 79, 61–78. [Google Scholar] [CrossRef]
  34. Harris, I.; Osborn, T.J.; Jones, P.; Lister, D. Version 4 of the CRU TS monthly high-resolution gridded multivariate climate dataset. Sci. Data 2020, 7, 109. [Google Scholar] [CrossRef] [Green Version]
  35. Kennedy, J.J.; Rayner, N.A.; Smith, R.O.; Saunby MParker, D.E. Reassessing biases and other uncertainties in sea-surface temperature observations since 1850 part 1: Measurement and sampling errors. J. Geophys. Res. 2011, 116, D14103. [Google Scholar] [CrossRef] [Green Version]
  36. Li, X.X.; Liang, E.; Gricar, J.; Prislan, P.; Rossi, S.; Cufar, K. Age dependence of xylogenesis and its climatic sensitivity in Smith fir on the south-eastern Tibetan Plateau. Tree Physiol. 2013, 33, 48–56. [Google Scholar] [CrossRef] [PubMed] [Green Version]
  37. Jin, X.; Xu, Q.; Liu, S.R.; Jiang, C.Q. Responses of the Tree-Ring of Abies faxoniana and Tsuga chinensis to Climate Factors in Sub-Alpine in Western Sichuan. Sci. Silvae Sin. 2013, 49, 21–26. [Google Scholar]
  38. Shi, S.Y.; Li, J.B.; Shi, J.F.; Zhao, Y.S.; Huang, G. Three centuries of winter temperature change on the southeastern Tibetan Plateau and its relationship with Atlantic Multidecadal Oscillation. Clim. Dyn. 2017, 49, 1305–1319. [Google Scholar] [CrossRef] [Green Version]
  39. Pallardy, S.G.; Kozlowski, T.T. Physiology of Woody Plants; Elsevier: Amsterdam, The Netherlands; Boston, MA, USA, 2008. [Google Scholar]
  40. Li, J.X.; Li, J.B.; Li, T.; Au, T.F. Tree growth divergence from winter temperature in the Gongga Mountains, southeastern Tibetan Plateau. Asian Geogr. 2020, 37, 1–15. [Google Scholar] [CrossRef]
  41. Li, J.X.; Li, J.B.; Li, T.; Au, T.F. 351-year tree ring reconstruction of the Gongga Mountains winter minimum temperature and its relationship with the Atlantic Multidecadal Oscillation. Clim. Chang. 2021, 165, 49. [Google Scholar] [CrossRef]
  42. Körner, C. Alpine Treelines: Functional Ecology of the Global High Elevation Tree Limits; Springer: Berlin, Germany, 2012. [Google Scholar]
  43. Gou, X.H.; Chen, F.H.; Jacoby, G.C.; Cook, E.R.; Yang, M.X.; Peng, J.F.; Zhang, Y. Rapid tree growth with respect to the last 400 years in response to climate warming, northeastern Tibetan Plateau. Int. J. Climatol. 2007, 27, 1497–1503. [Google Scholar] [CrossRef]
  44. Liang, E.Y.; Wang, Y.F.; Xu, Y.; Liu, B.; Shao, X.M. Growth variation in Abies georgei var. smithii along altitudinal gradients in the Sygera Mountains, southeastern Tibetan Plateau. Tree 2010, 24, 363–373. [Google Scholar] [CrossRef]
  45. Wang, J.L.; Yang, B.; Qin, C.; Kang, S.Y.; He, M.H.; Wang, Z.Y. Tree-ring inferred annual mean temperature variations on the southeastern Tibetan Plateau during the last millennium and their relationships with the Atlantic Multidecadal Oscillation. Clim. Dyn. 2014, 43, 627–640. [Google Scholar] [CrossRef]
  46. Liang, H.X.; Lyu, L.X.; Wahab, M. A 382-year reconstruction of August mean minimum temperature from tree-ring maximum latewood density on the southeastern Tibetan Plateau, China. Dendrochronologia 2016, 37, 1–8. [Google Scholar] [CrossRef]
  47. Liu, S.Y.; Ding, Y.J.; Li, J.; Shangguan, D.H.; Zhang, Y. Glaciers in response to recent climate warming in Western China. Quat. Sci. 2006, 26, 762–771. [Google Scholar]
  48. Li, Z.X.; He, Y.Q.; Jia, W.X.; Pang, H.X.; Yuan, L.L.; Ning, B.Y.; Liu, Q.; He, X.Z.; Song, B.; Zhang, N.N. Response of “Glaciers-Runoff” system in a typical temperature-glacier, Hailuogou glacier in Gongga Mountain of China to global change. Sci. Geogr. Sin. 2008, 28, 229–234. [Google Scholar]
  49. Li, Z.X.; He, Y.Q.; Jia, W.X.; Pang, H.X.; He, X.Z.; Wang, S.J.; Zhang, N.N.; Zhang, W.J.; Liu, Q.; Xin, H.J. Changes in Hailuogou glacier during the recent 100 years under global warming. J. Glaciol. Geocryol. 2009, 31, 75–81. [Google Scholar]
  50. Stothers, R.B. The great Tambora eruption in 1815 and its aftermath. Science 1984, 224, 1191–1198. [Google Scholar] [CrossRef] [PubMed]
  51. Wang, S.W.; Ye, J.L.; Gong, D.Y. Climate in China during the little ice age. Quat. Sci. 1998, 18(1), 54–64. [Google Scholar]
  52. Yang, B. Spatial and temporal patterns of climate variations over the Tibetan Plateau during the period 1300–2010. Quat. Sci. 2012, 32, 81–94. [Google Scholar]
  53. Mantua, N.J.; Hare, S.R.; Zhang, Y.; Wallace, J.M.; Francis, R.C. A Pacific interdecadal climate oscillation with impacts on salmon production. Bull. Amer. Meteor. Soc. 1997, 78, 1069–1079. [Google Scholar] [CrossRef]
  54. Gray, S.T.; Graumlich, L.J.; Betancourt, J.L.; Pederson, G.T. A tree-ring based reconstruction of the Atlantic Multidecadal Oscillation since 1567 A.D. Geophys. Res. Lett. 2004, 31, L12205. [Google Scholar] [CrossRef]
  55. Trenberth, K.E.; Shea, D.J. Atlantic hurricanes and natural variability in 2005. Geophys. Res. Lett. 2006, 33, L12704. [Google Scholar] [CrossRef] [Green Version]
  56. Mann, M.E.; Zhang, Z.; Rutherford, S.; Bradley, R.S.; Hughes, M.K.; Shindell, D.; Ammann, C.; Faluvegi, G.; Ni, F. Global Signatures and Dynamical Origins of the Little Ice Age and Medieval Climate Anomaly. Science 2009, 326, 1256–1260. [Google Scholar] [CrossRef] [Green Version]
  57. Keyimu, M.; Li, Z.S.; Zhang, G.S.; Fan, Z.X.; Wang, X.C.; Fu, B.J. Tree ring–based minimum temperature reconstruction in the central Hengduan Mountains, China. Theor. Appl. Climatol. 2020, 141, 359–370. [Google Scholar] [CrossRef]
  58. Keyimu, M.; Li, Z.S.; Liu, G.H.; Fu, B.J.; Fan, Z.X.; Wang, X.C.; Wu, X.C.; Zhang, Y.D.; Halik, U. Tree-ring based minimum temperature reconstruction on the southeastern Tibetan Plateau. Quat. Sci. Rev. 2021, 251, 106712. [Google Scholar] [CrossRef]
  59. Fang, K.Y.; Guo, Z.T.; Chen, D.L.; Wang, L.; Dong, Z.P.; Zhou, F.F.; Zhao, Y.; Li, J.B.; Li, Y.J.; Cao, X.G. Interdecadal modulation of the Atlantic Multi-decadal Oscillation (AMO) on southwest China’s temperature over the past 250 years. Clim. Dyn. 2019, 52, 2055–2065. [Google Scholar] [CrossRef]
Figure 1. Location of the sampling sites (flag) and nearby meteorological station (dot).
Forests 14 01555 g001
Figure 2. (a) The regional chronology developed from two sites of A. georgei Orr in Luoji Mountain (black line) and the corresponding sample depth (gray shading). (b) EPS and Rbar plotted for 50-year windows with a 25-year overlap. The vertical dashed line denotes the cut-off point when n ≥ 19 and EPS > 0.85. The horizontal dashed line denotes the theoretical 0.85 threshold value.
Forests 14 01555 g002
Figure 3. Monthly mean (Tmean), maximum (Tmax), minimum (Tmin) temperatures, and total precipitation (P) from Yanyuan meteorological station from 1959 to 2014.
Forests 14 01555 g003
Figure 4. Correlations between standard chronology and (a) monthly mean (Tmean), maximum (Tmax), minimum (Tmin) temperatures, and (b) monthly total precipitation (P) from 1959 to 2014. The dash lines denote the 0.05 significance levels.
Forests 14 01555 g004
Figure 5. Comparison between (a) observed (black solid line) and reconstructed (gray dashed line) Tmin during the common period 1960–2014, (b) first-difference (ditto mark) from 1961 to 2014, and (c) the residuals of the reconstructed minus observed temperature (gray shading).
Forests 14 01555 g005
Figure 6. The moving correlation analyses between chronology and pOct–cMay Tmin for a 30-year period.
Forests 14 01555 g006
Figure 7. Tree-ring-based winter Tmin reconstructions from 1765 to 2014. The red bold line denotes a 10-year FFT smoothed curve. The horizontal solid line and dashed line indicate the mean value and standard deviation, respectively.
Forests 14 01555 g007
Figure 8. Multi-taper method (MTM) spectral results of the reconstructed winter Tmin from 1765 to 2014. The red line and dashed line denote the 95% and 90% confidence levels, respectively.
Forests 14 01555 g008
Figure 9. Wavelet results of the reconstructed winter Tmin from 1765 to 2014.
Forests 14 01555 g009
Figure 10. Spatial correlation results between instrumental (a) and reconstructed (b) Tmin with CRU TS4.03 Tmin (1960–2014). The black dot denotes the location of the sampling sites.
Forests 14 01555 g010
Figure 11. Comparison between (a) the annual Tmean reconstruction on the Southeastern Tibetan Plateau [45]; (b) winter Tmin reconstruction of Luoji Mountain (this study); (c) winter Tmin reconstruction of the Jiuzhaigou region [22]; (d) winter Tmean reconstruction in the Southeastern Tibetan Plateau [36] All temperature series (thin black) and their 10-year FFT smoothing (thick red line) are shown. Light/gray shading denotes cold/warm periods in the temperature series.
Forests 14 01555 g011
Figure 12. Spatial correlation between the reconstructed Tmin and global SSTs from 1960 to 2014.
Forests 14 01555 g012
Table 1. Statistics of the two tree-ring sampling sites.
Site CodeLatitude (N)Longitude (E)Elevation (m)Number (Cores/Trees)Time Span (AD)
LJH27°34′24.4″102°22′28.4″389070/331638~2014
LJS27°34′32.7″102°21′49.6″389068/331673~2014
Table 2. Statistical characteristics of tree-ring STD chronology.
StatisticsSTD
Samples (core/tree)138/66
Mean sensitivity (MS)0.121
Standard deviation (SD)0.193
Time span (year)1638~2014
Time span with EPS > 0.85 (year)1765~2014
Common period (year)1904~2014
Mean inter-series correlation (R1)0.149
Mean correlation within a tree (R2)0.611
Mean correlation between trees (R3)0.145
First-order autocorrelation (AC1)0.777
Signal-to-noise ratio (SNR)21.032
Expressed population signal (EPS)0.955
Disclaimer/Publisher’s Note: The statements, opinions and data contained in all publications are solely those of the individual author(s) and contributor(s) and not of MDPI and/or the editor(s). MDPI and/or the editor(s) disclaim responsibility for any injury to people or property resulting from any ideas, methods, instructions or products referred to in the content.

