
New Technologies for Expedited Forest Inventory Using Smartphone Applications

 ,
,  , , and
Abstract
1. Introduction
2. Materials and Methods
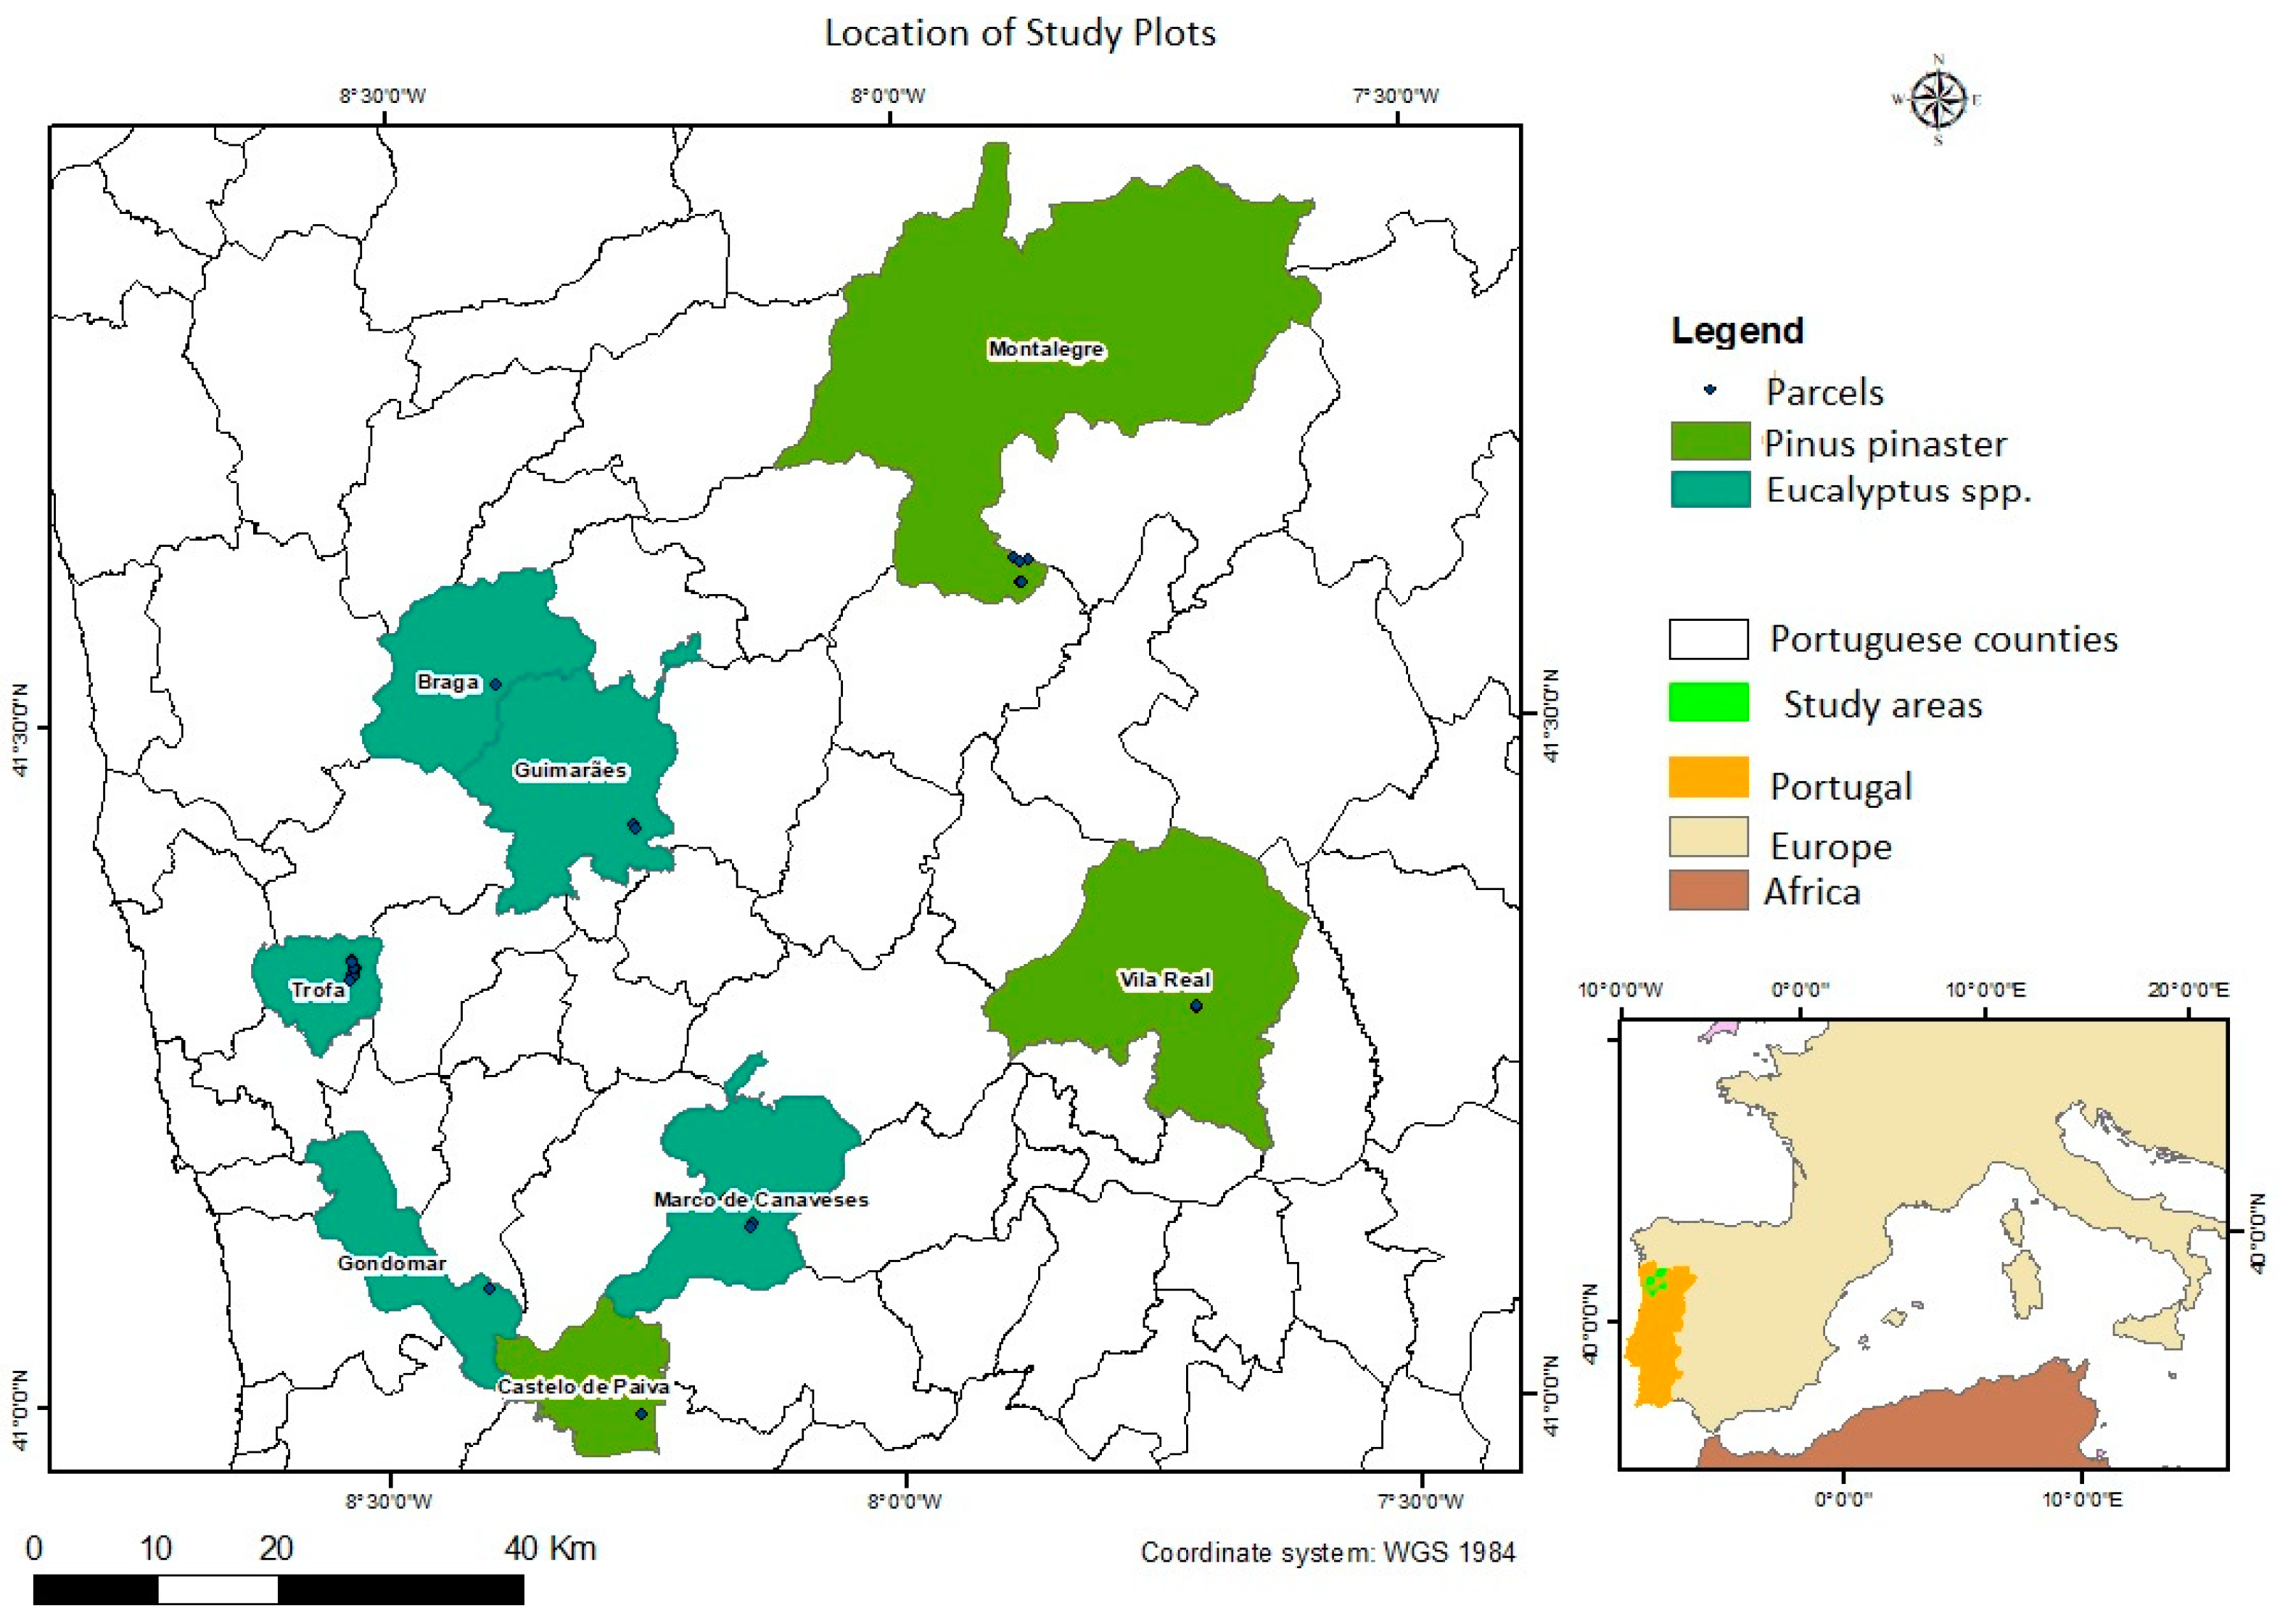
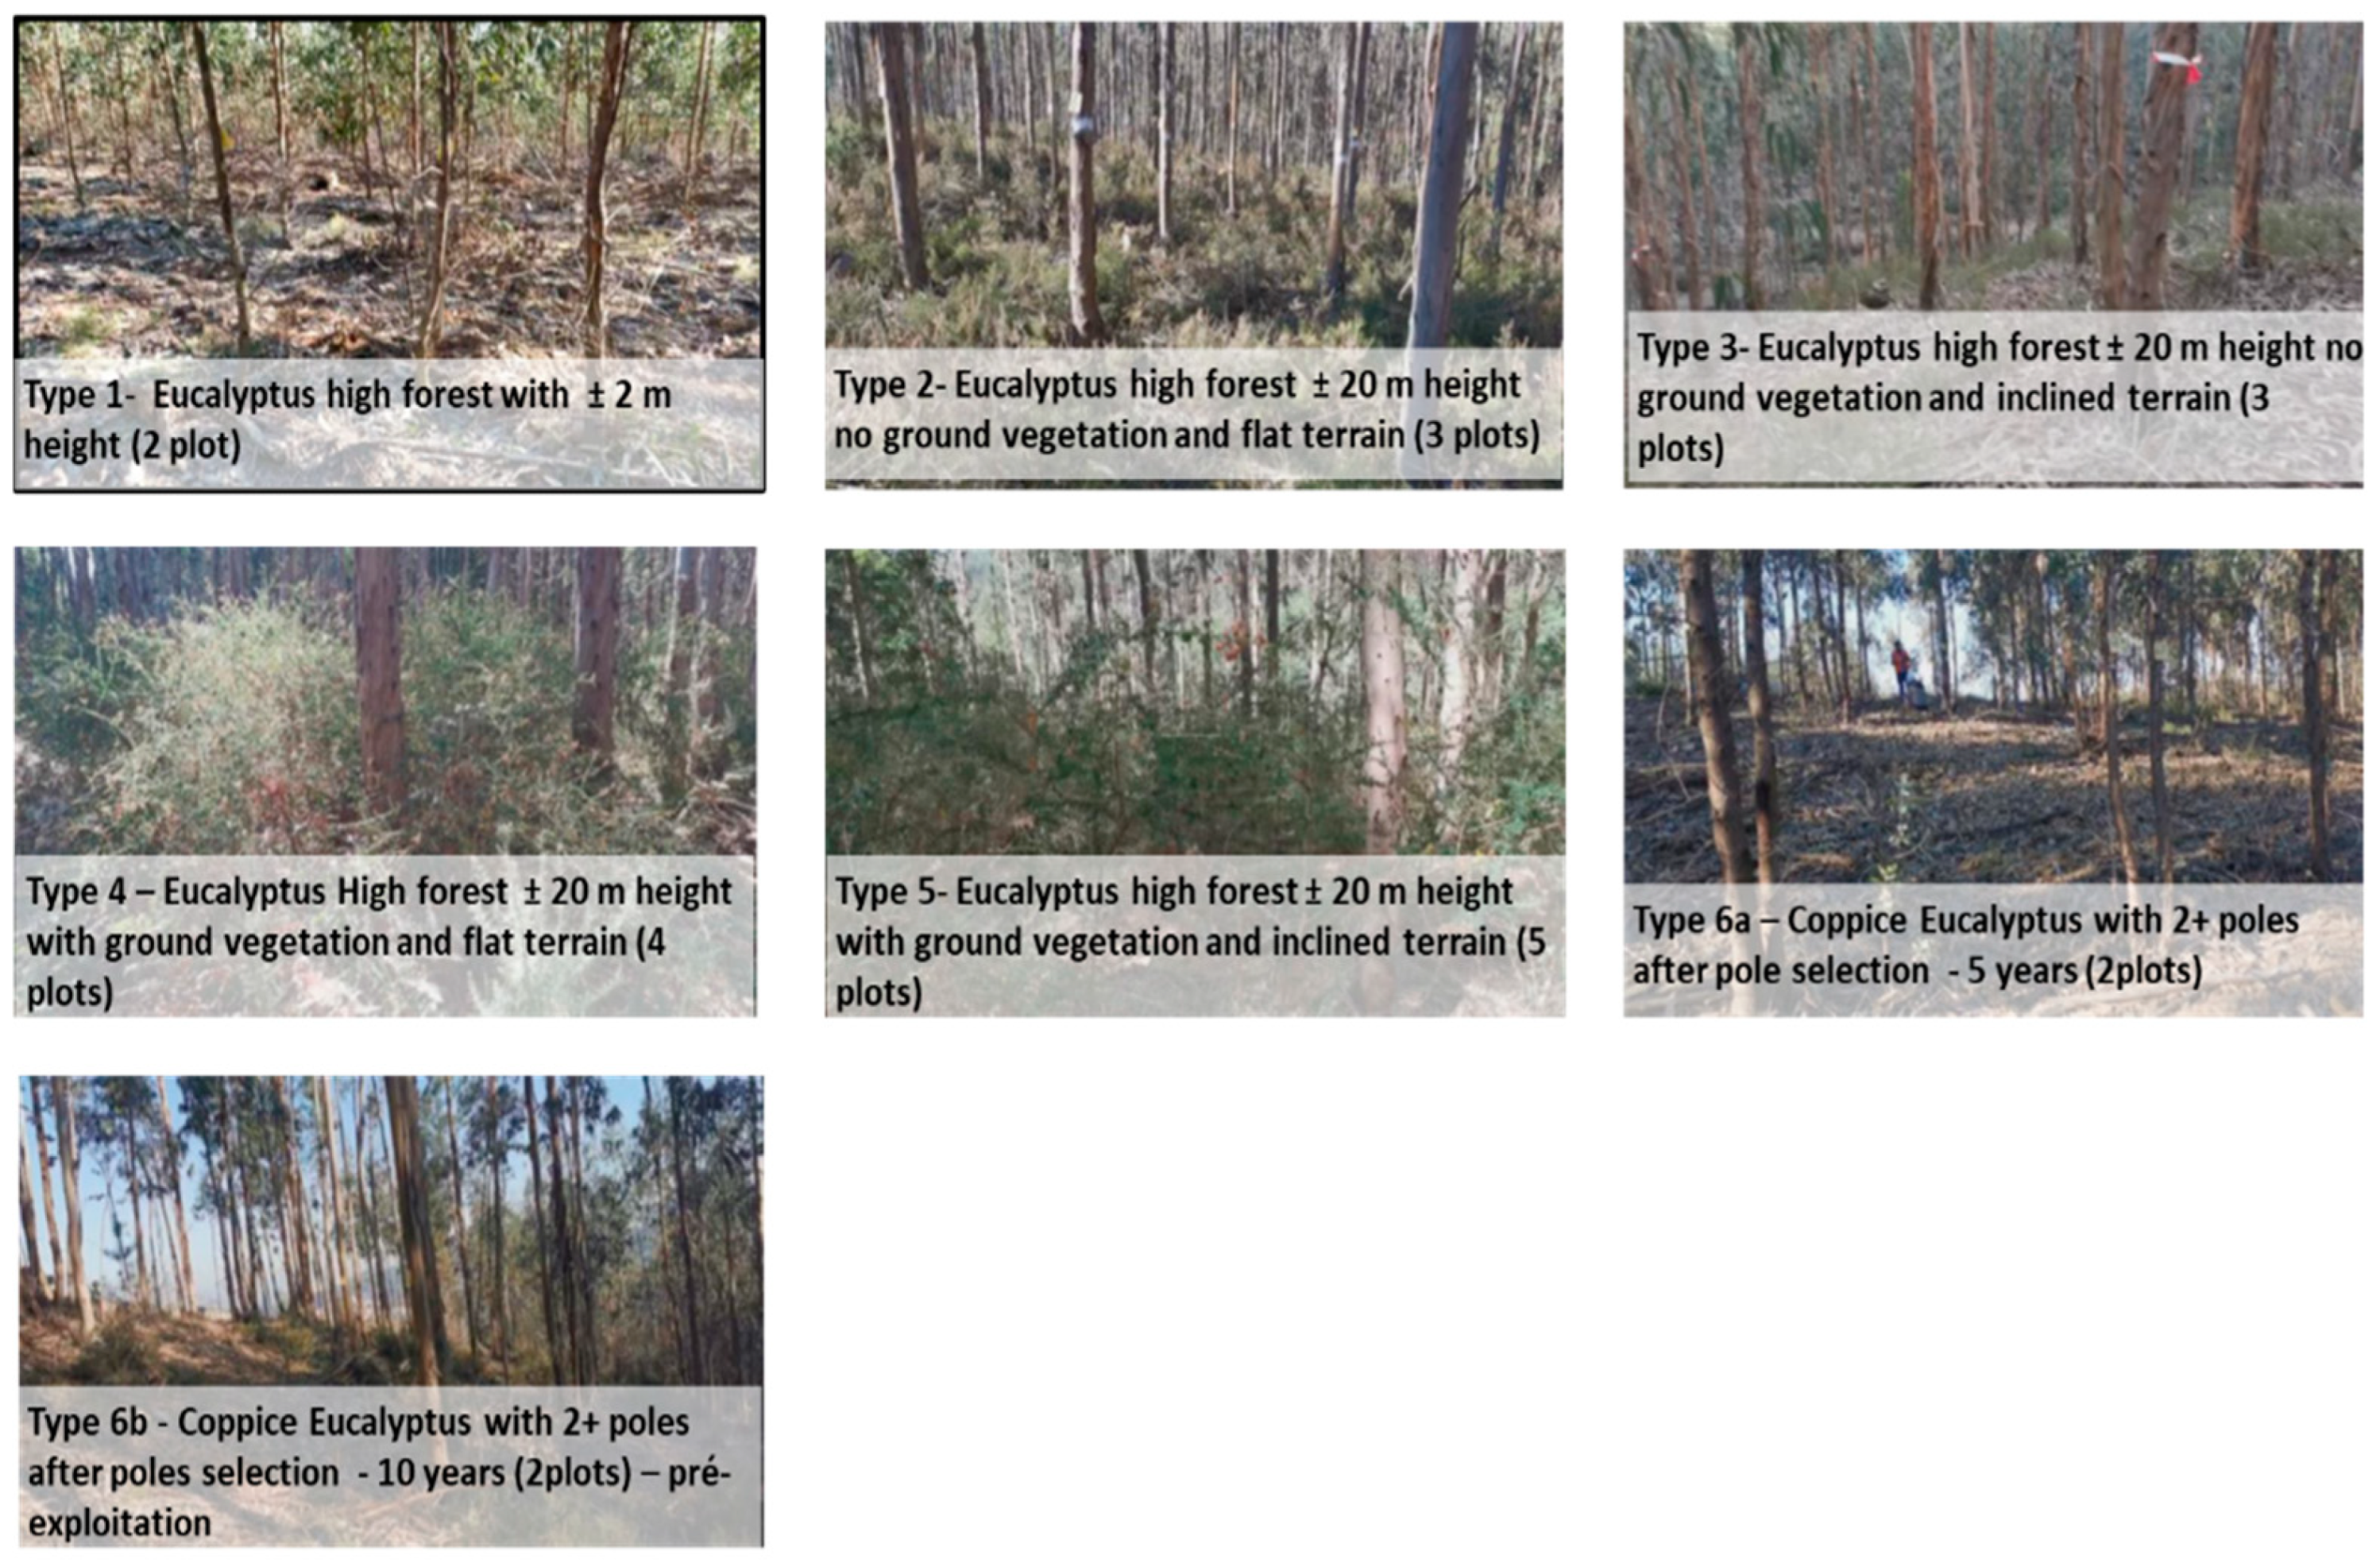
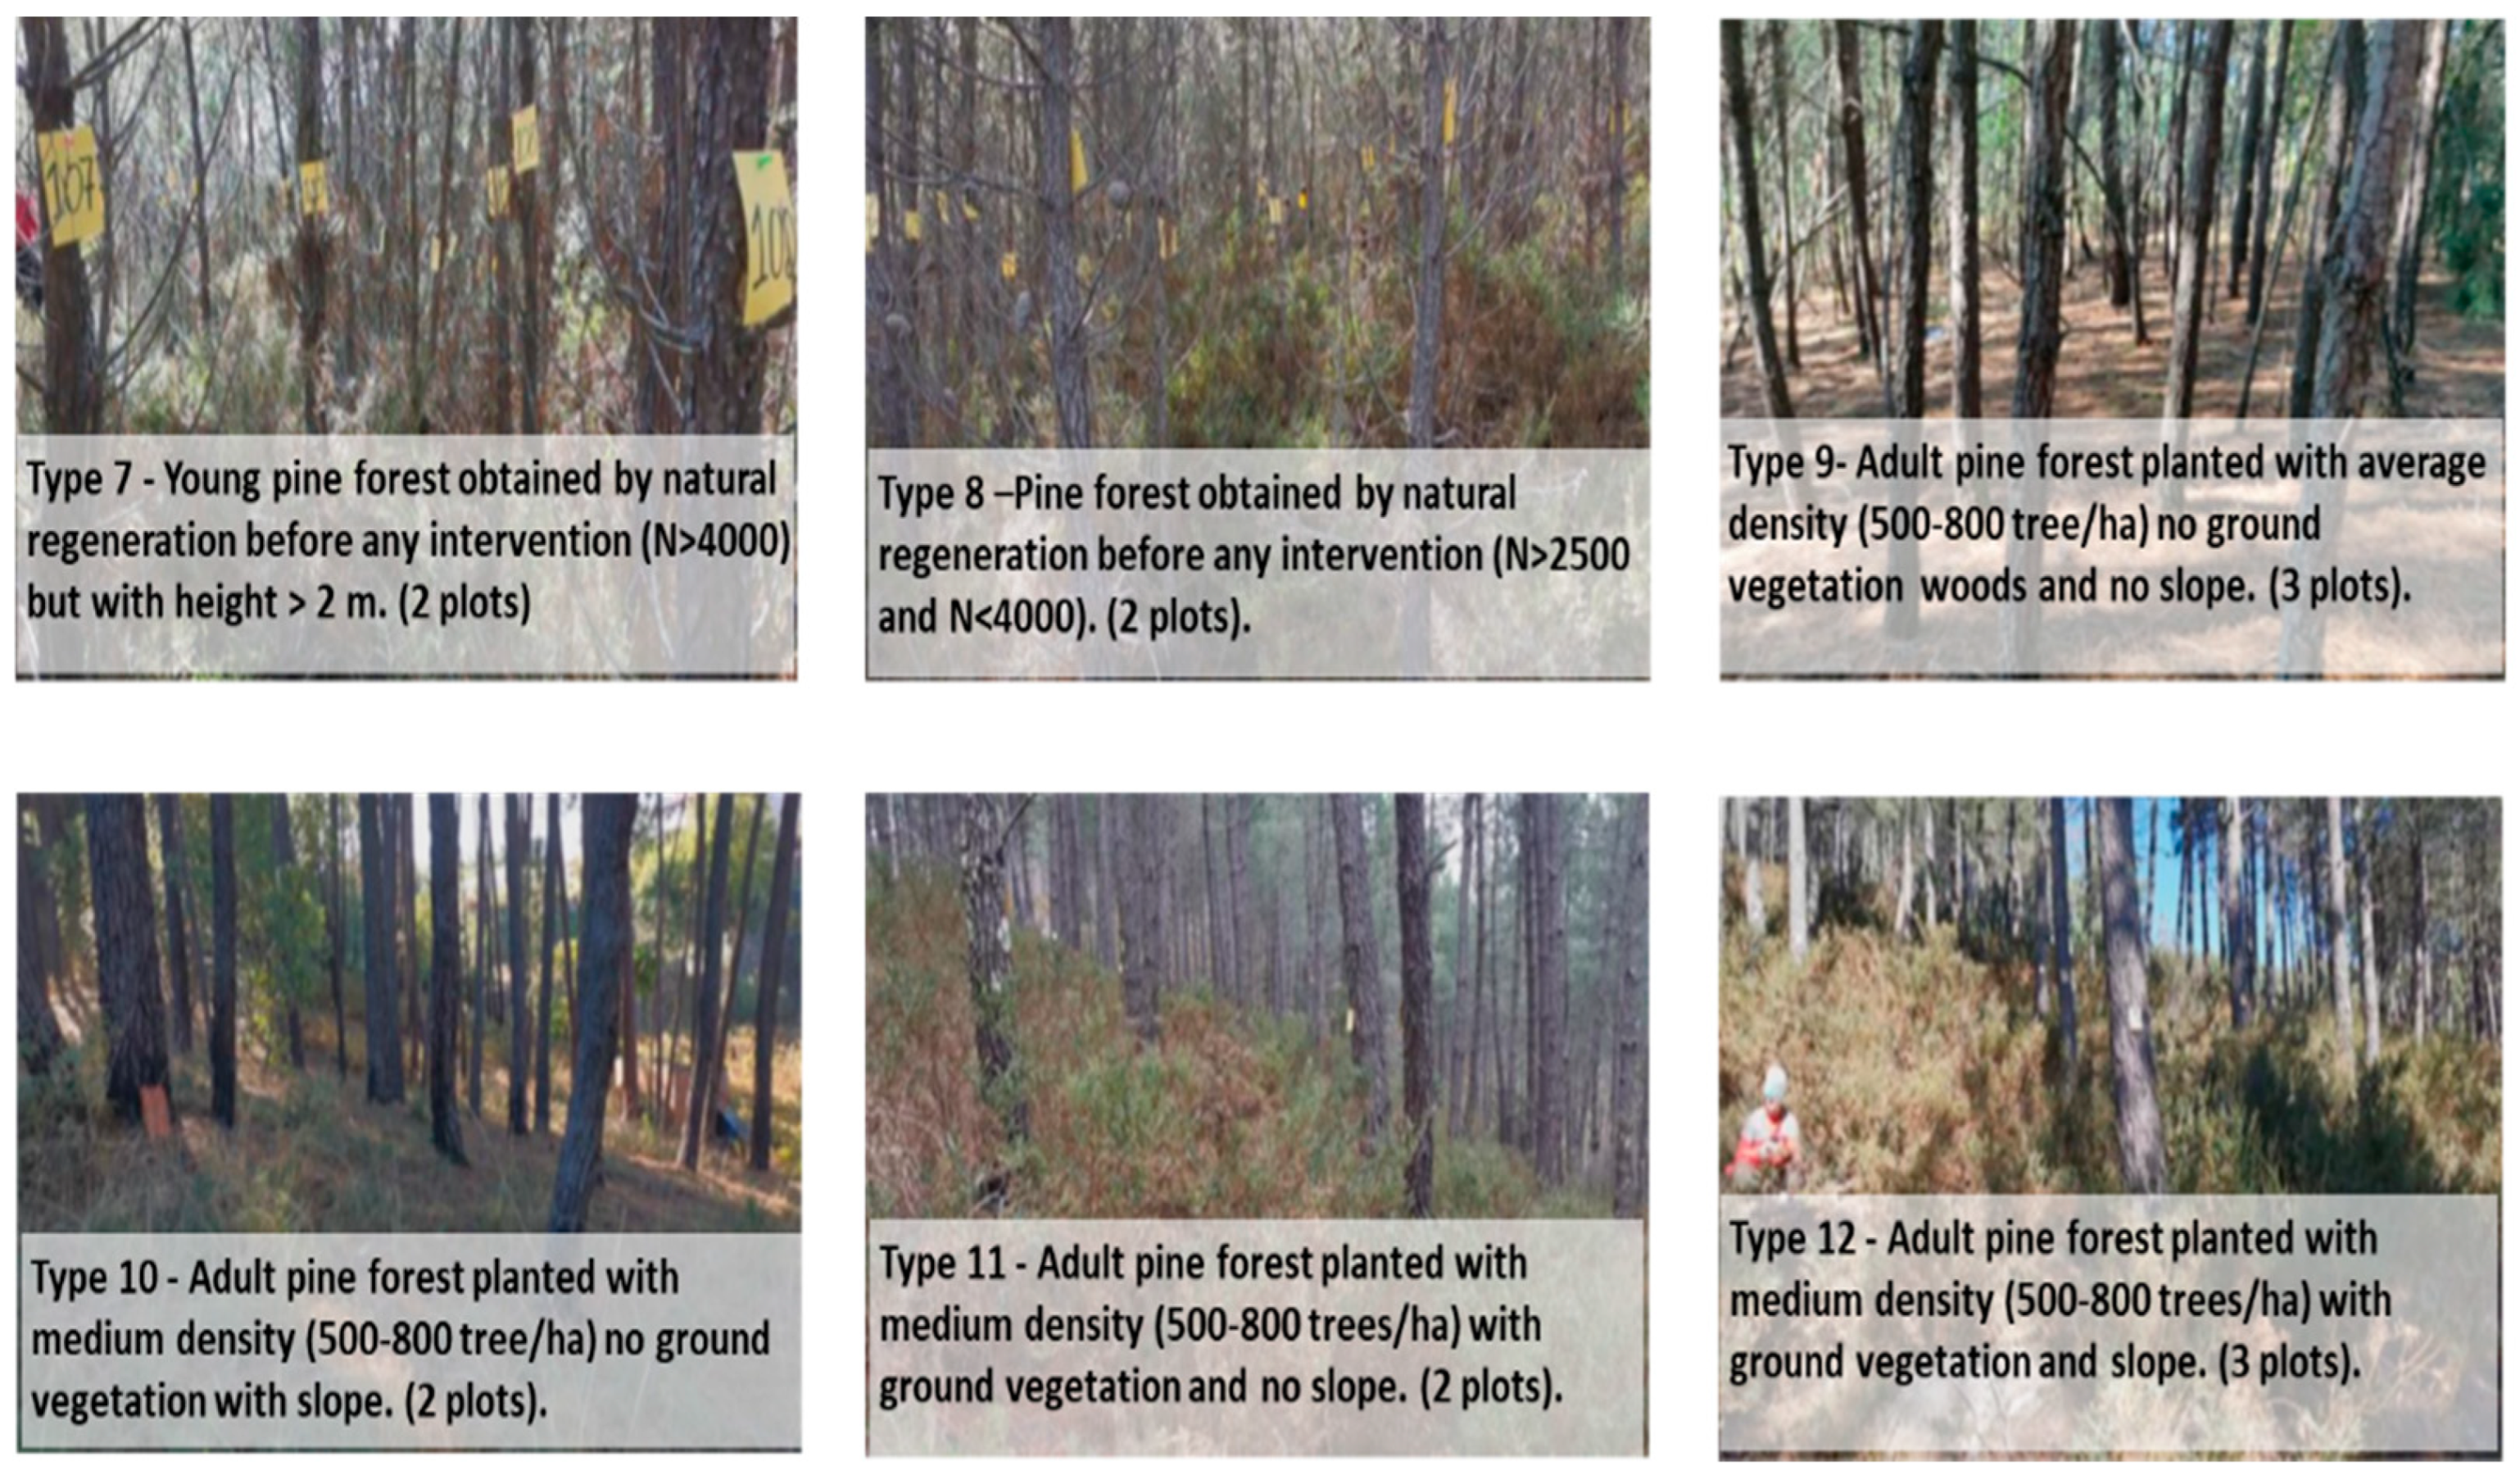
2.1. Study Area
2.2. Data Collection
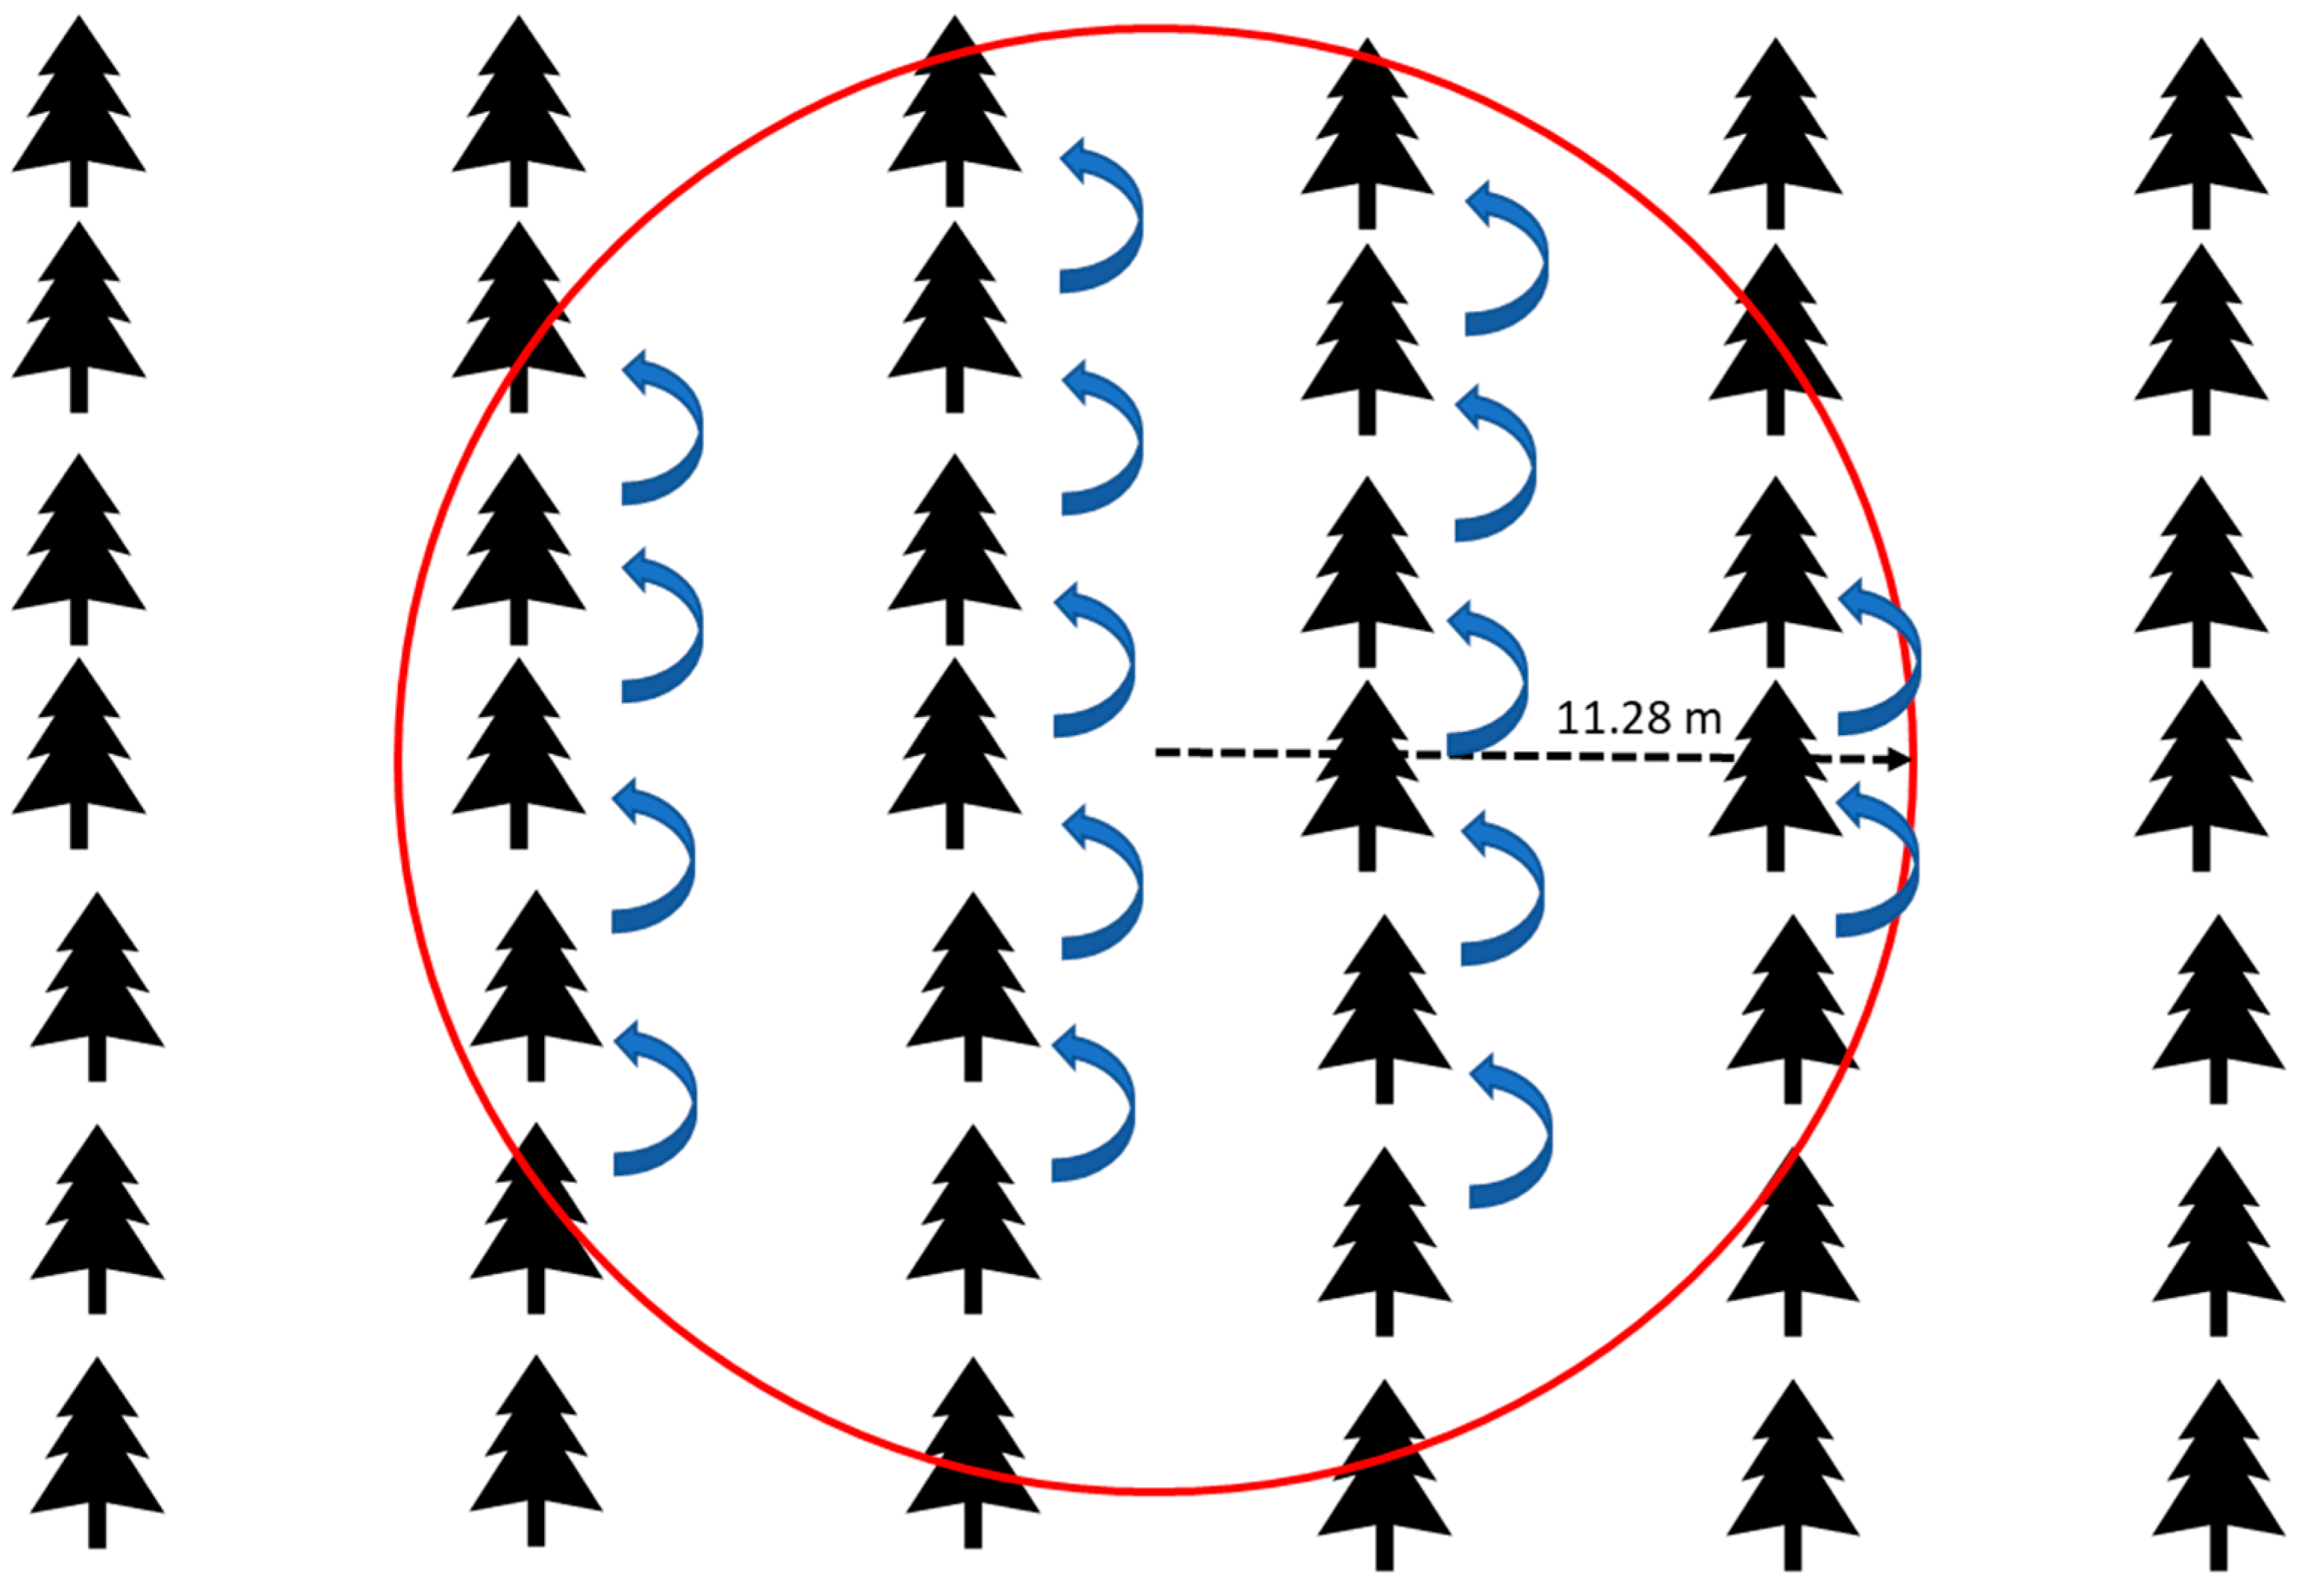
2.2.1. Traditional Method
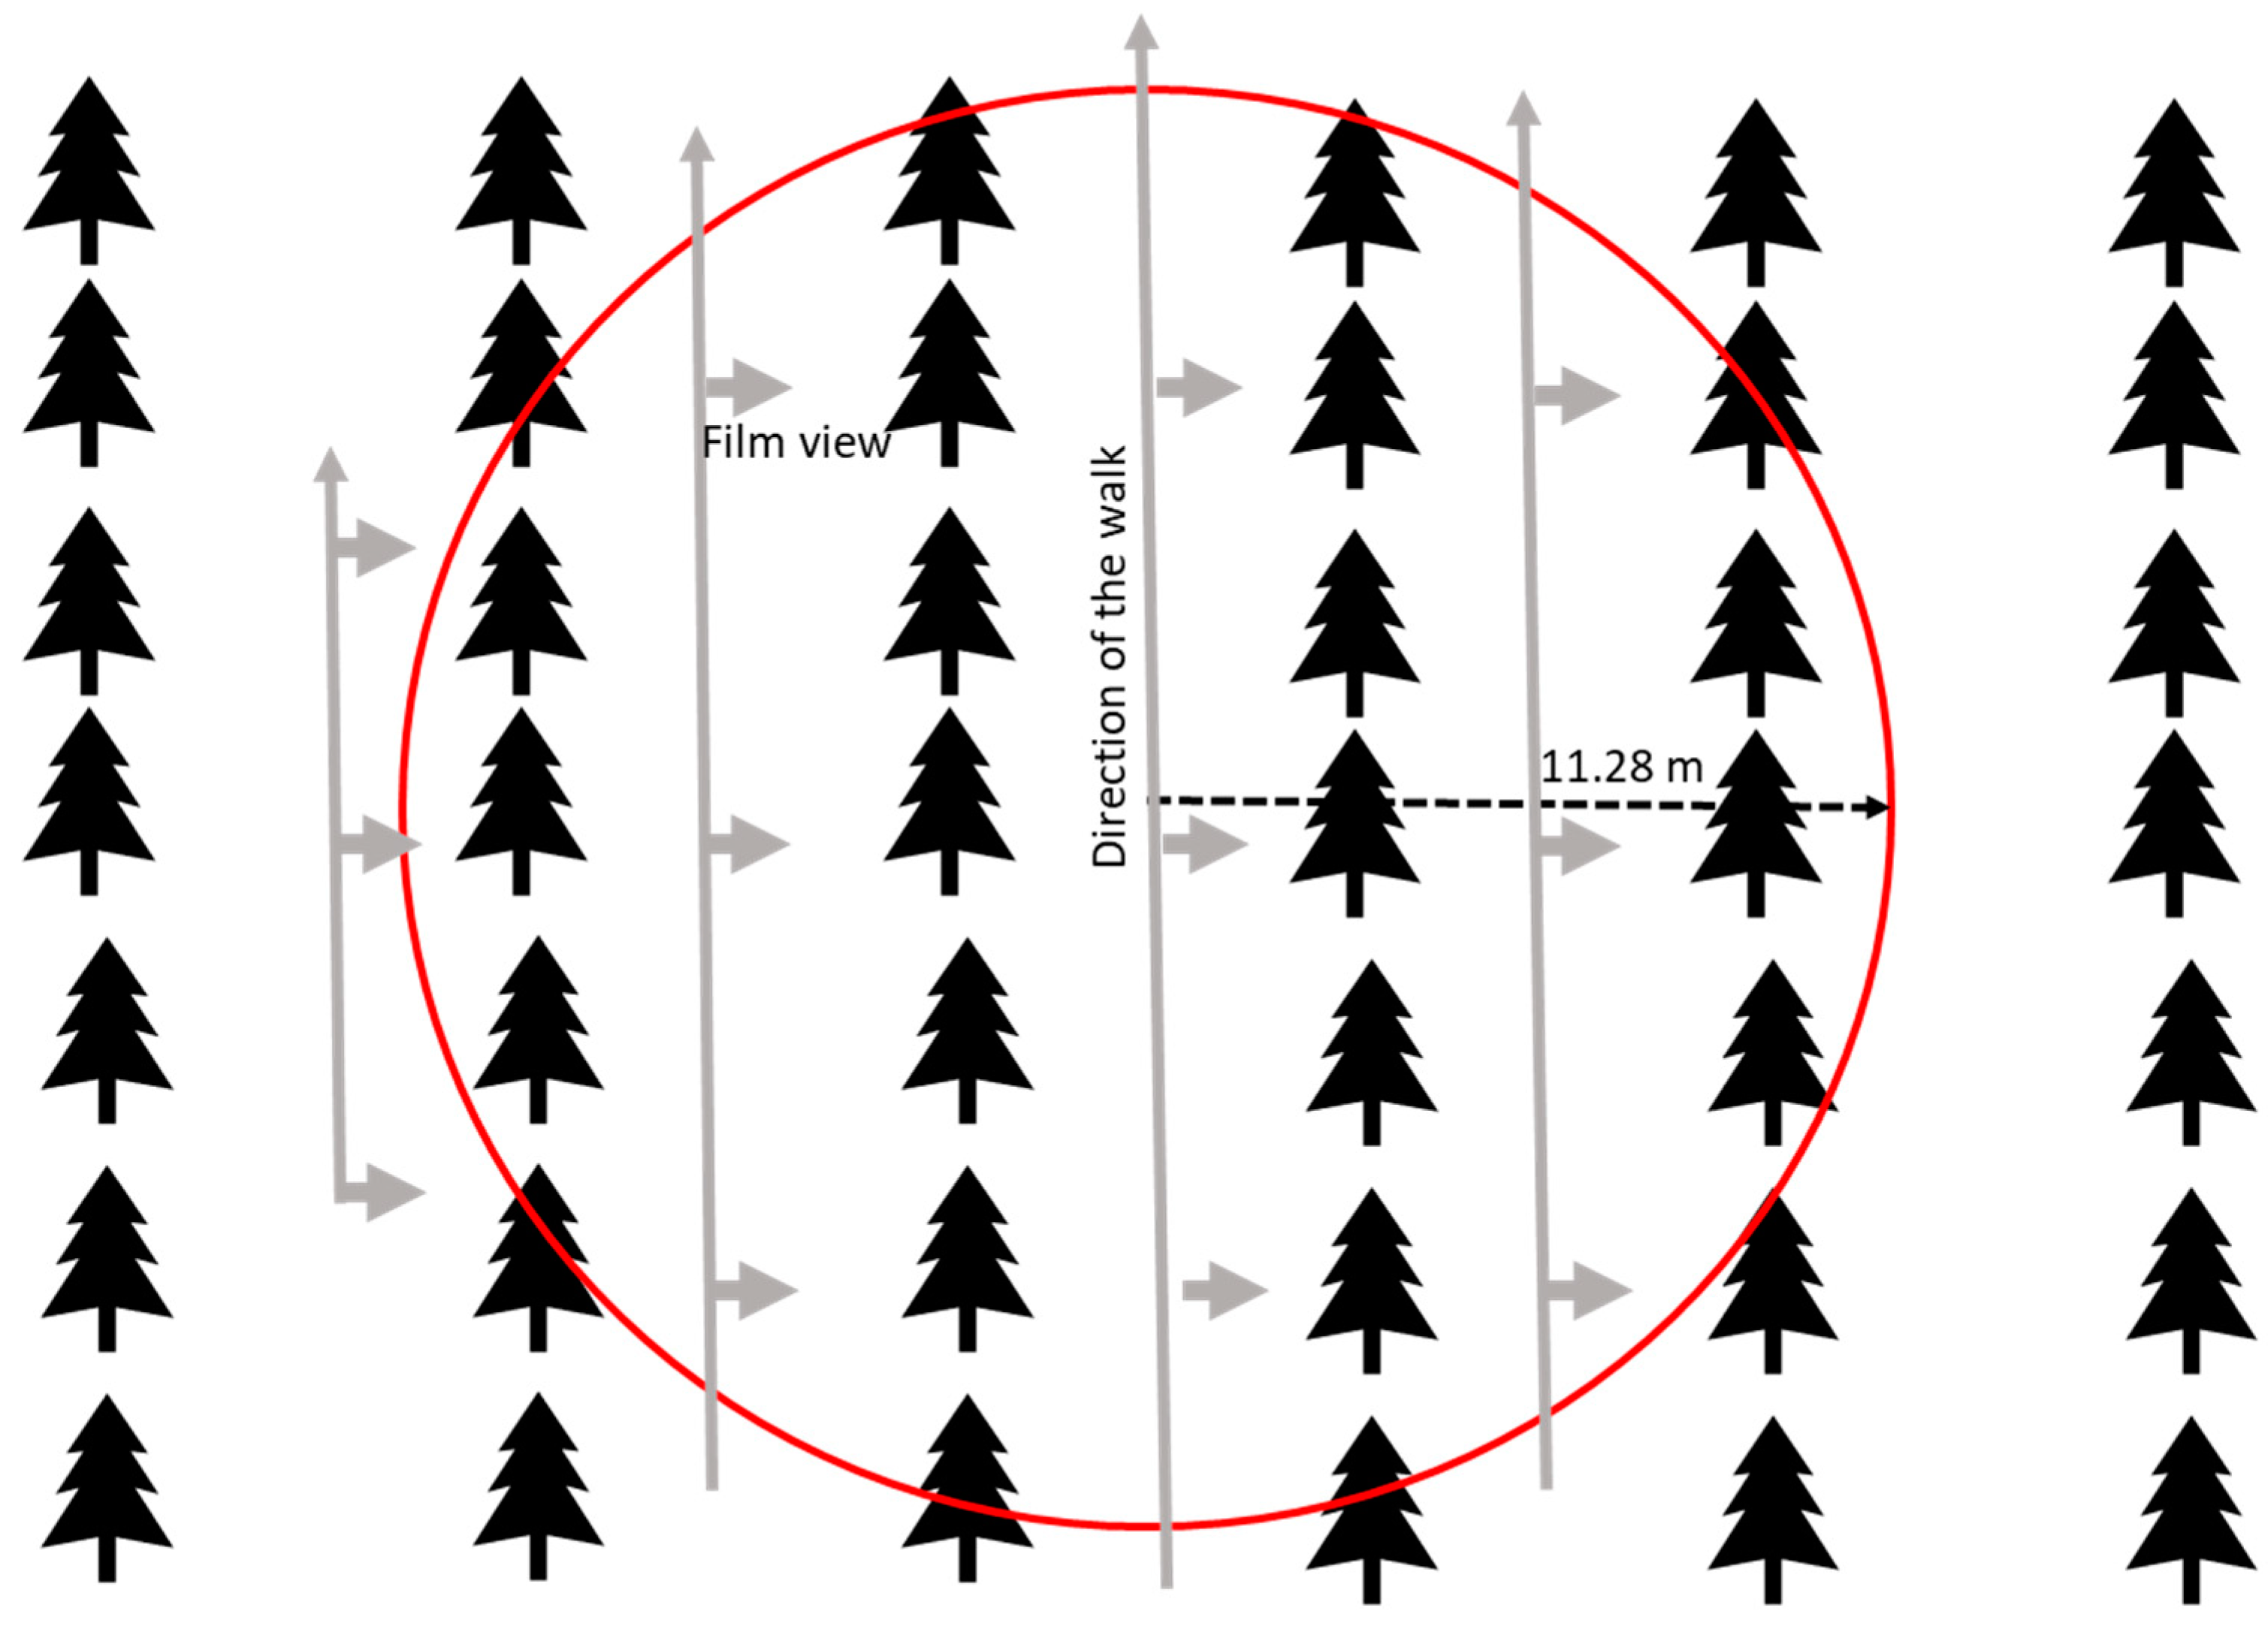
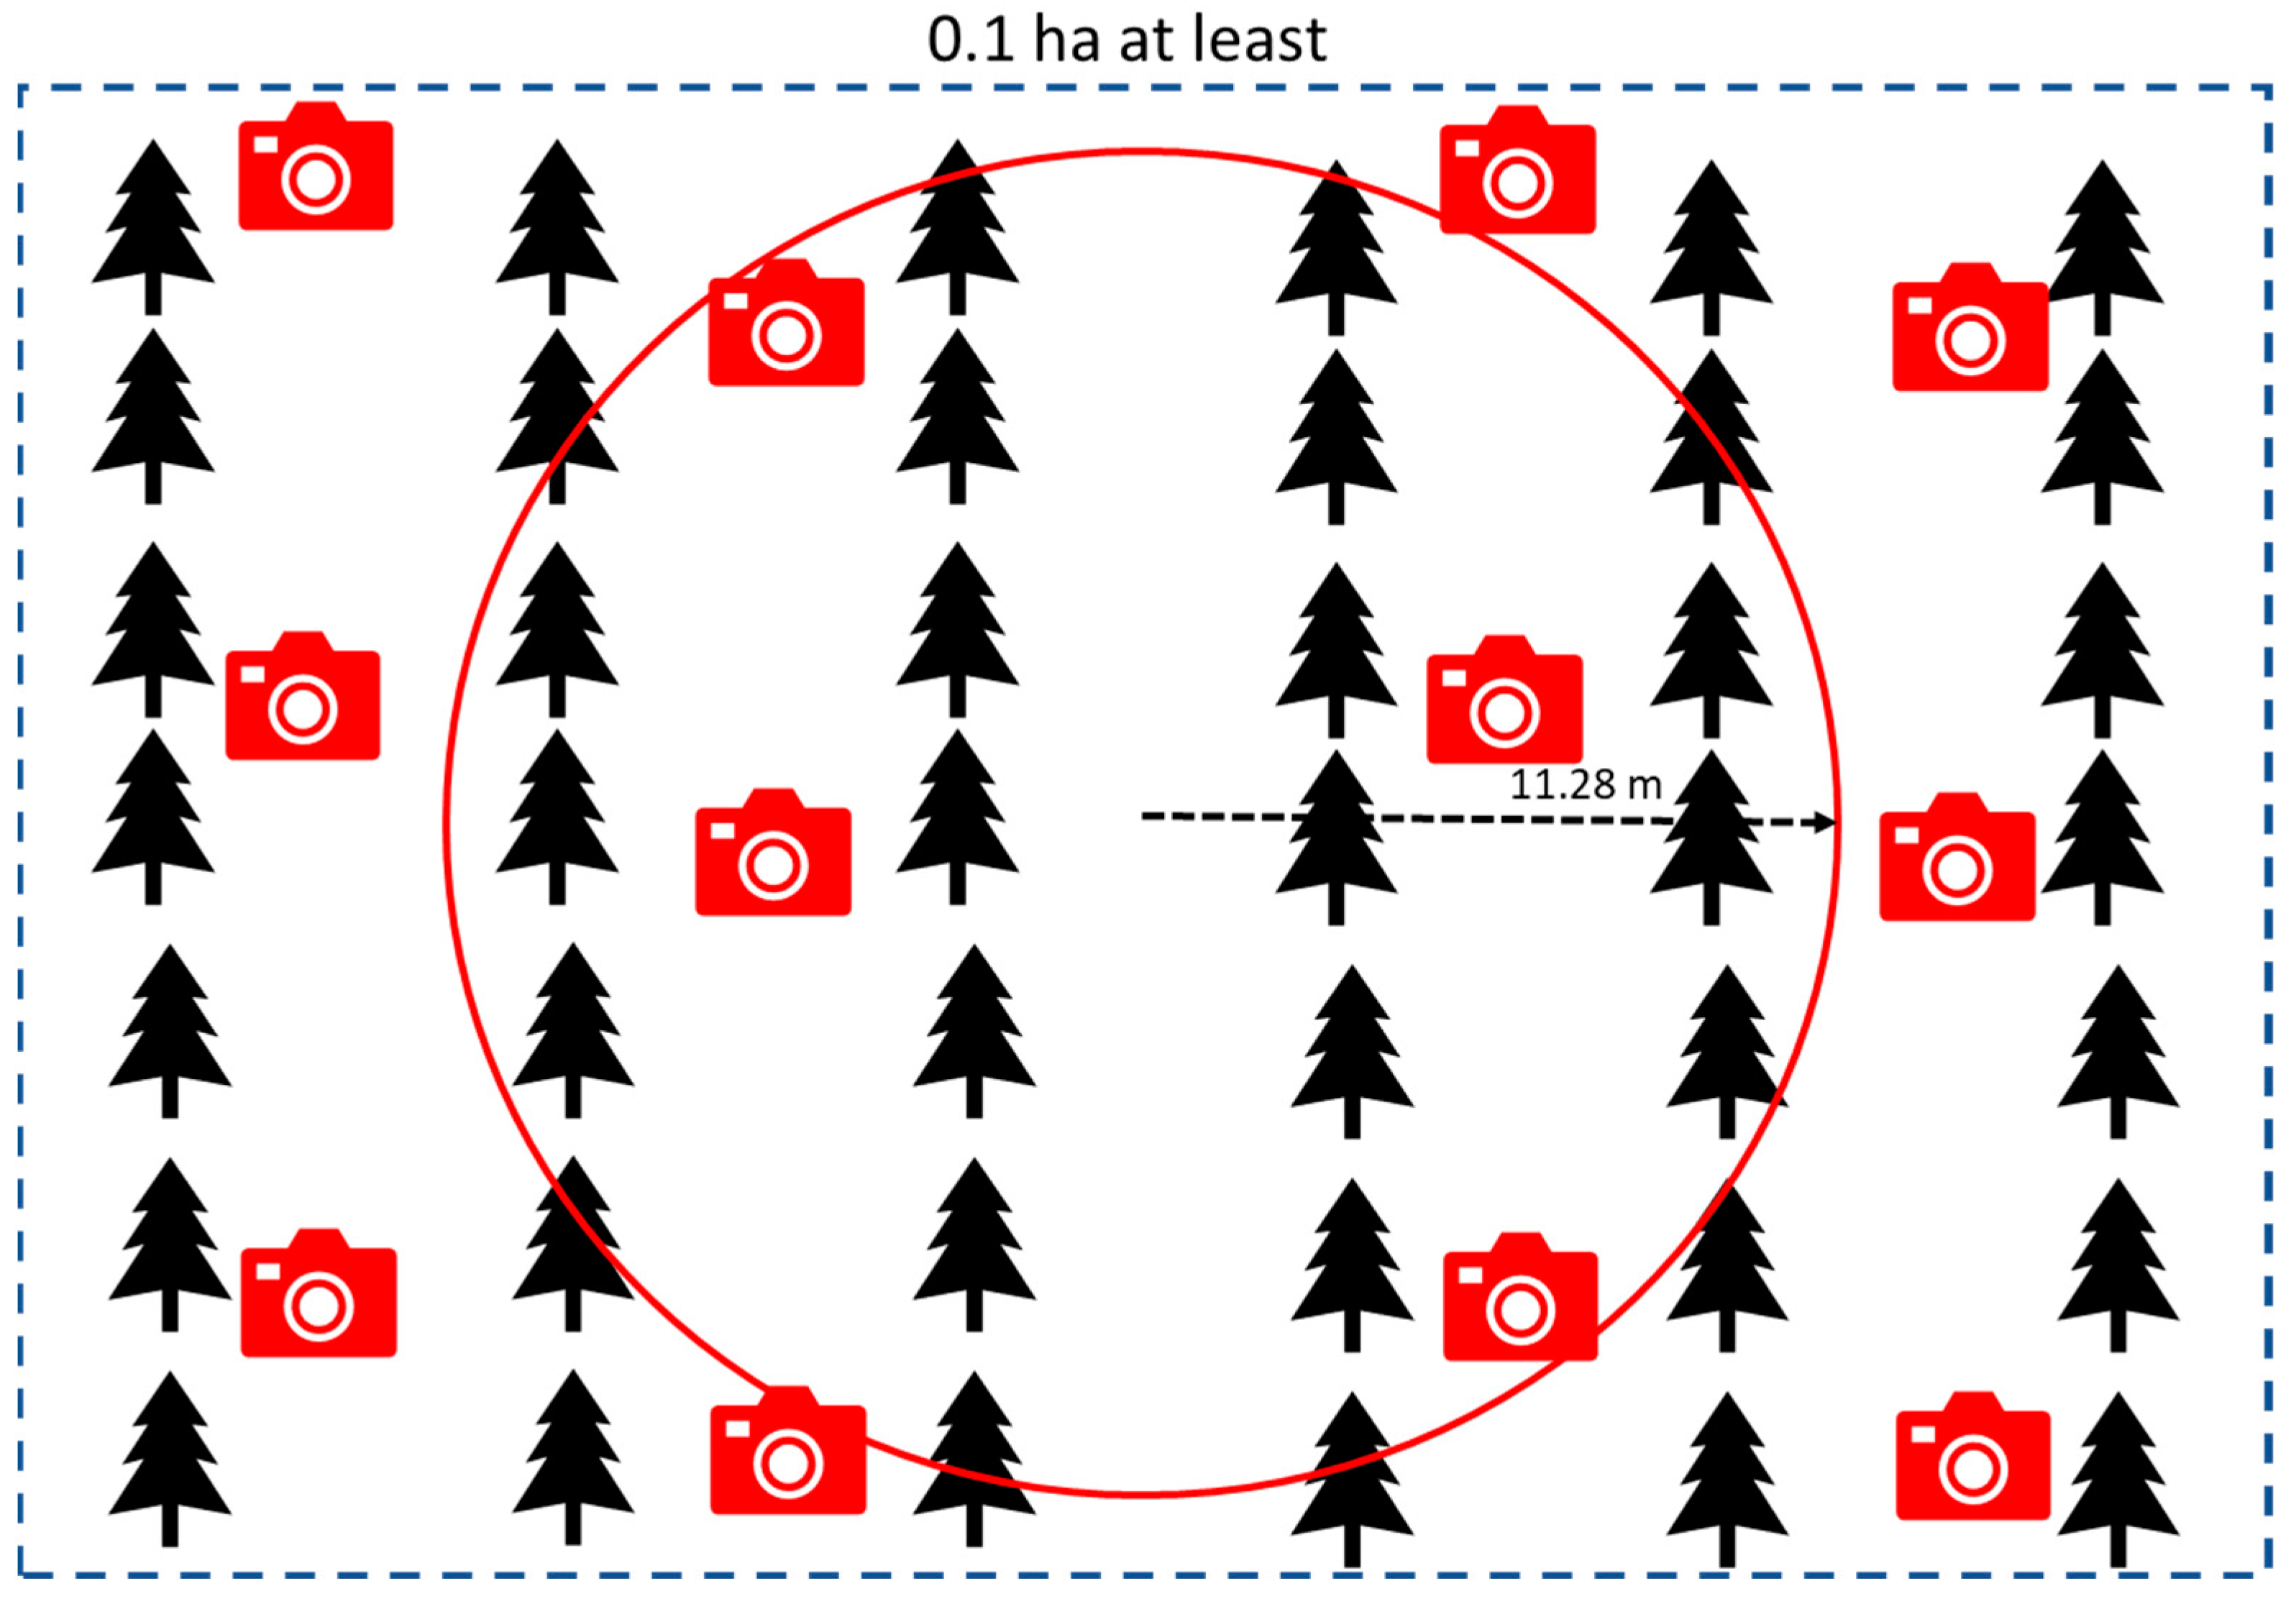
2.2.2. Data Collection with the Arboreal App
2.2.3. Data Collection with the Katam Application
2.2.4. Data Collection with the Trestima App
2.3. Data Processing
2.3.1. Statistical Treatment
3. Results
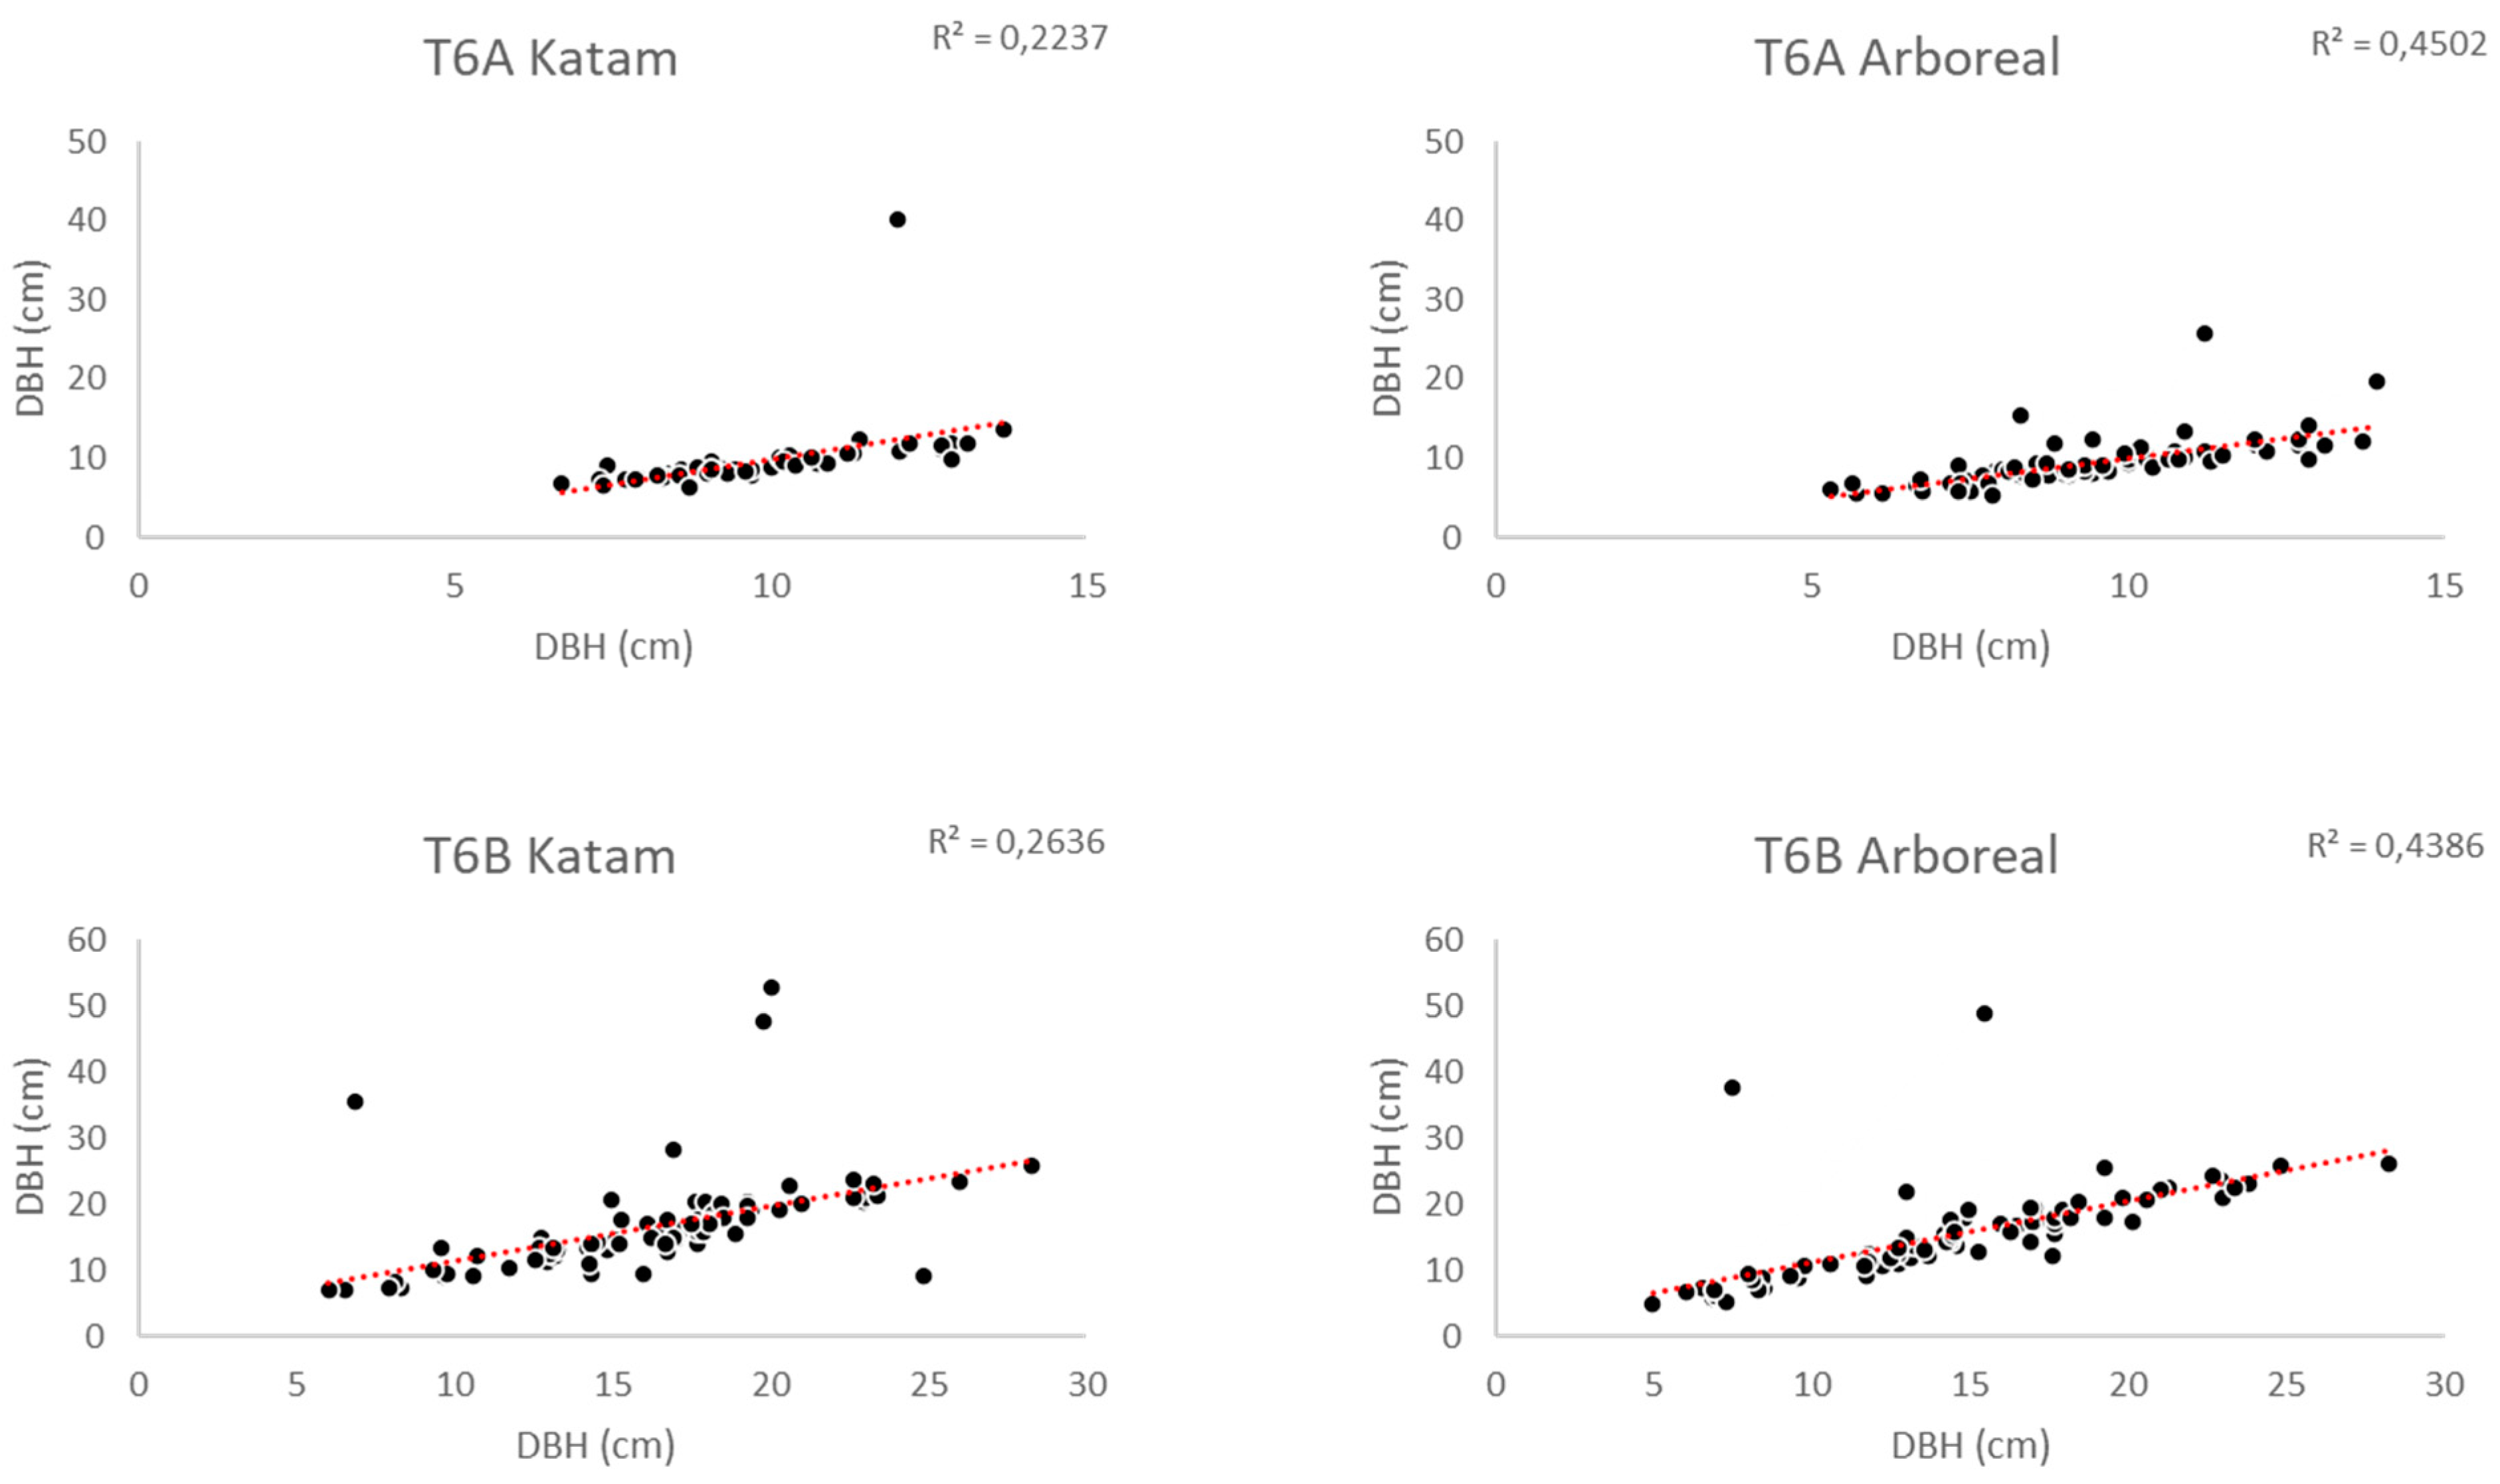
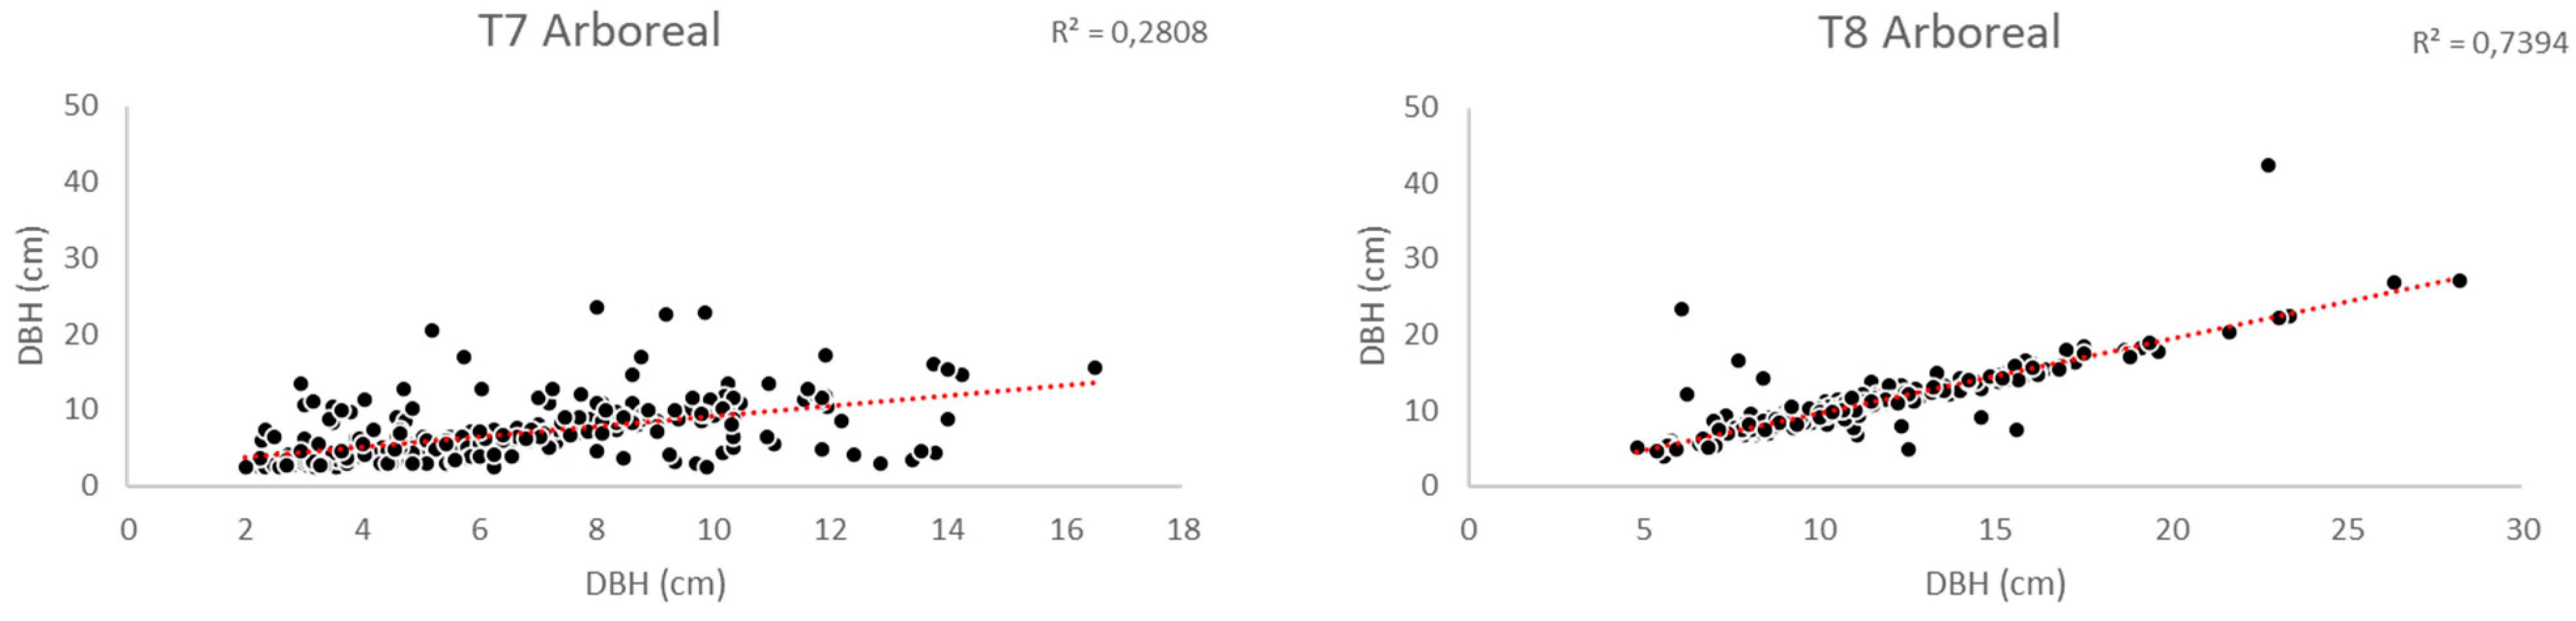
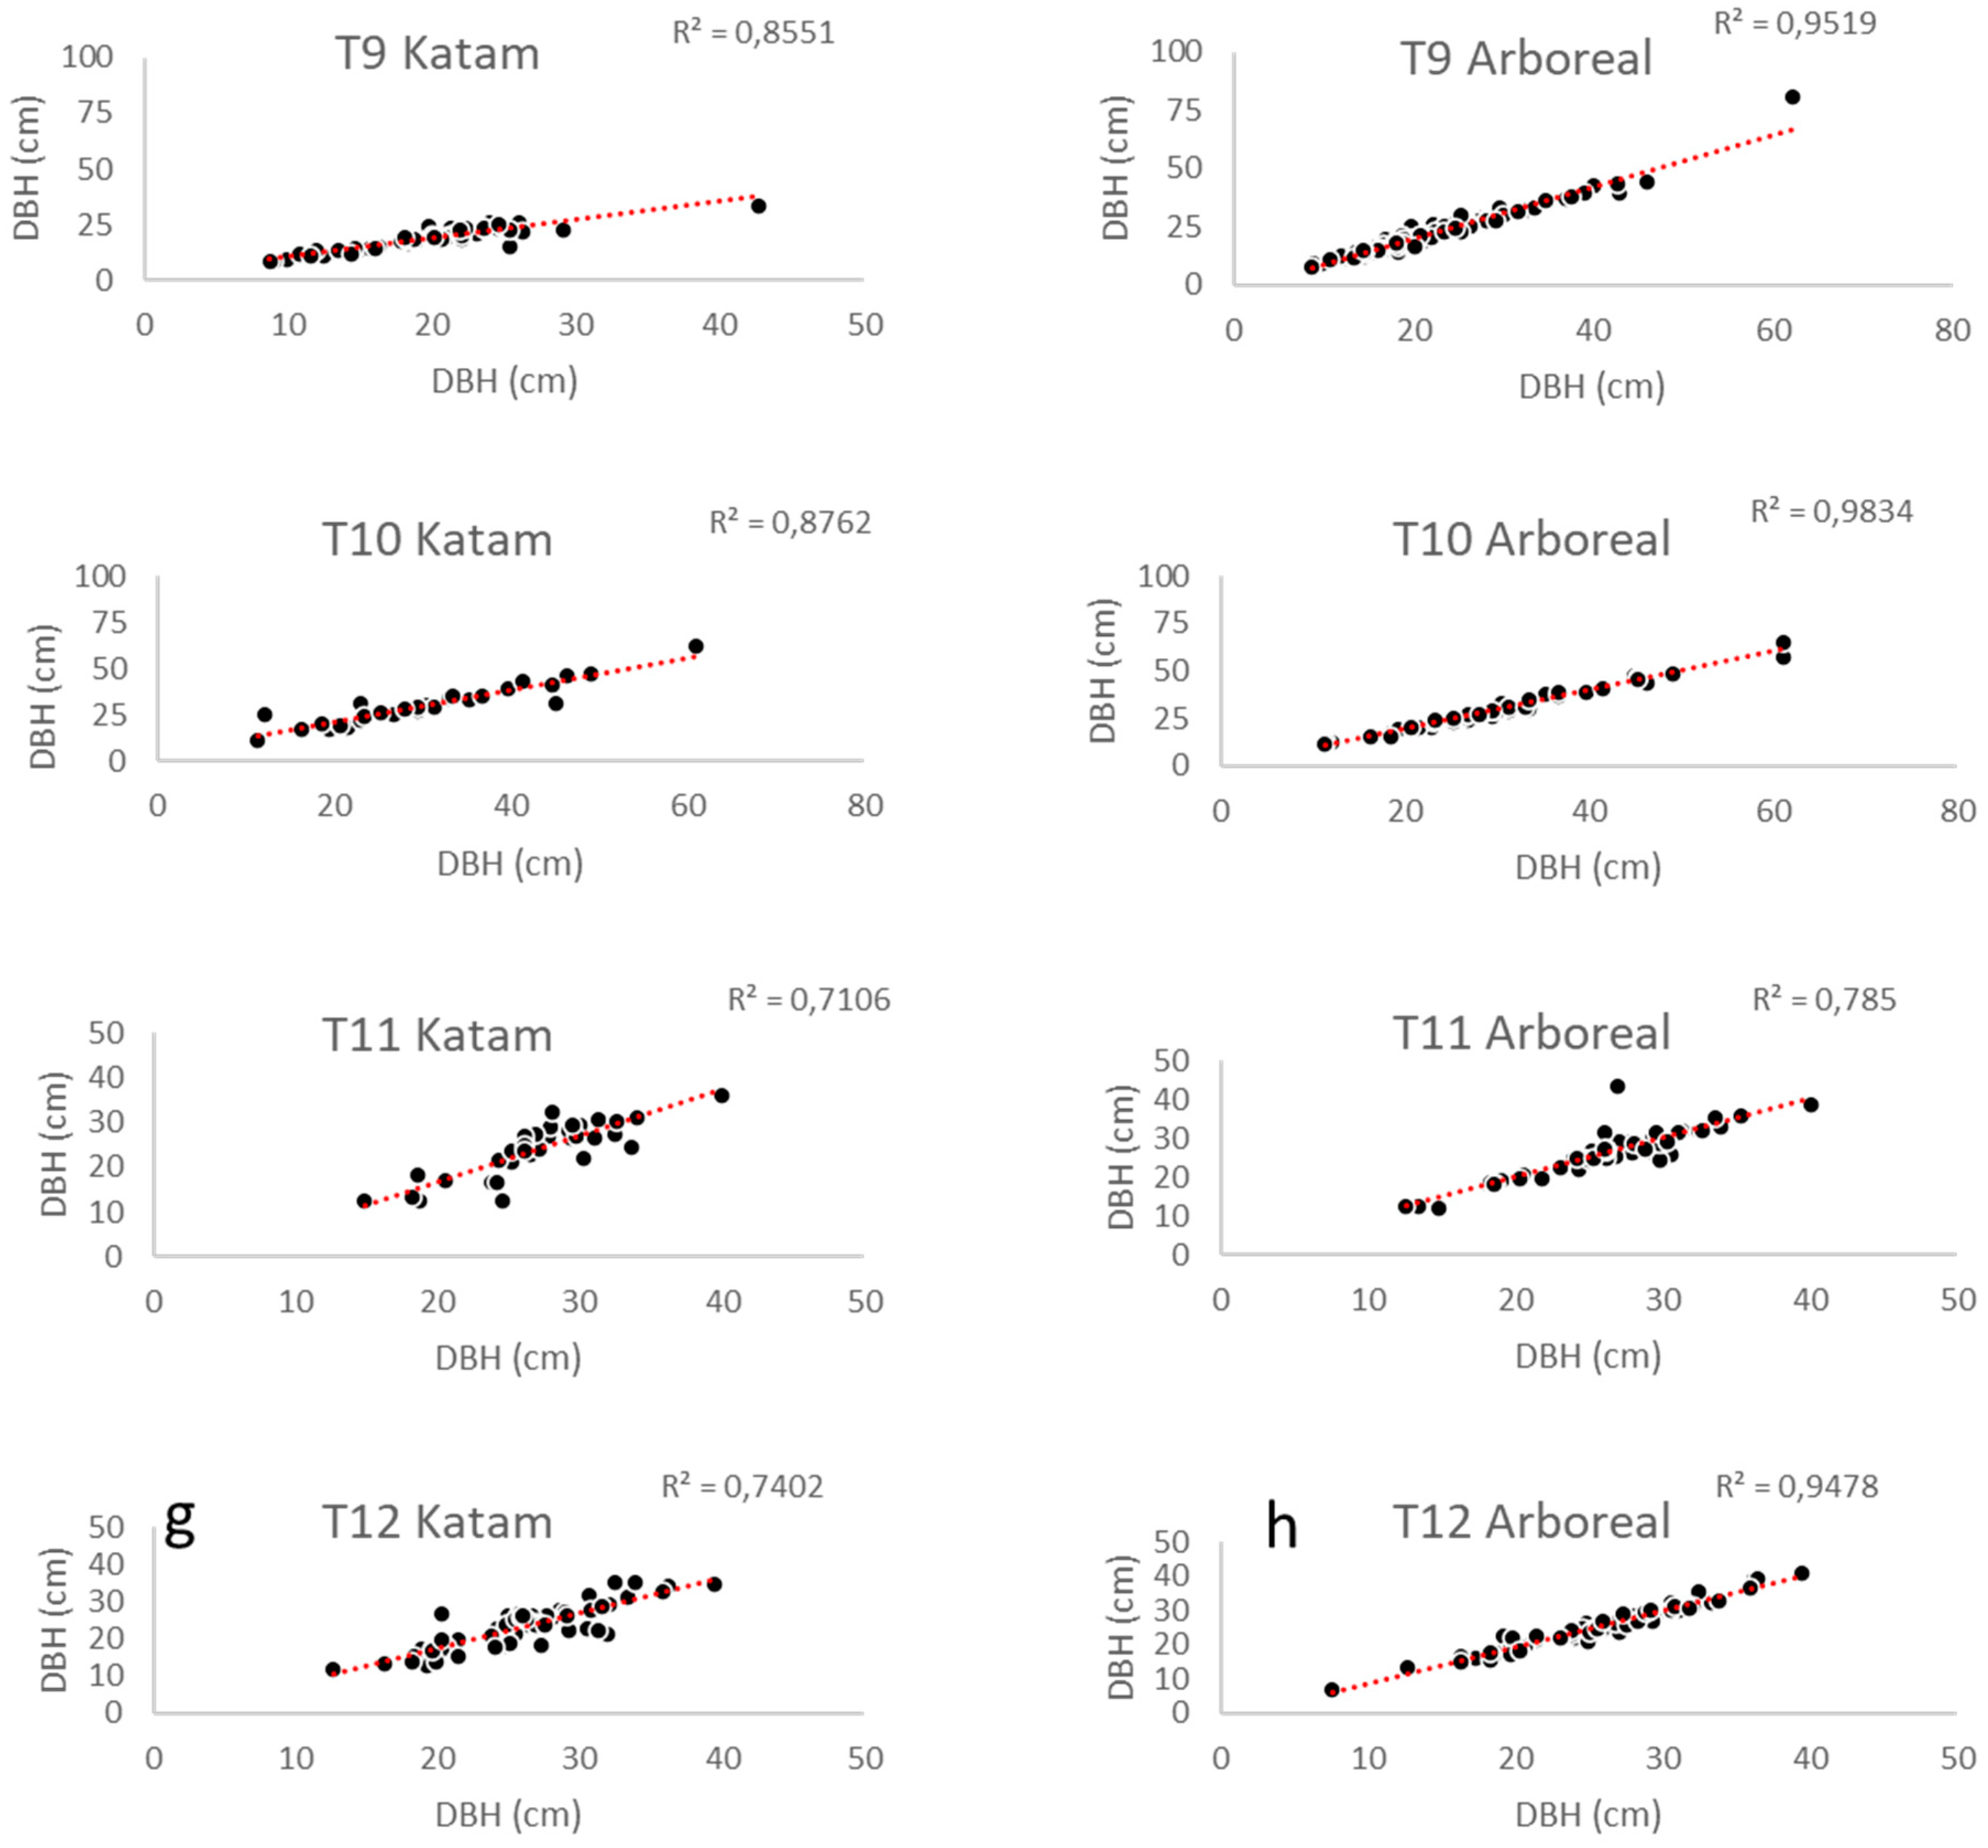
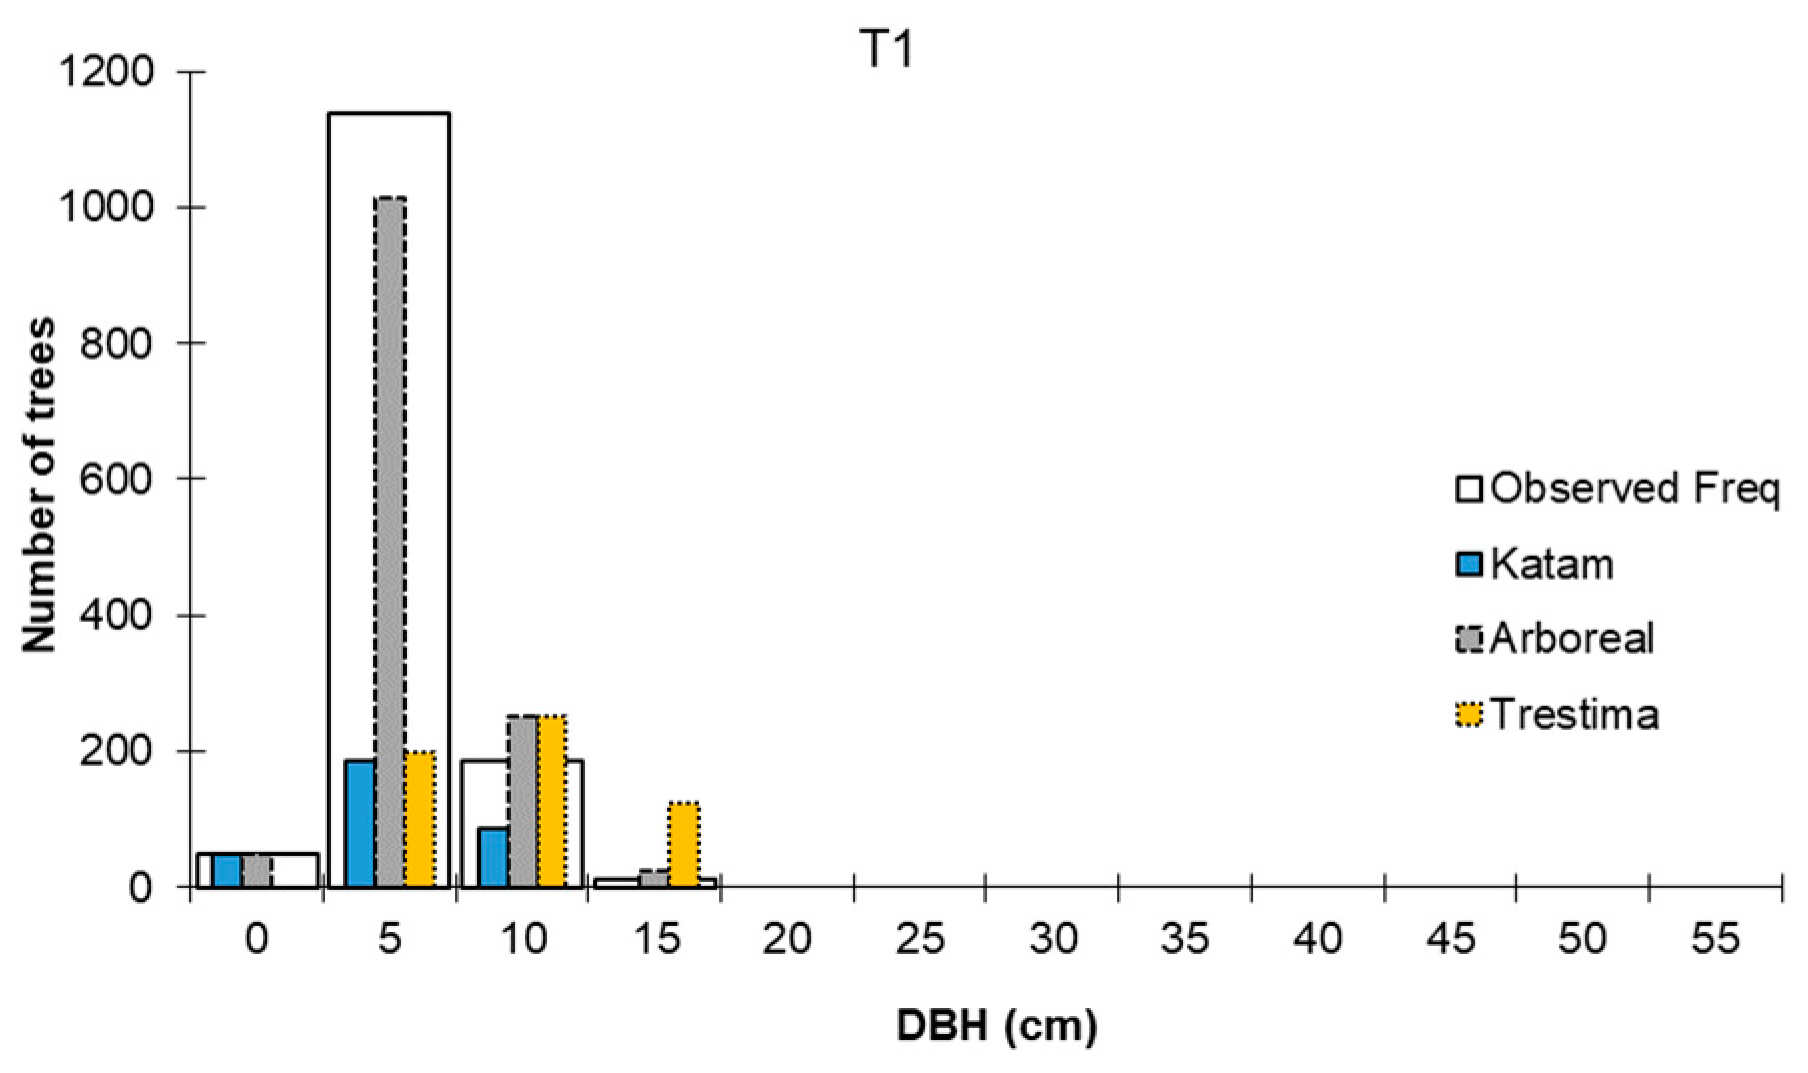
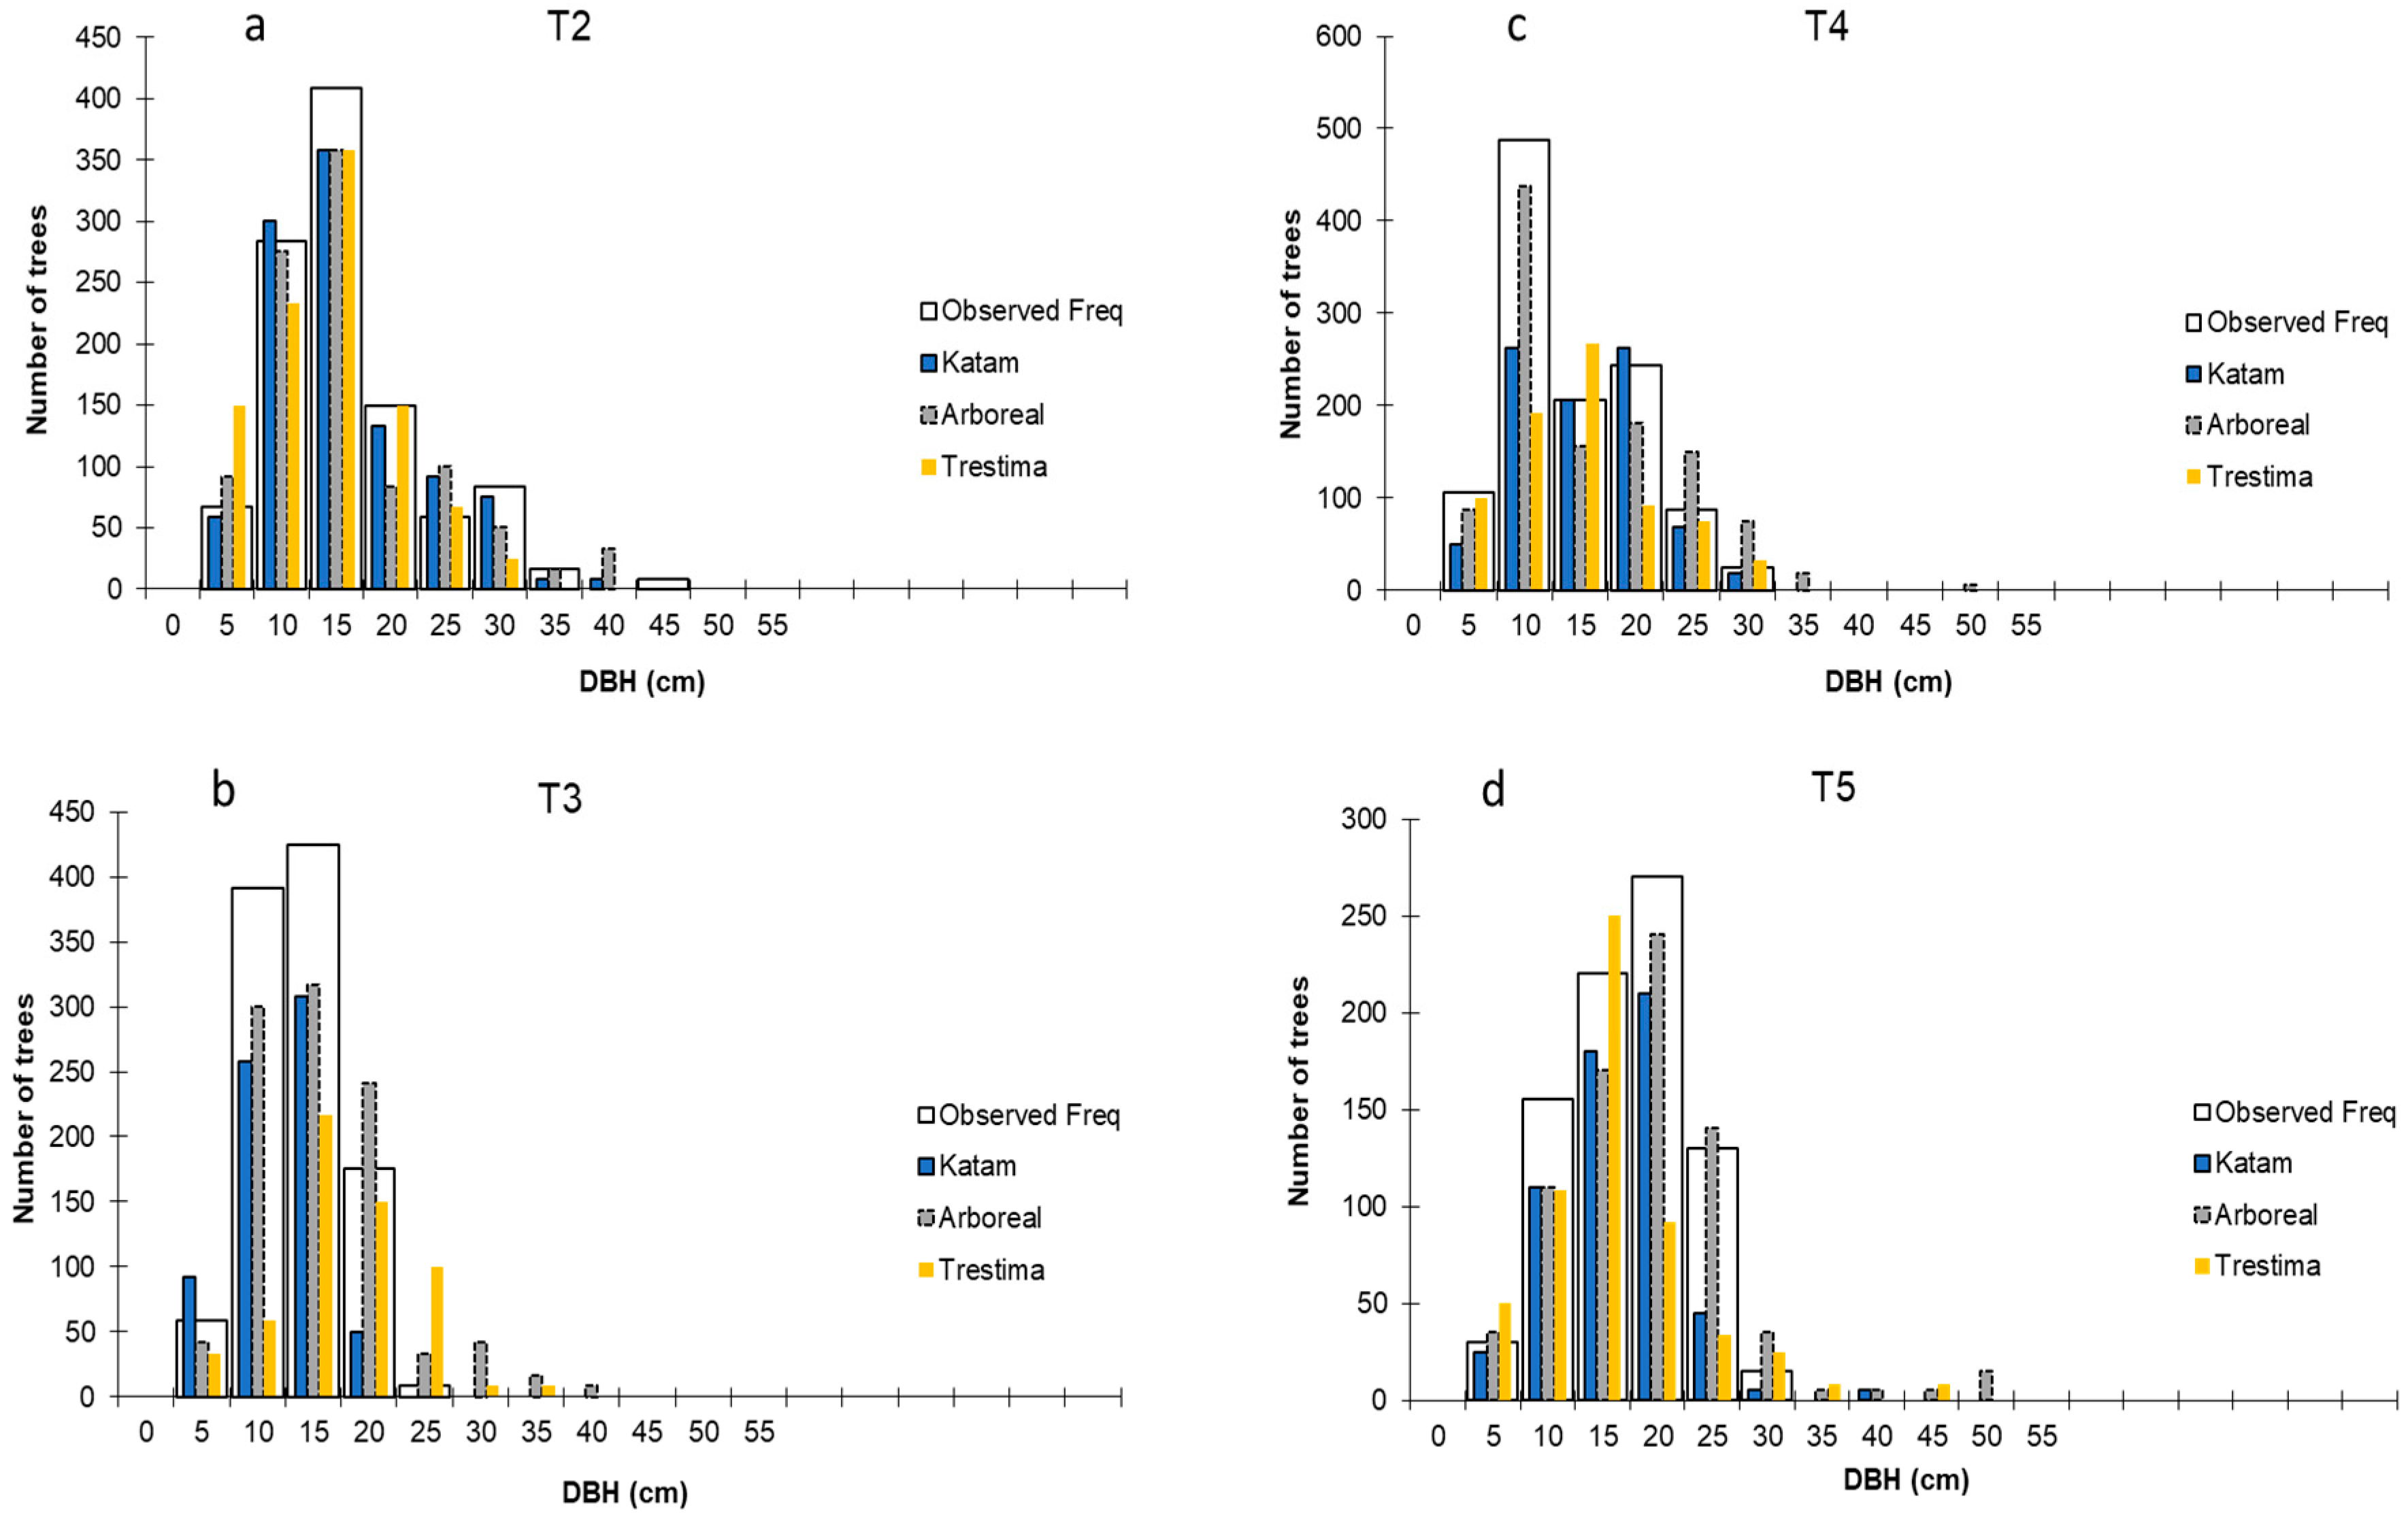
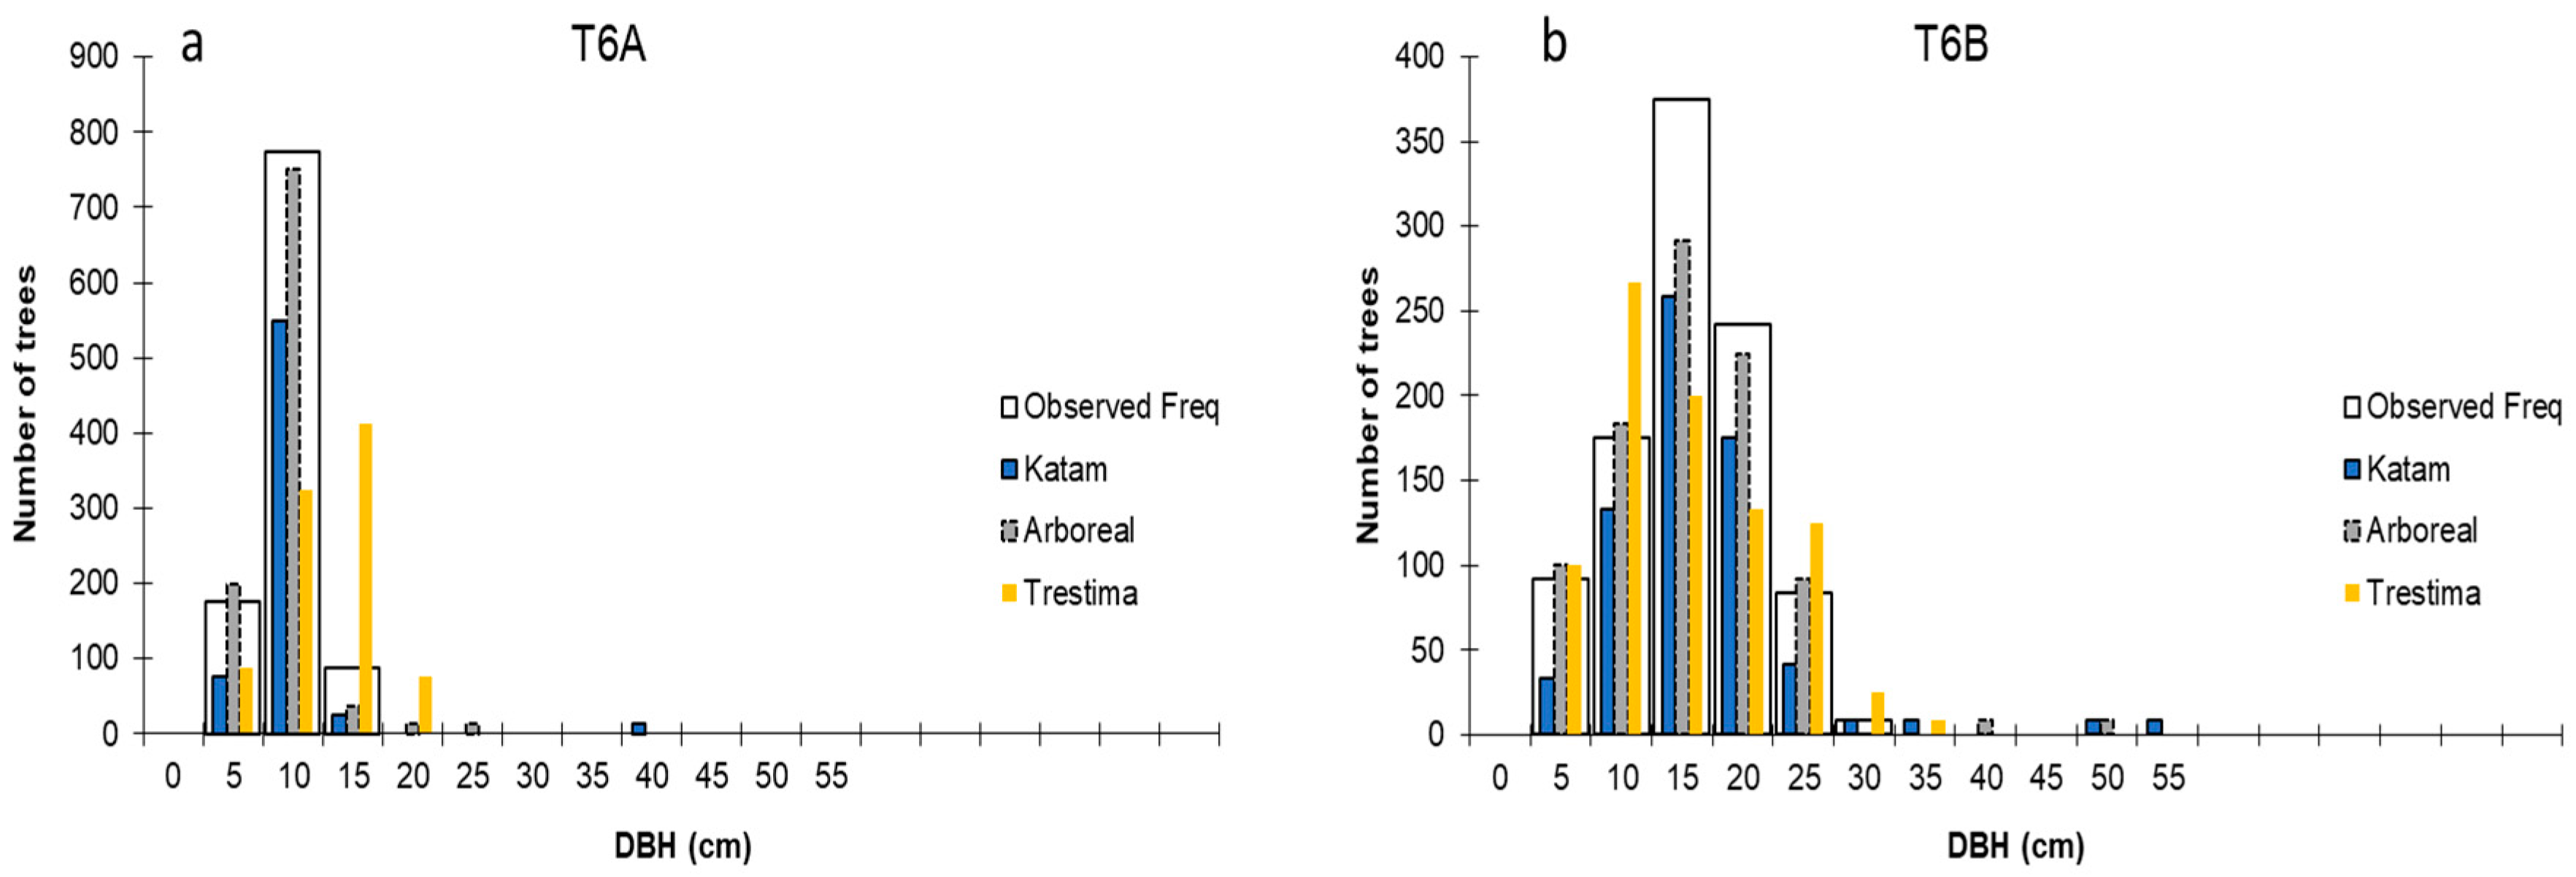
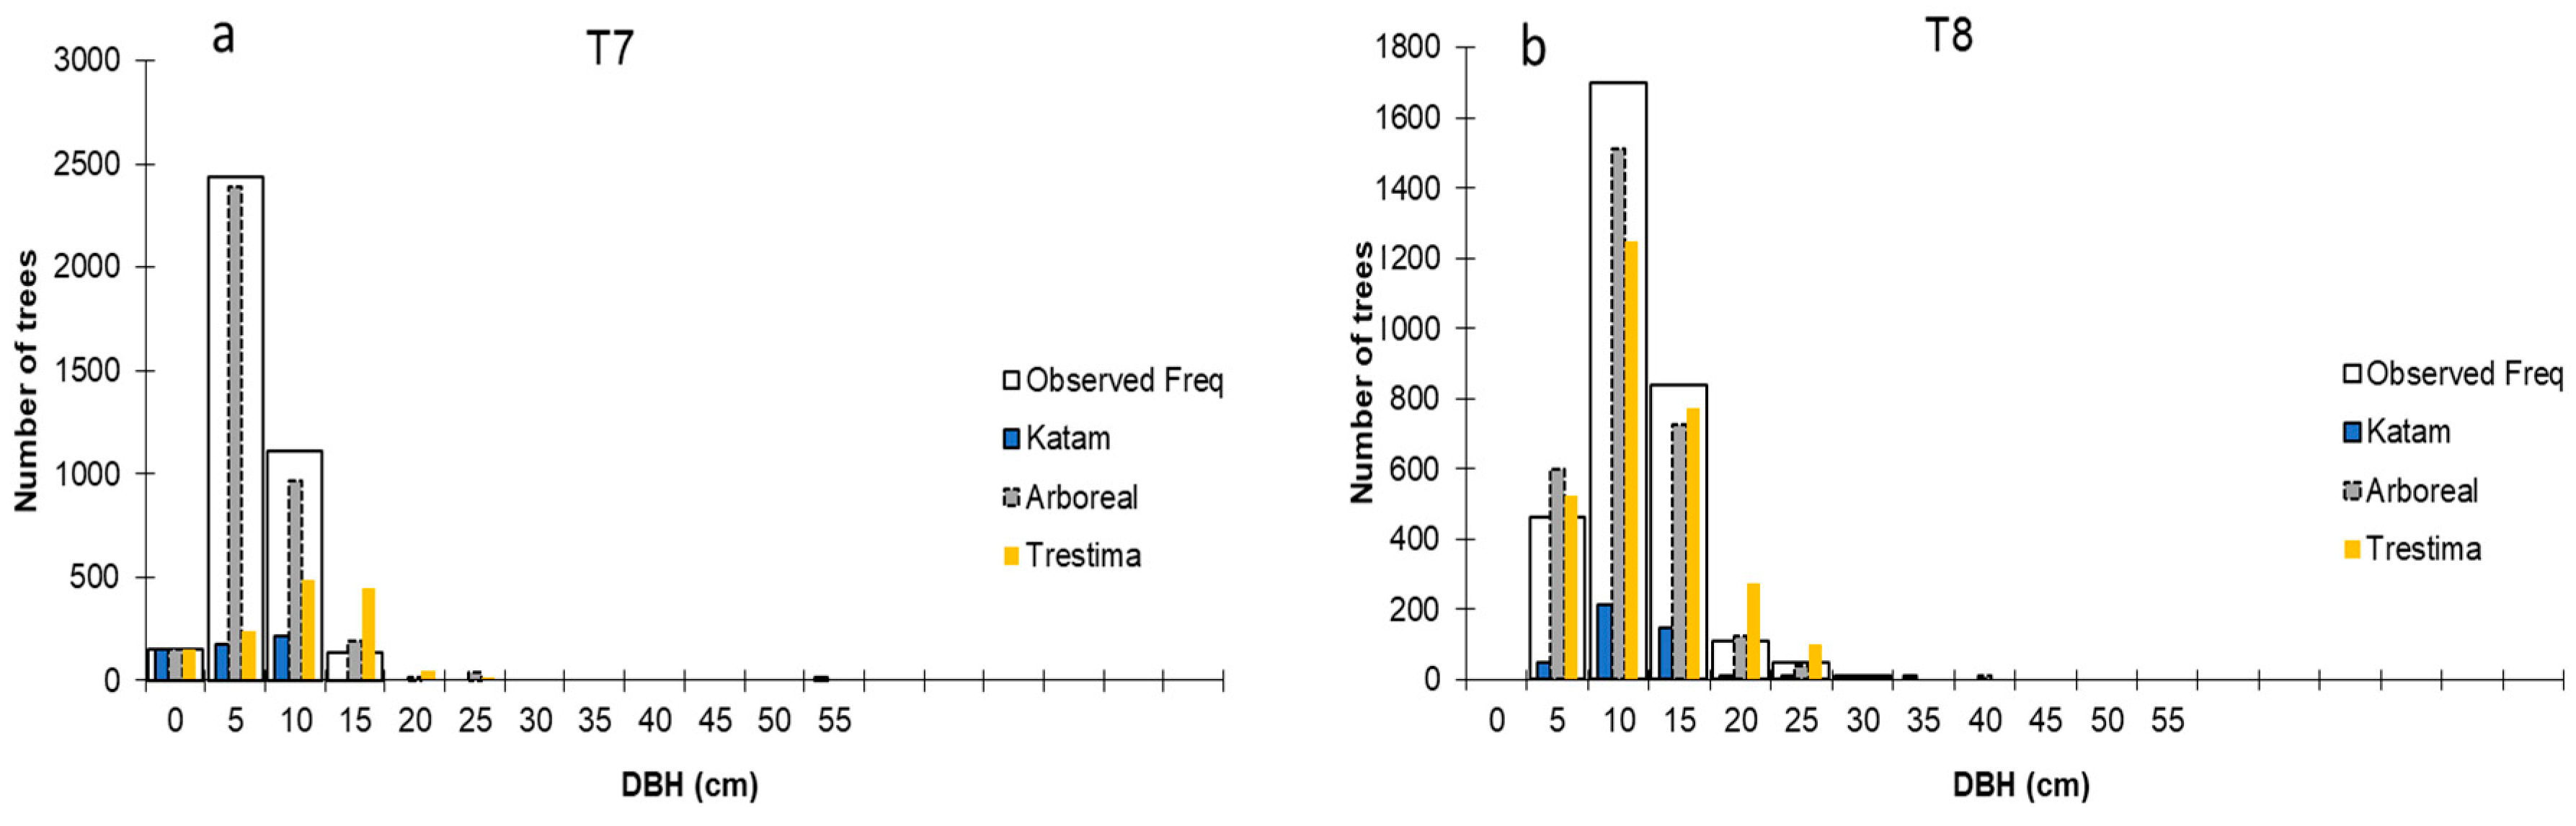
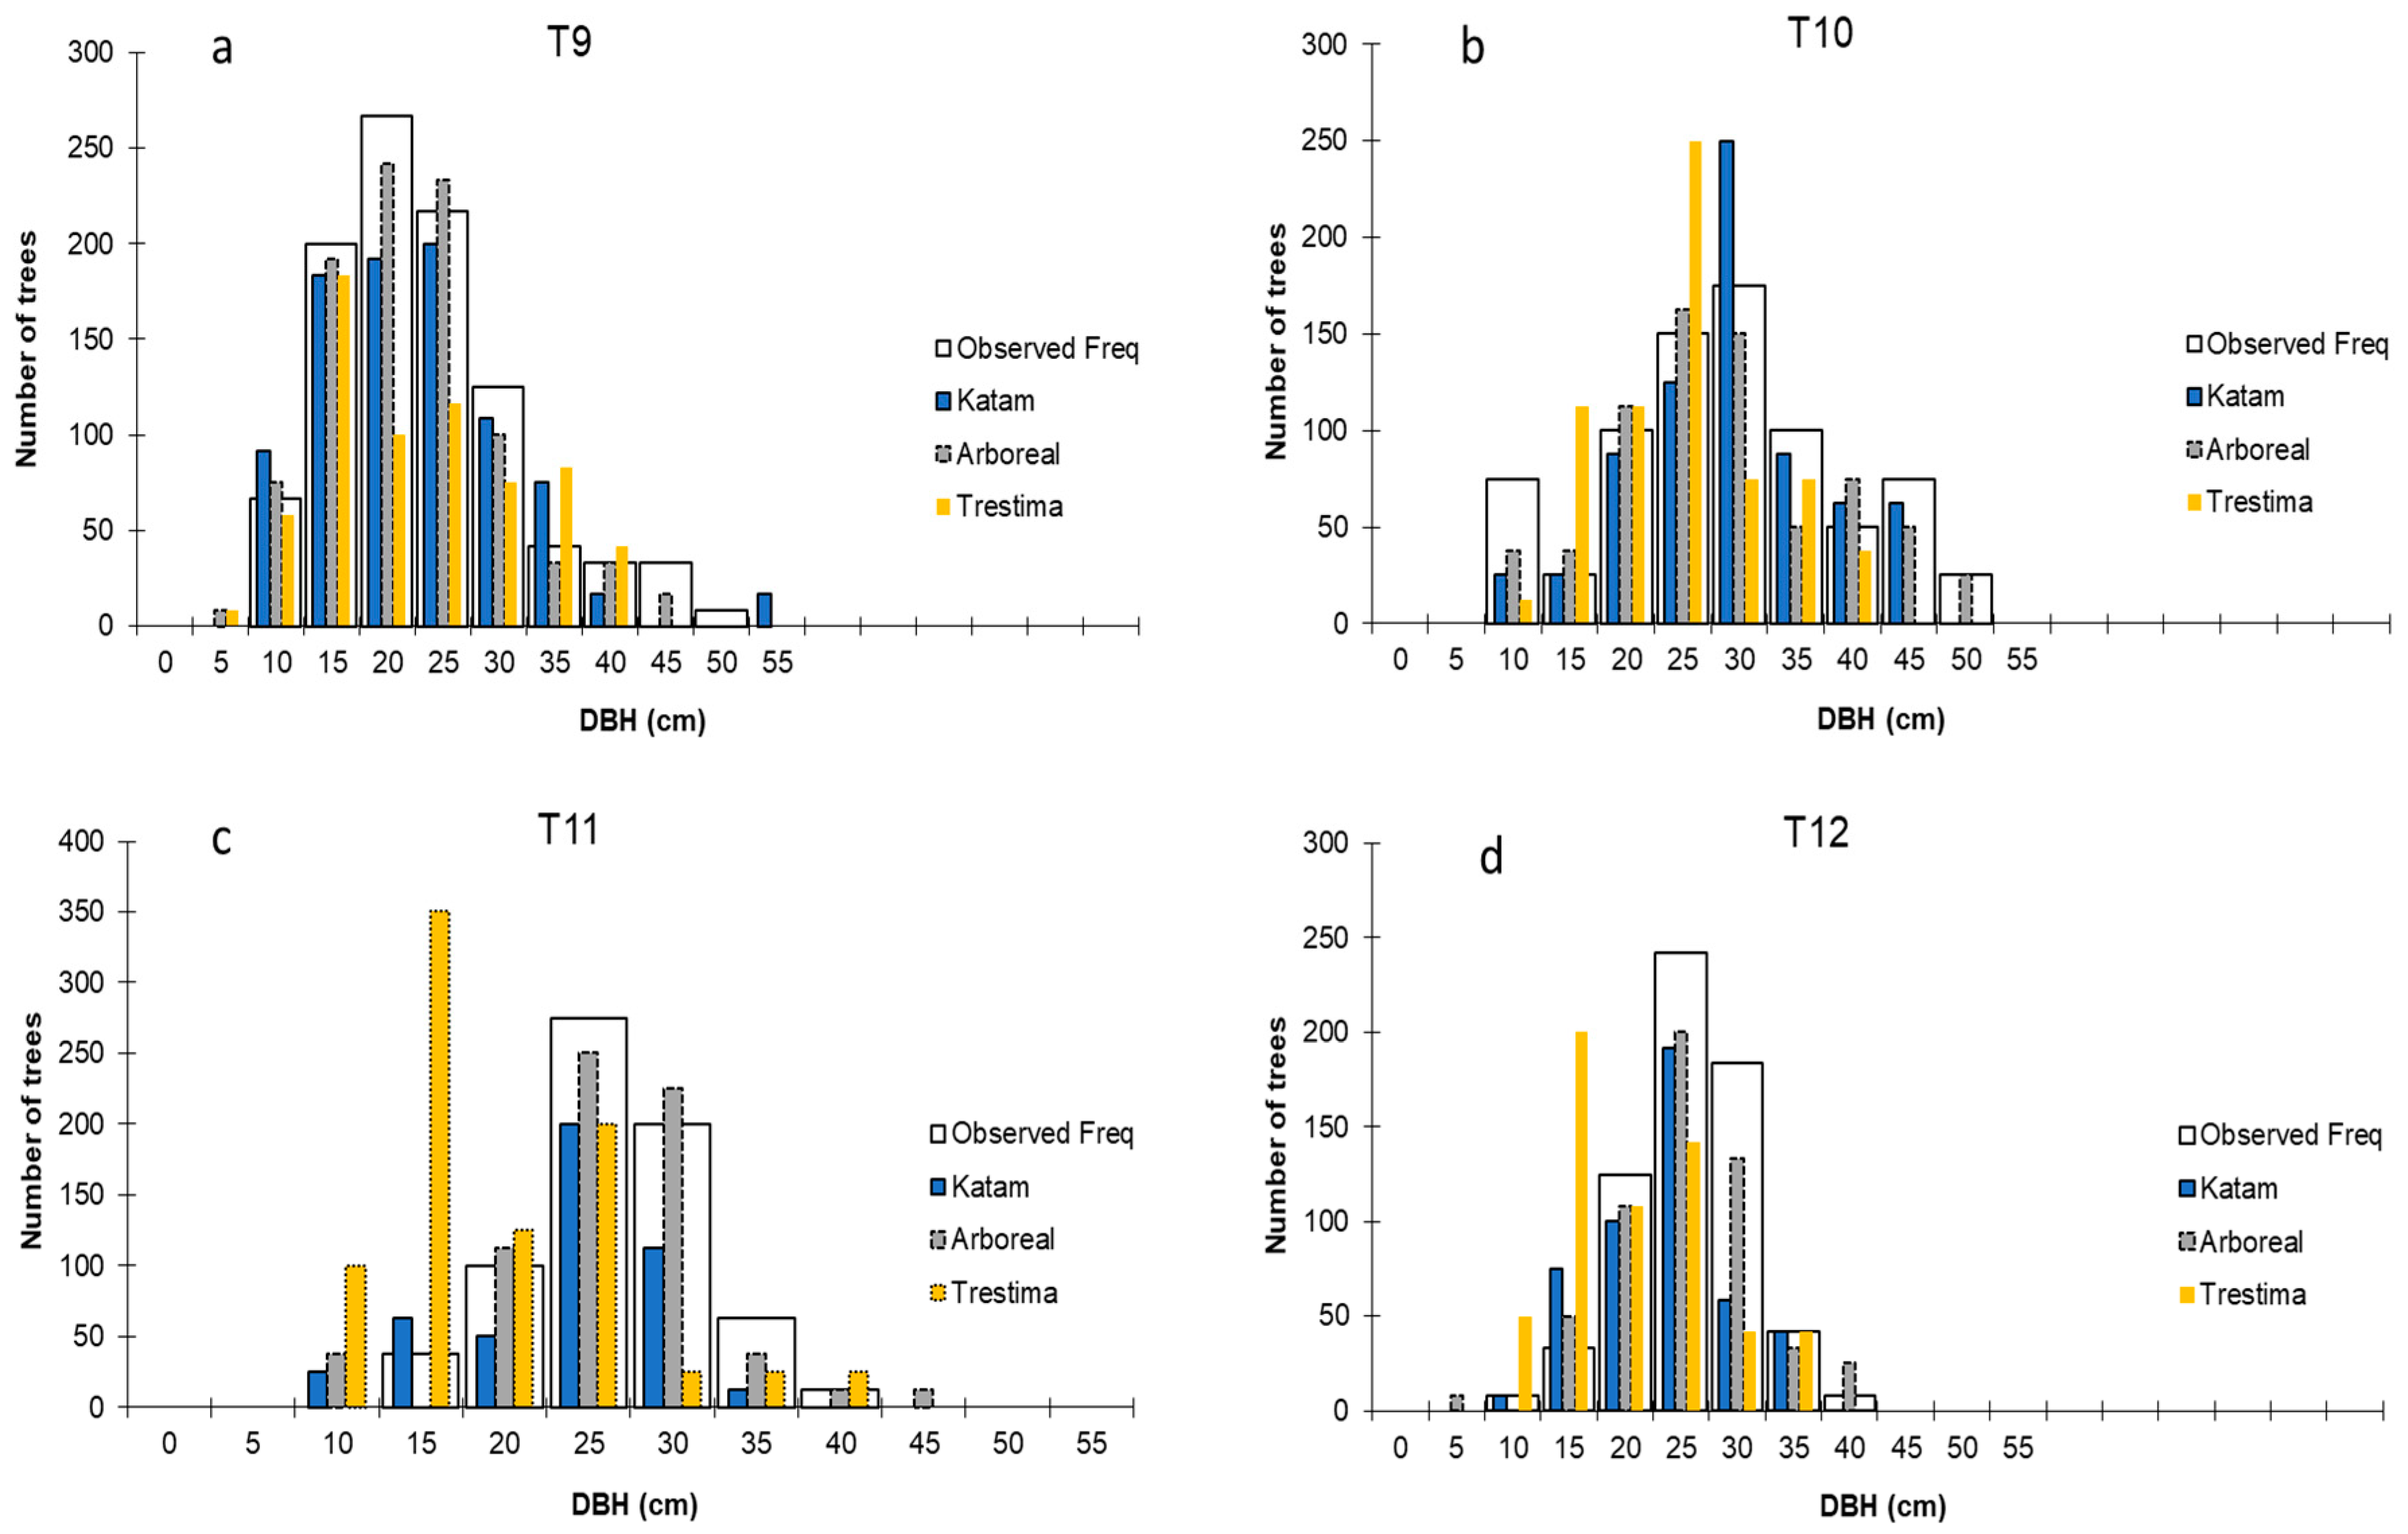
3.1. Comparison of Diameter Distributions through Graphical Analysis and Compliance Metrics
3.1.1. Eucalyptus Stands
3.1.2. Pinus Stands
3.2. Comparison of the Diameter Distributions and Stand Density Variables Means via Statistical Tests
3.2.1. Diameter Distribution Means
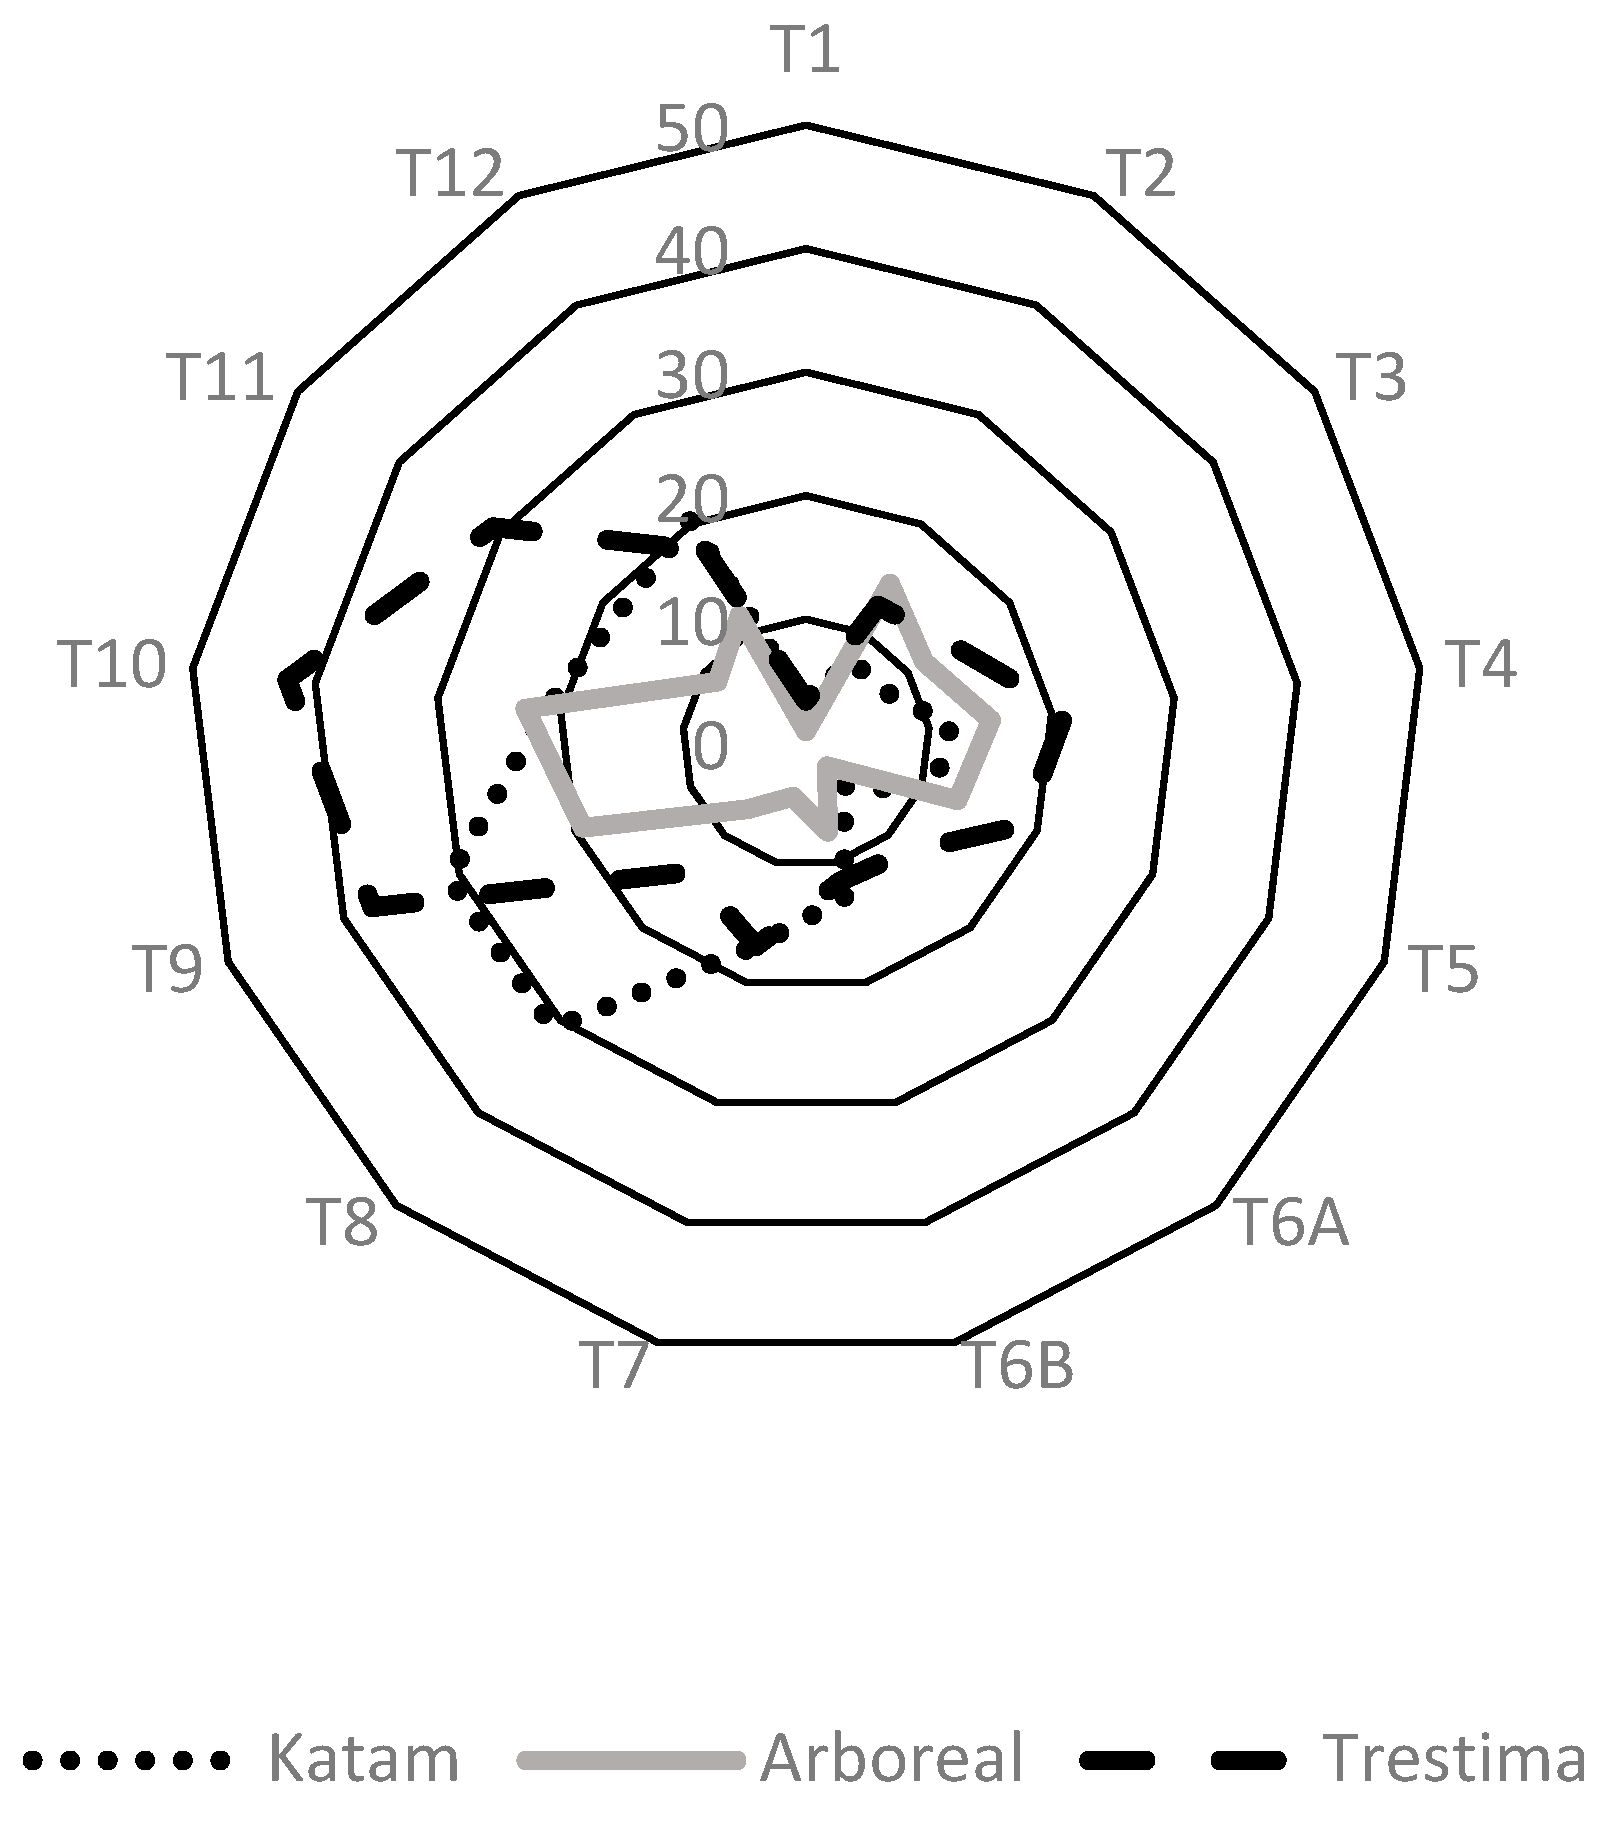
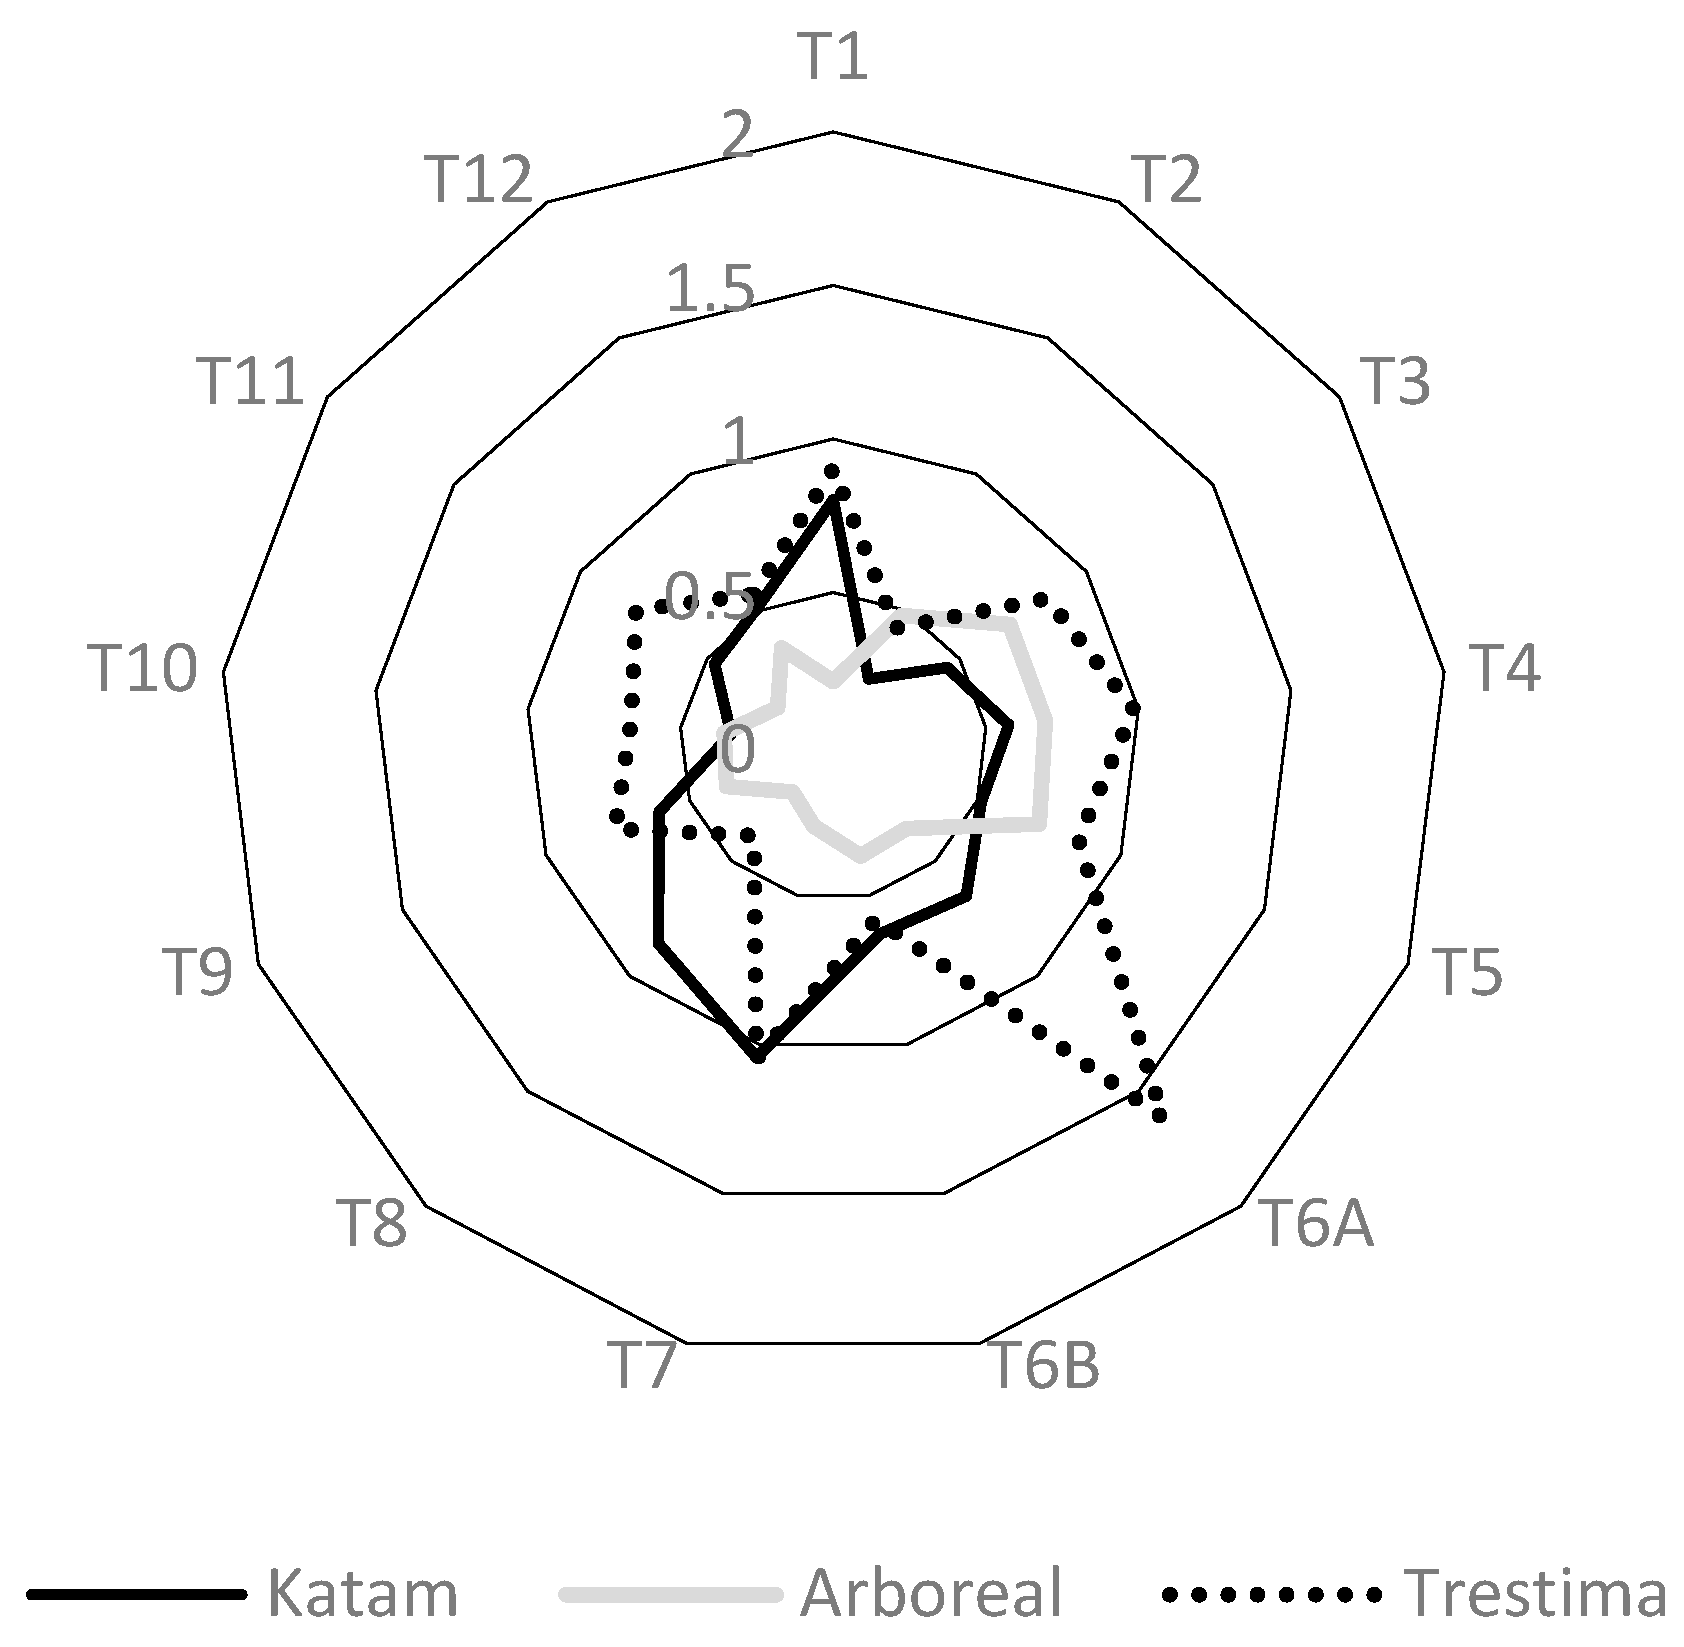
3.2.2. Number of Trees and the Basal Area Means
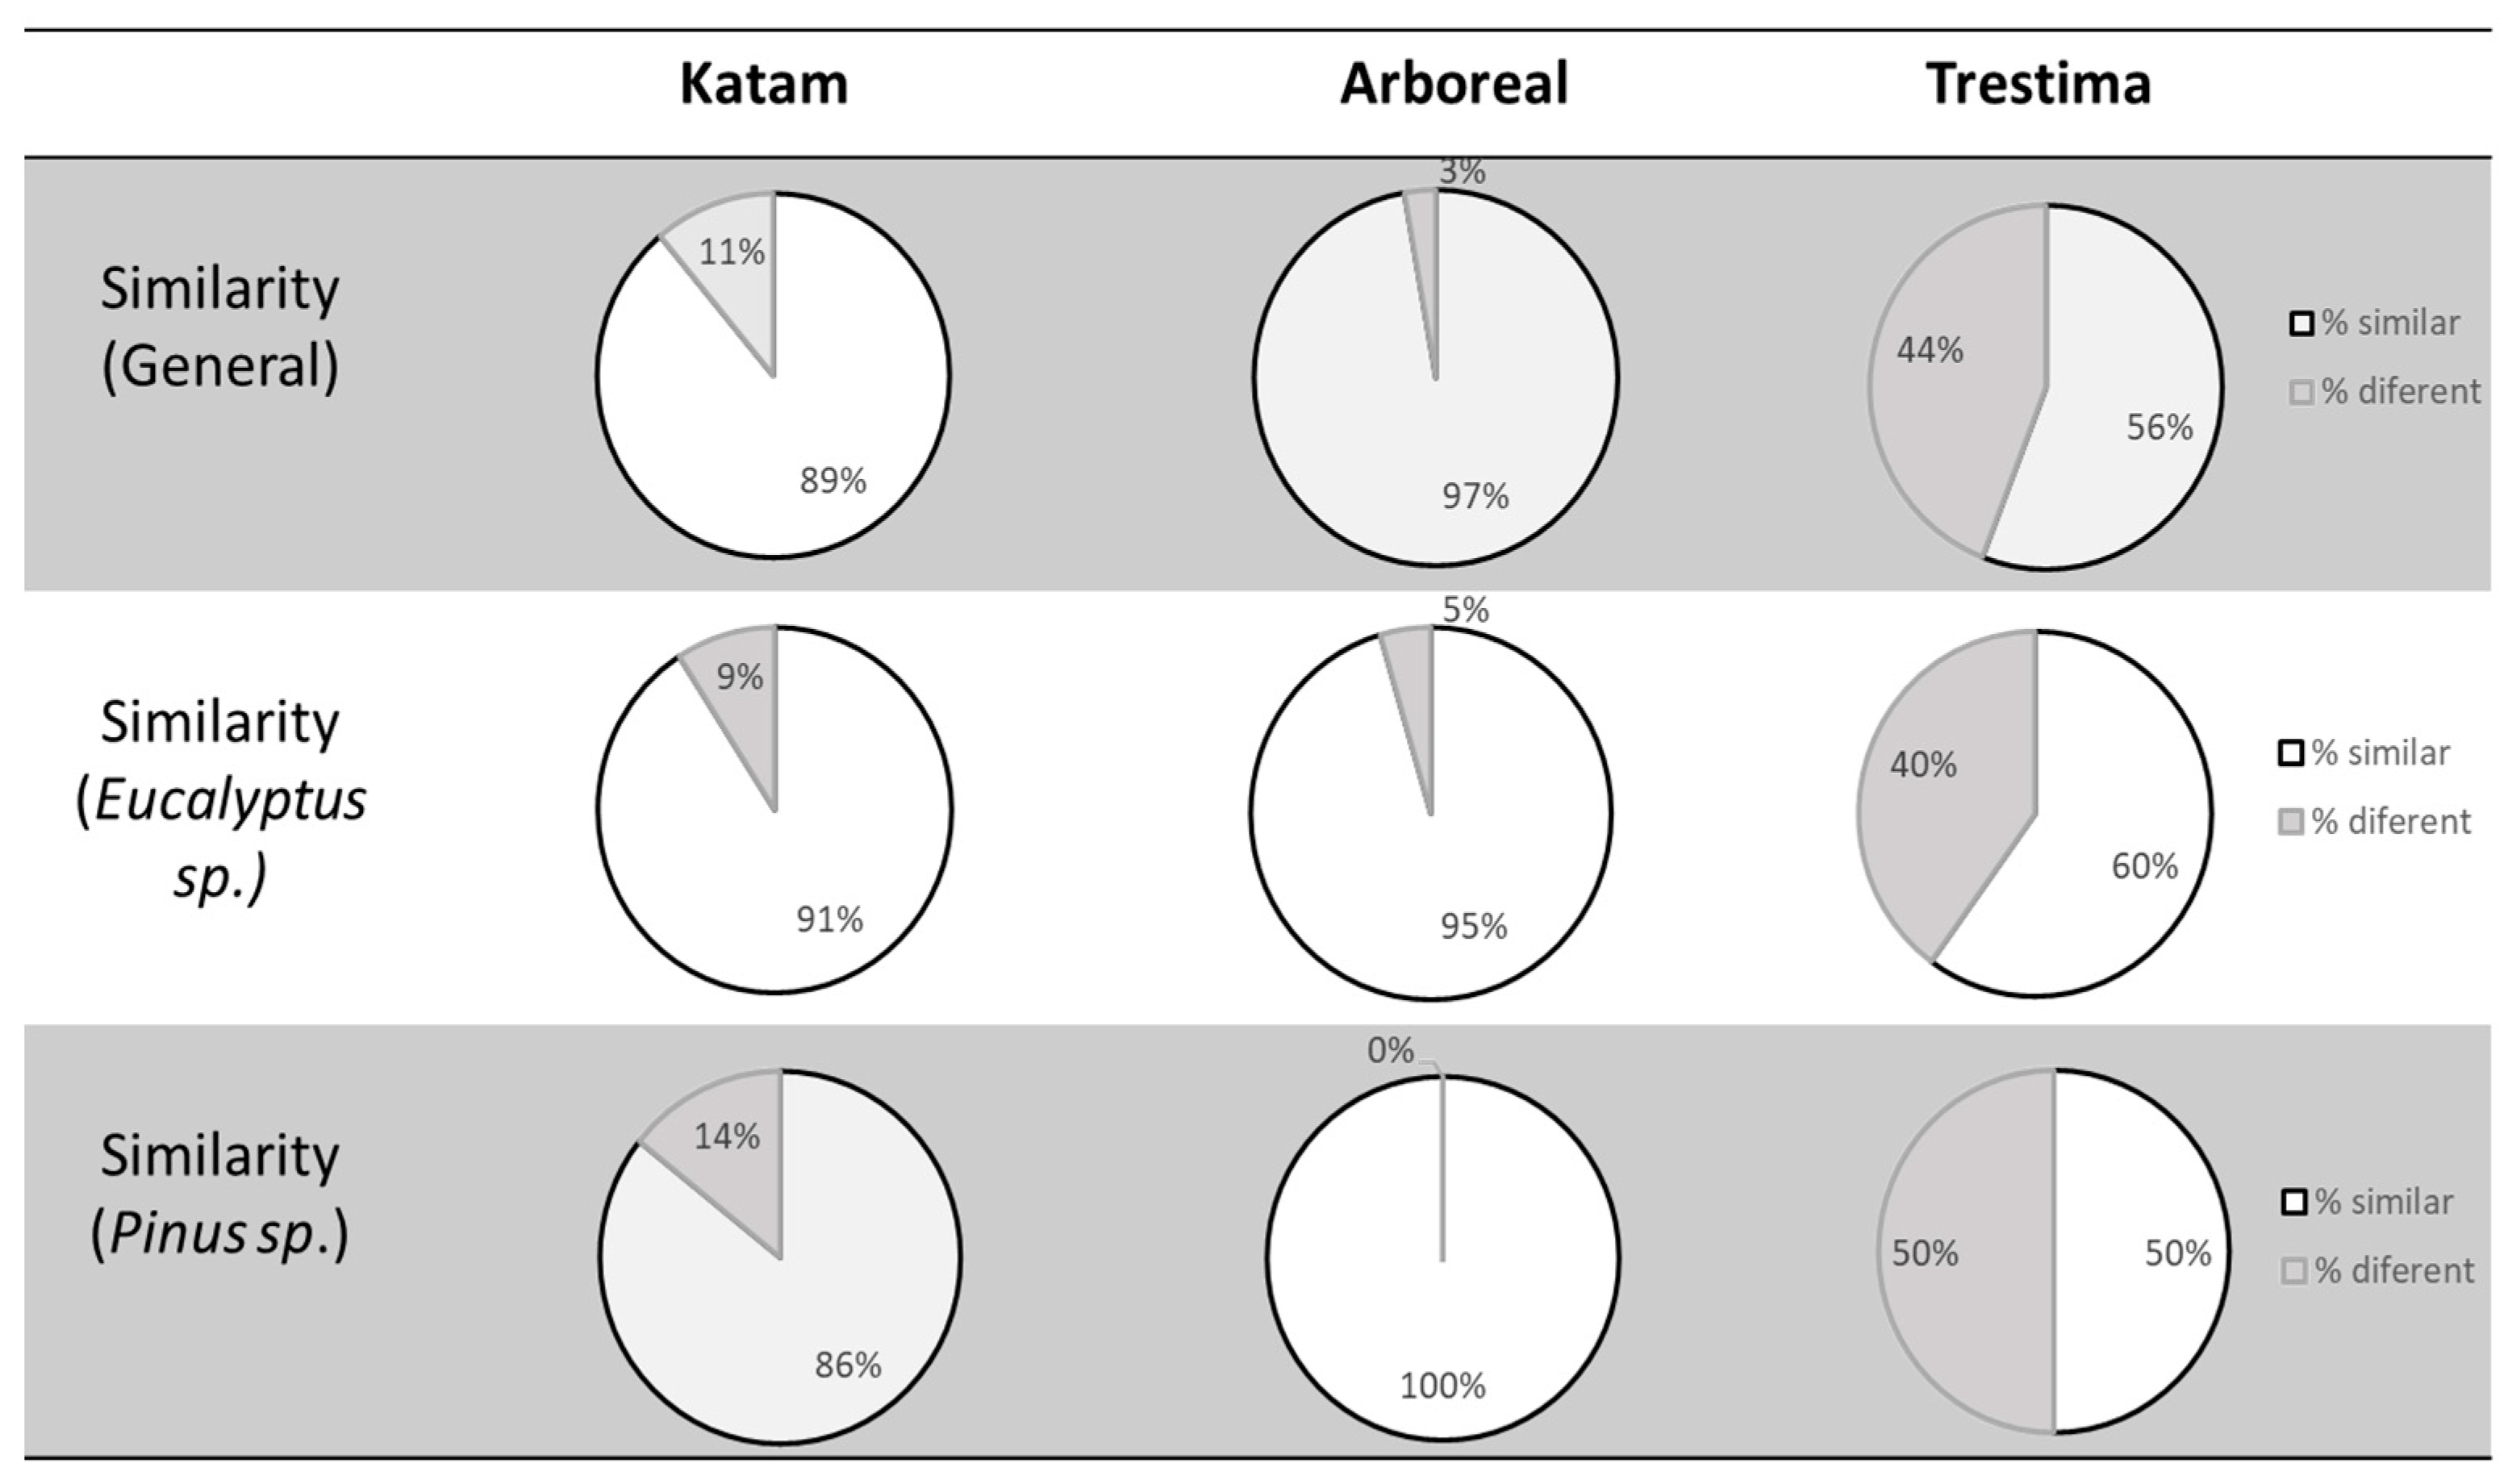
3.3. Comparison Considering the Diameter Data Grouped in Classes
3.3.1. Graphical Representation and Visual Analysis
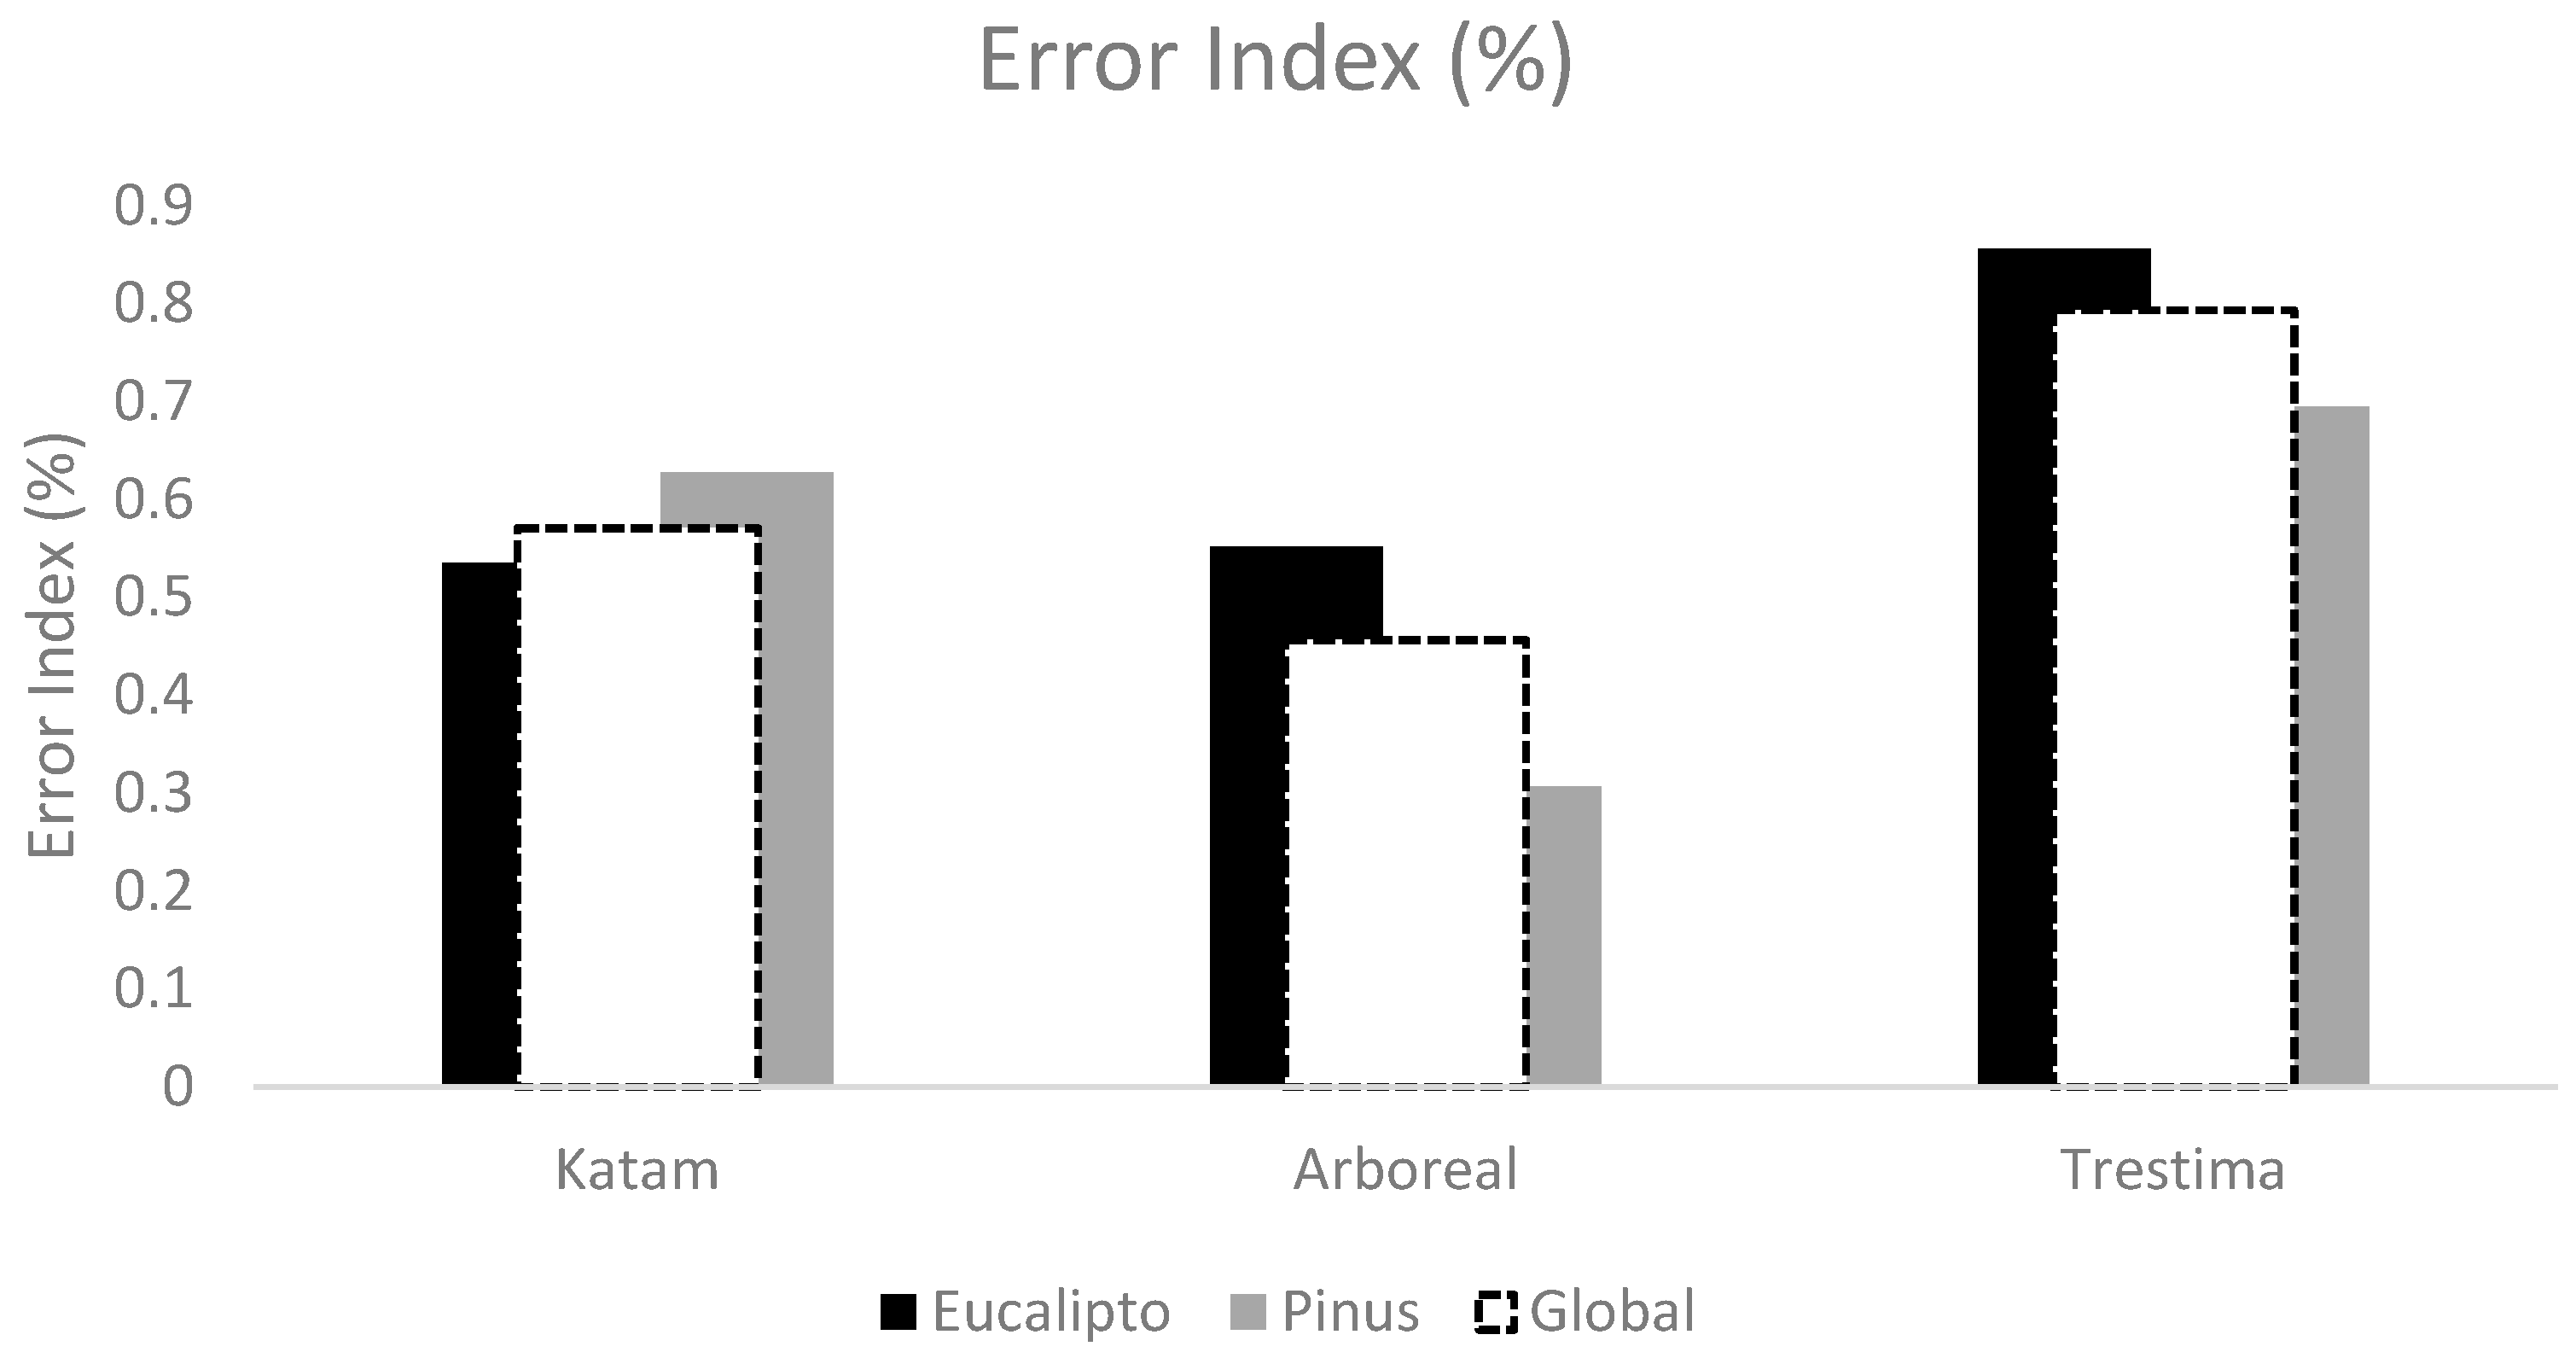
3.3.2. Assessment of Differences Based on the Error Index
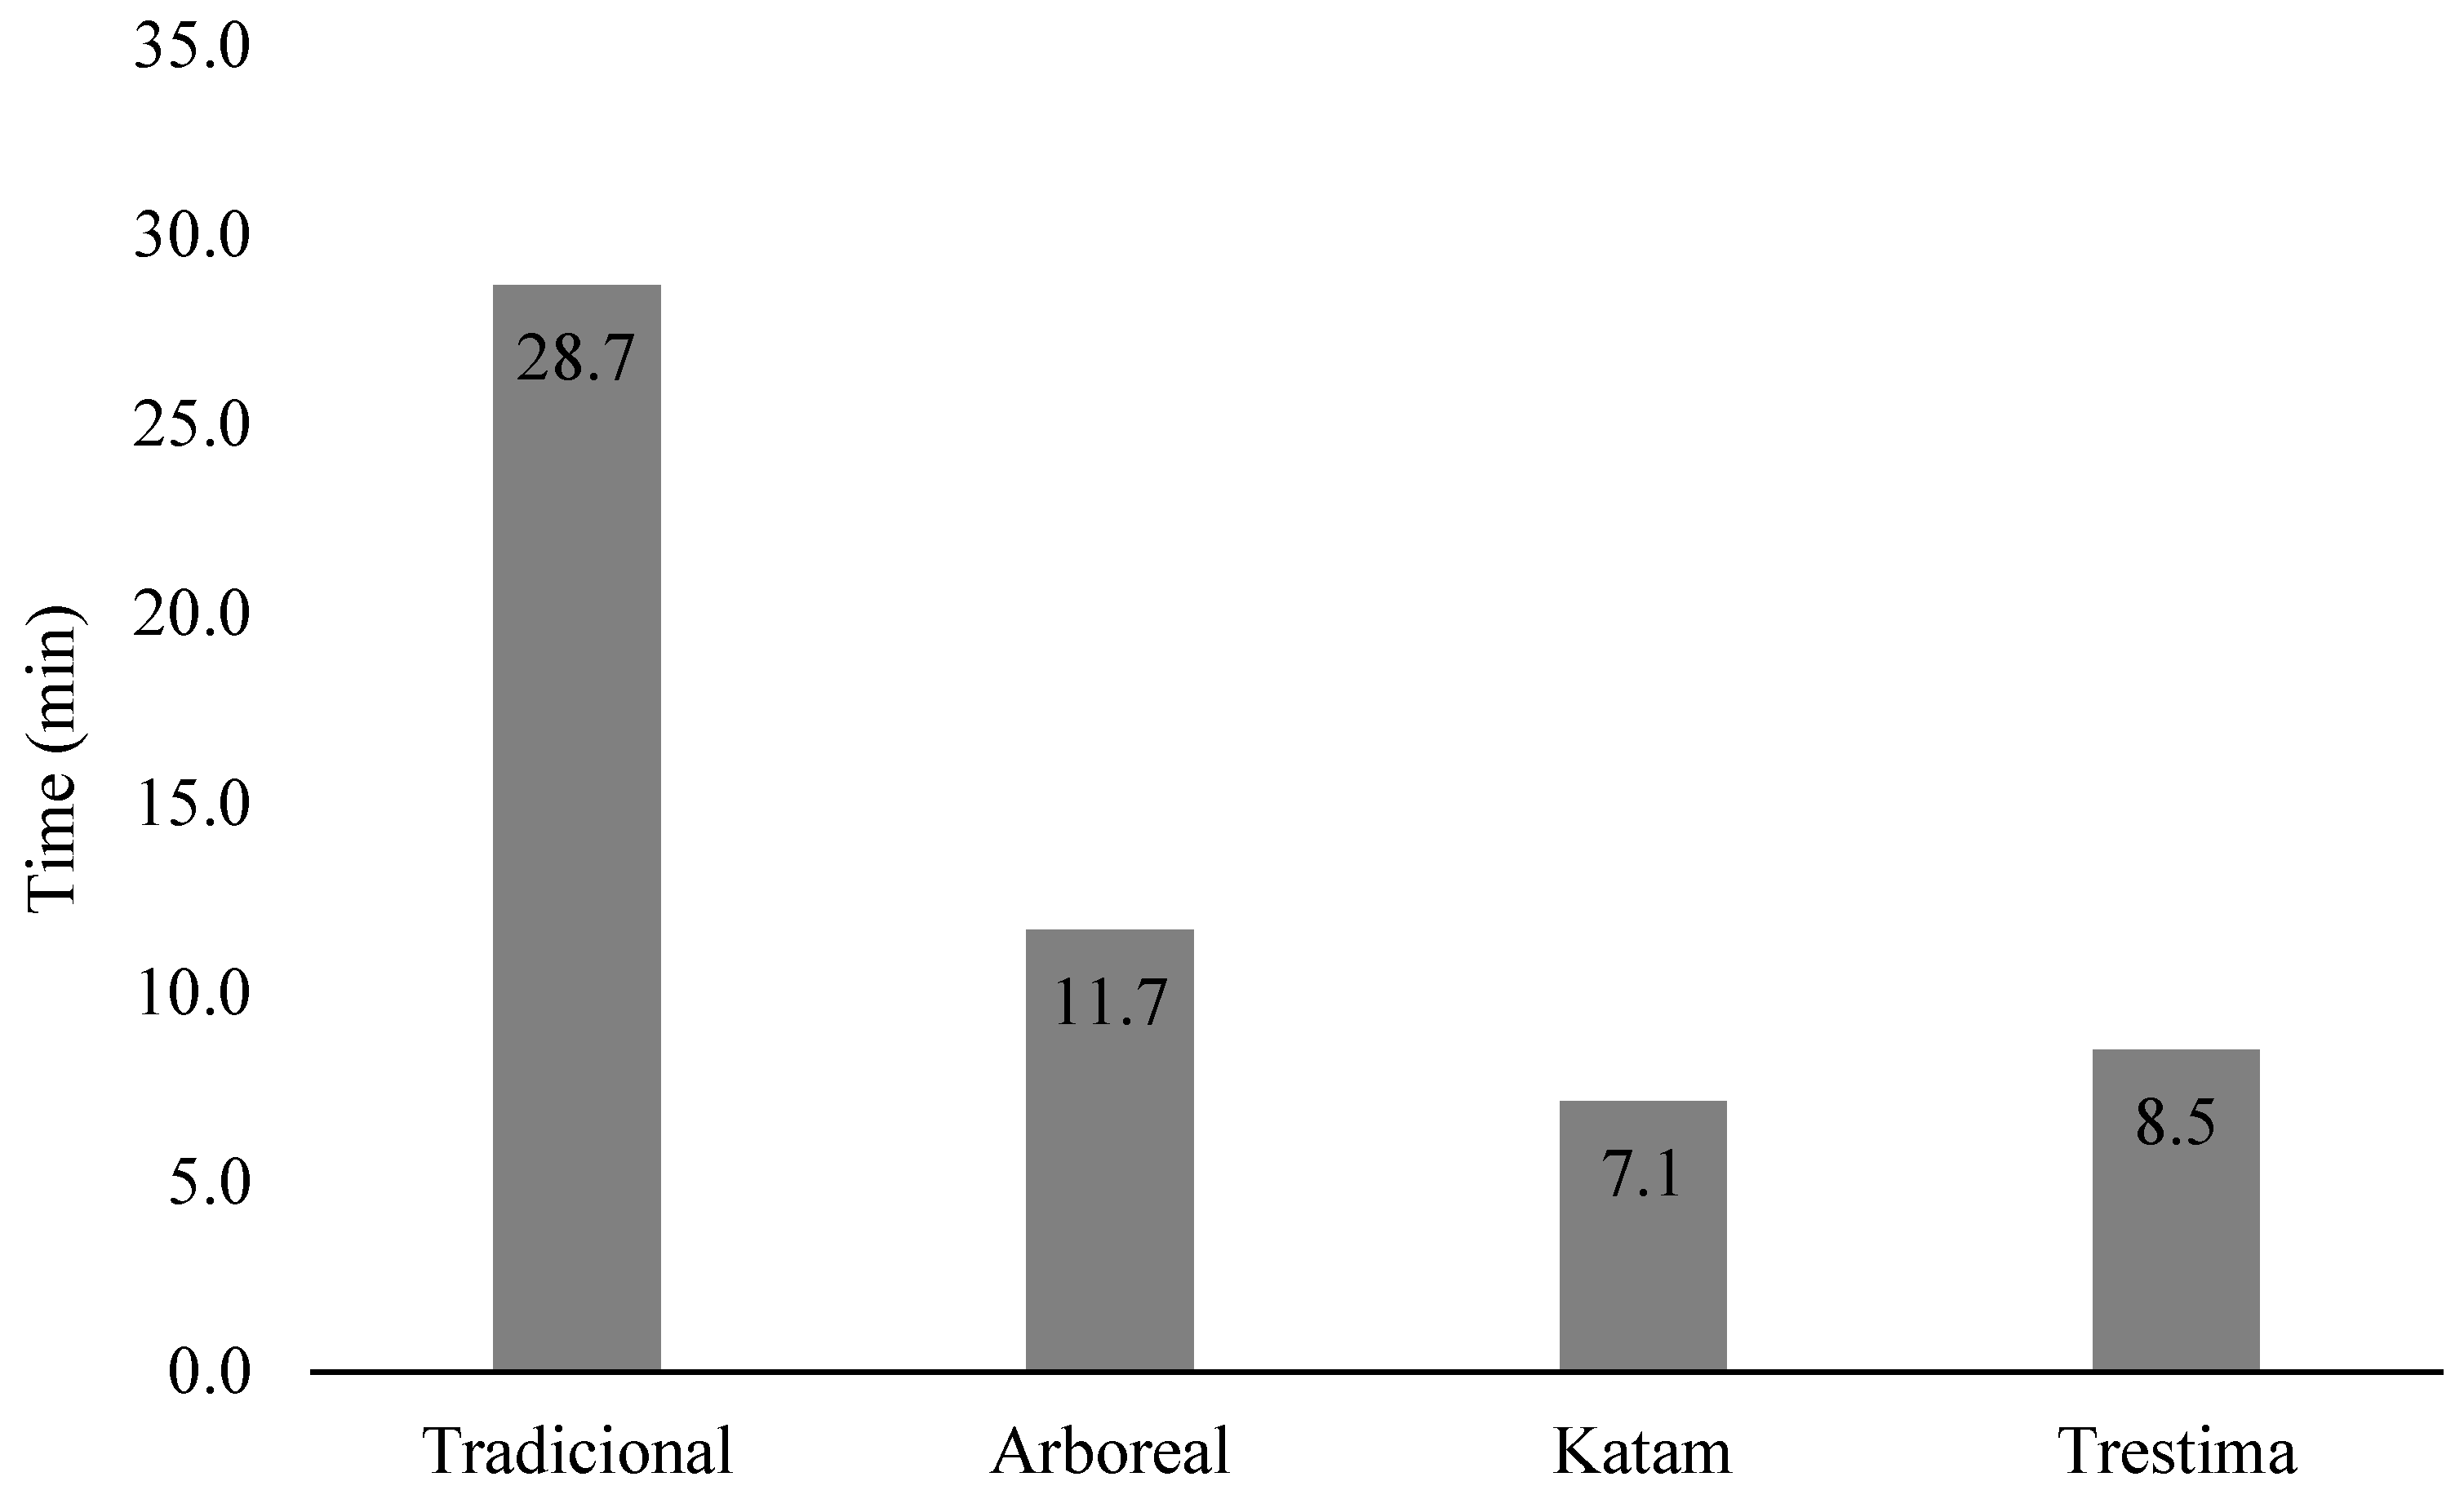
3.4. Average Time Required for Data Collection in the Field
3.5. Ranking the Apps: An Assessment Approach
4. Discussion
5. Conclusions
Author Contributions
Funding
Data Availability Statement
Acknowledgments
Conflicts of Interest
References
- Scott, C.; Gove, J. Forest inventory. In Encyclopedia of Environmetrics; El-Shaarawi, A.H., Piegorsch, W.W., Eds.; John Wiley & Sons, Ltd.: Chichester, UK, 2002; pp. 814–820. [Google Scholar]
- Robbins, W.; Young, H. The Forestry Chronicle; Canadian Institute of Forestry: Mattawa, ON, Canada, 1968. [Google Scholar]
- Freitas, A.; Wichert, M. Comparação Entre Instrumentos Tradicionais de Medição de Diâmetro e Altura com o Criterion 400; IPEF: Piracicaba, Brazil, 1998.
- Clark, N.; Randolph, H.; Schmoldt, L. A Rewiew of Past Research on Dendrometers. For. Sci. 2000, 46, 570–576. [Google Scholar]
- Villasante, A.; Fernandez, C. Measurement errors in the use of smartphones as low-cost forestry hypsometers. Silva Fenn. 2014, 48, 1114. [Google Scholar] [CrossRef]
- Trestima. Available online: https://www.trestima.com/w/en/ (accessed on 23 March 2023).
- Katam. Available online: https://www.katam.se (accessed on 23 March 2023).
- Arboreal. Available online: https://www.arboreal.se/en/arboreal-forest/ (accessed on 23 March 2023).
- Moti. Available online: http://www.moti.ch (accessed on 23 June 2023).
- Pitkänen, T.P.; Räty, M.; Hyvönen, P.; Korhonen, K.T.; Vauhkonen, J. Using auxiliary data to rationalize smartphone-based pre-harvest forest mensuration. Forestry 2022, 95, 247–260. [Google Scholar] [CrossRef]
- Täll, K. Accuracy of Mobile Forest Inventory Application Katam TM Forest-Evaluation of Accuracy in Different Forest Types and Comparison to Conventional Inventory Methods; SLU-Southern Swedish Forest Research Centre: Uppsala, Sweden, 2020. [Google Scholar]
- Pace, R.; Masini, E.; Giuliarelli, D.; Biagiola, L.; Tomao, A.; Guidolotti, G.; Agrimi, M.; Portoghesi, L.; De Angelis, P.; Calfapietra, C. Tree measurements in the urban environment: Insights from traditional and digital 1 field instruments to smartphone applications. Arboric. Urban For. 2022, 48, 113–123. [Google Scholar] [CrossRef]
- Lindberg, L. Insamling av Skogliga Data Med Applikationen Arboreal Skog—En Studie om Mätprecision, Noggrannhet och Effektivitet, Umeå. 2020. Available online: https://stud.epsilon.slu.se (accessed on 23 March 2023).
- Portuguese Institute of the Sea and Atmosphere. Available online: https://www.ipma.pt/pt/index.html (accessed on 25 July 2022).
- Özçelik, R.; Fonseca, T.; Parresol, B.; Eler, U. Modeling the diameter distributions of Brutian pine stands using Johnson’s SB distribution. For. Sci. 2016, 62, 587–593. [Google Scholar] [CrossRef]
- Wink, C.; Lima, S.; Curto, R.; Araujo, E. Celulares, aplicativos e operadores na mensuração florestal. BIOFIX Sci. J. 2022, 7, 46. [Google Scholar] [CrossRef]
- Werner, M.; Dalla Corte, M. Estimates for forest inventories in planted forests: A comparative approach between the use of katam tm technologies and the traditional forest inventory. Rev. Técnico-Científica Do CREA-PR 2022, 1–16. [Google Scholar]


| App | Operating System | Data Collection Methodology | Diameter Determination | Height Determination | Interface with Other Technologies | Outputs | Accuracy Reported by the Company |
|---|---|---|---|---|---|---|---|
| Arboreal | iOS | Individual tree image capture | Trunk recognition algorithm | Measurement of total height with the app on a representative tree identified by the app | Possibility of using Lidar on smartphones with this technology |
|
|
| Trestima | Android | Capture multiple still images (Photography) | Trunk recognition algorithm | Estimation by a height–diameter model | Planning on the web platform |
| Basal area standard error less than 5% (www.trestima.com—accessed on 24 March 2023) |
| Katam | Android | Dynamic image capture (Video) | Trunk recognition algorithm | Estimation by a height–diameter model | Possibility of collecting diameters and heights with unmanned aerial vehicle (drone) and processing data on the WEB |
| Not indicated |
| R2 | RMSE (cm) | BIAS (cm) | Efficiency | |||||
|---|---|---|---|---|---|---|---|---|
| Typology | Katam | Arboreal | Katam | Arboreal | Katam | Arboreal | Katam | Arboreal |
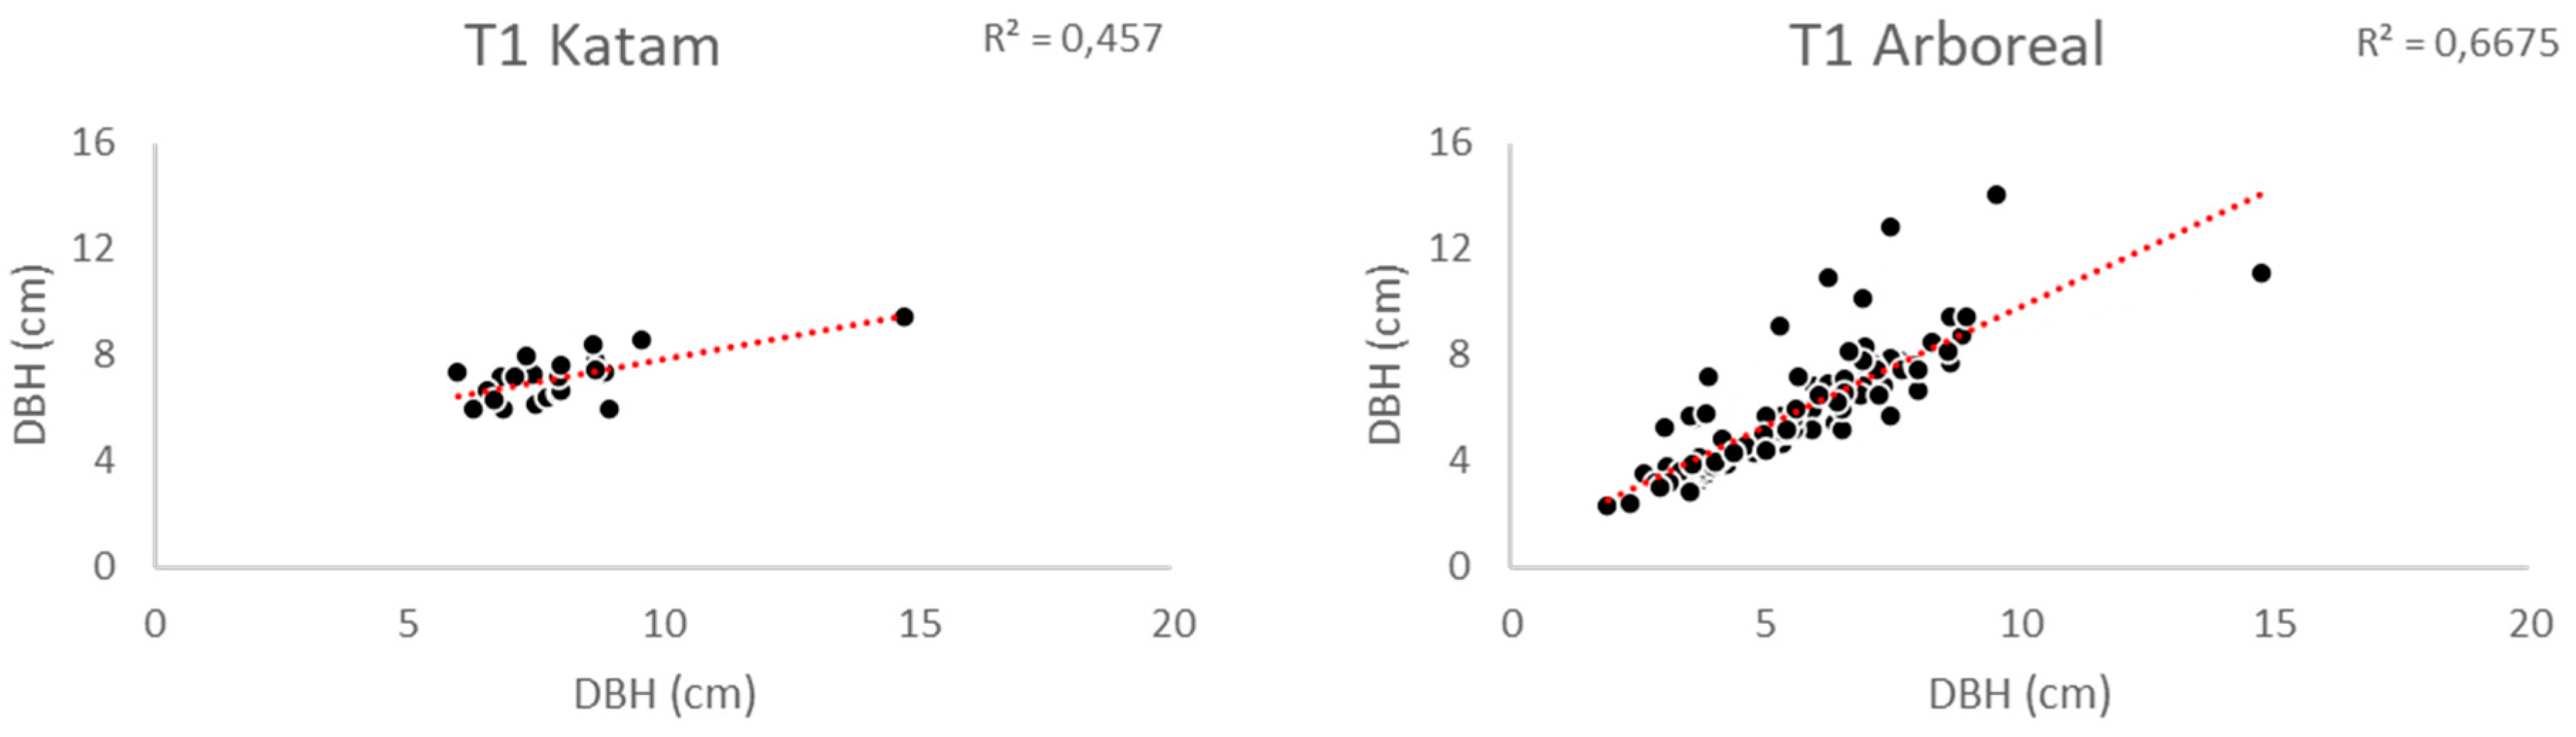
| T1 | 0.457 | 0.668 | 1.55 | 1.26 | −0.82 | 0.28 | −1.266 | 0.356 |
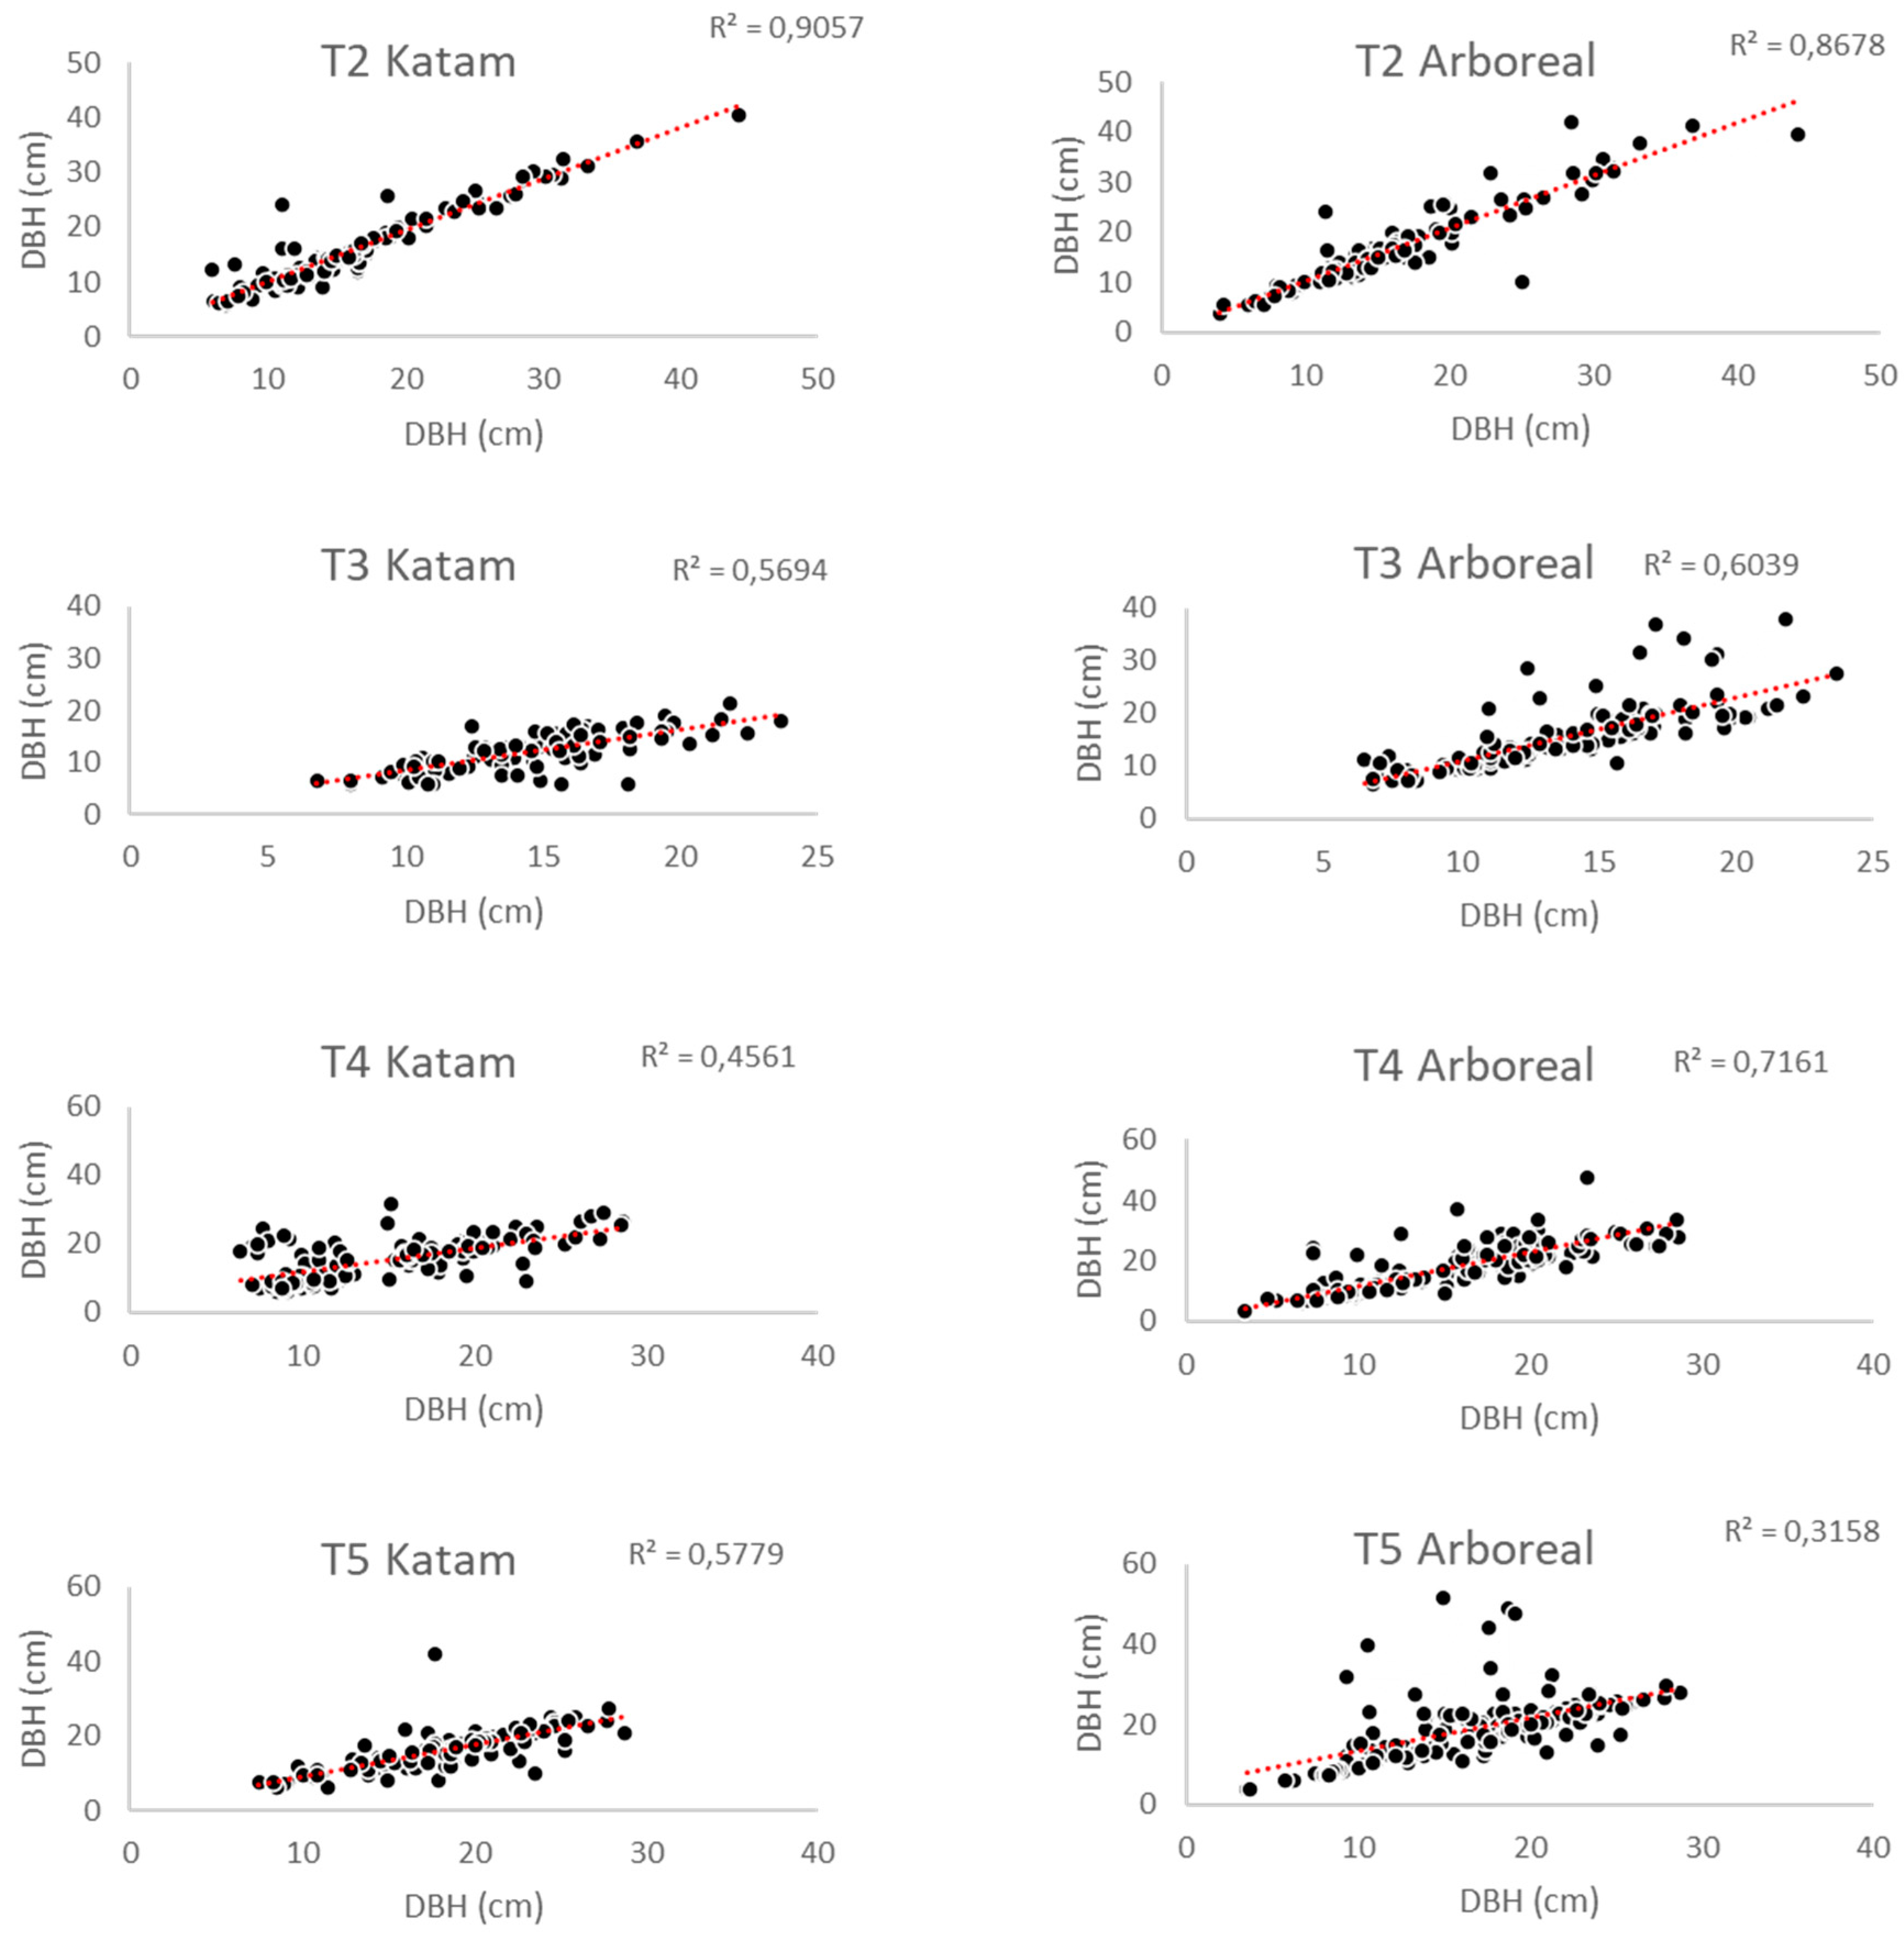
| T2 | 0.906 | 0.868 | 2.15 | 2.96 | −0.43 | 0.53 | −0.918 | 1.577 |
| T3 | 0.569 | 0.604 | 3.58 | 4.48 | −2.49 | 1.95 | −8.931 | 8.724 |
| T4 | 0.456 | 0.716 | 4.52 | 4.62 | 0.27 | 1.93 | 1.224 | 8.921 |
| T5 | 0.578 | 0.316 | 4.18 | 6.87 | −2.12 | 2.04 | −8.858 | 14.012 |
| T6A | 0.224 | 0.450 | 4.02 | 2.20 | −0.14 | 0.02 | −0.584 | 0.037 |
| T6B | 0.264 | 0.439 | 6.44 | 4.70 | 0.53 | 0.28 | 3.403 | 1.326 |
| T7 | 0.281 | 3.26 | 0.41 | 1.347 | ||||
| T8 | 0.739 | 2.26 | −0.40 | −0.911 | ||||
| T9 | 0.855 | 0.952 | 2.40 | 2.30 | −0.95 | −0.13 | −2.290 | −0.297 |
| T10 | 0.876 | 0.983 | 4.02 | 1.51 | −0.16 | −0.43 | −0.641 | −0.644 |
| T11 | 0.711 | 0.785 | 4.27 | 2.80 | −2.86 | 0.08 | −12.200 | 0.232 |
| T12 | 0.740 | 0.948 | 4.20 | 1.22 | −2.93 | −0.22 | −12.307 | −0.275 |
| Traditional | Katam | Arboreal | Trestima | |||||
|---|---|---|---|---|---|---|---|---|
| Typology | Mean | Std | Mean | Std | Mean | Std | Mean | Std |
| T1 | 5.705 c | 1.91610 | 7.181 b | 0.91685 | 5.954 bc | 2.12214 | 9.608 a | 3.10043 |
| T2 | 16.086 a | 6.97629 | 15.992 a | 6.75000 | 16.371 a | 7.96881 | 14.169 a | 5.72490 |
| T3 | 13.719 b | 4.03365 | 12.203 b | 3.76691 | 15.778 a | 6.30084 | 17.463 a | 5.73067 |
| T4 | 14.025 b | 5.83449 | 15.438 ab | 5.70857 | 15.917 a | 7.79753 | 14.714 ab | 6.35660 |
| T5 | 16.987 b | 5.49094 | 16.412 b | 5.47002 | 19.077 a | 7.88532 | 15.898 b | 6.89873 |
| T6A | 9.364 b | 1.94250 | 9.694 b | 4.57692 | 9.423 bc | 2.98755 | 12.555 a | 3.66517 |
| T6B | 14.964 a | 4.96652 | 16.597 a | 7.46641 | 15.850 a | 6.53727 | 15.058 a | 6.71233 |
| T7 | 6.442 c | 2.99048 | 9.233 b | 8.33888 | 6.796 c | 3.64509 | 11.505 a | 3.93149 |
| T8 | 11.386 a | 3.80811 | 12.785 a | 5.86721 | 10.999 a | 4.37026 | 12.008 a | 4.59613 |
| T9 | 23.323 a | 8.98368 | 22.213 a | 8.69248 | 22.468 a | 9.58425 | 22.700 a | 8.95050 |
| T10 | 29.759 a | 11.4986 | 29.858 a | 9.2892 | 29.311 ab | 1.3748 | 24.592 b | 7.2516 |
| T11 | 26.177 a | 5.36562 | 24.259 a | 5.96222 | 26.260 a | 6.08111 | 19.607 b | 7.33529 |
| T12 | 25.671 a | 5.58304 | 23.340 a | 5.91143 | 25.369 a | 6.44228 | 20.371 b | 6.56334 |
| Mean Comparison of N | ||||||||
|---|---|---|---|---|---|---|---|---|
| Traditional | Katam | Arboreal | Trestima | |||||
| Typology | Mean | Std | Mean | Std | Mean | Std | Mean | Std |
| T1 | 1362.5 a | 53.0 | 45.5 c | 64.3 | 1313.4 a | 17.7 | 583.0 b | - |
| T2 | 1075.0 a | 175 | 834.0 a | 135.6 | 1025.7 a | 173.3 | 994.0 a | 391.3 |
| T3 | 1058.3 a | 118.1 | 609.3 b | 184.3 | 1000.6 ab | 86.6 | 533.0 b | 87.4 |
| T4 | 1156.2 a | 196.2 | 697.2 b | 237.3 | 1119.5 ab | 227.8 | 789.3 ab | 92.4 |
| T5 | 820.0 a | 119.1 | 541.4 c | 96.3 | 760.5 a | 101.0 | 587.3 bc | 106.6 |
| T6A | 2162.5 a | 1184.4 | 1091.5 a | 597.5 | 2101.4 a | 1132.1 | 899.0 a | 280.0 |
| T6B | 975.0 a | 90.1 | 628.6 a | 107.3 | 925.6 a | 86.6 | 877.3 a | 267.4 |
| T7 | 3800.0 a | 671.7 | 499.0 b | 104.6 | 3652.4 a | 530.7 | 1260.0 b | 39.6 |
| T8 | 3175.0 a | 671.7 | 2022.0 a | 231.9 | 3027.0 a | 742.9 | 3004.0 a | 0.0 |
| T9 | 1000.0 a | 519.6 | 873.0 a | 601.9 | 942.0 a | 573.9 | 670.6 a | 112.8 |
| T10 | 800.0 a | 0 | 871.5 a | 10.6 | 738.0 a | 123.9 | 794.5 a | 299.1 |
| T11 | 687.5 a | 17.7 | 435.0 a | 26.8 | 688.0 a | 17.7 | 687.0 a | 153.4 |
| T12 | 641.6 a | 166.4 | 372.0 a | 145.4 | 558.7 a | 101.1 | 589.6 a | 79.5 |
| Mean Comparison of G | ||||||||
|---|---|---|---|---|---|---|---|---|
| Traditional | Katam | Arboreal | Trestima | |||||
| Typology | Mean | Std | Mean | Std | Mean | Std | Mean | Std |
| T1 | 1.6 a | 1.3 | 0.7 a | 0.7 | 1.5 a | 1.4 | 1.5 a | 1.0 |
| T2 | 4.9 a | 4.6 | 4.3 a | 4.3 | 4.5 a | 4.0 | 3.9 a | 2.7 |
| T3 | 3.8 a | 3.1 | 2.5 a | 2.2 | 3.6 a | 2.6 | 3.1 a | 2.0 |
| T4 | 4.5 a | 4.4 | 3.7 a | 3.1 | 4.3 a | 3.3 | 2.5 a | 1.8 |
| T5 | 4.6 a | 4.3 | 3.1 a | 3.1 | 4.1 a | 3.7 | 2.4 a | 1.6 |
| T6A | 2.6 a | 2.8 | 1.8 a | 2.2 | 2.0 a | 2.6 | 3.1 a | 3.1 |
| T6B | 4.1 a | 3.0 | 3.2 a | 2.1 | 3.7 a | 2.8 | 3.1 a | 2.1 |
| T7 | 4.0 a | 3.5 | 1.4 a | 2.2 | 3.6 a | 2.8 | 2.9 a | 3.1 |
| T8 | 6.5 ab | 6.1 | 1.7 b | 1.7 | 6.0 ab | 6.0 | 7.6 a | 4.5 |
| T9 | 6.7 a | 5.1 | 7.2 a | 5.9 | 6.3 a | 4.8 | 4.2 a | 2.6 |
| T10 | 6.4 a | 4.1 | 7.1 a | 5.4 | 6.1 a | 3.5 | 5.4 a | 4.2 |
| T11 | 7.1 a | 6.0 | 4.0 a | 4.0 | 7.1 a | 6.0 | 4.0 a | 3.1 |
| T12 | 6.1 a | 5.6 | 4.1 a | 3.6 | 4.7 a | 4.0 | 3.7 a | 2.7 |
| Criterion | Classification | Final Score | |||||
|---|---|---|---|---|---|---|---|
| Weight | Katam | Arboreal | Trestima | Katam | Arboreal | Trestima | |
| BIAS | 0.5 | 1 | 2 | 0 | 0.5 | 1 | 0 |
| RMSE | 0.5 | 1 | 2 | 0 | 0.5 | 1 | 0 |
| R2 | 0.5 | 2 | 1 | 0 | 1 | 0.5 | 0 |
| Efficiency (RMSE × BIAS) | 1 | 1 | 2 | 0 | 1 | 2 | 0 |
| Similarity N | 1 | 0 | 2 | 1 | 0 | 1 | 1 |
| Similarity d | 1 | 1 | 2 | 0 | 1 | 2 | 0 |
| Runtime | 1 | 2 | 0 | 1 | 2 | 0 | 1 |
| Similarity G | 2 | 2 | 2 | 2 | 4 | 4 | 4 |
| Error Index G | 2 | 1 | 2 | 0 | 2 | 4 | 0 |
| Total | 12 | 15.5 | 6 | ||||
Disclaimer/Publisher’s Note: The statements, opinions and data contained in all publications are solely those of the individual author(s) and contributor(s) and not of MDPI and/or the editor(s). MDPI and/or the editor(s) disclaim responsibility for any injury to people or property resulting from any ideas, methods, instructions or products referred to in the content. |
© 2023 by the authors. Licensee MDPI, Basel, Switzerland. This article is an open access article distributed under the terms and conditions of the Creative Commons Attribution (CC BY) license (https://creativecommons.org/licenses/by/4.0/).
Share and Cite
Sandim, A.; Amaro, M.; Silva, M.E.; Cunha, J.; Morais, S.; Marques, A.; Ferreira, A.; Lousada, J.L.; Fonseca, T. New Technologies for Expedited Forest Inventory Using Smartphone Applications. Forests 2023, 14, 1553. https://doi.org/10.3390/f14081553
Sandim A, Amaro M, Silva ME, Cunha J, Morais S, Marques A, Ferreira A, Lousada JL, Fonseca T. New Technologies for Expedited Forest Inventory Using Smartphone Applications. Forests. 2023; 14(8):1553. https://doi.org/10.3390/f14081553
Chicago/Turabian StyleSandim, André, Mariana Amaro, Maria Emilia Silva, Jorge Cunha, Susana Morais, Alexandra Marques, André Ferreira, José Luis Lousada, and Teresa Fonseca. 2023. "New Technologies for Expedited Forest Inventory Using Smartphone Applications" Forests 14, no. 8: 1553. https://doi.org/10.3390/f14081553
APA StyleSandim, A., Amaro, M., Silva, M. E., Cunha, J., Morais, S., Marques, A., Ferreira, A., Lousada, J. L., & Fonseca, T. (2023). New Technologies for Expedited Forest Inventory Using Smartphone Applications. Forests, 14(8), 1553. https://doi.org/10.3390/f14081553