Abstract
To avoid the intrinsic difficulties regarding the characterization of wood (i.e., different applications in different directions), various normative documents present the relationships between properties; the Brazilian standard is of particular interest in this regard, because Brazil has a huge diversity of tree species from tropical forests, usually used in construction. In view of this, this research aimed to propose a new list of properties to be inserted in future versions of the Brazilian standards in order to help identify the species shear strength. It is expected that there is a correlation between the characteristic values of flexural strength (fm,k) and shear strength in the direction parallel to the wood fibers (fv,0,k), leading to models that make it possible to estimate one of the properties if the other is known, which was the main objective of this research. After finding a strong correlation between the properties, various regression models were evaluated. It can be concluded that the linear model composed only by the angular coefficient (equation with only one variable) presented a determination coefficient of 76.45%, which shows the good precision achieved in the estimation of one of the two variables compared if the other is known. Additionally, an attempt was made to define which probability distribution represents the resistance data by applying maximum likelihood (MLE), concluding that there is little difference between the representation by the normal distribution and the generalized extreme value (GEV) distribution. Another approach was to define the undermining coefficient to ensure the reliability of the prediction equation by the experiment-based calibration methodology defined by Eurocode.
1. Introduction
Wood is a renewable resource with great versatility in civil construction. From a structural point of view, it has an excellent strength-to-density ratio when compared to other materials used in civil construction, i.e., steel and concrete [1,2,3,4].
In Brazil, 60% of the land surface is made up of forests, which corresponds to 500 million hectares. Of this area, 98.03% is composed of natural forests, while the remaining 1.97% are planted forests [5]. Wood species from native forests are commonly used in structural design, and the Brazilian standard ABNT NBR 7190 [6] establishes the premises and calculation methods for the project of wooden structures and presents physical and mechanical properties of several species. Some species are no longer commercialized in the country, which motivates the use of new species for structural purposes, among other applications.
As stated in the Brazilian standard NBR 7190 [6], several properties need to be known for the correct design and use of wood structures; e.g., tensile and compressive strength parallel (ft0,k and fc0,k) and normal to the fibers (ft90,k and fc90,k), shear strength parallel and normal to the fibers (fv0,k and fv90,k), embeddedness, apparent density (ρ), modulus of elasticity (E), and toughness, among others. However, the vast majority of these tests require the use of specific equipment that is only found in large research centers. This fact makes characterizations of this nature difficult, given the scarcity of laboratories of this magnitude in Brazil [7]. Due to this scarcity, the standards establish numerical correlations that allow the determination of mechanical properties through mathematical models, e.g., Equations (1)–(3) of NBR 7190 [6], where fc0,k is the characteristic fiber parallel compressive strength, ft0,k the characteristic fiber parallel tensile strength, and fm,k the characteristic flexural tensile strength. Such a situation can be seen in the vast majority of structural design codes.
As can be seen, the characterization of a wood species can be carried out more quickly by not having to perform all the existing experimental tests. However, the Brazilian regulations present few predictive relationships, a factor that has motivated the development of research in this area. As an example, Lahr et al. [7] used apparent density as an estimator of compressive strength, since density is an easily obtainable property. In their research, a coefficient of determination (R2) of 74.87% was achieved in a logarithmic regression model. Lahr et al. [8] analyzed the relationship between characteristic values of shear and compressive strength, both evaluated in the direction parallel to the fibers, concluding that the coefficient value 0.24 (fv0,k = 0.24 × fc0,k) is more accurate than the value of 0.12 established by the Brazilian standard [6]. Other researches have also been undertaken with the same purpose using the same or other methodology [9,10,11,12,13,14].
Another important characteristic to understand the uncertainties of the materials and to enable the simulation of test situations for wood, or any material, is to know the statistical distribution that best represents its behavior. One way to perform this check is through likelihood (MLE), as performed by Barker [15] in wood phylogenetic analyses. Thus, since wood strengths are important in many analyses, knowing their probabilistic distribution helps to find their characteristic value based on the percentile of probability of occurrence. Pang et al. [16] used MLE to avoid misinterpretation in order to understand the meaning of the developed test results that are hidden by suffering an unintentional failure mechanism.
There is also the need to establish the reliability of the proposed equation. One methodology to ensure this probability of failure is that specified in Annex D of EN 1990 [17] which uses the coefficients of variation of the variables, the predicted values, and experimental values to define the predictive model’s calibration coefficient (γ) that should be applied to the new expression to ensure its reliability.
Thus, this article has as its main objective the proposition of a new relationship between mechanical properties of wood from native Brazilian species. This study will allow future versions of the Brazilian standard NBR 7190 [6] to have wider coverage of predictive numerical models. It also presents the distribution type test that can represent the strength properties of wood, in addition to the calibration of the equation by the methodology of EN 1990 [17].
In the case of this article, the investigation was carried out by associating the resistance of wood to different loads involved in simple bending. This paper investigated prediction models through the use of various regression models based on ANOVA, and the accuracy of these models correlating characteristic values of flexural strength (fm,k) with shear (fv0,k) in the direction parallel to the fibers of hardwoods from native forests. Furthermore, the contribution of this new expression is due to the fact that the wood shear test does not require a displacement transducer, making it possible to perform it in a greater number of national laboratories that do not have such a transducer.
2. Materials and Methods
As previously mentioned, the objective of this work is to define a relationship between wood resistances, so that if the wood shear resistance is known, the wood flexural resistance can be obtained (fm,k). This relationship is possible to determine since there are normal stresses and shear stresses involved in simple bending [18].
Therefore, an experimental study was built that contemplates 17 hardwood species covering the five strength classes (C20, C30, C40, C50, and C60) of the Brazilian standard NBR 7190 [6]. It is worth pointing out that the strength classes of the Brazilian standards are ordered according to the compressive strength parallel to the fibers (fc0,k) of the wood: 20 MPa ≤ fc0,k < 30 MPa (C20); 30 MPa ≤ fc0,k < 40 MPa (C30); 40 MPa ≤ fc0,k < 50 MPa (C40); 50 MPa ≤ fc0,k < 60 MPa (C50); and 60 MPa < fc0,k (C60). The wood batches were composed of 12 boards of each species, with dimensions 12 cm × 12 cm × 300 cm, free of defects and made up almost entirely of core wood (wood from the center of the tree trunk). The samples were taken randomly throughout the batches, according to the prescriptions of the Brazilian standard ABNT NBR 7190 [6]. Furthermore, no more than one specimen was taken per test from the same piece of wood. Table 1 presents the common and scientific names and origins of the species studied. It is worth noting that all the results obtained were for a humidity of 12%, as indicated by the Brazilian norms [6].

Table 1.
Wood species used in the research.
2.1. Experimental Tests
According to Brazilian normative premises [6], 12 specimens are required for the determination of each property analyzed. The properties obtained in this research consisted of apparent density, compressive strength parallel to the fibers (fc0—Figure 1a,b), flexural strength (fm—Figure 1c,d), and shear strength in the direction parallel to the fibers (fv0—Figure 1e,f). Of these properties, it is worth mentioning that the compressive strength parallel to the fibers had the purpose of classifying each wood species according to the strength classes of the Brazilian standard, a classification established based on the characteristic value of the compressive strength in the direction parallel to the fibers [6]. All samples were cut following Brazilian normative premises [6], in which a circular saw was used, always keeping the faces parallel and smooth.
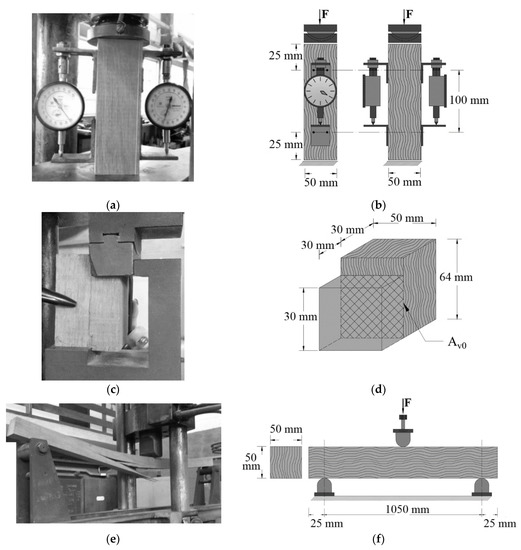
Figure 1.
Experimental tests and the respective specimens: (a,b) compressive strength parallel to the fibers, (c,d) shear strength parallel to the fibers, and (e,f) flexural strength.
As established by the Brazilian standard [6], once the wood’s moisture content is determined, the values for mechanical properties should be corrected (Equation (4)) for 12% moisture content, which is considered the equilibrium value by this standard. It is noteworthy that, for the correct use of this equation, the moisture value needs to be less than 20% and can be used in all wood species. In this research, an oven (temperature ranging from 40 °C to 90 °C) was used to reach this humidity, being subsequently corrected.
In Equation (4), f12 represents the strength property corrected for 12% moisture content, fU% is the strength property obtained at the given humidity, and U% is the sample’s moisture content.
After correcting the strength properties for the 12% moisture content, it was possible to determine the characteristic strength values (fk) for each species, as presented in Equation (5). From this equation, n is the number of samples (12) and f1 to fn are the strength values of each specimen arranged in increasing order. The characteristic value is considered to be the highest between the lowest value obtained experimentally (f1), 70% of the average of the evaluated samples, or the value obtained considering “n/2” specimens.
2.2. Statistical Analysis
All statistical analyses were conducted in Jupyter Notebook version 6.4.12. The Pearson correlation (−1 ≤ r ≤ 1) was evaluated between the properties considered in the present investigation (Equation (6)). From this test, the closer to −1 or 1, the higher the correlation between the properties. Additionally, analysis of variance (ANOVA, 5% significance) was used to verify the significance of the tested correlations. By the formulation of this test, a p-value (probability) less than 0.05 indicates that the correlation is significant, and not significant otherwise.
Table 2 shows the regression models considered in the statistical analyses, where fv0,k is the independent variable, fm,k is the dependent variable, αx consist of the constants fitted by the least squares method, and ε is the random error. The ANOVA of the regression models was also calculated at the significance level of 5%. In this case, the selected null hypothesis was the non-representativeness of the tested models (H0: β = 0), whereas the representativity was an alternative hypothesis (H1: β ≠ 0). P-values higher than the level of significance implied accepting H0 (the model tested was not representative; variations of fv0,k were unable to explain the variations in fm,k). In addition, the values of the adjusted coefficient of determination (R2) were obtained to evaluate the probability of changing the independent variable fv0,k to explain the predictive variable fm,k. Following this procedure, the model selection that presents the best fit to the experimental results was carried out.
Table 2.
Regression Models.
Another statistical analysis performed was which probability distribution the resistance variable can be predicted from. For this, the maximum likelihood theory (MLE) was applied, which is, in a reduced way, a methodology to estimate which probability distribution can best represent the behavior of the data, managing to represent by its expression the data behavior [19,20].
2.3. Model Calibration
In order to improve the discussion and make the results more applicable at the level of an application in structural design, this section aims to present the theory of calibration of the prediction equation. This procedure is justified since the prediction equations will present a variability with the real value due to several model uncertainties. Therefore, it is necessary that the prediction and action equations be calibrated to present a minimum probability of failure (pf).
For this process, Annex D of the European standard Eurocode: Basis of structural design EN 1990 [17] was used. Such calibration is called “Design assisted by testing” and is used to determine calibration coefficients in predictive models based on experimental values [21].
For the calibration coefficient determination, the sample data of the tests performed according to the recommendation of EN1990 [17] were used. In addition, it is necessary that some conditions are met; e.g., all variables in the model must follow a normal or log-normal distribution, as well as the resistance values found experimentally. Another consideration is that the variables involved in the resistance function must not be correlated, since this will not be considered.
For the predictive model calibration, it is necessary to build the resistance factors. In the case of EN 1990 [17] these would be the design resistance values (rd) and the characteristic resistance value (rk), given by Equations (7) and (8).
where Qrt is the logarithmic standard deviation of the prediction resistance, Qδ is the logarithmic standard deviation of the error, and Q is the logarithmic standard deviation of the product of rt (predictive model equation representing the resistance function) and δ (scatter error). αrt is the ratio of Qrt and Q and αδ is the ratio of Qδ and Q. The coefficient k∞ is worth 1.64 and kd,∞ and kd,n are worth 3.04 for n > 30. In case of fewer samples, refer to Table D1 and D2 of the EN 1990 [17].
The coefficient b of the line is found by least squares, as shown in Equation (9), which represents the experimental value from the database.
With all the data above, it is possible to obtain the predictive model’s calibration coefficient by means of Equation (10).
3. Results and Discussion
3.1. Model Proposition
Figure 2 shows the mean values, the confidence intervals of the mean (95% reliability), and the extreme values of the coefficients of variation (CV) of the evaluated properties, as well as the characteristic values of wood strength for the 17 species evaluated.
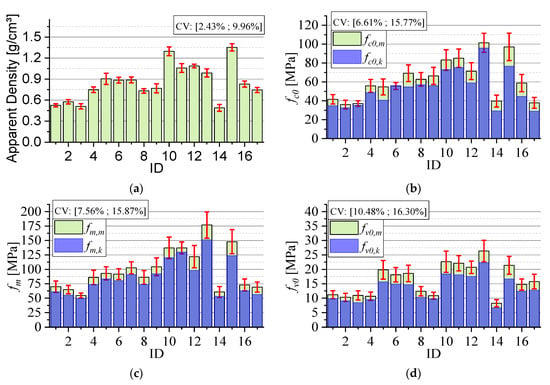
Figure 2.
Results of averages and characteristic values of the evaluated properties: (a) apparent density, (b) compressive strength parallel to the fibers, (c) flexural strength, and (d) shear strength parallel to the fibers.
As indicated, to elaborate regression models of higher accuracy, it is important that the listed wood species belong to all resistance classes [7,9]. As can be seen from Figure 2b, the wood species considered were classified in each of the five strength classes of the Brazilian standard [6]. As required by the Brazilian standard, the coefficients of variation (CV), shown in parentheses in Figure 2, were less than 18%. This confirms the homogeneity of the wood lots evaluated. Finally, it is also worth mentioning the relationship between the density of the species and the compressive strength; the higher the density, the higher the resistance of the wood piece, as also verified by other authors [7,8,9].
Table 3 presents the results of the Pearson’s correlation test. As can be seen, the property that has the highest correlation with the flexural strength is the compressive strength in the direction parallel to the fibers (r = 0.960). Nevertheless, the shear strength in the direction parallel to the fibers also has a good correlation (r = 0.876), justifying the possibility of adding this relationship to the Brazilian standards, in addition to the existing relationship between tension and compression, because, according to this document, the compressive strength in the direction parallel to the fibers is the most important mechanical property. Additionally, it is noted that all p-values were less than 5%, which shows that all correlations are significant. It is worth mentioning that the relationship between compression and bending is already established in Brazilian standards.
Table 3.
Pearson’s correlation test.
Table 4 shows the results of the regression models evaluated in this research, the respective adjusted determination coefficients (R2adj), and the ANOVA results (5% significance) of the models and regression, underlining the terms of each model not considered significant (p-value ≥ 0.05).
Table 4.
Regression models evaluated in this research.
According to Montgomery [22], for a model to be considered accurate it is necessary that it presents a coefficient of determination greater than 70%, and the closer to 100%, the more accurate it is [7,23,24]. As can be seen, all models, except for the logarithmic model, presented good fits. In this case, the quadratic model was the one with the highest accuracy (78.13%), but the quadratic term was considered as not significant by ANOVA (p-value ≥ 0.05). As a result, the linear model, equally adopted by the Brazilian normative premises [6], can be considered the most significant for predicting flexural tensile strength as a function of fiber parallel shear strength (R2 = 76.45%).
Figure 3 illustrates the obtained results in the regression model and the equation-based regression model of the Brazilian standard.
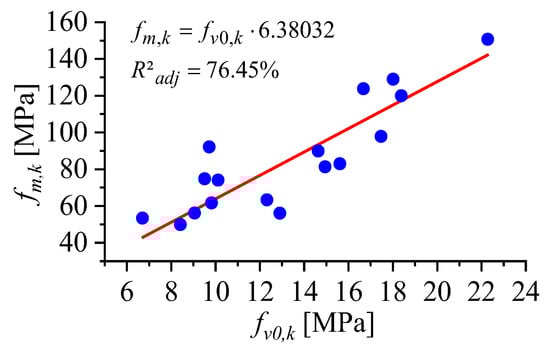
Figure 3.
Regression model curves based on NBR 7190 [6] methodology for the best fit.
3.2. Maximum Likelihood Estimation
After testing the wood for compression and obtaining its characteristic strength values, the wood was classified according to its strength classes following the NBR 7190 [6] instructions, as presented in Table 5. This resistance class was used as a criterion to unite the groups of wood, being studied as groups of classes for the statistical analyses to define the probabilistic distribution with application of the likelihood method.
Table 5.
Compressive strength class.
In each species, 12 samples were tested. Thus, when it comes to class C30, the database was 36 samples (N), having three species of wood. With these groups it was evaluated which probabilistic distribution would best fit that data with the likelihood ratio (MLE); these results are presented in Table 6 for the wood compressive strengths, with the results of the tests using both normal distribution and generalized extreme value (GEV).
Table 6.
Results of likelihood ratio tests for compressive strength (fc0).
The MLE values are smaller in modulus for the GEV-type distribution, which has its estimated distribution parameters shown in Table 6, showing that the best distribution that fits the data is the GEV-distribution. However, it can be seen that the MLE of the normal distribution (fitstd) was very close to the MLE of the GEV (fitGEV), showing that it can also represent the data in this problem in a simpler mathematical formula. Figure 4 shows the cumulative probability (CDF) of the compressive strengths and the plot of each estimated probability distribution. In Figure 4, fitGEV and fitstd represent the MLE of GEV and MLE of normal cumulative distributions, respectively, according to the parameters in Table 6.
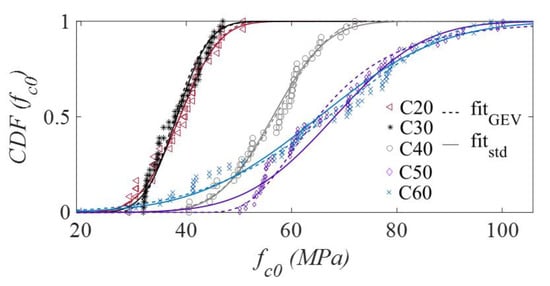
Figure 4.
Cumulative distribution function (CDF) of the compressive strength stress with the GEV distribution (fitGEV) and normal distribution (fitstd).
With Figure 4 it is possible to observe that the C50 and C60 woods have a slightly more distinct behavior between the normal and GEV distributions. Nevertheless, the experimental data are closer to the value of the distribution, especially near the 0.50 cumulative probability. Table 7 shows the MLE results for shear strength.
Table 7.
Results of likelihood ratio tests for shear strength (fv0).
It can be seen that the likelihood with the GEV distribution (MLE GEV) was better in all wood classes, but the difference in value with the normal distribution was low, less than two MLE units. Thus, since the amount of analysis, calculations, and predictions for simulations are simpler for normal distribution, it can be considered that the shear stress can be represented by a normal distribution, with mean and variance being the experimental values.
The good adherence of the experimental values to the likelihood-tested probabilistic distribution expressions are presented in Figure 5. The chosen distributions are for each wood strength group. In Figure 5, fitGEV and fitstd represent the GEV and normal distributions, respectively, according to the parameters in Table 7.
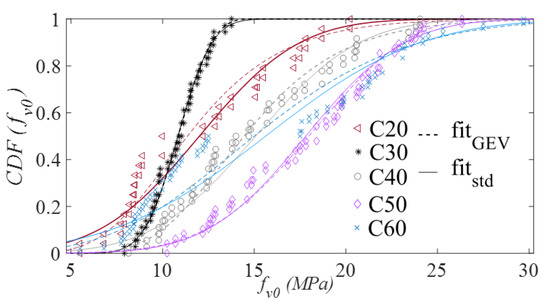
Figure 5.
Cumulative distribution function (CDF) of the shear strength stress with the GEV distribution (fitGEV) and normal distribution (fitstd).
It can be seen that for C30 and C50, the normal and generalized extreme value (GEV) distributions translate to almost the same cumulative probability for the evaluated strength. In the other classes it is noted that the distributions present a behavior with a small difference, but the cumulative probabilities (CDFs) of the experimental results are also more dispersed, with less indication of a natural trend in the data (results following a line or curve shape, and not as a scattered cloud). Table 8 shows the MLE for flexural strength.
Table 8.
Results of likelihood ratio tests for flexural strength (fm).
The flexural strength also presented the same behavior when dealing with normal and GEV distribution, and followed the same conclusions as the cases of compression and shear. The accumulated density functions for the flexural strength are presented in Figure 6. In Figure 6, fitGEV and fitstd represent the GEV and normal distributions, respectively, according to the parameters in Table 8.
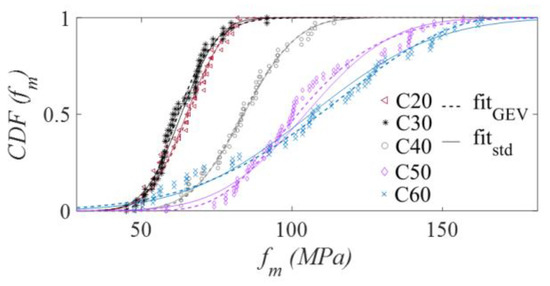
Figure 6.
Cumulative distribution function (CDF) of the bending tensile strength with the GEV distribution (fitGEV) and normal distribution (fitstd).
For wood grades C20 to C40, the results have a behavior that can be predicted by the probability expression with high accuracy because the experimental values are very close to the cumulative probability values of the distribution. Furthermore, as can be seen in Figure 6, the distributions are very close. In this way, the wood resistance to the three loads (compression, shear, and bending) can be represented by normal distribution behavior with little insertion of uncertainties when compared to the GEV distribution, which according to MLE is the most representative. Next, the proposed model calibration equation will be presented in order to guarantee a minimum probability of failure to the model.
3.3. Model Calibration for Proposed Equation
With the distribution type conditions of the wood resistances being represented by a normal distribution, it is possible to apply the prescription of EN 1990 [17] that determines the resistance reduction coefficient (γ) to turn the characteristic value into design value. Following the calculation procedure of Annex D of EN 1990, using the coefficients of variation of the variables determined with the experimental database, the values of Table 9 are obtained.
Table 9.
Model calibration for flexural resistance.
The values in Table 9 were calculated using only the characteristic values of each wood species. However, if the same procedure is performed with the experimental strength values, the calibration coefficients (γ) are 2.16 and 2.05 for the proposed model and for the NBR 7190 [6] expression, respectively. This increase in value is fair due to the increase of the data set from 17 to 204 inputs, and consequently a higher coefficient of variation of the properties.
4. Conclusions
As a result of this research, the following conclusions can be made:
- i.
- As expected, there is a strong correlation between shear and bending of wood pieces.
- ii.
- Compressive strength has the highest correlation index for predicting flexural strength, with shear strength having the second highest index.
- iii.
- The most effective regression model was linear (i.e., had a p-value of less than 5% and came closest to 100%), where a coefficient of determination of 76.45% was obtained.
- iv.
- The quadratic regression model had the highest coefficient of determination (78.13%), but the quadratic term (fv0,k2) was found to be non-significant by ANOVA (p-value ≥ 0.05).
- v.
- The linear model, also presented by Brazilian regulations, presents an excellent determination coefficient (76.45%), besides being close to the best model obtained (−1.68%). Therefore, this model could be included in the next normative revisions.
- vi.
- vii.
- After verifying the model error, it was possible to establish a safety partial factor for the proposed prediction equation to ensure safety. This partial factor for resistance (γ) has a value of 2.04.
Author Contributions
Conceptualization, A.L.C. and F.A.R.L.; methodology, A.L.C. and H.F.S.; software, F.N.A. and J.F.B.; validation, W.M.P.J. and T.H.P.; formal analysis, F.N.A. and I.A.O.; investigation, W.M.P.J.; resources, H.F.S.; data curation, J.F.B. and I.A.O.; writing—original draft preparation, F.N.A.; writing—review and editing, A.L.C.; visualization, T.H.P.; supervision, F.A.R.L.; project administration, A.L.C.; funding acquisition, H.F.S. and I.A.O. All authors have read and agreed to the published version of the manuscript.
Funding
This research was funded by CAPES (Coordenação de Aperfeiçoamento de Pessoal de Nível Superior—Finance Code 001), CNPq (Conselho Nacional de Desenvolvimento Científico e Tecnológico), and by the Pró-Reitoria de Pesquisa, Inovação e Pós-Graduação of Instituto Federal de Rondônia (PROPESP/IFRO).
Data Availability Statement
The data presented in this study are available on request from the corresponding author.
Acknowledgments
We would like to acknowledge the Pró-Reitoria de Pesquisa, Inovação e Pós—Graduação of Instituto Federal de Rondônia (PROPESP/IFRO) and the Coordenação de Aperfeiçoamento de Pessoal de Nível Superior—Brazil (CAPES).
Conflicts of Interest
The authors declare no conflict of interest.
Abbreviations
| fm,k | flexural tensile strength |
| ft0,k | tensile strength parallel to the fibers |
| fc0,k | compressive strength parallel to the fibers |
| ft90,k | tensile strength normal to the fibers |
| fc90,k | compressive strength normal to the fibers |
| fv0,k | shear strength parallel to the fibers |
| fv90,k | shear strength normal to the fibers |
| MLE | maximum likelihood ratio |
| γ | calibration coefficient |
| GEV | generalized extreme value distribution |
| CDF | cumulative distribution function |
References
- Li, M.; Khelifa, M.; Khennane, A.; El Ganaoui, M. Structural response of cement-bonded wood composite panels as permanent formwork. Compos. Struct. 2019, 209, 13–22. [Google Scholar] [CrossRef]
- Oliveira, G.O.B.; Pinheiro, R.V.; Arroyo, F.N.; de Almeida, D.H.; de Almeida, T.H.; Silva, D.A.L.; Christoforo, A.L.; Lahr, F.A.R. Technical Feasibility Study of the Use of Softwoods in Lattice Structure “Howe” Type for Roofing (Gaps between 8–18 Meters). Curr. J. Appl. Sci. Technol. 2019, 35, 1–8. [Google Scholar] [CrossRef][Green Version]
- Pigozzo, J.C.; Arroyo, F.N.; Christoforo, A.; Junior, C.C.; Lahr, F.A.R. Pull out Strength Evaluation of Steel Bars Bonded-in to 45° in Round Timbers of Corymbia citriodora Treated with CCA. Int. J. Mater. Eng. 2017, 7, 25–32. [Google Scholar] [CrossRef][Green Version]
- Almeida, T.H.; Almeida, D.H.; Arroyo, F.N.; De Araujo, V.A.; Chahud, E.; Branco, L.A.M.N.; Pinheiro, R.V.; Christoforo, A.L.; Lahr, F.A.R. Time of exposure at 60 °C service temperature: Influence on strength and modulus of elasticity in compression parallel to the grain of hardwood species. Bioresources 2019, 14, 207–219. [Google Scholar] [CrossRef]
- SNIF (Sistema Nacional de Informações Florestais). Definição de Floresta. Portal Do Governo Brasileiro 2019:1. Available online: https://snif.florestal.gov.br/pt-br/florestas-e-recursos-florestais/167-definicao-de-floresta (accessed on 10 February 2023).
- ABNT. NBR 7190; Projeto de Estruturas de Madeira. Associação Brasileira de Normas Técnicas: Rio de Janeiro, Brazil, 2022.
- Lahr, F.A.R.; Arroyo, F.N.; Rodrigues, E.F.C.; Almeida, J.P.B.; Aquino, V.B.D.M.; Wolenski, A.R.V.; dos Santos, H.F.; Ferraz, A.L.N.; Chahud, E.; Molina, J.C.; et al. Models to estimate longitudinal compressive strength of Brazilian hardwood based on apparent density. Bioresources 2021, 16, 1373–1381. [Google Scholar] [CrossRef]
- Lahr, F.A.R.; Chahud, E.; Arroyo, F.N.; Christoforo, A.L.; Rodrigues, E.F.C.; Almeida, J.P.B.; Aquino, V.B.D.M.; dos Santos, H.F. Ratio analysis between compression and shearing of 72 Brazilian wood species. Wood Res. 2021, 66, 711–720. [Google Scholar] [CrossRef]
- Wolenski, A.R.V.; Dias, F.M.; Peixoto, R.G.; Christoforo, A.L.; Lahr, F.A.R. Modelos para estimativa das propriedades mecânicas de compressão e tração na direção paralela às fibras. Ambient. Constr. 2020, 20, 263–276. [Google Scholar] [CrossRef]
- Lu, D.; Yu, W. Predicting the tensile strength of single wool fibers using artificial neural network and multiple linear regression models based on acoustic emission. Text. Res. J. 2021, 91, 10. [Google Scholar] [CrossRef]
- Montero, C.; Rozas, C. Exploratory study for the characterization of the wood drying rate of Eucalyptus nitens timber, applying multiple regression models. Sci. For. 2019, 47, 105–113. [Google Scholar] [CrossRef]
- Haftkhani, A.R.; Abdoli, F.; Sepehr, A.; Mohebby, B. Regression and ANN models for predicting MOR and MOE of heat-treated fir wood. J. Build. Eng. 2021, 42, 102788. [Google Scholar] [CrossRef]
- Bardak, S.; Tiryaki, S.; Bardak, T.; Aydin, A. Predictive Performance of Artificial Neural Network and Multiple Linear Regression Models in Predicting Adhesive Bonding Strength of Wood. Strength Mater. 2016, 48, 811–824. [Google Scholar] [CrossRef]
- Almeida, A.D.S.; Criscuolo, G.; Arroyo, F.N.; Aquino, V.B.D.M.; Silva, D.A.L.; Molina, J.C.; Chahud, E.; Branco, L.A.M.N.; Christoforo, A.L.; Lahr, F.A.R. Estimation of Compression and Shrinkage Properties of Brazilian Tropical Timber through Porosimetry Analysis by Mercury Intrusion. Bioresources 2022, 17, 519–526. [Google Scholar] [CrossRef]
- Barker, D. Seeing the wood for the trees: Philosophical aspects of classical, Bayesian and likelihood approaches in statistical inference and some implications for phylogenetic analysis. Biol. Philos. 2015, 30, 505–525. [Google Scholar] [CrossRef]
- Pang, S.-J.; Lee, H.-J.; Ahn, K.-S.; Oh, J.-K. Sensitivity of censored data analysis to determine the characteristic value of structural timber. J. Wood Sci. 2020, 66, 39. [Google Scholar] [CrossRef]
- EN 1990; Basis of Structural Design. European Committee for Standardization: Bruxelles, Belgium, 2005.
- Hibbeler, R.C. Resistência dos Materiais, 7th ed.; Pearson Universidades: London, UK, 2009. [Google Scholar]
- Myung, I.J. Tutorial on maximum likelihood estimation. J. Math. Psychol. 2003, 47, 90–100. [Google Scholar] [CrossRef]
- Borges, J.F.; de Paula, V.F.; Evangelista, F.; Bezerra, L.M. Reliability and uncertainty quantification of the net section tension capacity of cold-formed steel angles with bolted connections considering shear lag. Adv. Struct. Eng. 2021, 24, 1283–1296. [Google Scholar] [CrossRef]
- Lin, X.-M.; Yam, M.C.H.; Chung, K.-F.; Lam, A.C.C. A study of net-section resistance of high strength steel bolted connections. Thin-Walled Struct. 2021, 159, 107284. [Google Scholar] [CrossRef]
- Montgomery, D.C. Design and Analysis of Experiments, 8th ed.; Wiley: New York, NY, USA, 2012. [Google Scholar]
- Minitab. Tipos de Análises de Regressão. Suporte Ao Minitab 18 2022:1. Available online: https://support.minitab.com/pt-br/minitab/18/help-and-how-to/modeling-statistics/regression/supporting-topics/basics/types-of-regression-analyses/ (accessed on 5 July 2022).
- Arroyo, F.; Christoforo, A.; Salvini, V.; Pelissari, P.; Pandolfelli, V.; Luz, A.; Cardoso, C. Development of plaster foam for thermal and acoustic applications. Constr. Build. Mater. 2020, 262, 120800. [Google Scholar] [CrossRef]
Disclaimer/Publisher’s Note: The statements, opinions and data contained in all publications are solely those of the individual author(s) and contributor(s) and not of MDPI and/or the editor(s). MDPI and/or the editor(s) disclaim responsibility for any injury to people or property resulting from any ideas, methods, instructions or products referred to in the content. |
© 2023 by the authors. Licensee MDPI, Basel, Switzerland. This article is an open access article distributed under the terms and conditions of the Creative Commons Attribution (CC BY) license (https://creativecommons.org/licenses/by/4.0/).