Article

Transcriptomic Response to Drought Stress in Populus davidiana Dode

State Key Laboratory of Tree Genetics and Breeding, Northeast Forestry University, Harbin 150040, China
*
Author to whom correspondence should be addressed.
Forests 2023, 14(7), 1465; https://doi.org/10.3390/f14071465
Submission received: 24 May 2023 / Revised: 17 June 2023 / Accepted: 7 July 2023 / Published: 17 July 2023
(This article belongs to the Special Issue Genomics of Growth Traits and Stress Acclimation in Forest Trees)

Abstract

:
Plants are often exposed to drought stress, and decreases in the soil water content can prevent plants from reaching their full genetic potential. Populus davidiana Dode belongs to the genus Populus, and it is a temperate deciduous tree that is cold and drought tolerant. To investigate the mechanism of P. davidiana response to drought stress, transcriptome analysis was performed on drought and control treatments of P. davidiana. We identified 10230 differentially expressed genes (DEGs). Most DEGs were enriched in pathways related to transcriptional regulation and hormone signal transduction, ROS metabolism, lignin synthesis, and the sugar metabolism process in two contrasting groups. Compared with the control condition, soluble sugars, proline, and POD activity were all increased under drought stress. In addition, Na+, K+, and Ca2+ were all higher under drought stress than in the control. These results not only revealed the mechanism of tolerance to drought stress in P. davidiana, but also promoted the development and application of drought-tolerant genetic resources in P. davidiana.

1. Introduction

Populus davidiana Dode (Salicaceae) is a temperate, deciduous, and straight-trunked tree that occurs in mainland China. It is a pioneer species with high reproductive capacity, cold and drought resistance, and the ability to grow in diverse environments, including those with barren soil. Many families and hybrid clones have been cultivated by crossing P. davidiana with other Populus species, and these hybrids often grow rapidly and show high resistance to stress, pests, and disease [1].
Drought can have a major effect on the growth of plants, and drought events have become more severe and widespread because of changes in global weather patterns. Crops experience drought stress when there is a lack of rain or irrigation water at critical times. Drought throws off a plant’s water balance and causes its cells to shrink and lose water, which results in mechanical damage and wilting. This threatens plant growth and can even result in plant death. Plants are strongly affected by nutritional connections under drought stress. Drought stress limits the dispersion and movement of several essential elements, including Ca2+ and Mg2+, that are absorbed by the root system along with water, which inhibits plant growth and development. At the cellular level, drought signaling encourages the synthesis of metabolites that defend against stress, such as proline, triggers antioxidant mechanisms to maintain redox homeostasis, and generates peroxidases to avoid immediate cell damage and to protect membrane integrity. Moreover, phytohormones play a crucial role in the regulation of plant growth and development as well as the response to biotic and abiotic stress throughout the plant life cycle. Meanwhile, the synthesis of different reactive oxygen species [2], such as glycoconjugates, flavonoids, etc., in the body while plants are under adversity stress also affects secondary metabolites in plants during drought stress.
Poplar is a pioneering tree species in the study of drought stress response mechanisms in forest trees, and a significant number of studies on the role of poplar transcription factors in drought stress have been published. Studies have been published on the genomic architecture of poplar species, including Populus trichocarpa, P. euphratica, P. tremula, P. tremuloides, and P. simonii, and transcriptome data have been accumulating quickly. NAC, MYB, bZIP, and AP2/ERF were discovered in the poplar genome, and several members of these gene families’ expression levels may be influenced by drought stress [3,4]. The transcription factors WRKY, NAC, MYB, bZIP, and AP2/ERF of poplar identify cis-elements associated with drought in the promoter regions of downstream genes and take part in the response to drought stress via two signaling pathways, ABA-dependent and ABA-independent. Poplar stomata undergo modification as a result of relevant hormones and other stress-responsive genes under mild drought circumstances.Numerous studies have demonstrated numerous poplar species, such as Populus euphratica Oliv. Wilkins et al. [5] identified 192 R2R3-MYB subfamily genes in the Populus trichocarpa genome v1.1. From the Populus trichocarpa genome v3.0.15 of the PtrMYBs, Yang et al. [6] discovered four additional R2R3-MYB subfamily members. These members were shown to be similar to Arabidopsis thaliana stress-related genes, and the expression of the majority of these genes was stimulated by drought stress. There are still a lot of unanswered questions regarding how drought response in P. davidiana is transcriptionally regulated. The goal of this work was to look at P. davidiana’s genetic signature for drought adaptation. Therefore, in this study, the P. davidiana transcriptome was sequenced and annotated under normal (CK) and drought (D14) conditions using RNA-Seq and public databases. In P. davidiana, this work discovered numerous essential genes involved in drought response, examined significant biological pathways involving these key genes, and verified the physiological changes that some key genes may control. The results of this study may provide useful information for understanding the molecular mechanisms of drought stress response in P. davidiana and may be of guidance for future selection and breeding of drought-resistant varieties of P. davidiana.

2. Materials and Methods

2.1. Plant Materials and Drought Treatment

Young P. davidiana seedlings were planted in earthen pots in July 2021, with one plant per pot. The soil and vermiculite in the pots were mixed in a 1:1 ratio. To avoid disruptions from cloudy and rainy days, tests were conducted in a greenhouse. The average day and night temperature was 25 ± 1 °C, and the relative humidity was 60 ± 10%. In December 2021, 20 rooted P. davidiana seedlings that were 6 months old, in good growth condition, and exhibiting uniform growth were chosen. The drought treatment group (D14) and the control treatment group (CK) were each given the same number of individuals. While the control group received regular watering and all other growth circumstances remained the same, the drought group did not receive any water for 14 days.

2.2. Morphological and Physiological Analysis

Phenotypic observations of P. davidiana were made to determine the degree of wilting of the leaves under drought stress. The soil moisture content of P. davidiana was measured at 0 d, 6 d, 10 d, and 14 d using a TDR-350 soil moisture temperature conductivity meter. Three replicates were performed for each plant.
P. davidiana leaves were examined at 0 and 14 days using the Reactive Oxygen Species Assay Kit (Shanghai Beyotime Biotechnology Co., Ltd. (Shanghai, China)). ROS were found in the lower epidermal cells. The image of the cell stoma opening was obtained using Laser Confocal Microscopy (LSM800).
Tissue samples were pulverized to powder with a mortar and pestle under liquid nitrogen. The peroxidase (POD) activity of the samples was determined using a POD kit (Suzhou Geruisi Biotechnology Co., Ltd. (Suzhou, China)). The content of soluble sugar (SS) was determined using an SS Content Kit (Suzhou Geruisi Biotechnology Co., Ltd. (Suzhou, China)), and the content of proline (PRO) was determined using a PRO Content Determination Kit (Suzhou Geruisi Biotechnology Co., Ltd. (Suzhou, China)). These data are from the mean of three replicates.

2.3. Metal Ion Content

The leaves of the drought treatment at day 14 (D14) and the CK group were placed into envelopes and dried in an oven until a constant weight was achieved. When no change was observed in the three dry weight measurements, the drying was terminated. We cut 0.4 g of dried needles into a 50 mL centrifuge tube and added 5 mL of nitric acid for digestion. The digested solution was placed in a water bath until the volume of the solution decreased to 1 mL. The solution was then mixed with 50 mL of deionized water, and it was filtered using a 0.45 m filter. An Agilent ICP-OES Analyzer (5110) was used to determine the Na+, Mg2+, Ca2+, and K+ content in the filtered solution.

2.4. RNA Extraction, cDNA Library Building, and Transcriptome Sequencing

Using the Complete Plant RNA Extraction Kit (Bioteke Corporation, Wuxi, China), RNA was extracted from the leaves of P. davidiana seedlings and examined for degradation and contamination using agarose gel electrophoresis. RNA was isolated from the leaves of P. davidiana seedlings using the Complete Plant RNA Extraction Kit (Bioteke Corporation, Wuxi, China), and agarose gel electrophoresis was used to check for degradation and contamination. The total RNA content, purity, and integrity were then assessed using NanoDrop spectrophotometry (Thermo Fisher Scientific, Waltham, MA, USA). After being end-repaired with an A-tail and sequencing connectors, the purified double-stranded cDNA underwent fragment size selection using AMPure XP beads (Beckman Coulter, Brea, CA, USA). The strand directionality of the mRNA was preserved by first degrading the second strand of the U-containing cDNA with the USER enzyme before deriving the final sequencing data from the first strand. For the purpose of generating a strand-specific cDNA library, PCR amplification and AMPure XP beads were used to purify the PCR results. Following library preparation, the various libraries were combined based on the goal downstream data volume and effective concentration. Following that, HiSeq was used to sequence the data. Further steps for cDNA library preparation and sequencing (Illumina Hiseq TM 2000 platform) were completed at Wuhan Boyue Zhihe Biotechnology Co., Ltd. (Wuhan, China).

2.5. Sequencing Data Filtering

We removed the adapter sequence (Adapter) and low-quality reads (quality value 15) with bases longer than 40% of the read length. We removed reads with “N” bases exceeding 5. We performed sliding window quality filtering from the 5’ end of the reads (the start of the reads) and deleted any sliding windows (sliding window size 4) for which the average base quality was below the threshold (20). We removed any reads that were less than 36 after filtering.

2.6. Reference Sequence Alignment Analysis

Using Hisat2 software (https://daehwankimlab.github.io/hisat2/) (accessed on 13 February 2022), we selected the reference genome and annotation file of Populus trichocarpa on NCBI (National Center for Biotechnology Information) and used the default parameters for alignment. We then evaluated the alignment of reads (reads) obtained by sequencing.

2.7. Gene Expression Analysis

We used Feature Counts v1.5.0 software [7] to calculate the number of reads of each gene according to the SAM alignment file generated by Hisat2 software and the GTF annotation file of the genome. We then calculated the fragments per kilobase of transcript per million mapped reads (FPKM) value of genes according to the length of the exon with the above formula to determine gene expression levels.

2.8. Differential Expression Analysis

Analysis of differential expression involves identifying genes with significant differences in expression between sample groups, such as groups corresponding to different biological states (e.g., drug treatment vs. CK group, diseased individuals vs. healthy individuals, lung tissue vs. heart tissue, and early developmental stage vs. late developmental stage). We discovered differentially expressed genes (DEGs) in plants that had been subjected to drought versus control plants using DESeq2 [8], and the negative binomial distribution of RNA-Seq read numbers was used in the model. The following criteria were used to identify the DEGs between groups: |log2 (Fold change) | > 1 and p < 0.05.

2.9. Gene Ontology (GO) Enrichment Analysis of DEGs

We compared the protein sequences (gene sequences) of all genes and differentially expressed genes found in P. davidiana with the Uniport database protein sequences (e-value < 1 × 10⁻⁵), and then annotated the results of the comparison with GO function according to known protein GO annotations from the Uniport database (https://www.uniprot.org/) (accessed on 14 February 2022) using a hypergeometric distribution to test the significance of the pathway. The GO Terms screening condition for significant enrichment was a p-value of less than 0.05 for the hypergeometric distribution examined.

2.10. Kyoto Encyclopedia of Genes and Genomes (KEGG) Enrichment Analysis of DEGs

We used the clusterprofiler package in R to conduct KEGG enrichment analysis. We compared protein sequences (gene sequences) of differentially expressed genes that had been found against the genes of P. davidiana and identified DEGs according to protein sequences in the KEGG database (e-value < 1 × 10⁻⁵). KEGG functional annotations and KEGG pathways were then obtained, and the hypergeometric distribution test was used to determine whether each KEGG pathway was significantly enriched (p < 0.05).

2.11. Quantification and Validation of Gene Expression Levels

RNA was reverse-transcribed into cDNA using a reverse transcription kit (TOYOBO Biotechnology Co., Ltd. (Shanghai, China)). The reverse transcription products were diluted 10-fold, and quantitative real-time PCR (RT-qPCR) was performed using Taq SYBR Green qPCR Premix (Lablead Biotechnology Co., Ltd. (Beijing, China)) per the manufacturer’s instructions. qRT-PCR reactions were conducted in 96-well plates using Taq SYBR Green qPCR Premix (Lablead) using qPCR software (v3.4.6.0) and a qTower 3G cycler (Analytik Jena, Jena, Germany). The internal reference gene was UBQ. These were the thermal cycling conditions: pre-denaturation at 95 °C for 30 s, followed by denaturation at 95 °C for 10 s, then annealing at 57 °C for 30 s, and extension at 72 °C for 30 s. The relative transcript abundance was determined employing the 2−ΔΔCt method. All experiments were conducted three times.

2.12. Statistical Analysis

Statistical Package for the Social Sciences was used to undertake the analysis of variance between samples (SPSS, version 22, IBM, Chicago, IL, USA), and the data were analyzed using Excel (version 2019 Microsoft, Redmond, Washington, DC, USA) tables. ANOVA illustrated the level of significance between the data. TBtools (Toolbox for Biologists, v1.098684) plotted the heat map. SIMCA 14.1 (Umetrics, Umeaa, Sweden) software performed orthogonal partial least squares discriminant analysis (OPLS-DA).

3. Results

3.1. P. davidiana Phenotypic and Physiological Alterations in Response to Drought Stress

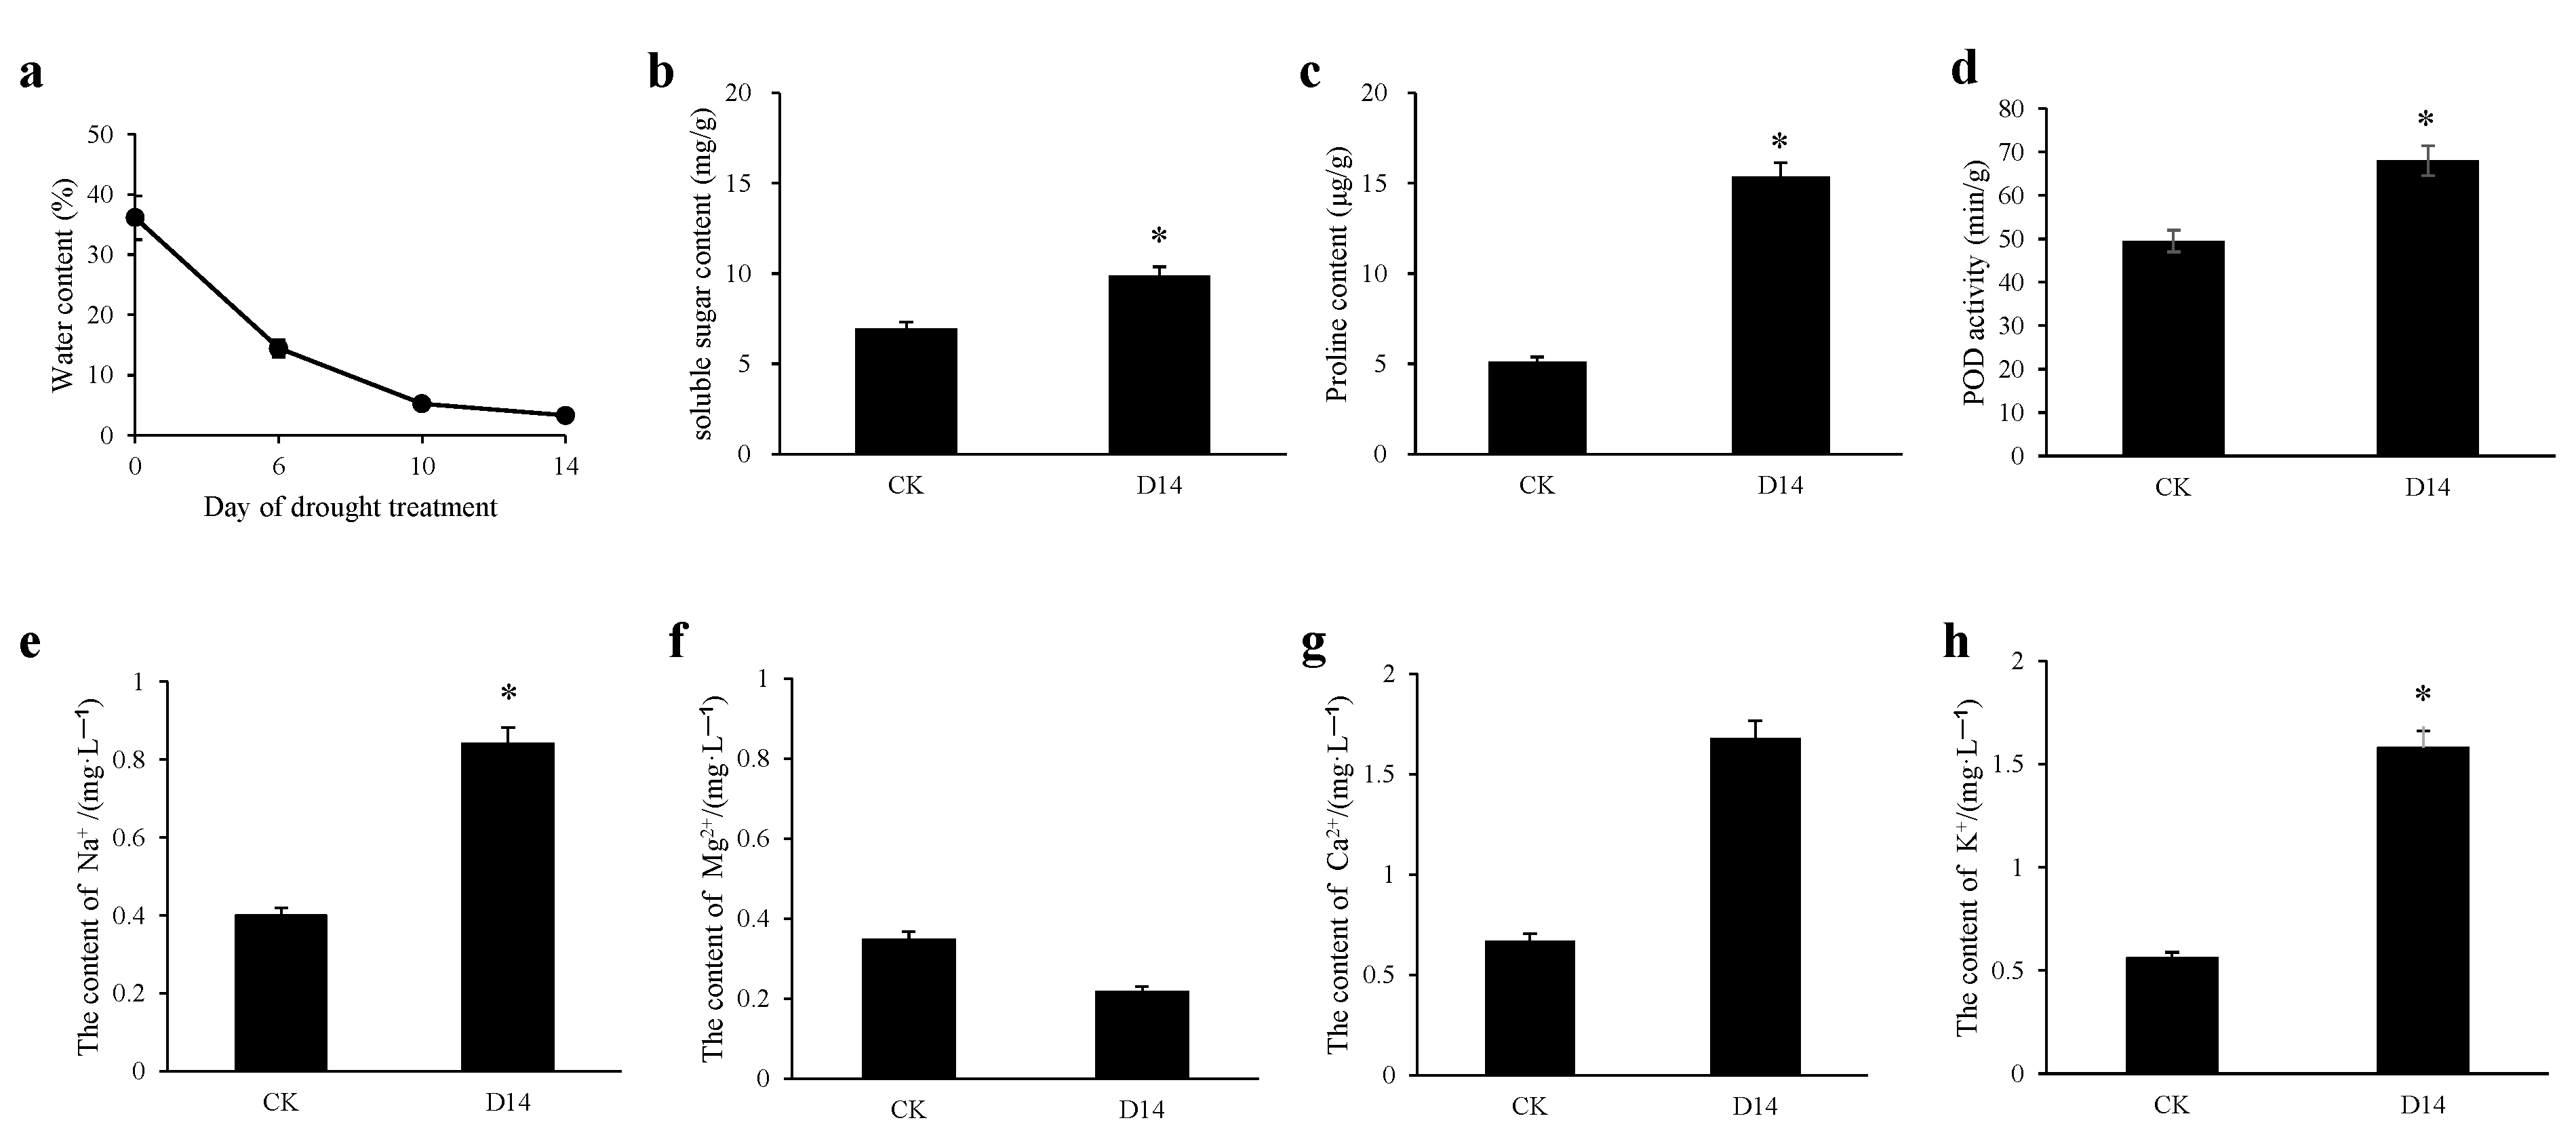
After 14 d of drought stress, the growth of the seedlings in the CK group was normal, and mild wilting was observed in seedlings in the drought treatment group (Figure 1a). After the drought treatment, the soil moisture content dropped to 3.28% (Figure 2a).
Abiotic stress often leads to the formation of ROS, such as superoxide, hydrogen peroxide, and hydroxyl radicals, and these ROS can induce substantial damage to cells and inhibit photosynthesis, which limits plant productivity. ROS levels were significantly higher under drought stress than in the CK group, indicating that the accumulation of ROS was higher in plants under drought stress than in plants in the CK group. Furthermore, the guard cells were thick, the stomatal openings were small, and the edges of the guard cells were damaged in the drought treatment (Figure 1b). Soluble sugars are highly vulnerable to environmental stresses, and their key role is to produce more protective substances through glucose metabolism to provide energy for normal metabolic processes, as well as to increase the osmotic potential of cells, enhance water retention, maintain bulking pressure and effectively scavenge ROS, maintain normal physiological metabolic functions, and prevent protoplasts from being damaged by dehydration under adverse conditions, thus playing a protective role for the protoplasts. With the extension of drought stress time, the content of soluble sugar was higher in the drought treatment group than in the CK group (9.88 vs. 6.97 mg/g) (Figure 2b). PRO is an osmotic regulator, and its content is affected by water. When soil water is insufficient, the content of PRO increases. The PRO content was substantially higher in the drought treatment group than in the CK group (15.36 μg/g vs. 5.11 μg/g) (Figure 2c). POD catalyzes the oxidation of hydrogen peroxide. In the absence of hydrogen peroxide, oxygen molecules are oxidized to hydrogen. The POD activity was substantially higher in the drought treatment group than in the CK group (Figure 2d). After drought stress, the SS, PRO, and POD contents of P. davidiana poplar were higher than in the control group.

3.2. Changes in the Content of Metal Ions in P. davidiana under Drought Stress

Plants often undergo multiple morphological and physiological responses to resist or adapt to a drought environment when adversity comes so that the plant body can survive in the adversity through different ways. Exogenous substances, such as Ca2+, can regulate many physiological processes of plant growth and development. In plants, Ca2+ not only plays a role as a nutrient element, but it also plays an important role in plant growth as a second messenger. Drought stress directly affects the uptake and utilization of essential mineral elements in plants. K+, Ca2+, Na+, and Mg2+ are the main mineral elements required for plant growth and development. Under the drought treatment, the content of Na+, K+, and Ca2+ increased, indicating that K+ and Ca2+ are preferentially absorbed by plants under drought conditions (Figure 2e–g). In contrast, the content of Mg2+ in the drought treatment group decreased, and this decrease was not significant (Figure 2h). The changes in metal ion content following drought stress suggest that metal ions play a crucial part in the adaptation and tolerance building of plants to drought stress.

3.3. Analysis of Physiological Indicators of Two Groups of P. davidiana Based on OPLS-DA

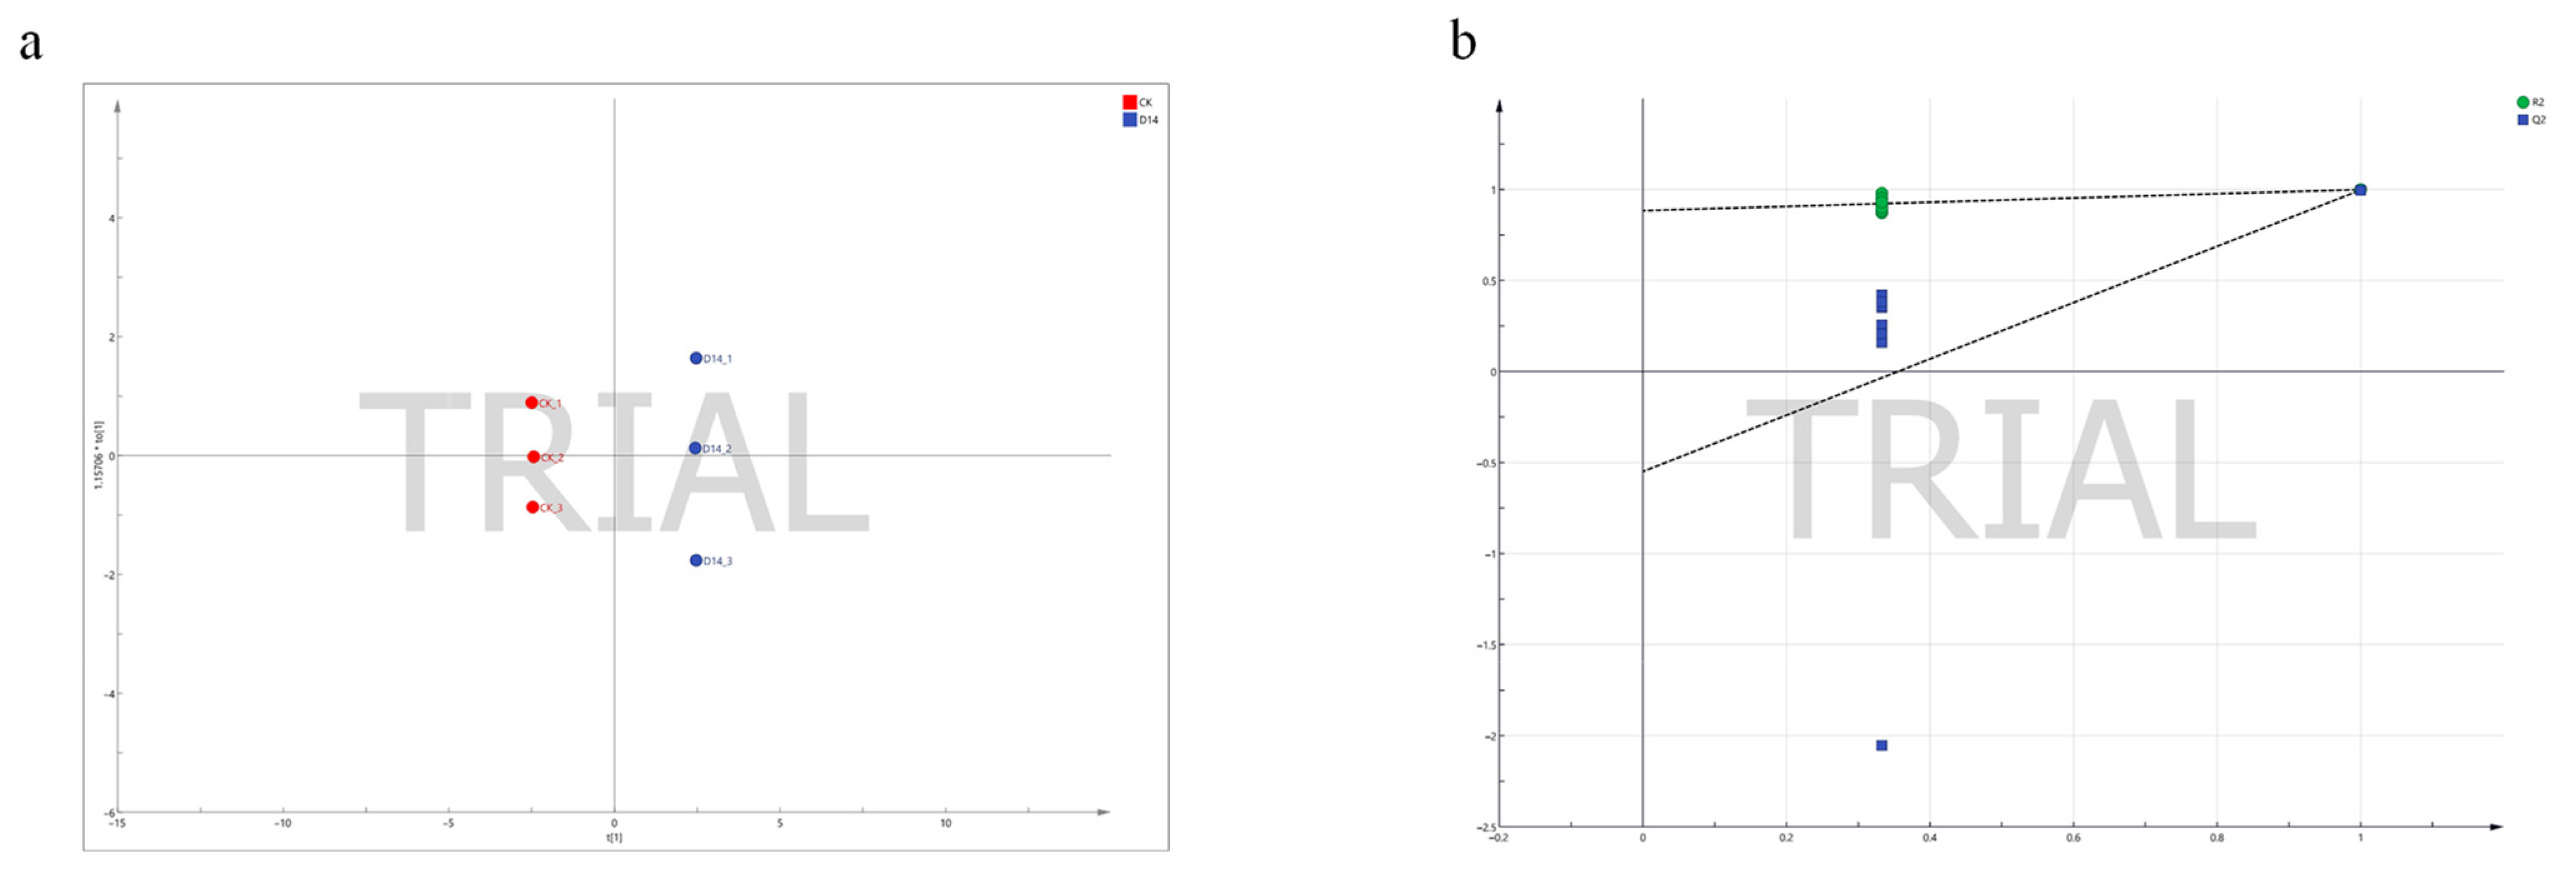
The OPLS-DA enabled efficient differentiation of the physiological indicators between the two distinct treatments by using the data of nine physiological indicators (sugar, SOD, POD, PRO, Na+, Ca2+, K+, ROS, and root development) as dependent factors and the treatment and control groups as independent variables. In this analysis (Figure 3a), the independent variable’s fit index (R2x) was 0.937, the dependent variable’s fit index (R2y) was 0.0461, and the model prediction index (Q2) was −0.549. R2 values above 0.5 indicate a good model fit. The intersection of the Q2 regression line with the vertical axis was less than 0 after 200 permutation tests, as shown in Figure 3b, indicating that the model was not overfitted, the model validation was valid, and that the results were deemed acceptable for the analysis of various indicators in the treatment and control groups.

3.4. Sequencing of P. davidiana via Illumina HiSeq and RNA-Seq

We performed high-throughput sequencing of P. davidiana seedlings using the Illumina HiSeqTM2000 platform. Linker sequences were removed, sliding window quality filtering was performed, and full-length splice variants were determined. A total of 14.64 G of clean reads were generated after filtering using the Illumina HiSeqTM2000 platform. The length of these reads on average was 149 bp. More than 93% of the reads had quality scores greater than Q30, and the GC content exceeded 53%. Each sample’s clear reads were compared against the Populus trichocarpa reference genome, and the overall alignment rate exceeded 93% (Table 1).

3.5. Identification and Alignment of DEGs

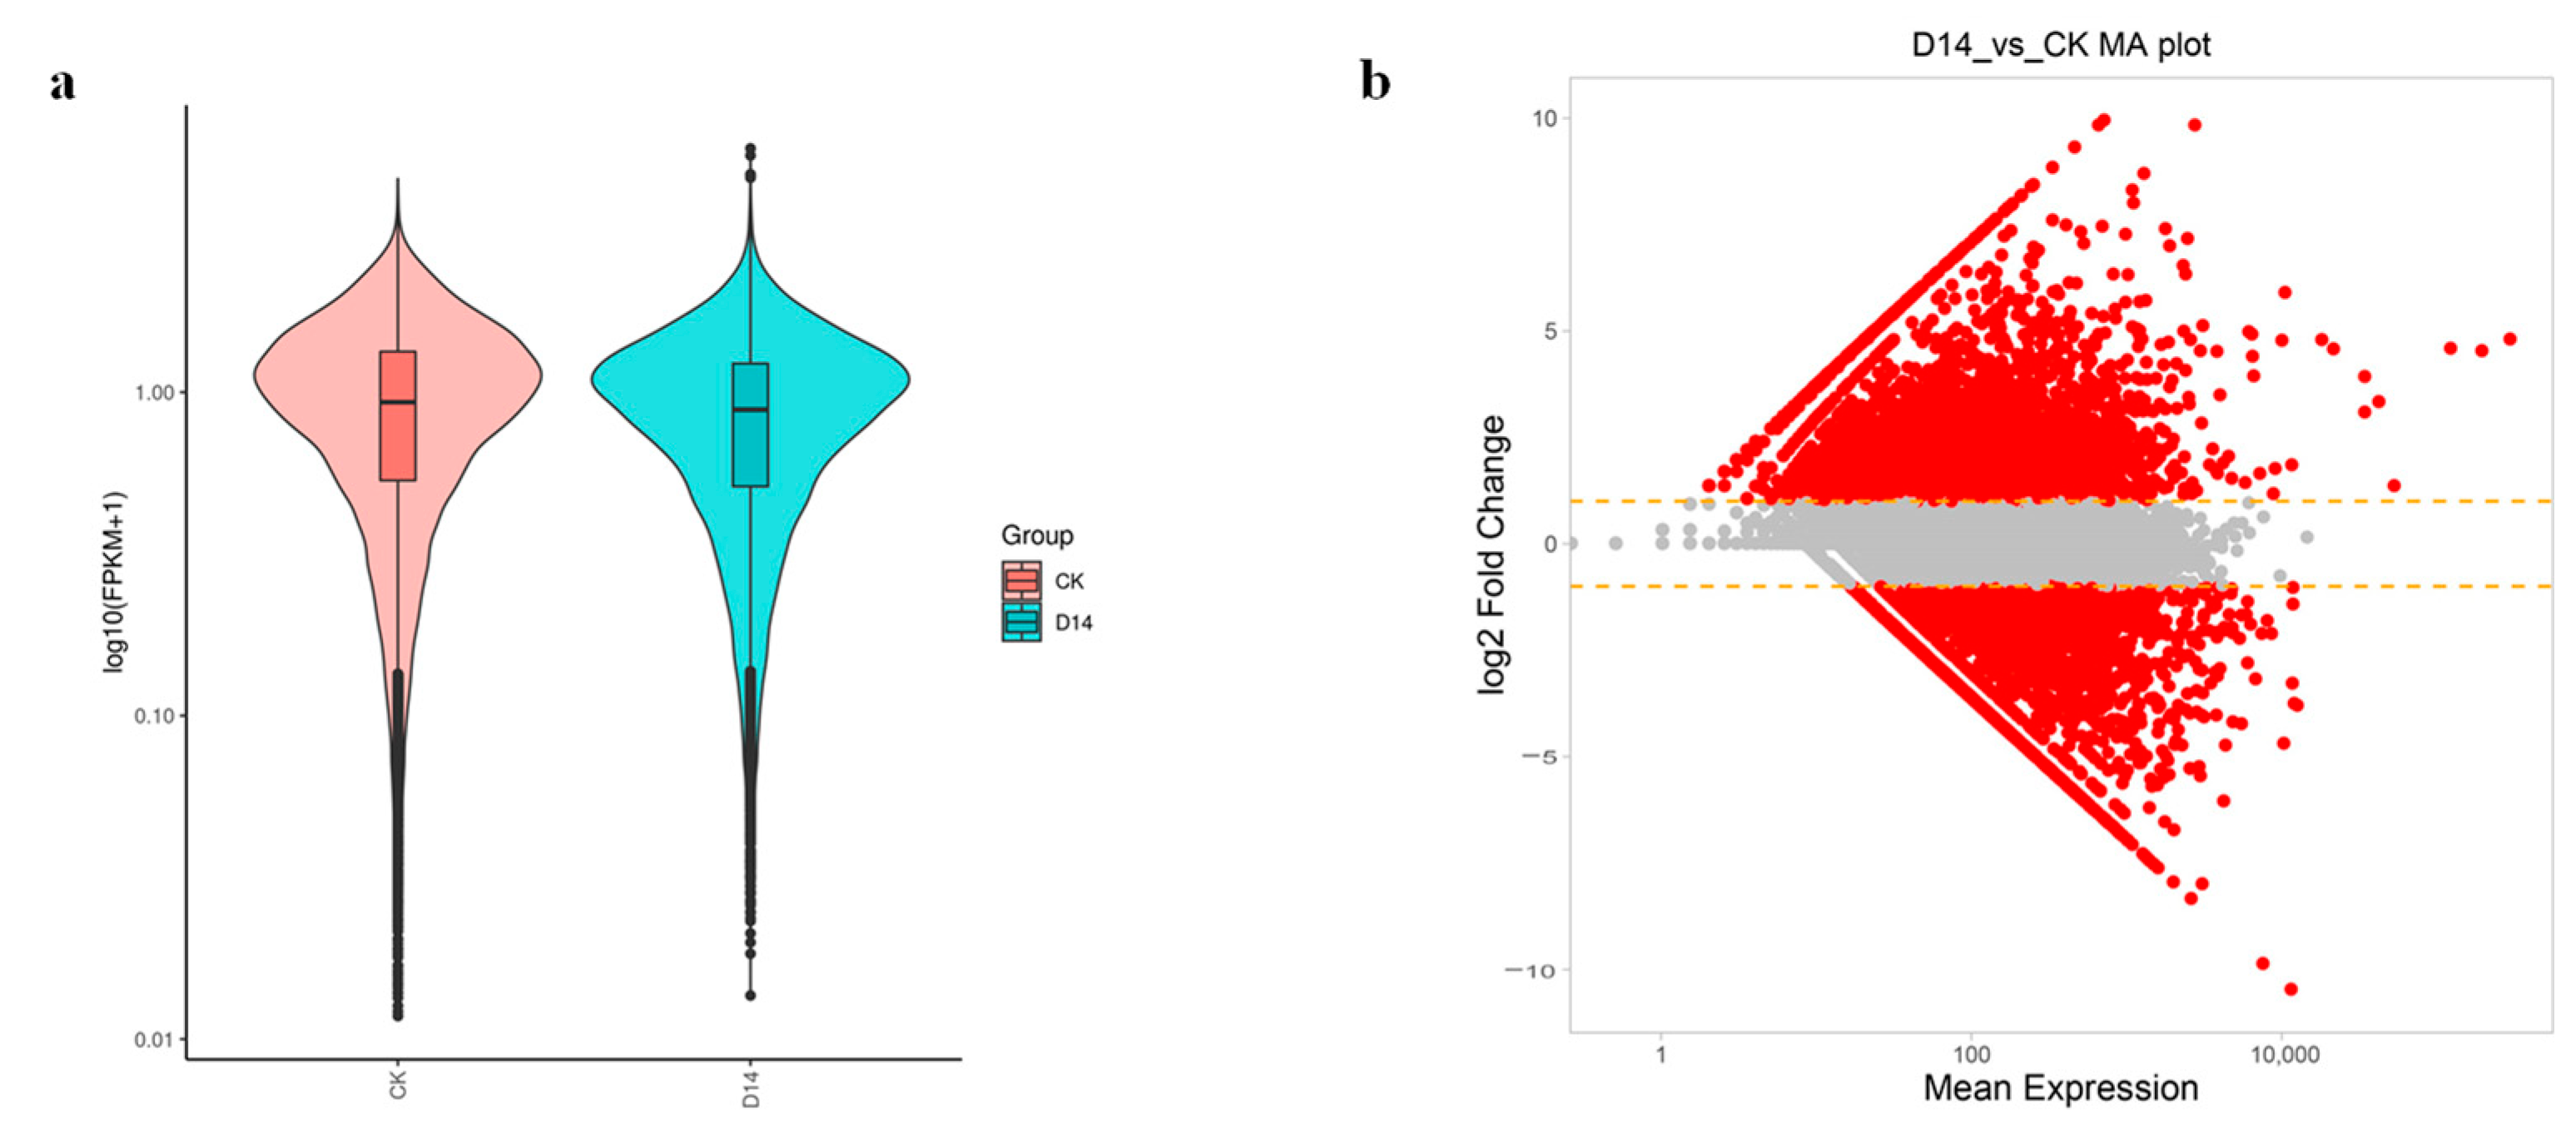
Based on the presented FPKM values, we examined the gene expression levels and relationships between the two samples (Figure 4a). The gene expression levels of the samples that had been subjected to drought were noticeably greater than those of the control samples. A model based on a negative binomial distribution was used to detect DEGs between drought-treated and control plants using DESeq2. In total, 10,230 genes were expressed differently in the D14 and CK samples (adjusted p < 0.05 and |log2(fold change) | > 1). Furthermore, 6334 of these DEGs were up-regulated, and 3886 of these DEGs were down-regulated (Figure 4b).

3.6. GO Enrichment Analysis and KEGG Enrichment Analysis

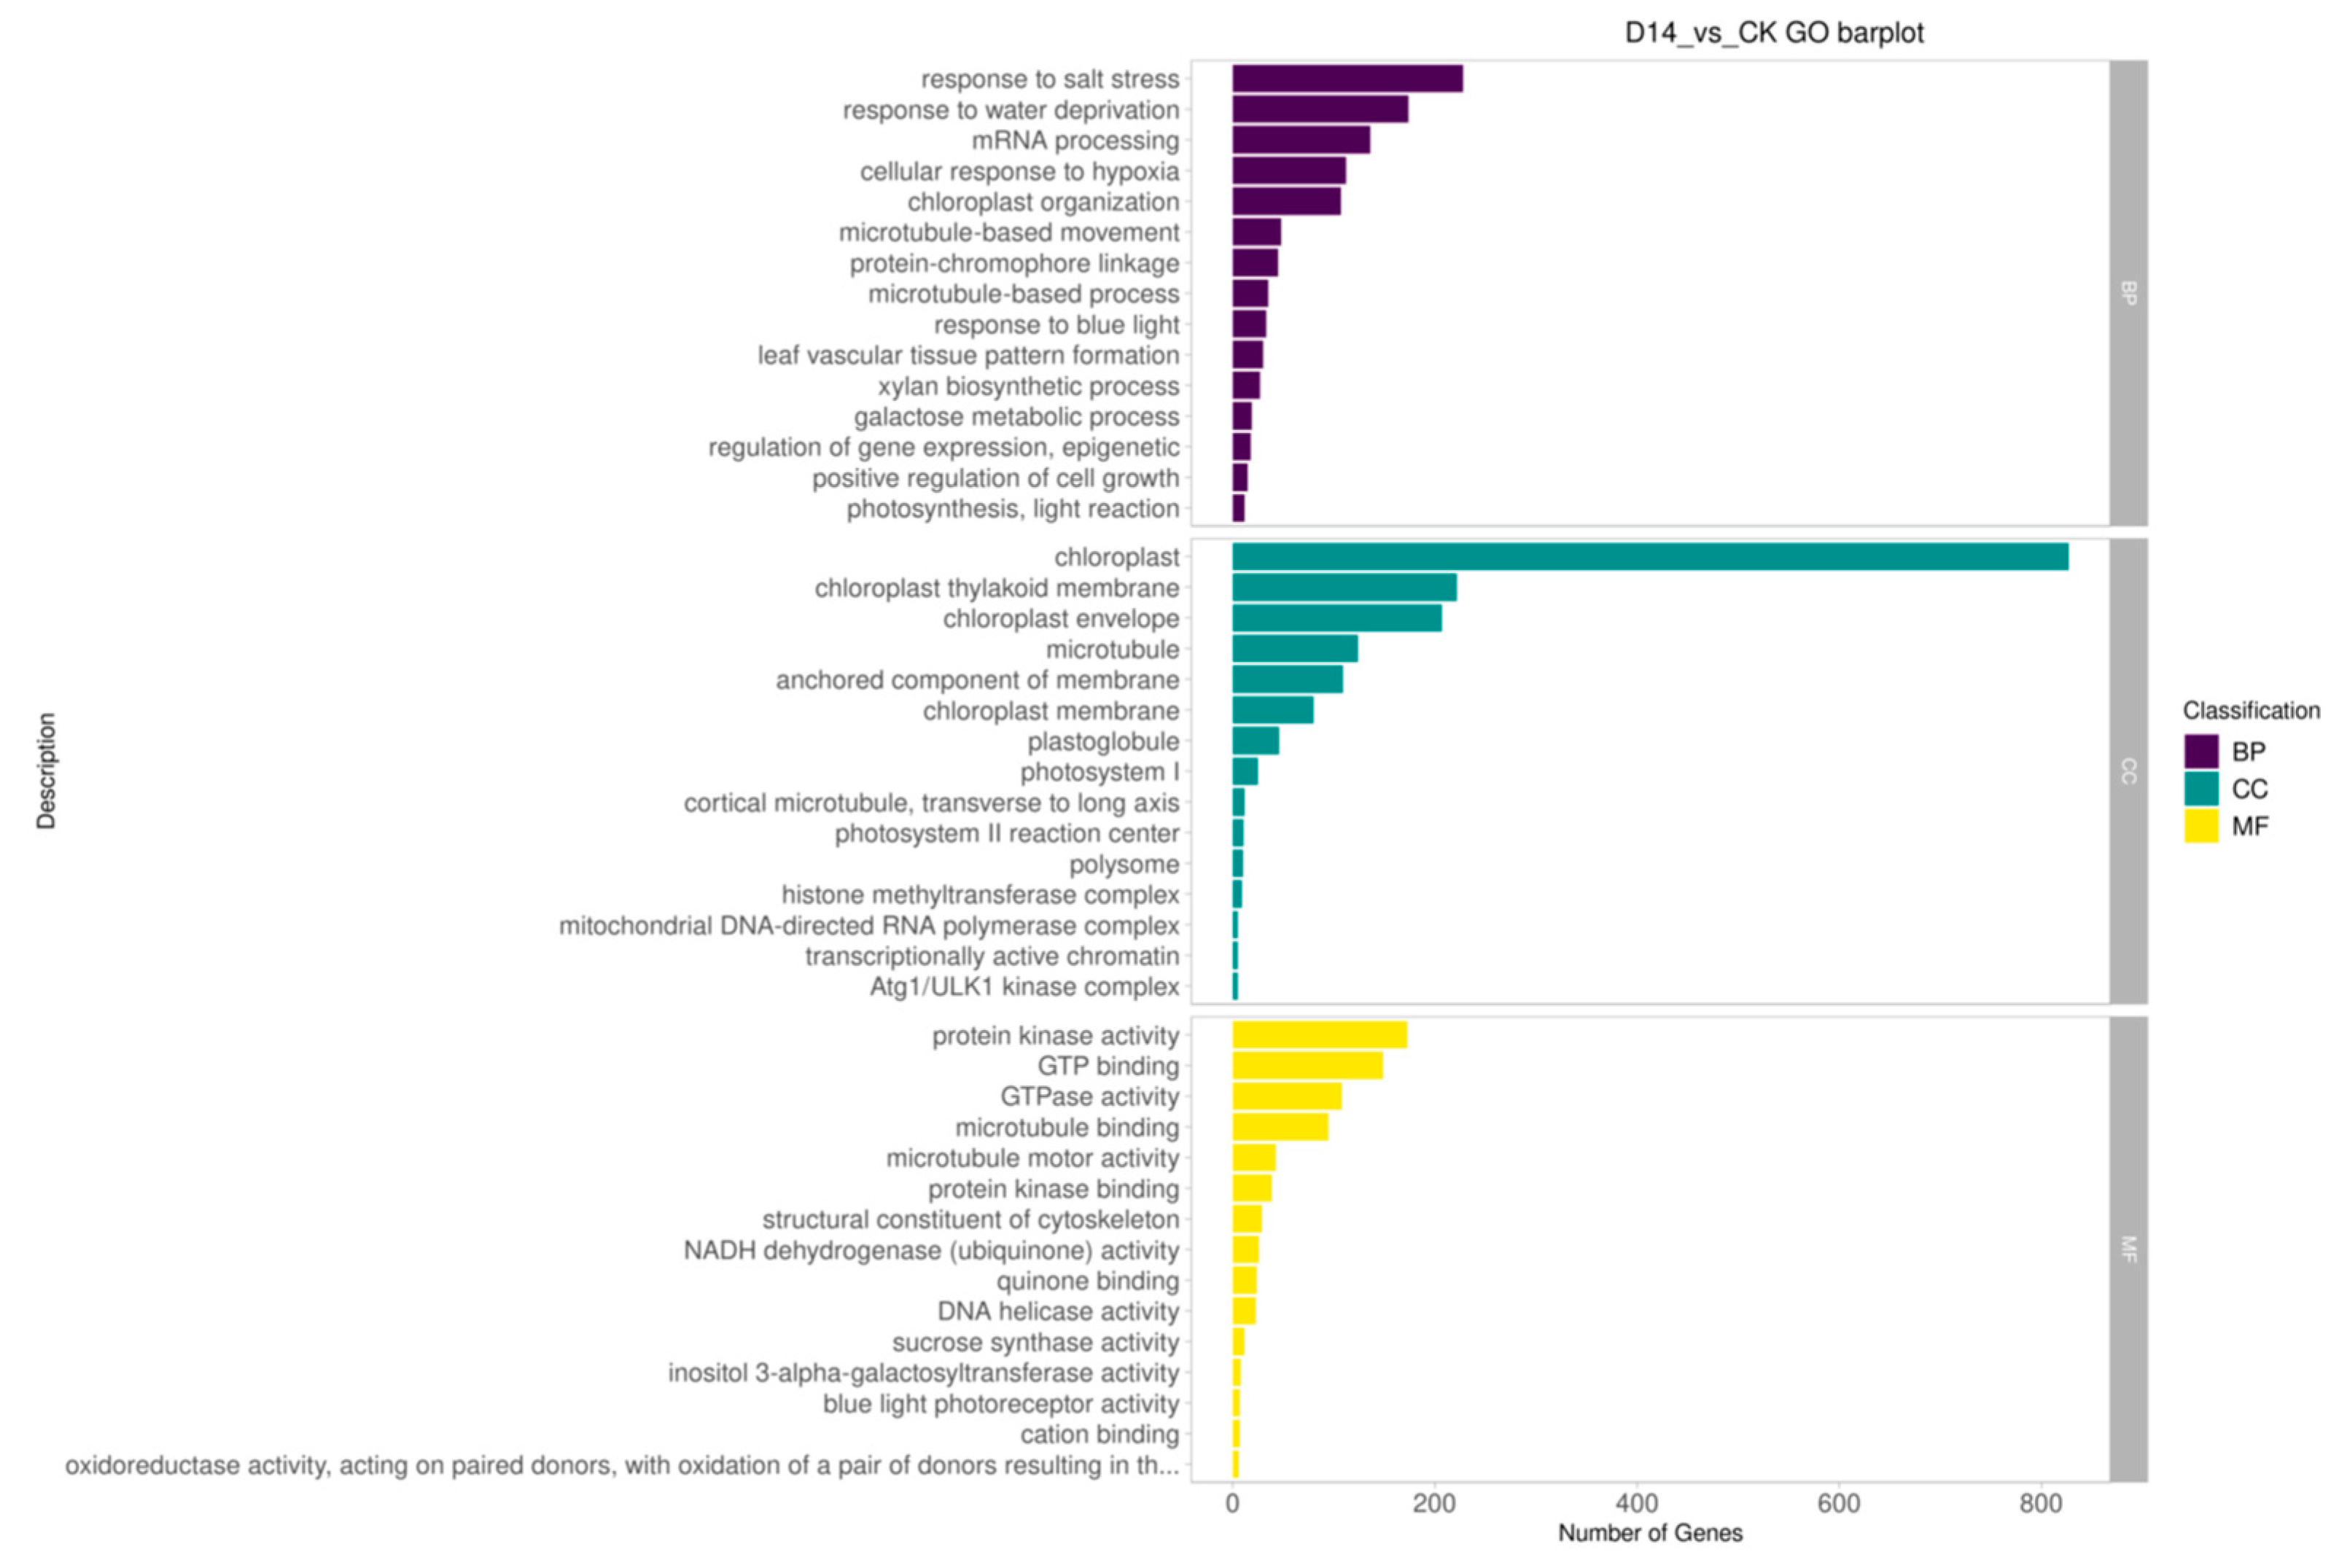
We carried out GO enrichment analysis to ascertain the link between DEG and its products under drought stress. The three main GO terms in the cellular component category were “cells”, “organelles”, and “membrane”. The main GO terms in the biological process category were “catalytic activity”, “transport activity”, “cellular process”, “metabolic process”, “stimulatory response”, and “binding” (Figure 5). A total of 5044 DEGs in the KEGG database were enriched in 135 pathways, and 21 of these pathways were significantly enriched (p < 0.05), including metabolism, secondary metabolism, plant hormone signal transduction, amino sugar and nucleotide sugar metabolism, galactose metabolism, and flavonoid biosynthesis (Table 2).

3.7. DEGs Involved in Phytohormone Signal Transduction under Drought Stress in P. davidiana

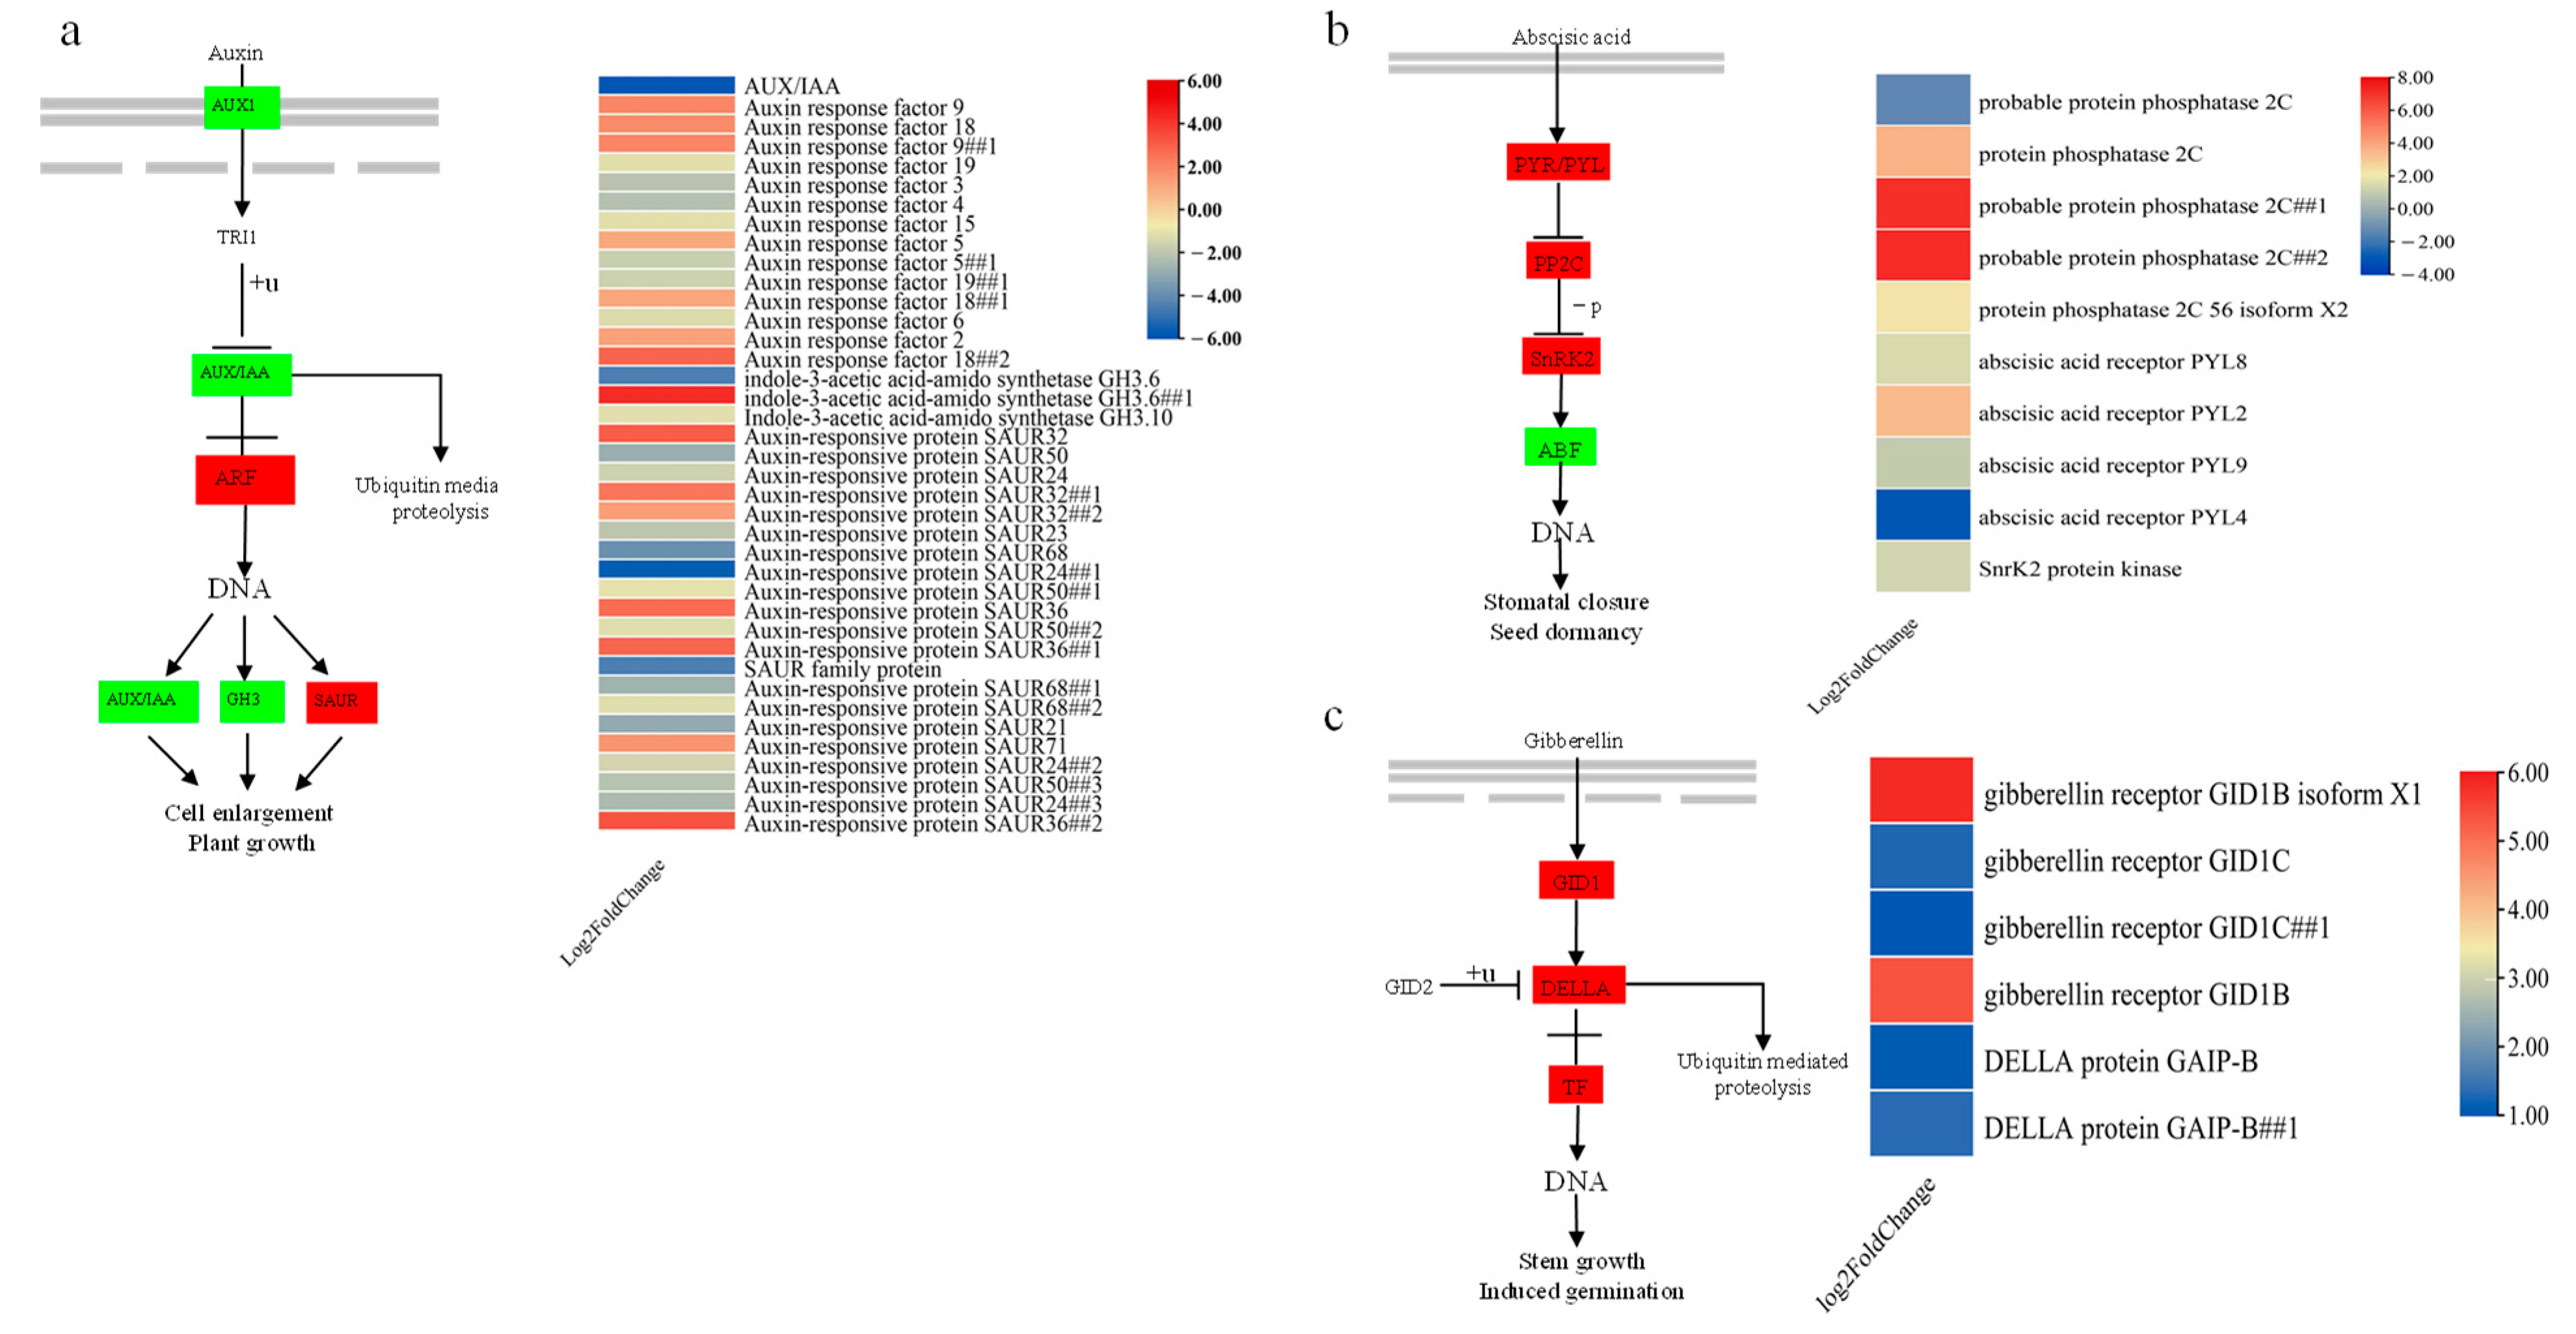
For plants to withstand drought stress, they must be able to detect and transmit drought stress signals. The perception and transmission of drought stress signals are regulated by a total of 55 DEGs, of which 30 were up-regulated and 25 were down-regulated in P. chinensis under drought stress. The expression of most of the genes involved in indole-3-acetic acid (IAA) synthesis, such as AUX1 and GH3, was significantly down-regulated, which affected cell growth (Figure 6a). The expression of the genes PYR/PYL, PP2C, and SnRK2, which are involved in carotenoid biosynthesis, was significantly up-regulated, but the expression of ABF, which is involved in ABA synthesis, was down-regulated (Figure 6b). The expression of the genes GID1, DELLA, and TFs (Figure 6c) involved in the biosynthesis of diterpenoids was significantly up-regulated, which affected the synthesis of gibberellin (GA).

3.8. Transcription Factors (TFs) Involved in the Response to Drought Stress in P. davidiana

TFs are crucial in controlling how the organism reacts to drought stress. A total of 266 differentially expressed TF genes (184 up-regulated and 82 down-regulated) were identified in this study, including TFs in the MYB (68), WRKY (48), C2H2 (7), NAC (44), TCP (10), bZIP (13), bHLH (39), AP2/ERF (3), GATA (11), MADS-box (8), GTE (8), GRAS (3), VIP (1), and TGA (3) families. The expression of three AP2/ERF genes, one VIP gene, and eight GTE genes was significantly up-regulated under drought stress, and the expression of most MYB and WRKY genes was significantly up-regulated under drought stress (Supplementary Table S1).

3.9. Responses of DEGs Involved in Antioxidative Mechanisms

There is a limit to the level of ROS that plant cells can tolerate. Within their tolerable limit, plants can eliminate free radicals by increasing the activity of antioxidant enzymes and improving the activity of non-enzymatic ROS defense systems, which mitigates the effects of ROS on cells. We identified 33 DEGs involved in antioxidant mechanisms under drought stress, including superoxide dismutase (SOD), POD, catalase (CAT), ascorbate peroxidase (APX), dehydroascorbate reductase (DHAR), and glutathione S-transferase (GST) genes. The expression of four POD genes among them was up-regulated following drought stress, which is consistent with the results of the physiological index measurements, while the expression of two SOD genes was down-regulated. Notably, the expression of one APX gene was greatly raised after drought stress, the expression of one DHAR gene was decreased after drought stress, and the expression of six GST genes and the expression of three CAT genes were highly up-regulated after drought stress.
Anthocyanins have antioxidant and free radical scavenging functions, and their synthesis may be altered under drought stress. A total of 13 anthocyanin-related DEGs (13 up-regulated) were identified under drought stress. These DEGs mainly encode leucoanthocyanidin dioxygenase (LDOX), anthocyanidin reductase (ANR), and 3-O-glucosyltransferase (3-GT) (Supplementary Table S2).

3.10. Changes in Lignin under Drought Stress

Lignin is a component of plant cell walls, and lignin synthesis is altered under dry conditions. The structure and function of lignin are diverse. A total of nine genes involved in lignin synthesis were identified (five up-regulated and four down-regulated). These DEGs mainly encode cinnamoyl CoA reductase (CCR) and caffeine-O-methyltransferase (COMT).

3.11. Regulation of Glucose Metabolic Pathways

Changes in the content of carbohydrates are complex under drought stress. Sugars can be sensed by various receptors, and this can have a major effect on changes in the content of carbohydrates. We identified sixteen DEGs (five up-regulated and eleven down-regulated) involved in the synthesis of sucrose, fructose, starch, galactose, and amino sugars.

3.12. Regulation of Related Proteins

We also identified some DEGs that might be involved in drought stress. In plants, these DEGs frequently encode molecular chaperones that take part in several metabolic pathways. They are important in the regulation of metabolism, stress, and plant growth and development. Twenty-seven DEGs in total (nineteen up-regulated and eight down-regulated) were found, including genes encoding heat-shock proteins (HSPs), late embryogenesis-abundant (LEA) proteins, abscisic stress-ripening (ASR) proteins, and somatic embryogenesis receptor kinase (SERK) (Supplementary Table S2).

3.13. Evaluation of Gene Expression Levels Using Measurement

To verify the accuracy of the RNA-seq results of P. davidiana under drought stress, 12 DEGs were randomly subjected to qRT-PCR assays. The results of the qRT-PCR analysis were highly similar to the RNA-seq results, indicating that the RNA-seq data were reliable (Figure 7).

4. Discussion

Drought is one of the major limiting factors affecting plant growth and development. Several functional and regulatory genes are differentially expressed as a result of drought stress in plants, creating a complex web of signaling regulatory networks [9]. Quantifying gene expression and identifying physiologically significant functional genes are now possible in studies using the transcriptome sequencing technology (RNA-seq), which is a crucial tool for breeding species for superior characteristics and gene function [10]. Poplars are typically not drought tolerant, and it is possible that none of the species of poplar share a genus-level molecular transcript expression profile of drought response. It has been difficult to understand the genetic basis of the molecular responses to drought stress in P. davidiana, and this has in part restricted the discovery of functional genes in this species. In order to identify some genes that may be linked to drought tolerance and to model the drought tolerance mechanism, we combined physiology and transcriptomics by sequencing the transcriptome of P. davidiana. This can help reveal the defense mechanism of drought tolerance in P. davidiana.

4.1. Changes in Plant Hormone Signal Transduction Pathways under Drought Stress

For plants under drought stress, the perception and transmission of drought stress signals are essential. Under drought stress, the IAA signaling pathway is inhibited. The transcriptome data showed that the expression of IAA signaling pathway-related genes was altered, and the expression of the auxin early response genes AUX/IAA and GH3 was significantly down-regulated, while SAUR was significantly up-regulated. The transcriptional regulation of auxin is affected by the AUX/IAA (auxin/indole-3-acetic acid) protein and the ARF (auxin response factor) family of TFs. AUX/IAA proteins are transcriptional repressors of primary auxin response genes [11,12]. When the concentration of auxin is low, Aux/IAA and ARF form a heterodimer to inhibit the binding of ARFs to AUXRE and the expression of downstream auxin-responsive genes; when the concentration of auxin is high, proteins of the AUX/IAA family are degraded, and ARF TFs are activated, which mobilizes the auxin signaling pathway and regulates the expression of primary auxin response genes [13,14,15]. The altered expression of the primary growth response genes in P. davidiana in this study suggests that drought led to a reduction in the content of IAA in P. davidiana, which in turn led to transcriptional repression of growth response genes. Based on this finding, we suggest that the IAA signaling pathway is essential for drought stress signaling in P. davidiana.
An essential signal transduction mechanism is the ABA signaling pathway. The ABA biosynthesis route, which is implicated in the drought stress signaling system, has NCED as a major rate-limiting component. It catalyzes the conversion of 9-cis-vio-laxanthin and 9′-cis-neoxanthin to xanthoxin through the oxidative cleavage of a 9-cis-isomer of an epoxycarotenoid. Under stress, it is frequently up-regulated to hasten ABA synthesis [16]. ABA receptor PYR/PYL/RCAR proteins bind to PP2C and release SnRK2s when intracellular ABA levels rise [17]. After that, downstream substrates can be phosphorylated by SnRK2s to initiate ABA responses [18]. Major protein kinases called SnRK2s are responsible for sending ABA signals all over the plant. In this study, the expression of two NCED DEGs (Potri.001G393800 and Potri.011G112400), one SNRK2 DEG (Potri.009G106900), and four PP2C DEGs (Potri.010G199600, Potri.001G092100, Potri.015G018800, and Potri.006G164632) was significantly up-regulated after drought stress. Based on these findings, we suggest that the ABA signaling pathway is an essential signal transduction pathway under drought stress in P. davidiana.
GAs is diterpene phytohormones that are crucial in controlling plant development and growth. The GA receptor proteins include the GID1 protein and the DELLA protein of the signal transduction pathway. The DELLA protein is a repressor during GA signal transduction. When the concentration of GA is low, the DELLA protein binds to downstream key regulatory factors and inhibits the signal transduction of GA. GA can be sensed and bound by the receptor GID1. When the concentration of GA is high, GA enters the C-port pocket structure of GID1, which changes its conformation; the N-terminal extension structure covers the pocket structure, which forms a hydrophobic surface. This hydrophobic surface promotes the formation of the GID1/GA/DELLA complex and relieves the inhibition of downstream key regulatory factors by DELLA, which regulates various biological processes. In this study, the expression of four GID1 DEGs (Potri.013G028700, Potri.005G040600, Potri.014G135900, and Potri.002G213100) and two DELLA DEGs (Potri.008G131700 and Potri.007G133000) was significantly up-regulated after drought stress. This demonstrates that drought stress affects gibberellin signaling in plants, which in turn affects plant stem growth.

4.2. The Role of Transcription Factors in Drought Stress in P. davidiana

Plants have evolved complex physiological and molecular networks. Under drought stress, plant cell membranes, the accumulation of osmotic regulators, and photosynthetic characteristics are altered [19]. At the molecular level, some TFs, such as those in the AP2/ERF (APETALA2/ethylene response factor), NAC, NAM (no apical meristem), WRKY, MYB (V-myb avian myeloblastosis viral oncogene homolog), bZip (basic leucine zipper), and bHLH (basic helix-loop-helix) families, can regulate the expression of downstream genes to mediate resistance to drought stress. For example, expression of the Oryza sativa L OsWRKY11 gene is induced by pathogenic bacteria, drought, and high temperature, and the overexpression of this gene can enhance the drought resistance of Oryza sativa [20]. Dossa [21] ectopically overexpressed SiMYB75 in Arabidopsis plants. After drought stress treatment, the root length of transgenic plants was significantly higher than that of wild-type plants, and the water absorption capacity and drought tolerance of transgenic plants were also higher compared with that of wild-type plants. SbMYB8 in Scutellaria baicalensis Georgi enhances drought stress tolerance in transgenic plants by regulating flavonoid biosynthesis. Additionally, it has been revealed that genes from the NAC, bZIP, and bHLH families are involved in the responses to drought stress [22,23]. In this study, we identified 266 DEGs in 14 TF families, of which most genes in the MYB, WRKY, NAC, TCP, bZIP, bHLH, GRAS, and TGA families were significantly up-regulated. Notably, three genes from the AP2/ERF family, one gene from the VIP family, and all eight from the GTE family were up-regulated. Given that drought promoted the expression of TFs from several families, TFs probably play a major part in the intricate regulatory network of P. davidiana that responds to drought.

4.3. Regulation of ROS in Plants under Drought Stress

Plants may accumulate excessive ROS as a result of drought stress, which can result in oxidative damage [24]. Our physiological results suggest that drought stress increases the accumulation of ROS. Under normal conditions, ROS are produced and maintained in dynamic equilibrium in plants. However, under abiotic stress, excess ROS causes oxidative stress and cellular damage. At the same time, the increase in ROS promotes the production of anthocyanins, which are effective antioxidants for scavenging ROS. Plants under drought stress can promote anthocyanin production by regulating anthocyanin synthesis genes to cope with the negative effects of drought stress [25,26]. All 13 DEGs involved in anthocyanin synthesis were significantly up-regulated. Drought stress causes the relative water content of plant leaves to decrease, accelerates the decomposition of chlorophyll, and inhibits chlorophyll synthesis, which results in chlorotic leaves and decreases in dry matter accumulation. This results in the production of a large amount of ROS. Enzymatic antioxidants, such as SOD, CAT, APX, GPX, DHAR, and GR, are considered the most effective and direct ROS scavenging systems. SOD is the first line of defense against ROS. SOD can catalyze the disproportionation of O2 to produce H2O2, which can then be scavenged by CAT, APX, and GPX. SOD, CAT, and GST are essential antioxidant enzymes in plants. Our physiological results show that POD is significantly elevated after drought stress, which is in full agreement with the transcriptomic data. Peroxidases have the function of clearing reactive oxygen species.Thus, the four up-regulated POD genes may be involved in eliminating excess ROS and mitigating oxidative damage, thereby enhancing salt tolerance. Meanwhile, the up-regulation of three CAT genes indicates that plants can improve their own regulatory capacity to adapt to drought stress. The role of CAT is to scavenge H2O2 produced in metabolism to avoid oxidative damage to cells by H2O2 accumulation; thus, its activity is related to plant stress tolerance.

4.4. Changes in Lignin Synthesis Pathways under Drought Stress

Lignin is an essential element of all vascular plant cell walls, and it is a highly abundant biopolymer. Much of the carbon fixed by photosynthesis is used for lignin synthesis. Lignin synthesis is affected by environmental factors, such as pH and dryness, and the structure and function of lignin are diverse. A frequent reaction of plants to abiotic stress is the deposition of lignin [27]. The two primary reductases in the lignin production pathway are cinnamoyl-CoA reductase (CCR) and cinnamyl alcohol dehydrogenase (CAD). Multiple substrates are involved in this pathway, with a lattice-like structure [28]. Previous research has demonstrated that drought stress induces the expression of the CCR gene, and that high levels of CmCAD2 and CmCAD3 expression in Arabidopsis increase drought resistance through lignin production [29]. In our study, drought stress up-regulated the expression of four CCR DEGs and one CAD DEG. The impact of drought on the production of lignin is poorly understood. Various periods of drought exposure cause lignin biosynthesis enzymes to react to drought in different ways [27].

4.5. Changes in Starch and Sucrose Biosynthesis under Drought Stress

Glucose metabolism is involved in plant growth and development and responds to various abiotic stresses. Understanding the underlying response mechanisms is important for enhancing the tolerance of plant tolerance to stresses, such as drought, high temperature, and cold [30,31]. In times of drought stress, non-structural carbohydrates, such as sucrose and sugar alcohols, have been reported to accumulate in cells, which increases osmotic stress tolerance [32]. In this investigation, we discovered that the drought treatment group’s SS concentration was higher than the CK group’s. The expression of one ADH1 DEG (Potri.002G072100) was up-regulated, which might indicate that the content of SS increases in P. chinensis to mediate adaptation to drought stress. Furthermore, under drought stress, we identified a total of 58 DEGs associated with SSs (34 up-regulated and 24 down-regulated), and these are involved in the synthesis of sucrose, fructose, starch, galactose, and amino sugars.

4.6. Changes in Proteins under Drought Stress

In P. davidiana, drought stress greatly increased the expression of many genes producing drought stress proteins, such as LEAs, ASRs, and HSPs. We identified 27 DEGs (19 up-regulated and 8 down-regulated) that encode HSPs, LEA proteins, and ASR proteins. LEA proteins are highly hydrophilic and mediate the tolerance of plants to water deficits. Numerous plants have been examined for LEA genes. The expression of the LEA1 protein can be induced under drought, salt, ABA, and low-temperature stress in plant seedlings, and this protein has a protective effect on the activity of lactate dehydrogenase in plants; it can positively regulate the expression of some calcium-dependent protein kinases [33]. ASR proteins play an important role in mediating resistance to abiotic stresses, such as drought. The incorporation of the Solanum lycopersicum ASR1 gene into tobacco significantly enhances salt resistance and drought resistance [34,35]. Transfection of the Musa nana ASR gene into Arabidopsis can control the intracellular osmotic effect by regulating the metabolism of hexose; this protects the integrity of the cell structure, which enhances the drought resistance of transgenic Arabidopsis [36]. Wang [37] found that HSP90 can activate the SGT1b–TIR1 protein complex and control plant growth and development under high-temperature stress through auxin signal transduction. Overexpression of OsHSP50.2 can improve the resistance of Oryza sativa L. to drought and osmotic stress and significantly increase the SOD activity and PRO content of transformants under drought stress [38]. Therefore, functional proteins are crucial for the methods by which plants withstand drought.

5. Conclusions

In this study, to gain insight into the molecular mechanisms used by P. davidiana to withstand drought, we have used Illumina Hiseq high-throughput sequencing technology to analyse the P. davidiana transcriptome in response to drought. Through the synergy of physiological and molecular responses to growth under drought stress, we have identified a large number of drought-stress-related genes. These genes are involved in drought stress hormone signaling, anthocyanin and lignin biosynthesis, and sugar metabolism, as well as functional protein synthesis. Future research may also elucidate how these pathways work together to enable P. davidiana to cope with drought stress. In this regard, gene co-expression networks and protein–protein interaction studies will be useful, together with candidate-gene-specific characterizations.

Supplementary Materials

The following supporting information can be downloaded at: https://www.mdpi.com/article/10.3390/f14071465/s1, Table S1: Transcription factors response to drought stress; Table S2: DEGs invoved in defense responses to drought stress; Table S3: Genes that change under drought stress and their functions.

Author Contributions

M.Y., L.W. and X.W. conducted the conceptualization and designed this study. Y.L. conducted the investigation and software analysis. M.Y. and L.W. analyzed the data. M.Y. performed the experiments and wrote the manuscript. H.H. revised the manuscript and provided financial support. All authors have read and agreed to the published version of the manuscript.

Funding

This research was funded by the National Natural Science Foundation of China (31800556) and the Fundamental Research Funds for the Central Universities (2572018BW06).

Data Availability Statement

Not applicable.

Conflicts of Interest

The authors declare no conflict of interest.

References

  1. Li, K.; Zhou, G.; Yang, C.; Liu, G.; Xing, Y. Study on crossing breeding of Populus davidiana and P. tremuloides. Bull. Bot. Res. 2004, 24, 215–219. [Google Scholar]
  2. Langmead, B.; Trapnell, C.; Pop, M.; Salzberg, S.L. Ultrafast and memory-efficient alignment of short DNA sequences to the human genome. Genome Biol. 2009, 10, R25. [Google Scholar] [CrossRef] [PubMed] [Green Version]
  3. Harfouche, A.; Meilan, R.; Altman, A. Molecular and physiological responses to abiotic stress in forest trees and their relevance to tree improvement. Tree Physiol. 2014, 34, 1181–1198. [Google Scholar] [CrossRef] [Green Version]
  4. Wu, H.; Yao, D.; Chen, Y.; Yang, W.; Zhao, W.; Gao, H.; Tong, C. De Novo genome assembly of Populus simonii further supports that Populus simonii and Populus trichocarpa belong to different sections. G3 Genes Genomes Genet. 2020, 10, 455–466. [Google Scholar] [CrossRef] [PubMed] [Green Version]
  5. Wilkins, O.; Nahal, H.; Foong, J.; Campbell, P.M.M. Expansion and diversification of the Populus R2R3-MYB family of transcription factors. Plant Physiol. 2009, 149, 981–993. [Google Scholar] [CrossRef] [PubMed] [Green Version]
  6. Yang, X.; Li, J.; Guo, T.; Guo, B.; An, X. Comprehensive analysis of the R2R3 MYB transcription factor gene family in Populus trichocarpa. Ind. Crops Prod. 2021, 168, 113614. [Google Scholar] [CrossRef]
  7. Liao, Y.; Smyth, G.K.; Shi, W. FeatureCounts: An efficient general purpose program for assigning sequence reads to genomic features. Bioinformatics 2014, 30, 923–930. [Google Scholar] [CrossRef] [Green Version]
  8. Love, M.I.; Huber, W.; Anders, S. Moderated estimation of fold change and dispersion for RNA-seq data with DESeq2. Genome Biol. 2014, 15, 550. [Google Scholar] [CrossRef] [Green Version]
  9. Hetherington, A.M.; Woodward, F.I. The role of stomatal in sensing and driving environmental change. Nature 2003, 424, 901–908. [Google Scholar] [CrossRef]
  10. Schuster, S.C. Next-generation sequencing transforms today’s biology. Nat. Methods 2008, 5, 16–18. [Google Scholar] [CrossRef]
  11. Tiwari, S.B.; Wang, X.J.; Hagen, G.; Guilfoyle, T.J. AUX/IAA proteins are active repressors, and their stability and activity are modulated by Auxin. Plant Cell 2001, 13, 2809–2822. [Google Scholar] [CrossRef] [Green Version]
  12. Ulmasov, T.; Murfett, J.; Hagen, G.; Guilfoyle, T.J. Aux/IAA proteins repress expression of reporter genes containing natural and highly active synthetic Auxin response elements. Plant Cell 1997, 9, 1963–1971. [Google Scholar] [CrossRef] [PubMed] [Green Version]
  13. Gray, W.M.; Kepinski, S.; Rouse, D.; Leyser, O.; Estelle, M. Auxin regulates SCF(TIR1)-dependent degradation of AUX/IAA proteins. Nature 2001, 414, 271–276. [Google Scholar] [CrossRef] [PubMed] [Green Version]
  14. Sauer, M.; Balla, J.; Luschnig, C.; Wisniewska, J.; Reinöhl, V.; Friml, J.; Benková, E. Canalization of auxin flow by Aux/IAA-ARF-dependent feedback regulation of PIN polarity. Genes Dev. 2006, 20, 2902–2911. [Google Scholar] [CrossRef] [PubMed] [Green Version]
  15. Liscum, E.; Reed, J.W. Genetics of AUX/IAA and ARF action in plant growth and development. Plant Mol. Biol. 2002, 49, 387–400. [Google Scholar] [CrossRef]
  16. Espasandin, F.D.; Maiale, S.J.; Calzadilla, P.; Ruiz, O.A.; Sansberro, P.A. Transcriptional regulation of 9-cis-epoxycarotenoid dioxygenase (NCED) gene by putrescine accumulation positively modulates ABA synthesis and drought tolerance in Lotus tenuis plants. Plant Physiol. Biochem. 2014, 76, 29–35. [Google Scholar] [CrossRef]
  17. Kalapos, B.; Dobrev, P.; Nagy, T.; Vítámvás, P.; Györgyey, J.; Kocsy, G.; Marincs, F.; Galiba, G. Transcript and hormone analyses reveal the involvement of ABA-signaling, hormone crosstalk and genotype-specific biological processes in cold-shock response in wheat. Plant Sci. 2016, 253, 86–97. [Google Scholar] [CrossRef] [Green Version]
  18. Mahmood, T.; Khalid, S.; Abdullah, M.; Ahmed, Z.; Shah, M.; Ghafoor, A.; Du, X. Insights into drought stress signaling in plants and the molecular genetic basis of cotton drought tolerance. Cells 2019, 9, 105. [Google Scholar] [CrossRef] [Green Version]
  19. Binott, J.J.; Owuoche, J.O.; Bartels, D. Physiological and molecular characterization of Kenyan barley (Hordeum vulgare L.) seedlings for salinity and drought tolerance. Euphytica 2017, 213, 139. [Google Scholar] [CrossRef]
  20. Lee, H.; Cha, J.; Choi, C.; Choi, N.; Ji, H.S.; Park, S.R.; Lee, S.; Hwang, D.J. Rice WRKY11 plays a role in pathogen defense and drought tolerance. Rice 2018, 11, 5. [Google Scholar] [CrossRef]
  21. Dossa, K.; Mmadi, M.A.; Zhou, R.; Liu, A.; Yang, Y.; Diouf, D.; You, J.; Zhang, X. Ectopic expression of the sesame MYB transcription factor SiMYB305 promotes root growth and modulates ABA-mediated tolerance to drought and salt stresses in Arabidopsis. AoB Plants 2019, 12, plz081. [Google Scholar] [CrossRef] [Green Version]
  22. Liu, H.; Yang, Y.; Liu, D.; Wang, X.; Zhang, L. Transcription factor TabHLH49 positively regulates dehydrin WZY2 gene expression and enhances drought stress tolerance in wheat. BMC Plant Biol. 2020, 20, 259. [Google Scholar] [CrossRef] [PubMed]
  23. Ying, S.; Zhang, D.F.; Fu, J.; Shi, Y.S.; Song, Y.C.; Wang, T.Y.; Li, Y. Cloning and characterization of a maize bZIP transcription factor, ZmbZIP72, confers drought and salt tolerance in transgenic Arabidopsis. Planta 2012, 235, 253–266. [Google Scholar] [CrossRef] [PubMed]
  24. Shafi, A.; Chauhan, R.; Gill, T.; Swarnkar, M.K.; Sreenivasulu, Y.; Kumar, S.; Kumar, N.; Shankar, R.; Ahuja, P.S.; Singh, A.K. Expression of SOD and APX genes positively regulates secondary cell wall biosynthesis and promotes plant growth and yield in Arabidopsis under salt stress. Plant Mol. Biol. 2015, 87, 615–631. [Google Scholar] [CrossRef]
  25. Li, X.; Xiang, L.; Wang, X.; Wang, L.; Ren, M. Effects of abiotic stress on anthocyanin accumulation and grain weight in purple wheat. Crop Pasture Sci. 2018, 69, 1208–1214. [Google Scholar] [CrossRef]
  26. Zhang, X.; Lei, L.; Lai, J.; Zhao, H.; Song, W. Effects of drought stress and water recovery on physiological responses and gene expression in maize seedlings. BMC Plant Biol. 2018, 18, 68. [Google Scholar] [CrossRef] [PubMed] [Green Version]
  27. Srivastava, S.; Vishwakarma, R.K.; Arafat, Y.A.; Gupta, S.K.; Khan, B.M. Abiotic stress induces change in Cinnamoyl CoA Reductase (CCR) protein abundance and lignin deposition in developing seedlings of Leucaena leucocephala. Physiol. Mol. Biol. Plants 2015, 21, 197–205. [Google Scholar] [CrossRef] [Green Version]
  28. Vanholme, R.; De Meester, B.; Ralph, J.; Boerjan, W. Lignin biosynthesis and its integration into metabolism. Curr. Opin. Biotechnol. 2019, 56, 230–239. [Google Scholar] [CrossRef]
  29. Liu, W.; Jiang, Y.; Wang, C.; Zhao, L.; Jin, Y.; Xing, Q.; Li, M.; Lv, T.; Qi, H. Lignin synthesized by CmCAD2 and CmCAD3 in oriental melon (Cucumis melo L.) seedlings contributes to drought tolerance. Plant Mol. Biol. 2020, 103, 689–704. [Google Scholar] [CrossRef]
  30. Ruan, Y.L.; Patrick, J.W.; Bouzayen, M.; Osorio, S.; Fernie, A.R. Molecular regulation of seed and fruit set. Trends Plant Sci. 2012, 17, 656–665. [Google Scholar] [CrossRef] [Green Version]
  31. Kumar, A.; Singh, H.P.; Batish, D.R.; Kaur, S. EMF radiations (1800 MHz)-inhibited early seedling growth of maize (Zea mays) involves alterations in starch and sucrose metabolism. Protoplasma 2016, 253, 1043–1049. [Google Scholar] [CrossRef] [PubMed]
  32. Tomasella, M.; Petrussa, E.; Petruzzellis, F.; Nardini, A.; Casolo, V. The possible role of non-structural carbohydrates in the regulation of tree hydraulics. Int. J. Mol. Sci. 2019, 21, 144. [Google Scholar] [CrossRef] [Green Version]
  33. Xiang, J.; Chen, X.; Hu, W.; Xiang, Y.; Yan, M.; Wang, J. Over expressing heat shock protein OsHSP50.2 improves drought tolerance in rice. Plant Cell Rep. 2018, 37, 1585–1595. [Google Scholar] [CrossRef]
  34. Kalifa, Y.; Gilad, A.; Konrad, Z.; Zaccai, M.; Scolnik, P.A.; Bar-Zvi, D. The water-and salt-stress-regulated Asr1 (abscisic acid stress ripening) gene encodes a zinc-dependent DNA-binding protein. Biochem. J. 2004, 381, 373–378. [Google Scholar] [CrossRef] [PubMed] [Green Version]
  35. Kalifa, Y.; Perlson, E.; Gilad, A.; Konrad, Z.; Scolnik, P.A.; Bar-Zvi, D. Over-expression of the water and salt stress-regulated Asr1 gene confers an increased salt tolerance. Plant Cell Environ. 2004, 27, 1459–1468. [Google Scholar] [CrossRef]
  36. Dai, J.R.; Liu, B.; Feng, D.R.; Liu, H.Y.; He, Y.M.; Qi, K.B.; Wang, H.B.; Wang, J.F. MpAsr encodes an intrinsically unstructured protein and enhances osmotic tolerance in transgenic Arabidopsis. Plant Cell Rep. 2011, 30, 1219–1230. [Google Scholar] [CrossRef]
  37. Wang, R.; Zhang, Y.; Kieffer, M.; Yu, H.; Kepinski, S.; Estelle, M. HSP90 regulates temperature-dependent seedling growth in Arabidopsis by stabilizing the auxin co-receptor F-box protein TIR1. Nat. Commun. 2016, 7, 11677. [Google Scholar] [CrossRef] [Green Version]
  38. Xiang, D.J.; Man, L.L.; Zhang, C.L.; Liu, P.; Li, Z.G.; Zheng, G.C. A new Em-like protein from Lactuca sativa, LsEm1, enhances drought and salt stress tolerance in Escherichia coli and rice. Protoplasma 2018, 255, 1089–1106. [Google Scholar] [CrossRef]
Figure 1. Phenotypic variation and stomatal changes under drought stress in P. davidiana. (a) Changes in P. davidiana under drought stress. (b) ROS production in intact guard cells, as indicated by the fluorescent dye 2,7-dichlorofluorescein diacetate. Epidermal peels were loaded with H2DCF-DA for 30 min after incubation in fixation buffer for 2 h.
Forests 14 01465 g001
Figure 2. Impact of drought stress on biochemical parameters and the content of ions in the leaves of P. davidiana. (a) Content of water. (b) SS content. (c) PRO content. (d) POD activity. (e) Content of Na+. (f) Content of K+. (g) Content of Ca2+. (h) Content of Mg2+. All analyses were performed using SPSS23 software (n = 3). The significance of differences was indicated by * (p < 0.05).
Forests 14 01465 g002
Figure 3. Orthogonal partial least squares discriminant analysis of different groups of P. davidiana. (a) OPLSDA diagram for CK and D14. (b) Model cross-validation results.
Forests 14 01465 g003
Figure 4. RNA-seq data analysis overview. (a) FPKM violin plot. The sample name is displayed on the x axis, while the log10(FPKM+1) values are displayed on the y axis. Gene density is shown by the violin’s width. (b) The MA plot of DESeq2. The x axis displays the average abundance of genes in the two samples; the y axis displays the fold change between the different groups.
Forests 14 01465 g004
Figure 5. The DEGs’ Gene Ontology (GO) classification. The three major types of GO keywords were biological process, cellular component, and molecular function. Additionally, it displays the number of genes in each group.
Forests 14 01465 g005
Figure 6. Plant hormone signaling pathway. (a) IAA signaling pathway. (b) ABA signaling pathway. (c) GA signaling pathway. Red indicates up-regulation, and green indicates down-regulation.
Forests 14 01465 g006
Figure 7. A total of 12 DEGs’ relative expression levels as determined by RNA-Seq and qRT-PCR. Using the 2−ΔΔCT approach, the relative expression levels of genes were calculated. The significance of the differences between all groups (n = 3) was assessed using SPSS.
Forests 14 01465 g007
Table 1. Overview of the Illumina HiSeq sequencing statistics in P. davidiana in the control treatment (CK) and the drought treatment at 14 d.
SampleRaw ReadsRaw BasesClean ReadsClean BasesClean Bases Q30 (%)Clean GC Content (%)Mapped Rate
CK47.08 M7.06 G47.06 M7.02 G93.7453.0693.28%
D1451.01 M7.65 G50.99 M7.62 G94.0554.0693.90%
Table 2. Significant enrichment analysis of DEGs pathways.
PathwayPathway IDp ValueNumber of DEGs
Starch and sucrose metabolismko005004.05083 × 10−6 ***88
Metabolic pathwaysko011001.00482 × 10−5 ***1055
Photosynthesisko001951.20885 × 10−5 ***63
MAPK signaling pathway—plantko040166.20075 × 10−5 **91
Circadian rhythm—plantko047127.72403 × 10−5 **33
Biosynthesis of secondary metabolitesko011100.000483439 ***592
Amino sugar and nucleotide sugar metabolismko005200.000758187 ***74
Phagosomeko041450.000792934 ***53
Photosynthesis-antenna proteinsko001960.00330978 **14
Plant hormone signal transductionko040750.003426549 **137
Galactose metabolismko000520.004983568 **35
Fructose and mannose metabolismko000510.005987693 **37
Peroxisomeko041460.009642317 **52
Other types of O-glycan biosynthesisko005140.01501615 *11
Glyoxylate and dicarboxylate metabolismko006300.01706609 *44
beta-Alanine metabolismko004100.02395275 *31
Anthocyanin biosynthesisko009420.0309142 *3
Cysteine and methionine metabolismko002700.03889815 *59
Ascorbate and aldarate metabolismko000530.03940826 *25
Flavonoid biosynthesisko009410.04486245 *32
Biosynthesis of unsaturated fatty acidsko010400.04768018 *15
Significance was defined as * (p < 0.05), ** (p < 0.01), *** (p < 0.001).
Disclaimer/Publisher’s Note: The statements, opinions and data contained in all publications are solely those of the individual author(s) and contributor(s) and not of MDPI and/or the editor(s). MDPI and/or the editor(s) disclaim responsibility for any injury to people or property resulting from any ideas, methods, instructions or products referred to in the content.