Article

Differences in the Growth of Seedlings and the Selection of Fast-Growing Species in the Gleditsia Genus

1
Key Laboratory of Forest Cultivation in Plateau Mountain of Guizhou Province, Institute for Forest Resources and Environment of Guizhou, College of Forestry, Guizhou University, Guiyang 550025, China
2
School of Continuing Education, Yanbian University, Yanji 133002, China
*
Author to whom correspondence should be addressed.
Forests 2023, 14(7), 1464; https://doi.org/10.3390/f14071464
Submission received: 6 April 2023 / Revised: 14 July 2023 / Accepted: 14 July 2023 / Published: 17 July 2023
(This article belongs to the Special Issue Advances in Tree Germplasm Innovation and High-Efficiency Propagation)

Abstract

:
The Gleditsia genus has various uses, including those for medicinal, edible, chemical, timber, and ornamental purposes, and the genus is widely distributed in China. However, there is still a lack of understanding about the phenotypic and growth differences seen among species within the Gleditsia genus. In this study, we compared and analyzed the various species of Gleditsia seedlings in terms of their genotypes, chromosome numbers, physiological growth, photosynthesis, hormone content, and gene expression. The results showed that the genome size of the Gleditsia genus ranges from 686.08 M to 1034.24 M and that all Gleditsia species are diploid. Among the species studied, G. fera can be divided into fast-growing genotype, exhibited several advantages in terms of leaf type and photosynthetic capacity, high levels of GA3, and fast stem growth, making it a species with the potential for promotion and application. G. delavayi exhibited high levels of auxin and cytokinin and strong photosynthetic capacity, with rapid growth in terms of plant height. G. microphylla had the lowest levels of IAA, IBA, and NAA in the apical, and showed slow growth in terms of plant height. Weighted correlation network analysis (WGCNA) identified the hub genes associated with traits. This study lays a material and theoretical foundation for the development of new resources for Gleditsia breeding and rootstock selection and provides a basis for the mechanism of rootstock–scion interaction.

1. Introduction

The Gleditsia genus (Fam.: Leguminosae) is widely distributed in Asia, the Americas, and Latin America [1]. In China, there are six species and two varieties, including G. sinensis Lam., G. australis, G. fera, G. japonica, G. microphylla, and the varieties G. japonica var. delavayi and G. japonica var. velutina, and one species (G. triacanthos Linn.) which is introduced [2,3]. Currently, Gleditsia is mainly used in the form of its thorns and pods. The thorns of G. sinensis are in the form of branch thorns; they are widely used in the pharmaceutical industry and have great medicinal value [4]. In China, G. sinensis thorn has been traditionally used for its anticancer, detoxication, detumescence, apocenosis, and antiparasitic effects [5]. Gleditsiae Sinensis Fructus, Fructus Gleditsiae, and Abnormalis Gleditsiae Spina are recorded in the Chinese Pharmacopoeia as medicinal parts of G. sinensis [6]. Triterpenoidal saponins and flavonoids are the most abundant constituents of Gleditsia species; crude extracts, fractions and isolated compounds show diverse cytotoxic, antimicrobial, antihyperlipidemic, analgesic, antioxidant and hypoglycemic activities [7]. Gleditsia pods has been used as a detergent in China for thousands of years [8]. Legume plant (Legumioseae family) seeds are usually comprised of the embryo, perisperm, testa (seed coat), and endosperm; the endosperm of Gleditsia is rich in galactomannan [9,10]. There are significant differences in pod traits between different various species. The pod of G. japonica is flat and irregularly twisted; the pod of G. microphylla is brown to deep brown, obliquely elliptic or obliquely oblong, flat, thin, glabrous; the pod of G. velutina is densely yellowish green velutinous; G. fera pod is densely brownish-yellow pubescent when young, becoming glabrescent and deep brown to blackish-brown when mature; G. australis seed implantation site is obviously swollen, with few fruitless necks. The distribution range of some Gleditsia species is relatively small; for example, G. delavayi is found only in Yunnan and Guizhou Province, China; G. velutina is endemic to Hunan Province, China, and is a rare and endangered plant that is under national protection. G. sinensis is widely distributed in China and the trees are resistant to drought, cold, and pollution; the wood can be used as a high-end timber, while the seeds contain abundant pectin and protein components and are used as thickeners, stabilizers, and adhesives [11,12].
As Gleditsia cultivation relies on fruit as a source of income, grafting is often used to obtain early maturation and high yield. The use of superior germplasm resources via grafting can preserve positive plant traits, shorten breeding cycles, quickly utilize the existing germplasm resources, and meet production needs. Promoting the use of bud-grafting seedlings (i.e., using young seedlings that were directly grafted onto mature female tree buds) and utilizing excellent scion material for grafting are direct ways to increase pod yield. Preliminary experiments showed that the survival rate for the inter-species grafting of Gleditsia seedlings is over 86%. Grafting can cause changes in traits, which can lead to the dwarfing or heightening of the scion’s growth, as well as changes in the level of resistance. The scion relies on the rootstock for water and mineral nutrition, while the rootstock relies on the scion to supply photosynthate [13]. Grafting of plants can lead to changes in the root characteristics, communication between scions and rootstocks, and changes in scion morphology and physiology regarding drought resistance [14]. However, in real-world production, the impact of different rootstocks on G. sinensis cuttings is still unknown. The growth and developmental characteristics of Gleditsia species during the seedling stage, the differences in their photosynthetic characteristics under the same site conditions, and differences in genotype may all be the cause of changes in grafting phenotypes in later cultivation stages. These variations in growth and physiological characteristics can be exploited via breeding and the selection of specific genotypes.
This study analyzes the genotype (chromosome number and ploidy level), seedling phenotype, physiological growth, hormone content, and gene expression of Gleditsia species, providing a reference for the selection of early fast-growing species in the Gleditsia genus. Clarifying the phenotypic differences and basic genotype differences found among Gleditsia species can help to screen quickly for fast-growing and slow-growing rootstock genotypes, providing guidance for the selection of rootstocks and the identification of superior varieties in the later stages of cultivation.

2. Materials and Methods

2.1. Experimental Materials

We collected seeds from the various species of Gleditsia found in China, including G. sinensis (Guiyang, China), G. fera (Ceheng, China), G. japonica (Xinmin, China), G. microphylla (Nanyang, China), G. delavayi (Xinyi, China), G. australis (Conghua, China), and G. velutina (Changsha, China). After preparing the aforementioned seeds for germination, the germinated seeds were planted in the greenhouse at the Forestry College of Guizhou University in Guiyang, Guizhou Province, using a humus: yellow loam soil mixture (1:3) as the soil type. Seedlings that were 3.5 months old were selected for recording the following measurements: growth phenotype, physiological indicators, hormone levels, and transcriptome analysis.

2.2. Analysis of Genome Size and Chromosome Quantity in the Gleditsia Genus

Approximately 20 mg of mature leaves from the different Gleditsia species were harvested. The leaves were then added to 1 mL of pre-cooled, ice-cold nuclei isolation buffer (mGb buffer: 45 mM MgCl2·6H2O, 20 mM MOPS, 30 mM sodium citrate, 1% (w/v) PVP 40, 0.2% (v/v) Tritonx-100, 10 mM Na2EDTA, and 20 μL/mL β-mercaptoethanol, with a pH of 7.0) for dissociation. The harvested leaves were chopped rapidly using a sterilized surgical blade and were then homogenized without generating bubbles. The homogenate was then filtered through a 42-mm nylon mesh to obtain a nuclear suspension. DNA fluorescent dyes were added, and the mixture was gently shaken. Subsequently, 50 mg/mL of propidium iodide (PI) and 50 mg/mL of RNase were added, then the sample was incubated on ice in the dark before analysis. The relative fluorescence was measured using a flow cytometer (FACScalibur, BD Company, Franklin Lakes, NJ, USA) with an excitation wavelength of 488 nm, and the fluorescence signal was collected in the FL2 channel. The internal standard plant genome used in the procedure was that of maize B73. The plants were cultivated to obtain root-tip meristematic tissue. To prepare the chromosome specimens, cell mitosis was induced using nitrous oxide, then dispersed mid-stage chromosome cells were obtained. Fluorescent probes for telomeric conserved repeat sequences, 5SrDNA, and 18SrDNA universal probes were used for fluorescence in situ hybridization (FISH) to determine the chromosome karyotype characteristics of species. Three biological replicates were created.

2.3. Determination of Photosynthetic Characteristics and Physiological Indicators

Over 30 different individual plants from each species were selected and measured for plant height, ground diameter, maximum root length, number of leaflets, the total number of leaflets on the longest leaf, leaflet length, leaf width, the length-to-width ratio, and fresh weight using calipers, electronic scales, and other measuring tools. Different Gleditsia species with a 3.5-month seedling age were selected, then a hand-held SPAD-502 chlorophyll meter (Konica Minolta, Tokyo, Japan) was used to measure the SPAD values. Biological replicates were created thirty times. Fresh leaves from the seedlings were cut into pieces and submerged in 80% (v/v) acetone in the dark at room temperature for 24 h to extract the chlorophyll. Chlorophyll a (Chla), chlorophyll b (Chlb), total chlorophyll (Chl (a+b)), and carotenoid (Car) concentrations were calculated using an ultraviolet-visible spectrophotometer [15]. The chlorophyll fluorescence parameters were measured using a Monitoring-PAM (Heinz Walz GmbH, Effeltrich, Germany). First, the seedlings were adapted to darkness for at least half an hour, then the minimal fluorescence (Fo) and maximal fluorescence (Fm), maximal photochemical efficiency of PSII (Fv/Fm), nonphotochemical quenching (NPQ, NPQ = (Fm − Fm_Lss)/Fm_Lss), steady-state fluorescence decay rate (Rfd_Lss, Rfd_Lss = (Fp − Ft_Lss)/Ft_Lss), and maximum light quantum efficiency (QY, QY = ((Fm_Lss − Ft_Lss)/Fm_Lss)) were measured. The photosynthetic parameters were measured using a Li-6800 portable photosynthesis system (Li-COR Corp., Lincoln, NE, USA). After the transpiration rate (Tr), net photosynthetic rate (Pn), intracellular CO2 concentration (Ci), and photosynthetic light-response curves were determined, the photosynthetically active radiation (PAR) gradient values of the light-response curves were recorded at 0, 50, 150, 300, 600, 900, 1200, and 1500 μmol·m−2·s−1. The malondialdehyde (MDA) contents in roots and leaves were determined via the thiobarbituric acid method [16]. The soluble proteins (SP) in the roots and leaves were measured using the Bradford method [17]. The soluble sugar (SS) contents in the roots and leaves were measured based on the anthrone method [18]. The hydrogen peroxide (H2O2) concentration in roots and leaves was determined using the potassium iodide method [19]; biological replicates were created three times.

2.4. Determination of Hormone Content

Hormone content was determined by cutting the stem tips (of about 1 cm) of 3.5-month-old G. sinensis, G. japonica, G. microphylla, G. delavayi, and G. fera plants. The samples were wrapped in aluminum foil and placed in liquid nitrogen for at least 30 min before being transferred to a −80 °C ultra-low-temperature freezer for storage. Biological replicates were created three times. The samples were ground using a mill (MM 400, Retsch, Germany) at 30 Hz for 1 min until they were a fine powder. Then, 50 mg of the ground sample was accurately weighed and an appropriate amount of internal standard was added, after which the sample was extracted using a solution of methanol:water:formic acid (15:4:1). After concentration was completed, the extraction solution was re-dissolved with 100 μL of 80% methanol–water solution, filtered through a 0.22 μm PTFE membrane, and placed in an injection bottle for analysis using tandem mass spectrometry combined with liquid chromatography (LC-MS/MS). The liquid phase conditions were as follows. Chromatographic conditions—column model: Acquity UPLC HSS T3 (1.8 µm, 2.1 × 100 mm); column temperature: 40 °C; mobile phase: A, water (containing 0.1% formic acid) and B, acetonitrile (containing 0.1% formic acid); flow rate: 0.35 mL/min; injection volume: 2 μL. Mass spectrometry employed an ESI ion source; the sample mass spectrometry signals were collected using the positive and negative ion scanning modes. The measured hormones included: indole-3-acetic acid (IAA), 3-indolebutyric acid (IBA), 3-indolepropionic acid (IPA), 1-naphthaleneacetic acid (NAA), trans-zeatin-riboside (tZR), N6-isopentenyladenine (iP), dihydrozeatin (DZ), zeatin (Z), salicylic acid (SA), methyl 5-methylsalicylate (MeSA), jasmonate (JA), abscisic acid (ABA), 1-aminocyclopropane-1-carboxylic acid (ACC), gibberellin GA3, and paclobutrazol (PP333). In addition, the peak area values of the different gibberellin forms (GA1, GA4, GA5, GA7, GA8, GA9, GA12, GA20, GA24, GA53) were determined.

2.5. RNA Extraction, Library Construction, and RNA-Seq Analysis

Total RNA was extracted from the stem tips (about 1 cm) of 3.5-month-old G. sinensis, G. japonica, G. microphylla, G. delavayi, and G. fera plants, according to the instruction manual for Trizol reagent (Invitrogen, Carlsbad, CA, USA). RNA integrity was assessed using agarose gel electrophoresis, while its integrity number (RIN) was measured using an Agilent 2100 (Agilent Technologies, Santa Clara, CA, USA). The RNA extraction quality and the concentrations of all samples were satisfactory (A260/280 = 2.0–2.2; A260/230 = 1.8–2.2; 28S/18S = 1.4–2.7; RIN ≥ 8.0). The mRNA was enriched with Oligo (dT) magnetic beads. Then, the mRNA was added to the fragmentation buffer and cut into short fragments. Using the mRNA as a template, the cDNA was reverse-transcribed using six-base random primers. The double-stranded cDNA samples were purified and end-repaired, and poly(A) tails were added, then the samples were ligated to sequencing adapters to create cDNA libraries. After the libraries passed the quality test, the qualified libraries were sequenced using an Illumina HiSeq machine with paired-end reads. The raw reads generated in the Illumina sequencing were deposited in the NCBI SRA database (BioProject, accession number: PRJNA946805). The raw reads were quality-controlled using fastp [20] and the G. sinensis full-length PacBio SMRT transcriptome data (accession number: PRJNA722800) were used as a reference. Bowtie2 v2.3.5.1 software [21] was used to align the clean data with the reference data, then transcript-level expression as a unit of transcripts per million (TPM) was estimated for each identified expression using RSEM v1.3.1 [22]. The DESeq2 R package [23] was used to normalize the counts of the identified genes. The threshold for selecting differentially expressed genes (DEGs) was set to a p-value of <0.05 and |foldchange| ≥ 2. The R software package WGCNA v1.72.1 [24] was used to determine the weighted correlation network analysis results. Genes with TPM expression values from any sample that were below 1 were removed. The top 5000 genes were screened using median absolute deviation for further analysis. The parameters were set as follows: power = 16, MinModuleSize = 30, and MEDissThres = 0.20. To identify the significant modules related to certain traits, the associations between gene significance (GS) and module membership (MM) value were evaluated. The MM value is essentially a correlation coefficient, wherein GS reflects the correlation between the gene expression and the phenotype data. MM ≥ 0.8 and GS ≥ 0.2 were used as the criteria employed to screen the key genes in the modules. The software package clusterProfiler v4.8.1 [25] was used for the GO (gene ontology) and KEGG (Kyoto Encyclopedia of Genes and Genomes) enrichment of the module genes.

2.6. Statistical Analysis

All statistical analyses were performed using the R v4.2.3 software (https://www.r-project.org/ (accessed on 1 March 2023)) [26]. A least significant difference test (LSD) was used at a probability level of 0.05 to verify the significance between species. Cluster analysis of the samples was performed using hcluster function and visualization was performed using the factoextra v1.0.7 R package [27]. Principal component analysis (PCA) was performed using the FactoMineR v2.8 R package [28].

3. Results

3.1. Genome Size and Chromosome Number Analysis

It was determined via flow cytometry analysis that the genome size range of the various Gleditsia species was between 686.08 M and 1034.24 M (Figure 1). G. delavayi has a genome size of 913.41 ± 68.84 M, G. microphylla has a genome size of 876.54 ± 44.39 M, G. japonica has a genome size of 843.78 ± 43.8 M, and G. sinensis has a genome size of 780.29 ± 25.5 M. The genome size of G. fera was 727.04 ± 57.93 M, which was similar to those of G. australis (737.28 ± 46.93 M) and G. velutina (765.95 ± 8.57 M). Chromosome karyotype analysis was performed on the samples of G. delavayi, G. japonica, G. sinensis, and G. australis. The result showed that G. delavayi and G. japonica possessed four chromosomes showing strong 18SrDNA (green) hybridization signals, and their chromosome number was 2n = 28. G. australis possessed two chromosomes showing strong 5SrDNA (red) hybridization signals and two chromosomes showing strong 18SrDNA (green) hybridization signals, and the chromosome number was 2n = 28.

3.2. Growth Differences in Gleditsia Species

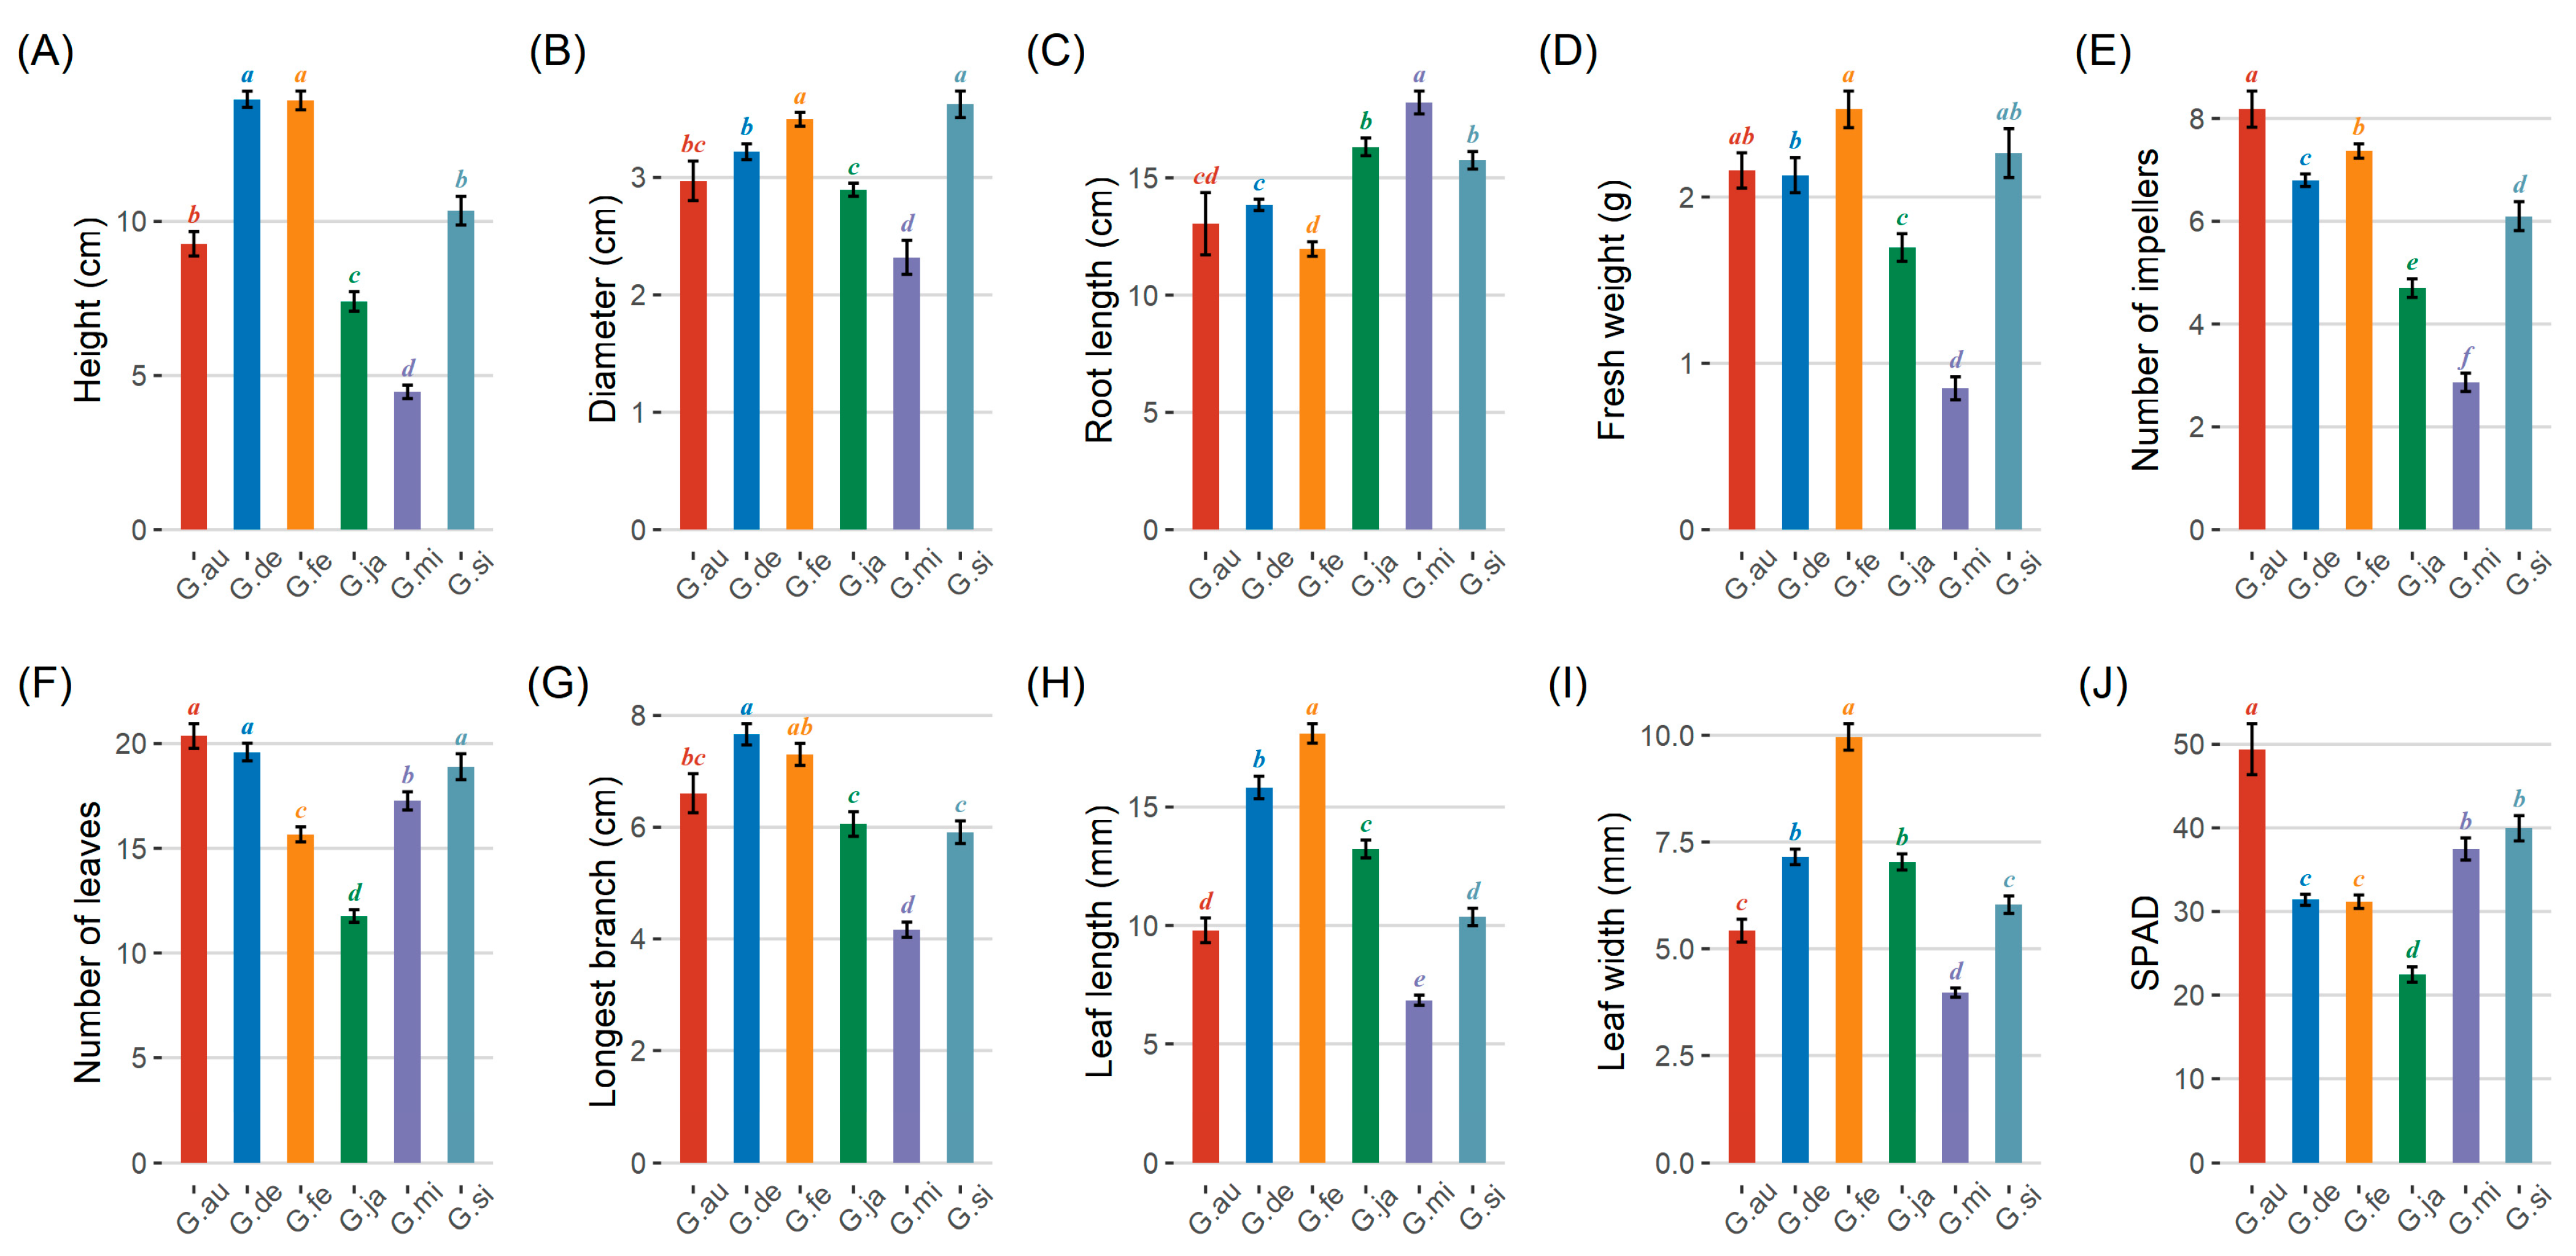
G. delavayi (13.96 ± 1.44 cm) and G. fera (13.92 ± 1.67 cm) exhibited the greatest height (Figure 2A), while G. sinensis (3.62 ± 0.62 cm) and G. fera (3.5 ± 0.32 cm) showed the largest ground diameter (Figure 2B). G. microphylla displayed the longest root length (18.21 ± 2.68 cm) (Figure 2C), while G. fera yielded the largest fresh weight (2.53 ± 0.60 g) (Figure 2D) and the lowest number of impellers (Figure 2E). G. japonica had the fewest leaves (Figure 2F), while G.delavayi (7.66 ± 1.04 cm) and G. fera (7.30 ± 1.07 cm) had the longest branches (Figure 2G). G. fera had the greatest leaf length and width (Figure 2H,I), while G. australis had the largest SPAD value (Figure 2J).

3.3. Differences in Photosynthetic Indicators and Physiological Characteristics

Analysis of the photosynthetic parameters showed significant differences (p < 0.05) among the Gleditsia seedlings in terms of their chlorophyll contents (Chla, Chlb, Chl(a+b)) and Car, and chlorophyll fluorescence parameters (Fv/Fm, QY, NPQ, Ft, Rfd, and qN). The Chla content of the seedlings was ranked as follows: G. fera > G. sinensis > G. australis > G. microphylla > G. delavayi > G. japonica (Figure 3A). The Chlb content of the seedlings was ranked as follows: G. sinensis > G. australis > G. fera > G. delavayi > G. microphylla > G. japonica (Figure 3B). The average content of Chl(a+b) in the seedlings was ranked as follows: G. sinensis > G. fera > G. australis > G. microphylla > G. delavayi > G. japonica (Figure 3C). The Chla/b ratio of G. fera was higher than that in the other seedings (Figure 3D). The Car content of the seedlings was ranked as follows: G. fera > G. microphylla > G. sinensis > G. australis > G. delavayi > G. japonica (Figure 3E). In terms of the chlorophyll fluorescence parameters, G. delavayi had higher Ft and Fv/Fm values (Figure 3F,G), G. japonica had a lower QY, Rfd and NPQ values (Figure 3H–J), while G. fera had a higher qN value (Figure 3K).
Using the hyperbolic model to fit the light-response curve, the seedlings showed a steady rate after reaching their highest point with increasing light intensity. The ETR fitting curve showed that G. australis, G. microphylla, and G. sinensis demonstrated highest ETRmax values. The Tr measurements showed that among the seedling combinations, its ranking was: G. delavayi > G. sinensis > G. fera > G. australis > G. japonica > G. microphylla (Figure 3L). G. delavayi had the highest Pn level among the seedlings (Figure 3M), while G. fera and G. microphylla had the highest Ci values (Figure 3N). There were significant differences in the soluble sugar, soluble protein content, and MDA from the roots and leaves among the Gleditsia seedlings (Figure 3O–T). G. fera had the highest MDA content in its leaves and the lowest content in its roots (Figure 3O,P). G. sinensis exhibited the highest soluble protein content in its roots, followed by G. delavayi (Figure 3Q). G. japonica exhibited the highest soluble protein content in its roots, followed by G. sinensis (Figure 3R). G. japonica had a higher soluble sugar content in its leaves, followed by G. sinensis (Figure 3S). G. fera exhibited the highest soluble sugar content in its leaves (Figure 3T).

3.4. Differences in Endogenous Hormone Content

The IAA content showed no significant difference (p = 0.541) among the Gleditsia seedlings. G. sinensis had the highest IBA level (0.143 ± 0.024 ng/g), followed by G. delavayi (0.07 ± 0.01 ng/g), while in G. japonica, the levels were not detected due to the low contents (Figure 4B). G. microphylla had the highest IPA level, followed by G. delavayi (Figure 4C). G. japonica had the highest NAA level (296.478 ± 8.583 ng/g), followed by G. delavayi (148.958 ± 17.972 ng/g) (Figure 4D). The cytokinin content varied significantly (p < 0.05) among the Gleditsia seedlings (Figure 4E–H). G. sinensis had a higher tZR level, followed by G. microphylla (Figure 4E), while G. delavayi had a higher iP level (Figure 4F). G. sinensis had a higher DZ level, followed by G. delavayi (Figure 4G), while G. microphylla had a higher Z level (Figure 4H). The contents of SA, MeSA, JA, ABA, and the ethylene precursor ACC varied significantly (p < 0.05) among the Gleditsia seedlings (Figure 4I–L). G. microphylla had the highest SA and ACC levels among the Gleditsia seedlings (Figure 4I,M), and G. japonica had the highest MeSA and ABA levels (Figure 4J,L), while G. delavayi had the highest JA level (Figure 4K). G. fera had the highest GA3 content; the PP333 content (5.59 ± 0.52 ng/g) of G. sinensis was higher than that of G. fera (3.37 ± 0.13 ng/g) and G. delavayi (3.62 ± 0.601 ng/g). In addition, G. japonica had the highest peak areas for GA1, GA4, GA8, GA9, and GA53; G. fera had the highest peak areas for GA5 and GA12; G. delavayi had the highest peak area for GA7 (Figure S1 in the Supplementary Materials).

3.5. Cluster Analysis and Principal Component Analysis

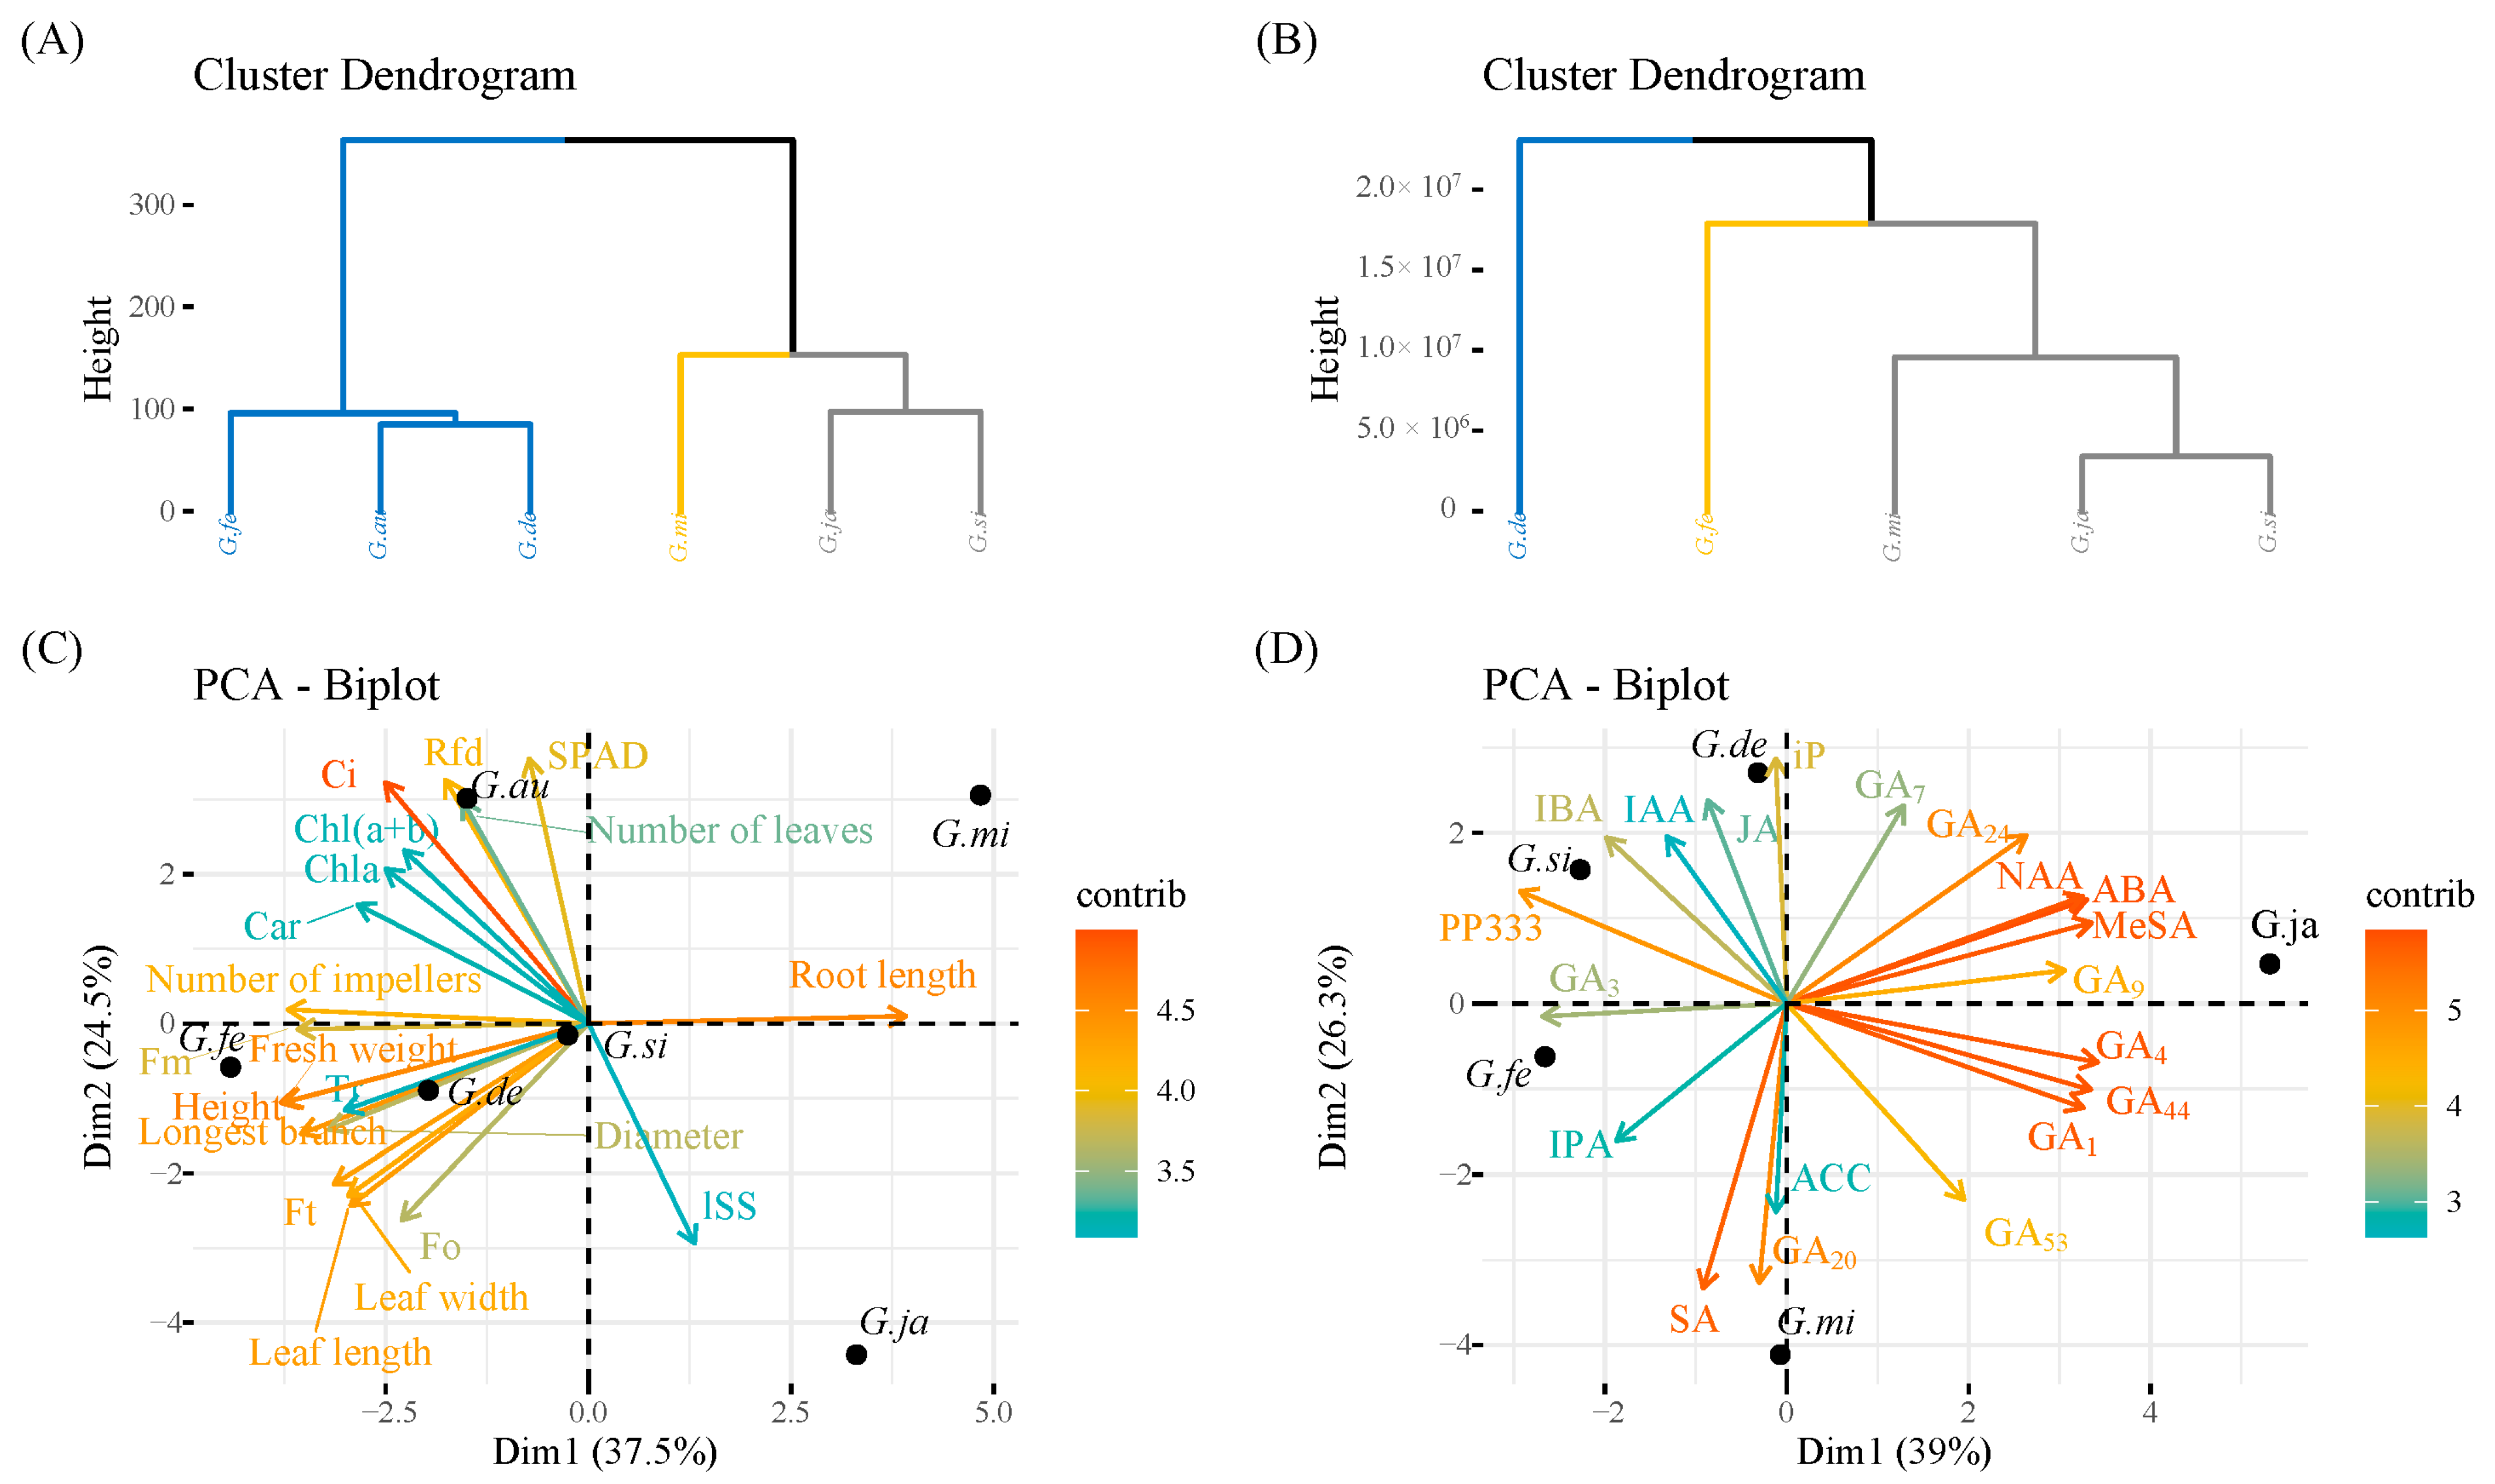
Cluster analysis was conducted, based on growth and the physiological indicators (Figure 5A) and hormone content (Figure 5B). G. japonica and G. sinensis were grouped together, based on the growth and physiological indicators; G. japonica, G. sinensis, and G. microphylla were grouped together, based on the hormone contents. A phenotypic and physiological PCA analysis showed that height, Ci, and other indicators made a relatively high contribution (Figure 5C). The hormone content PCA analysis showed that MESA, ABA, and other indicators made a relatively high contribution (Figure 5D).

3.6. RNA-Seq Analysis and WGCNA Analysis

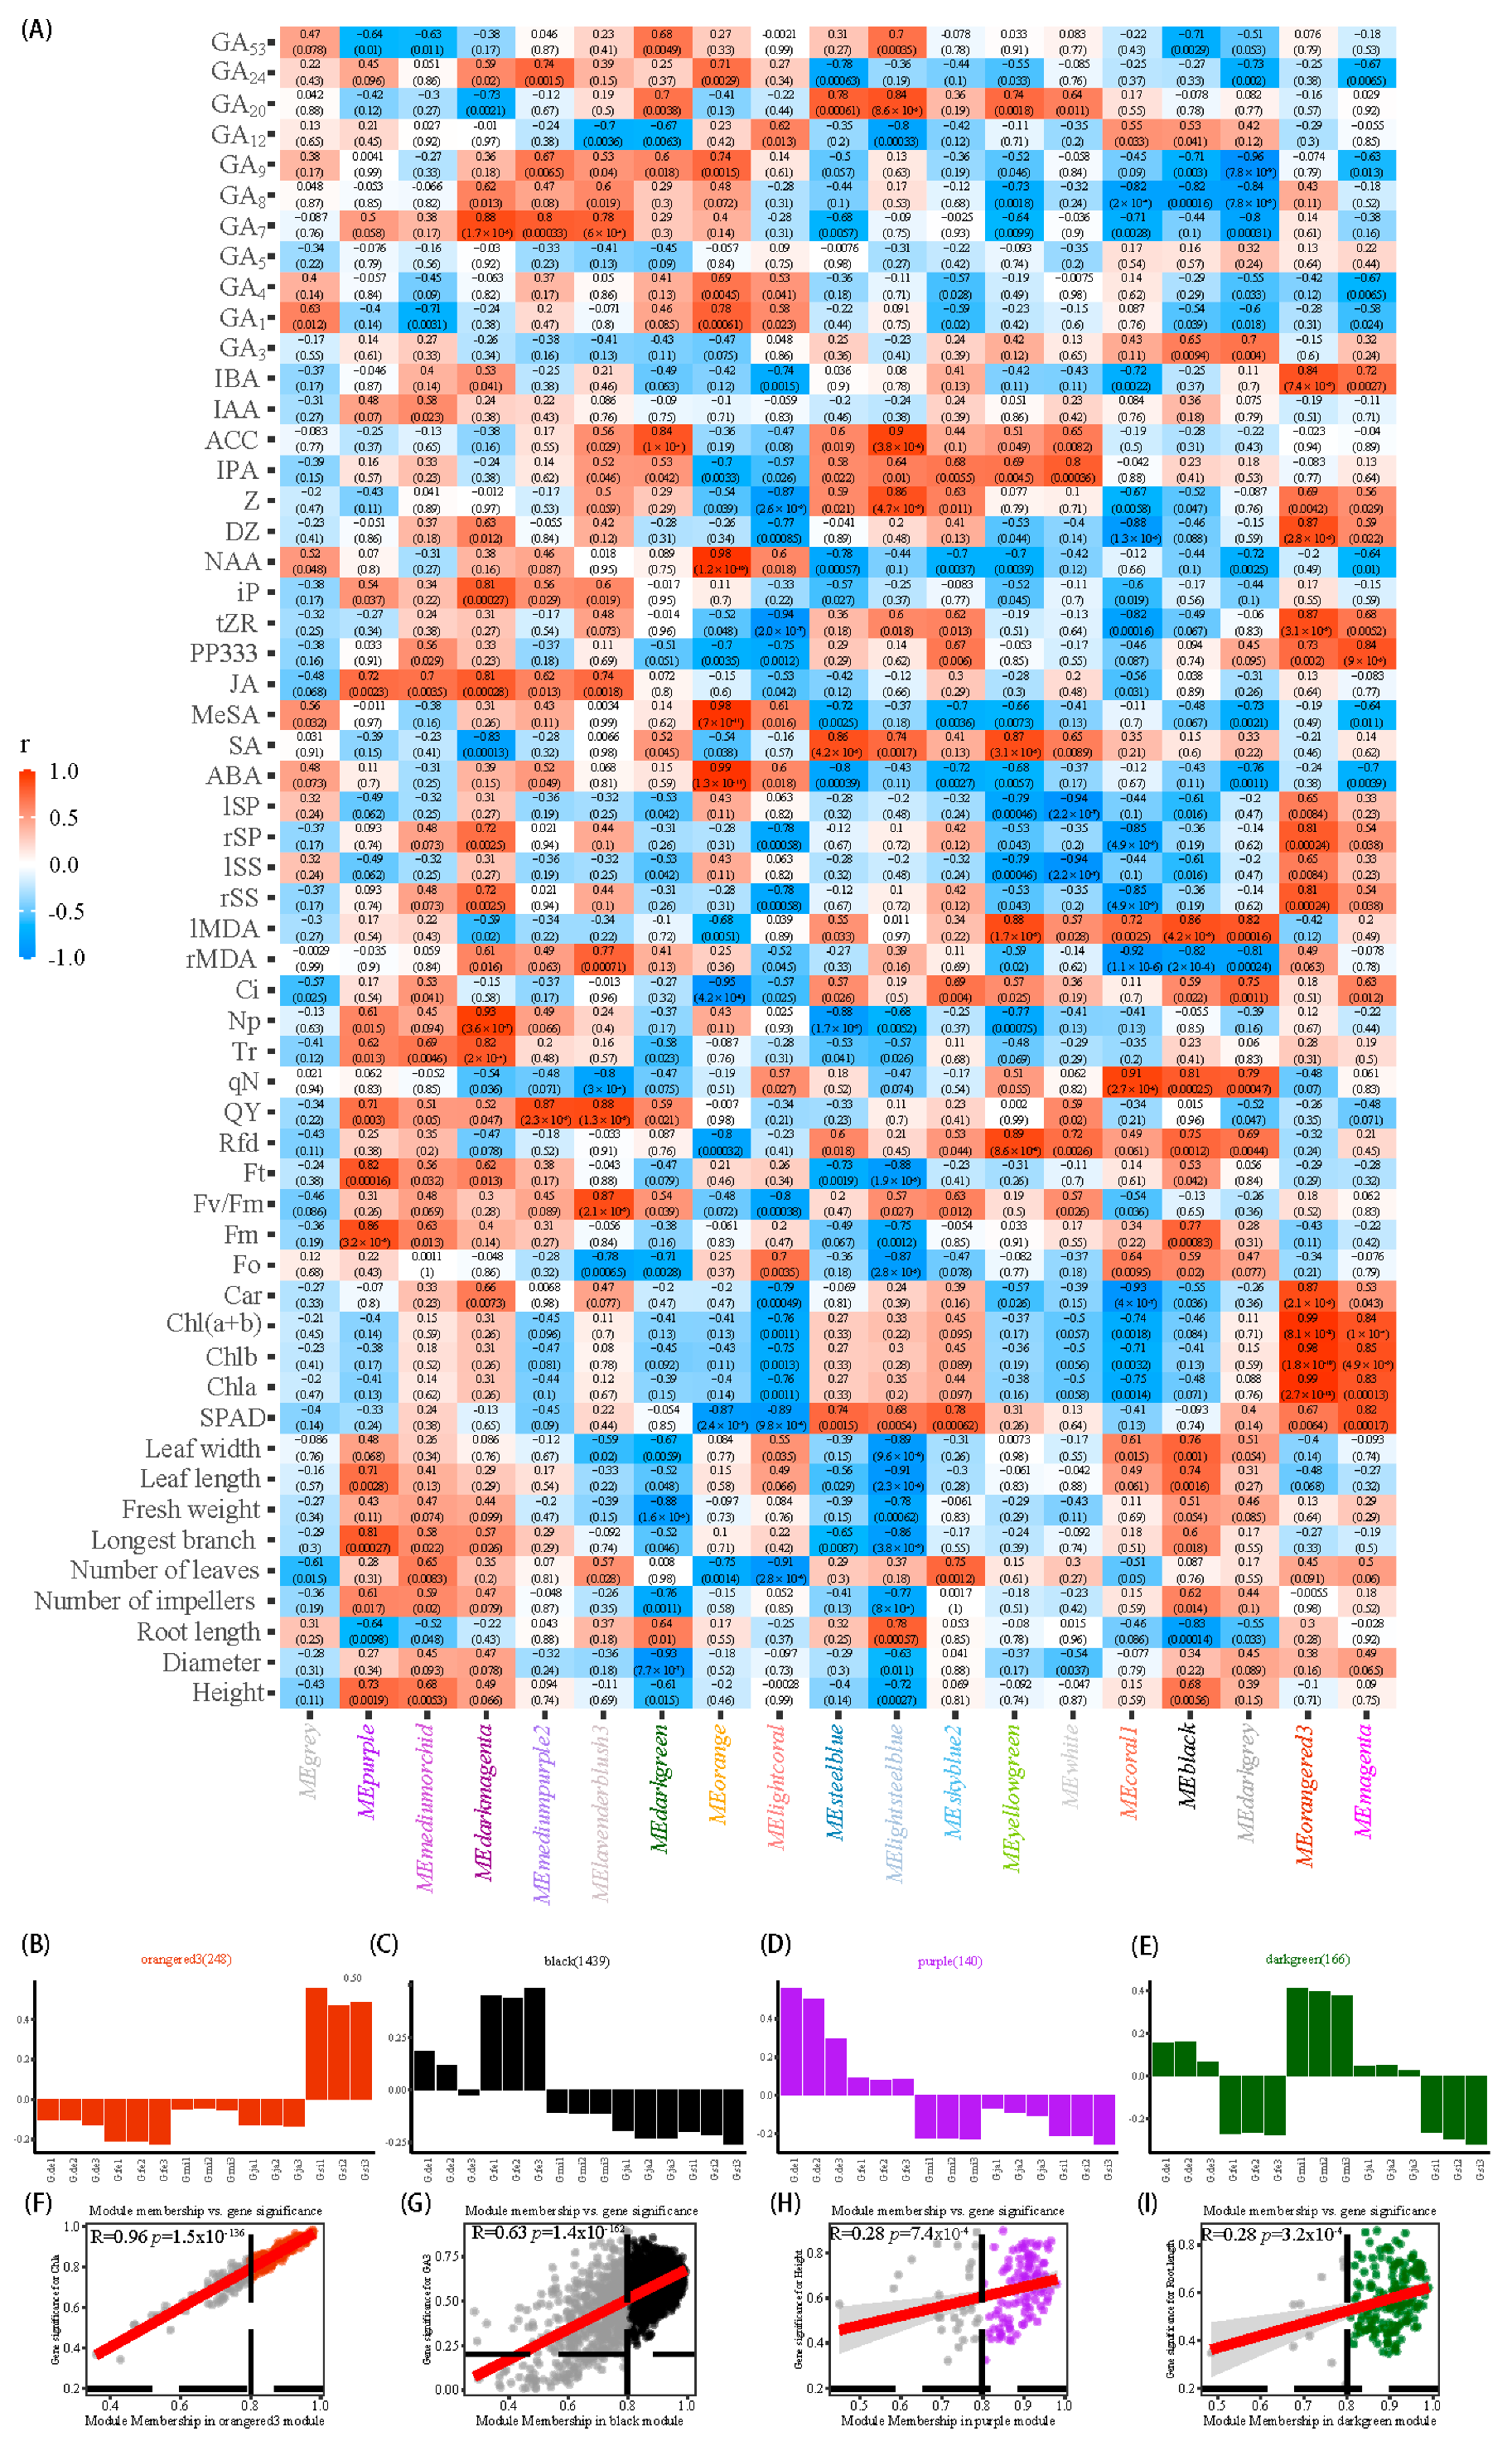
The weighted correlation network analysis (WGCNA) revealed that the genes could be divided into 19 modules (Figure 6A). The orangered3 module was significantly positively correlated with Chla, Chlb, and Chl(a+b). “Photosynthesis and light-harvesting” (GO:0009765), the “response to light stimulus” (GO:0009416), “photosynthesis and light-harvesting in photosystem I” (GO:0009768), and other biological process (BP) terms were enriched, while the “chlorophyll-binding” (GO:0016168) molecular function (MF) term was enriched in the orangered3 module. The KEGG enrichment results showed that photosynthesis-antenna proteins (ko00196) and photosynthesis proteins (ko00194) were enriched in the orangered3 module. The gene within the orangered3 module showed relatively high expression in the G. sinensis samples (Figure 6B). To investigate the relationship between gene significance and module membership, correlation analysis was performed between the two; the results showed that GS and MM were highly correlated (r = 0.96, p = 1.5 × 10−136) (Figure 6F), indicating that the highly co-expressed genes contained within the orangered3 module might cause a variation in Chla content. The gene within the black module showed relatively high expression in the G. fera samples (Figure 6C). Proteasome [BR:ko03051] (ko03051), phenylpropanoid biosynthesis (ko00940), cytochrome P450 [BR:ko00199] (ko00199), the biosynthesis of various plant secondary metabolites (ko00999), and other pathways showed enrichment in the black module. A correlation was found between the MM in the black module and GS in the trait of GA3 (r = 0.63, p = 1.4 × 10−162) (Figure 6G). The gene within the purple module showed relatively high expression in the G. delavayi samples (Figure 6D). The MF terms “monooxygenase activity” (GO:0004497), “oxidoreductase activity”, “acting on paired donors with the incorporation or reduction of molecular oxygen” (GO:0016705), “adenosylmethionine decarboxylase activity” (GO:0004014), and “oxidoreductase activity, acting on the aldehyde or oxo groups of donors, using NAD or NADP as an acceptor” (GO:0016620) were enriched in the purple module. A correlation was found between MM in the purple module and GS in the trait Height (r = 0.28, p = 7.4 × 10⁻⁴) (Figure 6H). The gene within the darkgreen module showed relatively high expression in the G. microphylla samples (Figure 6E). The “negative regulation of catalytic activity” (GO:0043086), the “porphyrin-containing compound biosynthetic process” (GO:0006779), and other BP terms were enriched in the darkgreen module. A correlation was found between MM in the purple module and GS in the trait Height (r = 0.28, p = 3.2 × 10⁻⁴) (Figure 6I).

4. Discussion

The various Gleditsia varieties have high economic and medicinal value. The rational development and utilization of species within the Gleditsia genus have contributed to the benign development of the Gleditsia cultivation industry. Currently, Gleditsia growers mainly cultivate G. sinensis, G. japonica, and G. delavayi, while the development and utilization of other species within the genus are still in the initial stages. Through the collection, identification, and measurement of quantitative traits of the various species within the genus, it was found that G. fera offers obvious advantages in terms of pod length and width, leaf length, leaf width, and the number of single-pod seeds; therefore, it is a species worthy of promotion and application. Understanding the phenotypic and genotypic differences found in the various Gleditsia varieties before grafting represents a basis for deciding whether the phenotypes of the different Gleditsia species, when used as rootstocks, will change after grafting. Clarifying the phenotypic and genotypic differences among the various Gleditsia species provides preliminary information for identifying changes in the phenotypes after grafting.
Genome size is an important parameter when establishing plant biodiversity; studying differences in genome size can provide basic data regarding plant species evolution, classification, and genome research. Flow cytometry can be used for rapid identification of the chromosome ploidy and genome size of plant germplasm resources [29]. Fluorescence in situ hybridization (FISH) is commonly used as an effective tool to identify and differentiate between the different germplasms [30]. Due to its relative conservation in terms of sequence and high expression abundance, rDNA is often used as a housekeeping gene sequence for chromosome karyotype analysis. It encodes the 18S-5.8S-25S (35S) and 5S ribosomal RNA (5SrDNA), consisting of conserved gene regions and variable transcribed and non-transcribed spacers that are arranged in tandem arrays on one or more loci [31]. 5SrDNA consists of a conserved coding region of 120 bp and an intergenic spacer (IGS), which contains potential regulatory motifs such as Poly-T, which is rich in AT and GC. These motifs differ in number, redundancy, and position along the IGS [32]. The 5S rDNA repeat units exhibit high intragenomic sequence similarity in the oak genus (Quercus), whereby comparative sequence analysis supports the existing classification of the oak genus [33]. Genome size, also known as the C value, refers to the amount of DNA found in a genome. Different ploidy levels can result in significant differences in genome size [34]. Genome size is an indicator of evolutionary distance and acts as a metric for genome characterization [35]. The flow cytometry measurements of 24 Lathyrus plant species showed that the 2C DNA content varied more than two-fold within the genus, ranging from 10.2 pg to 24.2 pg [36]. Certain species can promote evolution through chromosome structural rearrangement and polyploidization, as seen in the presence of 2, 4, 8, and 10 ploidy levels in the Calliandra genus [37]. The genome size of Gleditsia was determined using maize B73 as an internal standard; it ranged from 686.08 M to 1034.24 M (Figure 1). Although there were differences in genome size among the Gleditsia species, FISH analysis showed that the largest genome was found in G. delavayi, while medium-sized genomes were found in G. sinensis and G. japonica, and the smallest genome was found in G. australis, with a chromosome number of 2n = 28. This indicates that the tested Gleditsia species do not exhibit polyploidization.
By statistically analyzing the growth habits and related morphological indicators of the seedlings, it was found that G. fera had a significant advantage in terms of leaf length, leaf width, and fresh weight. The small leaf blades of G. fera were the longest. The average ratio of Chla to Chla/b and the carotenoid content of G. fera were higher than in other Gleditsia species (Figure 2A). The soluble protein content of its leaves was the highest and it had a higher peak value in the light-response curve and the maximum Ci. Plant apical dominance and plant height are closely related to the levels of plant hormones [38]. High levels of GA are associated with plant height growth [39,40]. GA may also directly trigger the rapid growth of Phyllostachys edulis shoots [41]. In Eucalyptus urophylla, 24 differentially expressed genes (DEGs) from the GA signal transduction pathways were found to positively regulate branch formation [42]. Comparative transcriptomics and metabolite analysis showed that the slow growth of regenerated tetraploid hybrid sweetgum was strongly related to auxin and gibberellin deficiency [43]. The absolute transcript levels of endogenous GA, relative to the growth parameters in juvenile seedlings, could potentially be used to accelerate the early selection of plant families with inherently rapid apical and radial growth expansion [44]. G. fera did not possess an advantage in terms of auxin- and cytokinin-related hormone levels, but it did show the highest levels of GA3 (Figure 4N), indicating that its long leaf blades and superior photosynthetic ability, when combined with high GA3 levels, produced more material accumulation and possessed the advantage of fast growth. In the xylem sap, tZR was the main form of cytokinin, while in the phloem sap, iP was its main form [45]. Among the Gleditsia seedlings, G. delavayi exhibited the highest Pn level and Tr level (Figure 2A), showing the highest peak value in the light-response curve and the highest IBA content level (0.07 ± 0.01 ng/g) and iP level. The IPA level was second only to that of G. microphylla and the NAA level was second only to G. japonica, while the DZ level was second only to that of G. sinensis. This indicated that G. delavayi exhibits high levels of growth hormones and cytokinins, strong photosynthetic ability, and relatively fast growth in height. Cluster analysis showed that G. delavayi, G. australis, and G. fera were clustered together (Figure 5A). G. fera and G. delavayi offer obvious growth advantages; therefore, they can be used as research objects for fast-growing tree species. In the Gleditsia genus, adult G. microphylla trees grow as shrubs or small trees, with a height of 2–4 m and a developed deep-root system [46,47]. The G. microphylla seedings had the lowest levels of IAA, IBA, and NAA hormones, which may be the main reason why their height growth was relatively slow; therefore, this can be classified as a slow-growing genotype. While G. sinensis, G. delavayi, and G. japonica are widely cultivated for the current market, this study found that G. fera is a species with promising prospects in terms of promotion and application because of its fast growth.
Plants’ responses to growth and development are coordinated through the regulation of numerous complex and, usually, interconnected signal transduction pathways that are found in metabolic networks. In order to understand the differences in gene expression between fast-growing and slow-growing plants, we conducted RNA-seq sequencing on the stem tips of different Gleditsia species. Comparative transcriptome analysis revealed that 408 DEGs were found between the fast-growing wood and slow-growing wood areas in Pinus massoniana [48]. As an invasive species, Mikania micrantha exhibits rapid growth. WGCNA analysis shows that many of the key genes that were highly correlated with Mikania micrantha leaf and stem tissues were mainly involved in chlorophyll synthesis, the response to auxin, the CAM pathway, and other photosynthesis-related processes, which promoted this fast growth [49]. A BEL1-like transcription factor, PeuBELL15, was up-regulated in the faster-growing genotype of Populus [50]. Based on the WGCNA analysis, the selected genes were divided into 19 modules (Figure 6A). The orangered3 module was significantly positively correlated with Chla, Chlb, and Chl(a+b), while the gene within the orangered3 module showed a relatively high expression in the G. sinensis samples (Figure 6B). GS and MM were highly correlated (r = 0.96, p = 1.5 × 10−136) (Figure 6F), indicating that the highly co-expressed genes contained within the orangered3 module might cause variations in Chla level. The gene found within the black module showed relatively high expression in the G. fera samples (Figure 6C). Proteasome (ko03051), phenylpropanoid biosynthesis (ko00940), cytochrome P450 (ko00199), the biosynthesis of various plant secondary metabolites (ko00999), and other pathways showed enrichment in the black module. The DEGs involved in cell wall biosynthesis, expansion, phytohormone biosynthesis, signal transduction pathways, flavonoid biosynthesis, and phenylpropanoid biosynthesis were significantly enriched in Salix matsudana plant-height mutants [51]. Phenylpropanoid biosynthesis is closely related to wood formation [52] and plant height [53]. A correlation was found between MM in the black module and GS in the trait GA3 (r = 0.63, p = 1.4 × 10−162) (Figure 6G). This indicates that the fast-growing characteristic of G. fera may be related to its content level of GA3.

5. Conclusions

The rational development and utilization of species within the Gleditsia genus are beneficial for the healthy development of the Gleditsia product industry. The Gleditsia genus is diploid (2n = 28), with a genome size ranging from 686.08 M to 1034.24 M. G. fera has excellent photosynthetic ability and a high level of GA3, which gives it the advantage of rapid growth and makes it suitable for promotion and utilization as a fast-growing dominant species. G. delavayi demonstrated high levels of auxin and cytokinin, as well as strong photosynthetic capacity, resulting in faster plant height growth. G. microphylla had the lowest levels of IAA, IBA, and NAA, resulting in slow plant height growth. This study provides a material and theoretical basis for the development of new resources for Gleditsia breeding and rootstock selection.

Supplementary Materials

The following supporting information can be downloaded at: https://www.mdpi.com/article/10.3390/f14071464/s1, Figure S1: The differences in gibberellin contents among seedlings.

Author Contributions

Conceptualization, F.X. and Y.Z.; methodology, F.X.; software, F.X. and Y.Z.; validation, F.X. and Y.Z.; formal analysis, X.W.; investigation, F.X.; resources, F.X. and X.J.; data curation, Y.Z.; writing—original draft preparation, F.X.; writing—review and editing, F.X. and Y.Z.; visualization, F.X. and Y.Z.; supervision, Y.Z.; project administration, Y.Z.; funding acquisition, Y.Z. All authors have read and agreed to the published version of the manuscript.

Funding

This research was funded by the Science and Technology Plan Project of Guizhou Province ([2022] general 102), the Science and Technology Plan Project of Guizhou Province ([2020]1Y056), the characteristic forestry industry research project of Guizhou Province (GZMC-ZD20202102) and (GZMC-ZD20202098), the Science and Technology Plan Project of Guizhou Province ([2020]1Y058) and Guizhou Provincial Science and Technology Projects (grant number QKHJC-ZK [2022] YB157).

Data Availability Statement

The raw reads generated via Illumina sequencing were deposited in the NCBI SRA database (BioProject accession number: PRJNA946805).

Conflicts of Interest

The authors declare no conflict of interest.

References

  1. Zhang, J.P.; Tian, X.H.; Yang, Y.X.; Liu, Q.X.; Wang, Q.; Chen, L.P.; Li, H.L.; Zhang, W.D. Gleditsia species: An ethnomedical, phytochemical and pharmacological review. J. Ethnopharmacol. 2016, 178, 155–171. [Google Scholar] [CrossRef]
  2. Lan, Y.; Zhou, L.; Li, S.; Cao, Q.; Lan, W. Advances in research of Gleditsia and its prospect of industrializational development. World For. Res 2004, 6, 17–21. [Google Scholar]
  3. Gu, W.; Cuiling, S.; Yanping, L. Research advances and utilization development of Gleditsia sinensis in world. Sci. Silvae Sin. 2003, 39, 127–133. [Google Scholar]
  4. Xiao, F.; Zhao, Y.; Wang, X.; Sun, Y. Comparative Transcriptome Analysis of Gleditsia sinensis Thorns at Different Stages of Development. Plants 2023, 12, 1456. [Google Scholar] [CrossRef]
  5. Bai, J.; Jing, X.; Yang, Y.; Wang, X.; Feng, Y.; Ge, F.; Li, J.; Yao, M. Comprehensive profiling of chemical composition of Gleditsiae spina using ultra-high-performance liquid chromatography coupled with electrospray ionization quadrupole time-of-flight mass spectrometry. Rapid Commun. Mass Spectrom. 2023, 37, e9467. [Google Scholar] [CrossRef]
  6. Li, J.; Ye, C. Genome-wide analysis of microsatellite and sex-linked marker identification in Gleditsia sinensis. BMC Plant Biol. 2020, 20, 338. [Google Scholar] [CrossRef]
  7. Ashraf, H.; Moussa, A.Y.; Eldahshan, O.A.; Singab, A.N.B. Genus Gleditsia: A Phytochemical and Biological Review (2015–2020). J. Biol. Act. Prod. Nat. 2022, 12, 1–23. [Google Scholar] [CrossRef]
  8. Han, S.; Wu, Z.; Wang, X.; Huang, K.; Jin, Y.; Yang, W.; Shi, H. De novo assembly and characterization of Gleditsia sinensis transcriptome and subsequent gene identification and SSR mining. Genet. Mol. Res. 2016, 15, gmr.15017740. [Google Scholar] [CrossRef]
  9. Liu, Y.; Xu, W.; Lei, F.; Li, P.; Jiang, J. Comparison and characterization of galactomannan at different developmental stages of Gleditsia sinensis Lam. Carbohydr. Polym. 2019, 223, 115127. [Google Scholar] [CrossRef]
  10. Sun, M.; Sun, Y.; Li, Y.; Liu, Y.; Liang, J.; Zhang, Z. Physical properties and antidiabetic potential of a novel galactomannan from seeds of Gleditsia japonica var. delavayi. J. Funct. Foods 2018, 46, 546–555. [Google Scholar] [CrossRef]
  11. Liu, Q.; Yang, J.; Wang, X.; Zhao, Y. Studies on Pollen Morphology, Pollen Vitality and Preservation Methods of Gleditsia sinensis Lam.(Fabaceae). Forests 2023, 14, 243. [Google Scholar] [CrossRef]
  12. Liu, F.; Wang, X.; Zhao, Y.; He, K. Effects of Different Temperatures on Growth and Physiological Characteristics of Gleditsia sinensis Seedlings. J. Mt. Agric. Biol. 2022, 41, 22–29. [Google Scholar] [CrossRef]
  13. Gutiérrez-Gamboa, G.; Gómez-Plaza, E.; Bautista-Ortín, A.B.; Garde-Cerdán, T.; Moreno-Simunovic, Y.; Martínez-Gil, A.M. Rootstock effects on grape anthocyanins, skin and seed proanthocyanidins and wine color and phenolic compounds from Vitis vinifera L. Merlot grapevines. J. Sci. Food Agric. 2019, 99, 2846–2854. [Google Scholar] [CrossRef] [PubMed]
  14. Kumar, P.; Rouphael, Y.; Cardarelli, M.; Colla, G. Vegetable Grafting as a Tool to Improve Drought Resistance and Water Use Efficiency. Front. Plant Sci. 2017, 8, 1130. [Google Scholar] [CrossRef] [PubMed] [Green Version]
  15. Lichtenthaler, H.K.; Wellburn, A.R. Determinations of total carotenoids and chlorophylls a and b of leaf extracts in different solvents. Analysis 1983, 11, 591–592. [Google Scholar] [CrossRef] [Green Version]
  16. Liu, J.J.; Wei, Z.; Li, J.H. Effects of copper on leaf membrane structure and root activity of maize seedling. Bot. Stud. 2014, 55, 47. [Google Scholar] [CrossRef] [Green Version]
  17. Bradford, M.M. A rapid and sensitive method for the quantitation of microgram quantities of protein utilizing the principle of protein-dye binding. Anal. Biochem. 1976, 72, 248–254. [Google Scholar] [CrossRef]
  18. Morris, D.L. Quantitative determination of carbohydrates with Dreywood’s anthrone reagent. Science 1948, 107, 254–255. [Google Scholar] [CrossRef] [PubMed]
  19. Hoffman, A.J.; Carraway, E.R.; Hoffmann, M.R. Photocatalytic production of H2O2 and organic peroxides on quantum-sized semiconductor colloids. Environ. Sci. Technol. 1994, 28, 776–785. [Google Scholar] [CrossRef]
  20. Chen, S.; Zhou, Y.; Chen, Y.; Gu, J. fastp: An ultra-fast all-in-one FASTQ preprocessor. Bioinformatics 2018, 34, i884–i890. [Google Scholar] [CrossRef]
  21. Langmead, B.; Salzberg, S.L. Fast gapped-read alignment with Bowtie 2. Nat. Methods 2012, 9, 357–359. [Google Scholar] [CrossRef] [PubMed] [Green Version]
  22. Li, B.; Dewey, C.N. RSEM: Accurate transcript quantification from RNA-Seq data with or without a reference genome. BMC Bioinform. 2011, 12, 323. [Google Scholar] [CrossRef] [PubMed] [Green Version]
  23. Love, M.I.; Huber, W.; Anders, S. Moderated estimation of fold change and dispersion for RNA-seq data with DESeq2. Genome Biol. 2014, 15, 550. [Google Scholar] [CrossRef] [PubMed] [Green Version]
  24. Langfelder, P.; Horvath, S. WGCNA: An R package for weighted correlation network analysis. BMC Bioinform. 2008, 9, 559. [Google Scholar] [CrossRef] [Green Version]
  25. Wu, T.; Hu, E.; Xu, S.; Chen, M.; Guo, P.; Dai, Z.; Feng, T.; Zhou, L.; Tang, W.; Zhan, L.; et al. clusterProfiler 4.0: A universal enrichment tool for interpreting omics data. Innovation 2021, 2, 100141. [Google Scholar] [CrossRef]
  26. R Core Team. R: A Language and Environment for Statistical Computing; R Core Team: Vienna, Austria, 2013. [Google Scholar]
  27. Kassambara, A.; Mundt, F. Package ‘factoextra’. In Extract and Visualize the Results of Multivariate Data Analyses; Factoextra: Vienna, Austria, 2017; p. 76. [Google Scholar]
  28. Lê, S.; Josse, J.; Husson, F. FactoMineR: An R package for multivariate analysis. J. Stat. Softw. 2008, 25, 1–18. [Google Scholar] [CrossRef] [Green Version]
  29. Vrána, J.; Cápal, P.; Bednářová, M.; Doležel, J. Flow cytometry in plant research: A success story. In Applied Plant Cell Biology: Cellular Tools and Approaches for Plant Biotechnology; Springer: Berlin/Heidelberg, Germany, 2014; pp. 395–430. [Google Scholar]
  30. Maragheh, F.P.; Janus, D.; Senderowicz, M.; Haliloglu, K.; Kolano, B. Karyotype analysis of eight cultivated Allium species. J. Appl. Genet. 2019, 60, 1–11. [Google Scholar] [CrossRef] [Green Version]
  31. Hemleben, V.; Volkov, R.A.; Zentgraf, U.; Medina, F.J. Molecular cell biology: Organization and molecular evolution of rDNA, nucleolar dominance, and nucleolus structure. In Progress in Botany: Genetics Physiology Systematics Ecology; Springer: Berlin/Heidelberg, Germany, 2004; pp. 106–146. [Google Scholar]
  32. de Souza, T.B.; Gaeta, M.L.; Martins, C.; Vanzela, A.L.L. IGS sequences in Cestrum present AT- and GC-rich conserved domains, with strong regulatory potential for 5S rDNA. Mol. Biol. Rep. 2020, 47, 55–66. [Google Scholar] [CrossRef]
  33. Bersaglieri, C.; Santoro, R. Genome Organization in and around the Nucleolus. Cells 2019, 8, 579. [Google Scholar] [CrossRef] [Green Version]
  34. Ammiraju, J.S.; Zuccolo, A.; Yu, Y.; Song, X.; Piegu, B.; Chevalier, F.; Walling, J.G.; Ma, J.; Talag, J.; Brar, D.S. Evolutionary dynamics of an ancient retrotransposon family provides insights into evolution of genome size in the genus Oryza. Plant J. 2007, 52, 342–351. [Google Scholar] [CrossRef]
  35. Yan, H.; Martin, S.L.; Bekele, W.A.; Latta, R.G.; Diederichsen, A.; Peng, Y.; Tinker, N.A. Genome size variation in the genus Avena. Genome 2016, 59, 209–220. [Google Scholar] [CrossRef] [Green Version]
  36. Nandini, A.; Murray, B.; O’BRIEN, I.; Hammett, K. Intra-and interspecific variation in genome size in Lathyrus (Leguminosae). Bot. J. Linn. Soc. 1997, 125, 359–366. [Google Scholar] [CrossRef]
  37. Paula, A.D.P.D.O.; Santos, G.R.D.; Costa, L.; Pestana, R.; Souza, G.; Sousa, G.M.D.; Leite, A.V.; Carvalho, R.D. Karyotypic variability in Calliandra sect. Androcallis (Leguminosae–Caesalpinioideae). Plant Biosyst.-Int. J. Deal. All Asp. Plant Biol. 2021, 155, 730–739. [Google Scholar] [CrossRef]
  38. Xiao, F.; Zhao, Y.; Wang, X.; Yang, Y. Targeted Metabolic and Transcriptomic Analysis of Pinus yunnanensis var. pygmaea with Loss of Apical Dominance. Curr. Issues Mol. Biol. 2022, 44, 5485–5497. [Google Scholar] [CrossRef] [PubMed]
  39. Richards, D.E.; King, K.E.; Ait-Ali, T.; Harberd, N.P. HOW Gibberellin Regulates Plant Growth and Development: A Molecular Genetic Analysis of Gibberellin Signaling. Annu. Rev. Plant Physiol. Plant Mol. Biol. 2001, 52, 67–88. [Google Scholar] [CrossRef] [Green Version]
  40. Cai, B.; Xie, Y.; Chen, Y.; Cao, M.; Feng, J.; Li, Y.; Yan, L.; Wei, Y.; Zhao, Y.; Xie, J.; et al. Transcriptome and Gene Co-Expression Network Analysis Identifying Differentially Expressed Genes and Signal Pathways Involved in the Height Development of Banana (Musa spp.). Int. J. Mol. Sci. 2023, 24, 2628. [Google Scholar] [CrossRef]
  41. Chen, M.; Guo, L.; Ramakrishnan, M.; Fei, Z.; Vinod, K.K.; Ding, Y.; Jiao, C.; Gao, Z.; Zha, R.; Wang, C.; et al. Rapid growth of Moso bamboo (Phyllostachys edulis): Cellular roadmaps, transcriptome dynamics, and environmental factors. Plant Cell 2022, 34, 3577–3610. [Google Scholar] [CrossRef]
  42. Yang, H.; Liao, H.; Xu, F.; Zhang, W.; Xu, B.; Chen, X.; Zhu, B.; Pan, W.; Yang, X. Integrated transcriptomic and gibberellin analyses reveal genes related to branch development in Eucalyptus urophylla. Plant Physiol. Biochem. 2022, 185, 69–79. [Google Scholar] [CrossRef]
  43. Chen, S.; Zhang, Y.; Zhang, T.; Zhan, D.; Pang, Z.; Zhao, J.; Zhang, J. Comparative Transcriptomic, Anatomical and Phytohormone Analyses Provide New Insights Into Hormone-Mediated Tetraploid Dwarfing in Hybrid Sweetgum (Liquidambar styraciflua × L. formosana). Front. Plant Sci. 2022, 13, 2024. [Google Scholar] [CrossRef]
  44. Maharana, R.; Dobriyal, M.J.; Behera, L.; Gunaga, R.; Thakur, N. Effect of pre seed treatment and growing media on germination parameters of Gmelina arborea roxb. Indian J. Ecol. 2018, 45, 623–626. [Google Scholar]
  45. Kudo, T.; Kiba, T.; Sakakibara, H. Metabolism and long-distance translocation of cytokinins. J. Integr. Plant Biol. 2010, 52, 53–60. [Google Scholar] [CrossRef] [PubMed]
  46. Flora of China Committee. Flora of China. 2018. Available online: http://www.iplant.cn (accessed on 1 March 2023).
  47. Yang, J.; Han, F.; Yang, L.; Wang, J.; Jin, F.; Luo, A.; Zhao, F. Identification of reference genes for RT-qPCR analysis in Gleditsia microphylla under abiotic stress and hormone treatment. Genes 2022, 13, 1227. [Google Scholar] [CrossRef] [PubMed]
  48. Zhou, Z.; Ding, G.; Li, Z.; Fan, F. Full-Length Transcriptome Analysis of the Secondary-Growth-Related Genes of Pinus massoniana Lamb. with Different Diameter Growth Rates. Forests 2023, 14, 811. [Google Scholar] [CrossRef]
  49. Mo, X.; Chen, H.; Yang, X.; Mo, B.; Gao, L.; Yu, Y. Integrated Analysis of Transcriptome and Small RNAome Reveals the Regulatory Network for Rapid Growth in Mikania micrantha. Int. J. Mol. Sci. 2022, 23, 10596. [Google Scholar] [CrossRef]
  50. Han, X.; An, Y.; Zhou, Y.; Liu, C.; Yin, W.; Xia, X. Comparative transcriptome analyses define genes and gene modules differing between two Populus genotypes with contrasting stem growth rates. Biotechnol. Biofuels 2020, 13, 139. [Google Scholar] [CrossRef]
  51. Liu, G.; Yang, Q.; Gao, J.; Wu, Y.; Feng, Z.; Huang, J.; Zou, H.; Zhu, X.; Chen, Y.; Yu, C.; et al. Identify of Fast-Growing Related Genes Especially in Height Growth by Combining QTL Analysis and Transcriptome in Salix matsudana (Koidz). Front. Genet. 2021, 12, 596749. [Google Scholar] [CrossRef] [PubMed]
  52. Meng, X.; Wang, Y.; Li, J.; Jiao, N.; Zhang, X.; Zhang, Y.; Chen, J.; Tu, Z. RNA Sequencing Reveals Phenylpropanoid Biosynthesis Genes and Transcription Factors for Hevea brasiliensis Reaction Wood Formation. Front. Genet. 2021, 12, 763841. [Google Scholar] [CrossRef]
  53. Zhao, X.; Sun, X.F.; Zhao, L.L.; Huang, L.J.; Wang, P.C. Morphological, transcriptomic and metabolomic analyses of Sophora davidii mutants for plant height. BMC Plant Biol. 2022, 22, 144. [Google Scholar] [CrossRef]
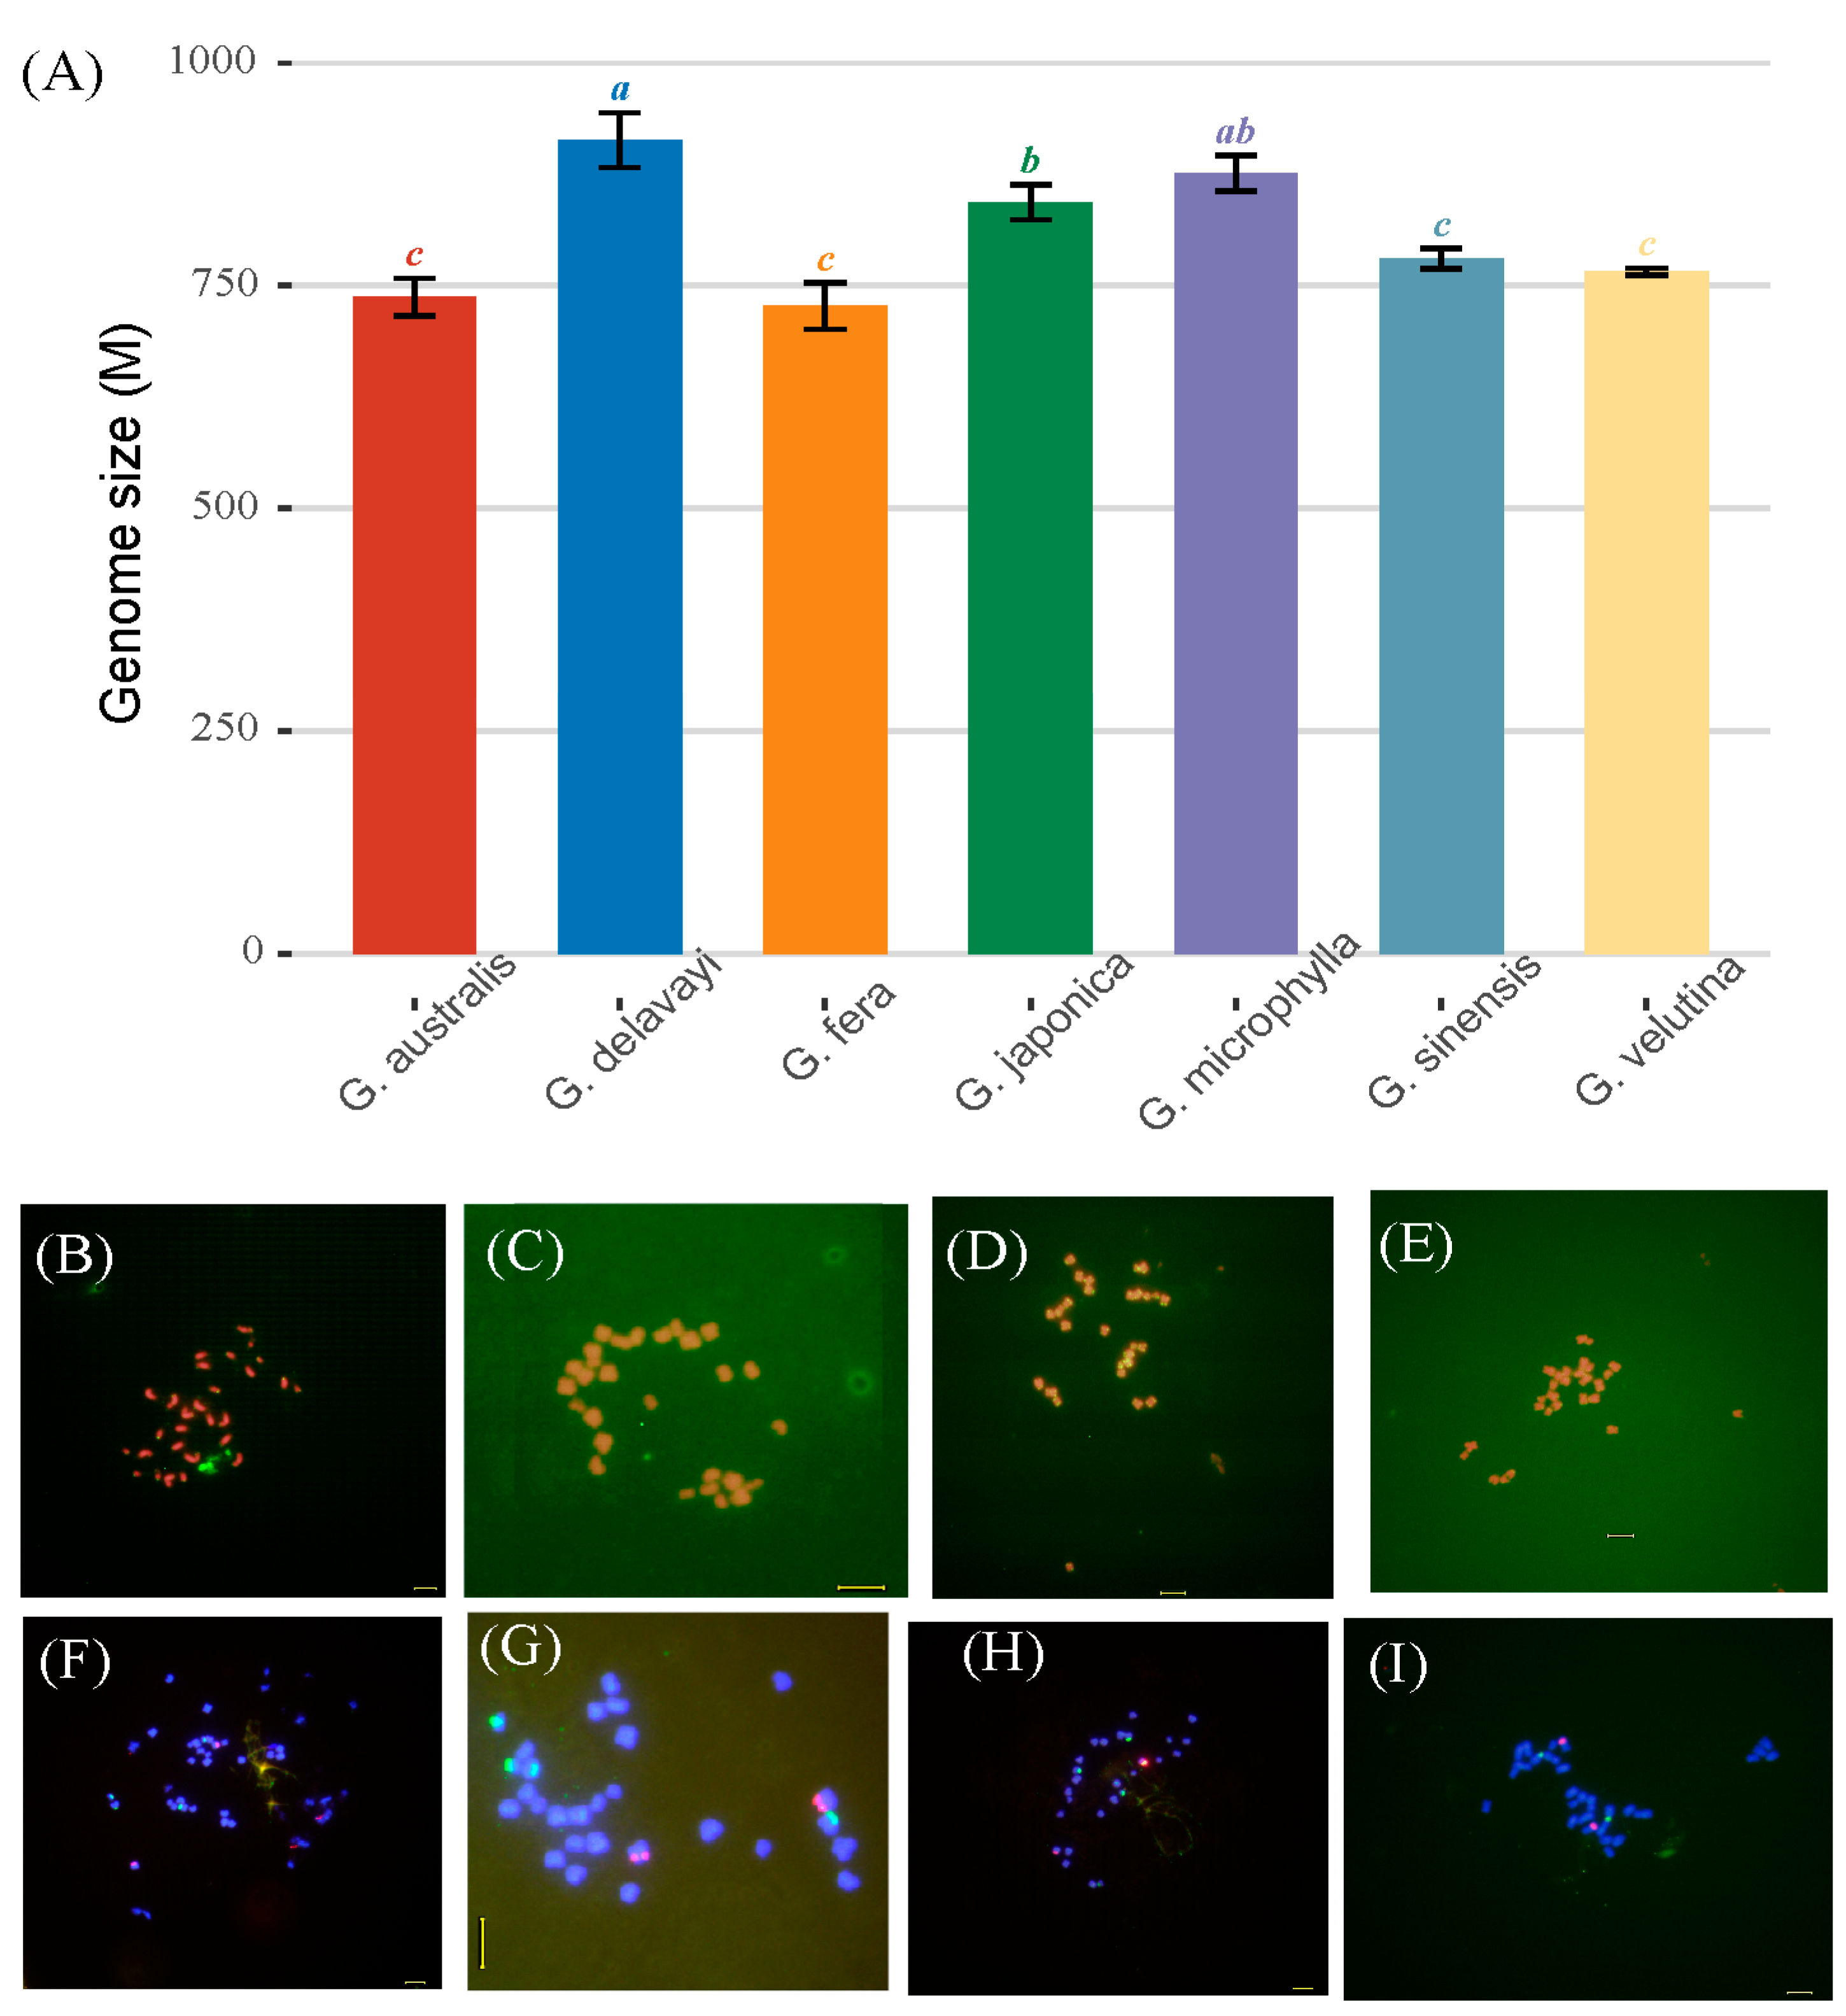
Figure 1. Genome size and chromosomal ploidy analysis of the various Gleditsia species. (A): A box plot showing the genome sizes within the Gleditsia genus; (B): fluorescence in situ hybridization (FISH) of the telomere of G. delavayi; (C): FISH of the telomere of G. japonica; (D): FISH of the telomere of G. sinensis; (E): FISH of the telomere of G. australis; (F): FISH of the G. delavayi rDNA; (G): FISH of the G. japonica rDNA; (H): FISH of the G. sinensis rDNA; (I): FISH of the G. delavayi rDNA. In (A), error bars indicated the standard error. The least significant difference (LSD) was used to compare the means at the 0.05 probability level, different lowercase letters indicate significant differences at p < 0.05. In (BE), the original telomeric repeats of in situ hybridization were green; in (FI), the results of FISH in the rDNA were red, and the results of FISH in the 18S rDNA were green. The scale bars were at 5 um.
Forests 14 01464 g001
Figure 2. The morphological indicators for the Gleditsia seedlings. (A): Plant height; (B): ground diameter; (C): root length; (D): fresh weight; (E): number of impellers; (F): number of leaflets on the longest compound leaf; (G): longest branch; (H): leaf length; (I): leaf width; (J): SPAD. Note: In (AJ), error bars indicate the standard error, different lowercase letters indicate significant differences at p < 0.05. G.au: G. australis; G.de: G. delavayi; G.fe: G. fera; G.ja: G. japonica; G.mi: G. microphylla; G.si: G. sinensis. The number of seedlings measured for each species was n = 30.
Forests 14 01464 g002
Figure 3. The photosynthetic and physiological characteristics for the Gleditsia seedlings. (A): Chlorophyll a; (B): chlorophyll b; (C): Chl(a+b); (D): chla/b; (E): carotenoids; (F): Ft; (G): Fv/Fm; (H): QY; (I): Rfd; (J): NPQ; (K): qN; (L): transpiration rate; (M): net photosynthetic rate; (N): intercellular CO2 concentration; (O): root MDA; (P): leaf MDA; (Q): root soluble protein; (R): leaf soluble protein; (S): root soluble sugar; (T): leaf soluble sugar. Note: Error bars indicate the standard error, different lowercase letters indicate significant differences at p < 0.05. G.au: G. australis; G.de: G. delavayi; G.fe: G. fera; G.ja: G. japonica; G.mi: G. microphylla; G.si: G. sinensis. The number of measured samples of each species was n = 3.
Forests 14 01464 g003
Figure 4. Differences in the hormone contents of seedlings. (A): IAA content; (B): IBA content; (C): IPA content; (D): NAA content; (E): tZR content; (F): iP content; (G): DZ content; (H): Z content; (I): SA content; (J): MeSA content; (K): JA content; (L): ABA content; (M): ACC content; (N): GA3 content; (O): PP333 content. Note: Error bars indicate the standard error, different lowercase letters indicate significant differences at p < 0.05. G.au: G. australis; G.de: G. delavayi; G.fe: G. fera; G.ja: G. japonica; G.mi: G. microphylla; G.si: G. sinensis. The number of measured samples of each species was n = 3.
Forests 14 01464 g004
Figure 5. Cluster analysis and PCA of the samples. (A): Cluster analysis of the seedling phenotypes using physiological indexes; (B): cluster analysis of the seedling hormones; (C): PCA of the seedling phenotype using physiological indicators; (D): PCA analysis of the seedling hormones. Note: In (A,B), the clustering method used was hclust. In (C,D), the top-20 list of contributors is shown. G.au: G. australis; G.de: G. delavayi; G.fe: G. fera; G.ja: G. japonica; G.mi: G. microphylla; G.si: G. sinensis.
Forests 14 01464 g005
Figure 6. Weighted gene co-expression network analysis of the genes. (A): Correlated heatmap of the adjacency of the modules; (B): the eigengene expression of the orangered3 module; (C): the eigengene expression of the black module; (D): the eigengene expression of the purple module; (E): the eigengene expression of the darkgreen module; (F): a scatterplot of GS for Chla vs. MM in the orangered3 module; (G): a scatterplot of GS for GA3 vs. MM in the black module; (H): a scatterplot of GS for Height vs. MM in the purple module; (I): a scatterplot of GS for root length vs. MM in the purple module. Note: G.au: G. australis; G.de: G. delavayi; G.fe: G. fera; G.ja: G. japonica; G.mi: G. microphylla; G.si: G. sinensis. In (A), each row represents a module; the color and number of each cell represent the correlation coefficient between the modules and traits; the top number in the cell represents the correlation coefficient, while the bottom number represents the p-value, and the module name is shown on the y-axis. In (BE), the title of the subfigure is the color of the module, and the number in parentheses represents the number of genes within the module. In (FI), the red line represents the linear regression line, points with MM > 0.8 and GS > 0.25 are mapped to the colors of the corresponding modules.
Forests 14 01464 g006
Disclaimer/Publisher’s Note: The statements, opinions and data contained in all publications are solely those of the individual author(s) and contributor(s) and not of MDPI and/or the editor(s). MDPI and/or the editor(s) disclaim responsibility for any injury to people or property resulting from any ideas, methods, instructions or products referred to in the content.