Article

Forest Phenology under Differing Topographic Conditions: A Case Study of Changbai Mountain in Northeast China

1
School of Geography and Environment, Liaocheng University, Liaocheng 252059, China
2
Key Laboratory of Ecosystem Network Observation and Modeling, Institute of Geographic Sciences and Natural Resources Research, Chinese Academy of Sciences, Beijing 100101, China
3
Liaocheng Center of Data and Application of National High Resolution Earth Observation System, Liaocheng 252000, China
4
Department of Forestry and Environmental Resources, North Carolina State University, Raleigh, NC 27613, USA
5
Northeast Institute of Geography and Agroecology, Chinese Academy of Sciences, Changchun 130102, China
*
Author to whom correspondence should be addressed.
Forests 2023, 14(7), 1466; https://doi.org/10.3390/f14071466
Submission received: 23 June 2023 / Revised: 11 July 2023 / Accepted: 15 July 2023 / Published: 17 July 2023
(This article belongs to the Section Forest Meteorology and Climate Change)

Abstract

:
Forest phenology is sensitive to climate change, and its responses affect many land surface processes, resulting in a feedback effect on climate change. Human activities have been the main driver of climate change’s long-term shifts in temperature and weather patterns. Forest phenology, understood as the timing of the annual cycles of plants, is extremely sensitive to changes in climate. Quantifying the responses of temperate forest phenology under an elevational range of topographic conditions that mimic climate change is essential for making effective adaptive forest ecosystem management decisions. Our study utilized the Google Earth Engine (GEE), gap filling, and the Savitzky–Golay (GF-SG) algorithm to develop a long-time series spatio-temporal remote sensing data fusion. The forest phenology characteristics on the north slope of Changbai Mountain were extracted and analyzed annually from 2013 to 2022. Our study found that the average start of the growing season (SOS) on the north slope of Changbai Mountain occurred between the 120th–150th day during the study period. The end of the growing season (EOS) occurred between the 270th–300th day, and the length of the growing season (LOS) ranged from the 110th–190th day. A transect from the northeast to southwest of the study area for a 10-year study period found that SOS was delayed by 39 d, the EOS advanced by 32 d, and the LOS was gradually shortened by 63 d. The forest phenology on the north slope of Changbai Mountain showed significant topographic differentiations. With an increase of 100 m in altitude, the mean SOS was delayed by 1.71 d (R2 = 0.93, p < 0.01). There were no obvious trends in EOS variation within the study area altitude gradient. LOS decreased by 1.23 d for each 100 m increase in elevation (R2 = 0.90, p < 0.01). Forests on steep slopes had an earlier SOS, a later EOS, and a longer LOS than forests on gentle slopes. For each degree increase in slope, SOS advanced by 0.12 d (R2 = 0.53, p = 0.04), EOS was delayed by 0.18 d (R2 = 0.82, p = 0.002), and the LOS increased by 0.28 d (R2 = 0.78, p = 0.004). The slope aspect had effects on the EOS and the LOS but had no effect on the SOS. The forest EOS of the south aspect was 3.15 d later than that of the north aspect, and the LOS was 6.47 d longer. Over the 10-year study period, the phenology differences between the north and south aspects showed that the LOS difference decreased by 0.85 d, the SOS difference decreased by 0.34 d, and the EOS difference decreased by 0.53 d per year. Our study illustrates the significance of the coupling mechanism between mountain topography and forest phenology, which will assist our future understanding of the response of mountain forest phenology to climate change, and provide a scientific basis for further research on temperate forest phenology.

1. Introduction

Forests are a valuable natural resource with important ecological functions and significant potential for terrestrial carbon (C) sequestration. The C storage potential of the world’s forest ecosystems represents one of the possible strategies for the adaptation and mitigation of global climate change impacts on terrestrial ecosystems [1]. Previous studies have shown that afforestation will increase C storage and affect climate change at the spatial scale of local regions. Afforestation is a key driver of the ‘Greening Earth’, accounting for over a third or more of the observed net increase in green leaf area [2]. Temperate forests, in particular, make significant contributions to global greening. The direct role of forest vegetation in climate change is further highlighted through afforestation practices in different countries [3]. Forest phenology is sensitive not only to climate change, but also controls the feedback of forests to the climate system by influencing the land surface physical processes of albedo, surface roughness, canopy conductance, and the fluxes of water, energy, and carbon dioxide (CO2) [4]. The intensification of the rate of climate change has increased the importance of the phenological characteristics of forest vegetation in terrestrial ecosystem C flux modeling. Although the traditional ground-based observation method of vegetation phenology has a long history, e.g., the observation record of Prunus (cherry) tree phenology in Japan in the 9th century [5], in recent years the rapid progress in remote sensing technologies has dramatically improved our understanding of vegetation phenology at the local to the global spatial scales [6,7,8]. The time series applications of remote sensing indices related to vegetation greenness (Normalized Difference Vegetation Index (NDVI) and Enhanced Vegetation Index (EVI) using Landsat) have been widely used to extract the start and end dates of the growing season. Many studies have shown that, due to global warming, spring phenology advances, autumn phenology delays, and the growing season of vegetation is lengthening. This is especially apparent in the middle and high latitudes of the northern hemisphere [9,10,11,12]. Forest phenology is mainly affected by temperature and precipitation caused by environmental conditions. In addition to climate and environmental factors, biological rhythms also influence the trend of phenology. For example, Huang et al. [13] found that trends at the peak of the growing season (POS) were driven by the SOS rather than the pre-POS climate at both the hemisphere and biome scales.
Current studies of forest phenology focus on the spatio-temporal pattern in different latitudes and their impacts of climate change. For example, Zheng et al. [14] studied the temporal and spatial changes in forest phenology in Northeast China and found that phenology distribution shows spatial heterogeneity. The rate of change for the SOS and the EOS were 3% and 2%, respectively. When the latitude increased by 1°, SOS increased at a rate of 0.29 d/a and the EOS was delayed by 0.47 d/a. Sarchil et al. [15] observed the gradual change trend of vegetation phenology from low latitude to high latitude in the Middle East. For each degree increase in latitude, SOS was delayed by 4.83 d and EOS was delayed by 6.54 d. Yang et al. [16] studied the radial growth characteristics of Pinus pumila (dwarf Siberian pine) along a latitude gradient of 44°–52° N in Northeast China and the relationship between growth and climate change. The results showed that there were significant differences in the growth trends of Siberian pine at different latitudes. The temperature of the previous winter and the current spring were the main factors inhibiting its growth. In the central and southern regions, Siberian pine growth was negatively correlated with the previous and current summer’s precipitation. Several studies have evaluated the impact of increased CO2 concentrations and the Southern Oscillation Atlantic Oscillation Index (NAOI) on forest phenology, but the research results were not significant [17,18]. These studies focused on the driving mechanism of phenology change from the perspective of climate factors and at large spatial scales.
The effects of global warming at elevation are likely to result in high-elevation regions experiencing faster warming than low-elevation regions [19]. Elevational gradients are a factor affecting the spatial pattern of vegetation phenology in mountainous areas [20,21]. Studies have shown that with the warming of the climate, the spring phenology of vegetation at different altitudes in Europe tends to be consistent [19,22,23]. This research focused on spring phenology changes caused by elevation gradient against the background of climate change. However, the effects of topographic factors, such as slope and aspect, on forest phenology are not well understood. Understanding the spatio-temporal pattern of temperate forest phenology in mountainous regions is an important factor for understanding the response characteristics of mountain forest ecosystems to climate change. Understanding the impacts of forest phenology on different elevation gradients and topographic conditions will quantify their roles in ecosystem functions and services.
Most studies on the vegetation phenology in China have focused on Northeast China [14,24,25,26,27,28], and there has been a lack of systematic studies on the forest phenology on the elevational gradient of Changbai Mountain. Our study explores the vertical zonal characteristics and topographic differentiation of temperate forest phenology against the background of global warming. The forest ecosystems on the north slope of Changbai Mountain were selected as the study area. Landsat data with a spatial resolution of 30 m and the MODIS (Moderate Resolution Imaging Spectroradiometer) data with 250 m were integrated to analyze the spatio-temporal variation characteristics of forest phenology in a 10-year period from 2013 to 2022 under different altitude and terrain conditions. The objectives of our study are to understand the control mechanism of topographic factors (elevation, slope, and aspect) on forest phenology, and to quantify the vertical zonal characteristics and topographic differentiation of forest phenology under the range of elevational and positional climatic changes. Our study will illustrate the phenological response mechanisms of northern forest ecology within the context of global warming.

2. Data and Methods

2.1. Study Area

Located in Northeast China, Jilin Changbai Mountain National Forest Park is a nature reserve with the richest forest biodiversity at the same latitude. The forest elevation gradient on the north slope of Changbai Mountain ranges from less than 500 m to more than 2500 m. The elevational vegetation gradient consists of deciduous broadleaved forests, mixed forests of Korean pine, subalpine coniferous forests, subalpine birch shrub forests, and alpine tundra [29]. The distribution of the vegetation communities of Changbai Mountain has a delineated vertical zonality [30].
The vegetation on the north slope of the Changbai Mountain Nature Reserve (42°0′30″–42°35′13″ N, 127°48′8″–128°41′34″ E) is located in the east of Jilin Province, Northeast China (Figure 1). This region belongs to the north temperate continental mountain climate zone and is influenced by seasonal monsoon prevailing winds from the southwest between May and September that bring rain (the wet monsoon), or from the northeast between October and April (the dry monsoon). Spring weather is dry and windy, the summer weather is of short duration and rainy, autumn weather is cool and foggy, and the winter weather is long and cold. The forest types in this area are diverse, with the distribution of the original dominant species of the mixed forests of Korean pine (Pinus koraiensis Siebold & Zucc.), Poplar (Populus L.), and Birch (Betula L.) secondary forest, and plantation forests of Mongolian oak (Quercus mongolica Fisch. ex Ledeb.), Amur linden (Tilia amurensis Rupr.), Maple (Acer L.), and Scots pine (Pinus sylvestris L.). This forest is one of the most completely preserved forest areas with a high canopy density in China [24].

2.2. Field Survey

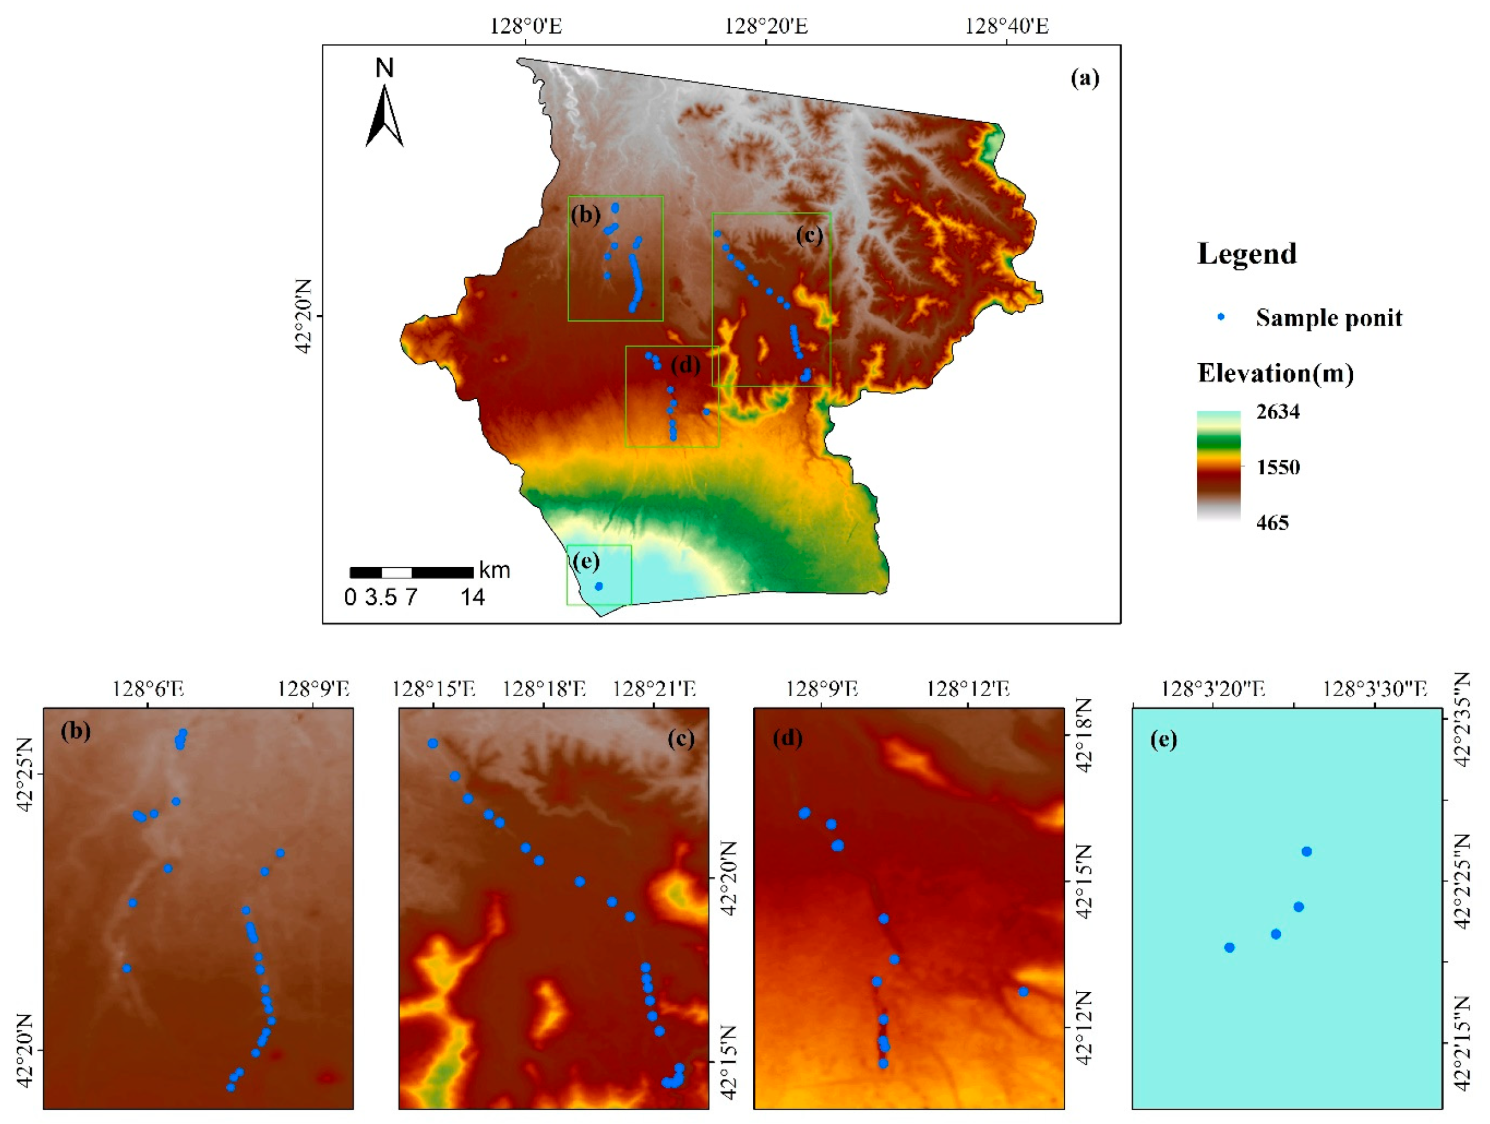
In July 2022, a field survey was conducted on forest types across an elevational gradient. The forest types in this region included the broadleaved forest, the coniferous forest, and the mixed broadleaved forest. A total of 78 15 m × 15 m plots were surveyed along the elevation gradient of the study area (Figure 2). The coordinates of the central position of each plot were recorded using the Trimble Juno SB global positioning system (Trimble Navigation, Sunnyvale, California) and the WGS-84 coordinate system. Tree species were identified in each of the 78 plots located across the three forest types.

2.3. Remote Sensing Data and DEM Data Processing

The remote sensing data used in this study were obtained from the Google Earth Engine (GEE) cloud platform with Python, a multi-petabyte catalog of satellite imagery and geospatial datasets with planetary-scale analysis capabilities, which was provided by Google Cloud Infrastructure (website: https://earthengine.google.com/, accessed on 21 May 2022). The platform is a cloud computing platform for global scale online processing, analysis, and visualization of earth science data sets, including remote sensing image data. The GEE analyzes data relevant to a variety of environmental and social problems, such as climate change, vegetation degradation, food security, and water shortage [31]. Landsat 8 surface reflectance data with 30 m resolution from 2013 to 2022 was selected for the GEE big data processing platform. The platform conducted radiometric correction and atmospheric corrections on the Landsat data. We selected spectral bands from the Moderate Resolution Imaging Spectroradiometer (MODIS) MOD09Q1 surface reflectance data with a 250 m spatial resolution and 8-day temporal resolution. The data were corrected for atmospheric conditions, e.g., gas, aerosol, and Rayleigh scattering. The Advanced Spaceborne Thermal Emission and Reflection Radiometer (ASTER) Digital Elevation Model (DEM) data were downloaded in the geospatial data cloud (Website: http://www.gscloud.cn/search, accessed on 13 June 2022), with a spatial 30 m resolution.
The combining of topographic factors in the surface analysis of DEM data was conducted to calculate the slope and aspect of Changbai Mountain and to extract elevation gradient study sites for subsequent analysis (Figure 2). The slope was expressed as the steepness of the terrain surface [32]. The target pixel slope values were calculated by the horizontal and vertical increments of the 8 adjacent pixels. Aspect refers to the orientation of the ground within a certain range, such as a target pixel. When describing the characteristics of the aspect, the value of the true north angle was 0°. Calculated clockwise, the value of slope direction angles was expressed between 0° and 360° (true north). Flat areas with no slope were assigned −1°. The calculation formula was as follows:
S l o p e = tan S l o p e w e 2 + S l o p e s n 2 ,
A s p e c t = S l o p e s n / S l o p e w e ,
where S l o p e is the inclination of a mountain, A s p e c t is the orientation of a mountain, S l o p e w e is the slope in the X direction, and S l o p e s n is the slope in the Y direction.
In our study, the aspects were divided into 8 categories according to the azimuth angle: the north slope (337.5° to 360° and 0° to 22.5°), the northeast slope (22.5° to 67.5°), the eastern slope (67.5° to 112.5°), the southeast slope (112.5° to 157.5°), the southern slope (157.5° to 202.5°), the southwest slope (202.5° to 247.5°), the western slope (247.5° to 292.5°), and the northwest slope (292.5° to 337.5°) (Figure 3).
Meteorological data were obtained from the National Oceanic and Atmospheric Administration (NOAA). Daily temperature and precipitation data for 2013–2022 from the Yanji Climate Station were selected to calculate seasonal and interannual scale data for use in the analysis of the factors influencing the phenological parameters. The abbreviations for each climate factor are shown in Table 1.

2.4. Data Fusion, Phenology Extraction, and Analysis Methods

2.4.1. Data Fusion Method

Landsat images have a relatively high spatial resolution, but the revisit period is 16 d. Images are often obstructed by clouds, making it difficult to monitor the dynamic changes in vegetation characteristics, thus requiring additional images to obtain continuous and high-quality images in the same area [33,34,35]. MODIS data has high temporal resolution, but a relatively coarse spatial resolution. This limits the application of MODIS data in forest dynamic monitoring [36]. Sentinel 2-A in 2015 and Sentinel 2-B in 2017 have provided optical imagery at high spatial resolution (10 m to 60 m) over land and coastal waters, but obtaining Normalized Difference Vegetation Index (NDVI) long-time series data calculated by Landsat with high spatial and temporal resolution directly from remote sensing images has inherent uncertainty [37]. To reduce uncertainty, we took advantage of Landsat and MODIS data products for fusion utilizing the Savitzky–Golay filtering (GF-SG) model algorithm to better analyze forest phenology characteristics. The algorithm is based on the GEE cloud platform to input data and process remote sensing images. Firstly, clouds were removed from images and their NDVI was calculated. The coarse resolution NDVI images were interpolated and resampled to match the fine-resolution pixels. Secondly, similar pixels were combined into a time series by weighted values, errors were corrected, and the missing values were filled in the time series. Finally, the SG filter was used to smooth the NDVI time series data to remove residual cloud pollution and noise, resulting in high-quality spatial-temporal fusion NDVI time series data [38].

2.4.2. Methods for Extracting Phenology Information

We need to analyze time series remote sensing data and process time series data of different types of satellite sensors. We processed noisy time series data and extracted seasonal information from the data. To calculate annual forest phenology, 46 fusion images were selected throughout the year, and we obtained NDVI time series images of the forest growth period in the study area. A double logistic curve fitting method was adopted and the threshold value was set as 0.5 to conduct vegetation phenological information extraction within the study area.

2.4.3. Correlation Analysis and Trend Analysis Methods

Pearson correlation analysis was used to study the response of forest phenology to topographic factor change and to analyze the correlation between vegetation and topographic factor changes. The calculation formula of the correlation coefficient was as follows:
r = i = 1 n a i a ¯ b b ¯ i = 1 n a i a ¯ 2 i = 1 n b b ¯ 2 ,
where ai is the value of the year i phenology, a is the phenological parameter, b is the Altitude/Slope/Aspect, and a ¯ and b ¯ are the means of the n-year phenological and topographic factors, respectively.
Day of year (DOY) was used to represent the occurrence time of the phenological period for the actual number of days starting from 1st January of the current year in the time series of the phenological period. The unitary linear regression analysis method was used to analyze the inter-annual phenology Trend of DOY change in the study area. The calculation formula is as follows:
T r e n d = n × i = 1 n i × D O Y i i = 1 n i × i = 1 n D O Y i n × i = 1 n i 2 i = 1 n i 2 ,
where D O Y i is the DOY value for year i, if Trend > 0, it indicates that DOY has been increasing during the n-year period; Trend < 0, it indicates that DOY is a downward trend during the n-year period; Trend = 0, there is no significant change in DOY in n years.

3. Results

3.1. Temporal and Spatial Patterns of Forest Phenology in the Recent 10 Years

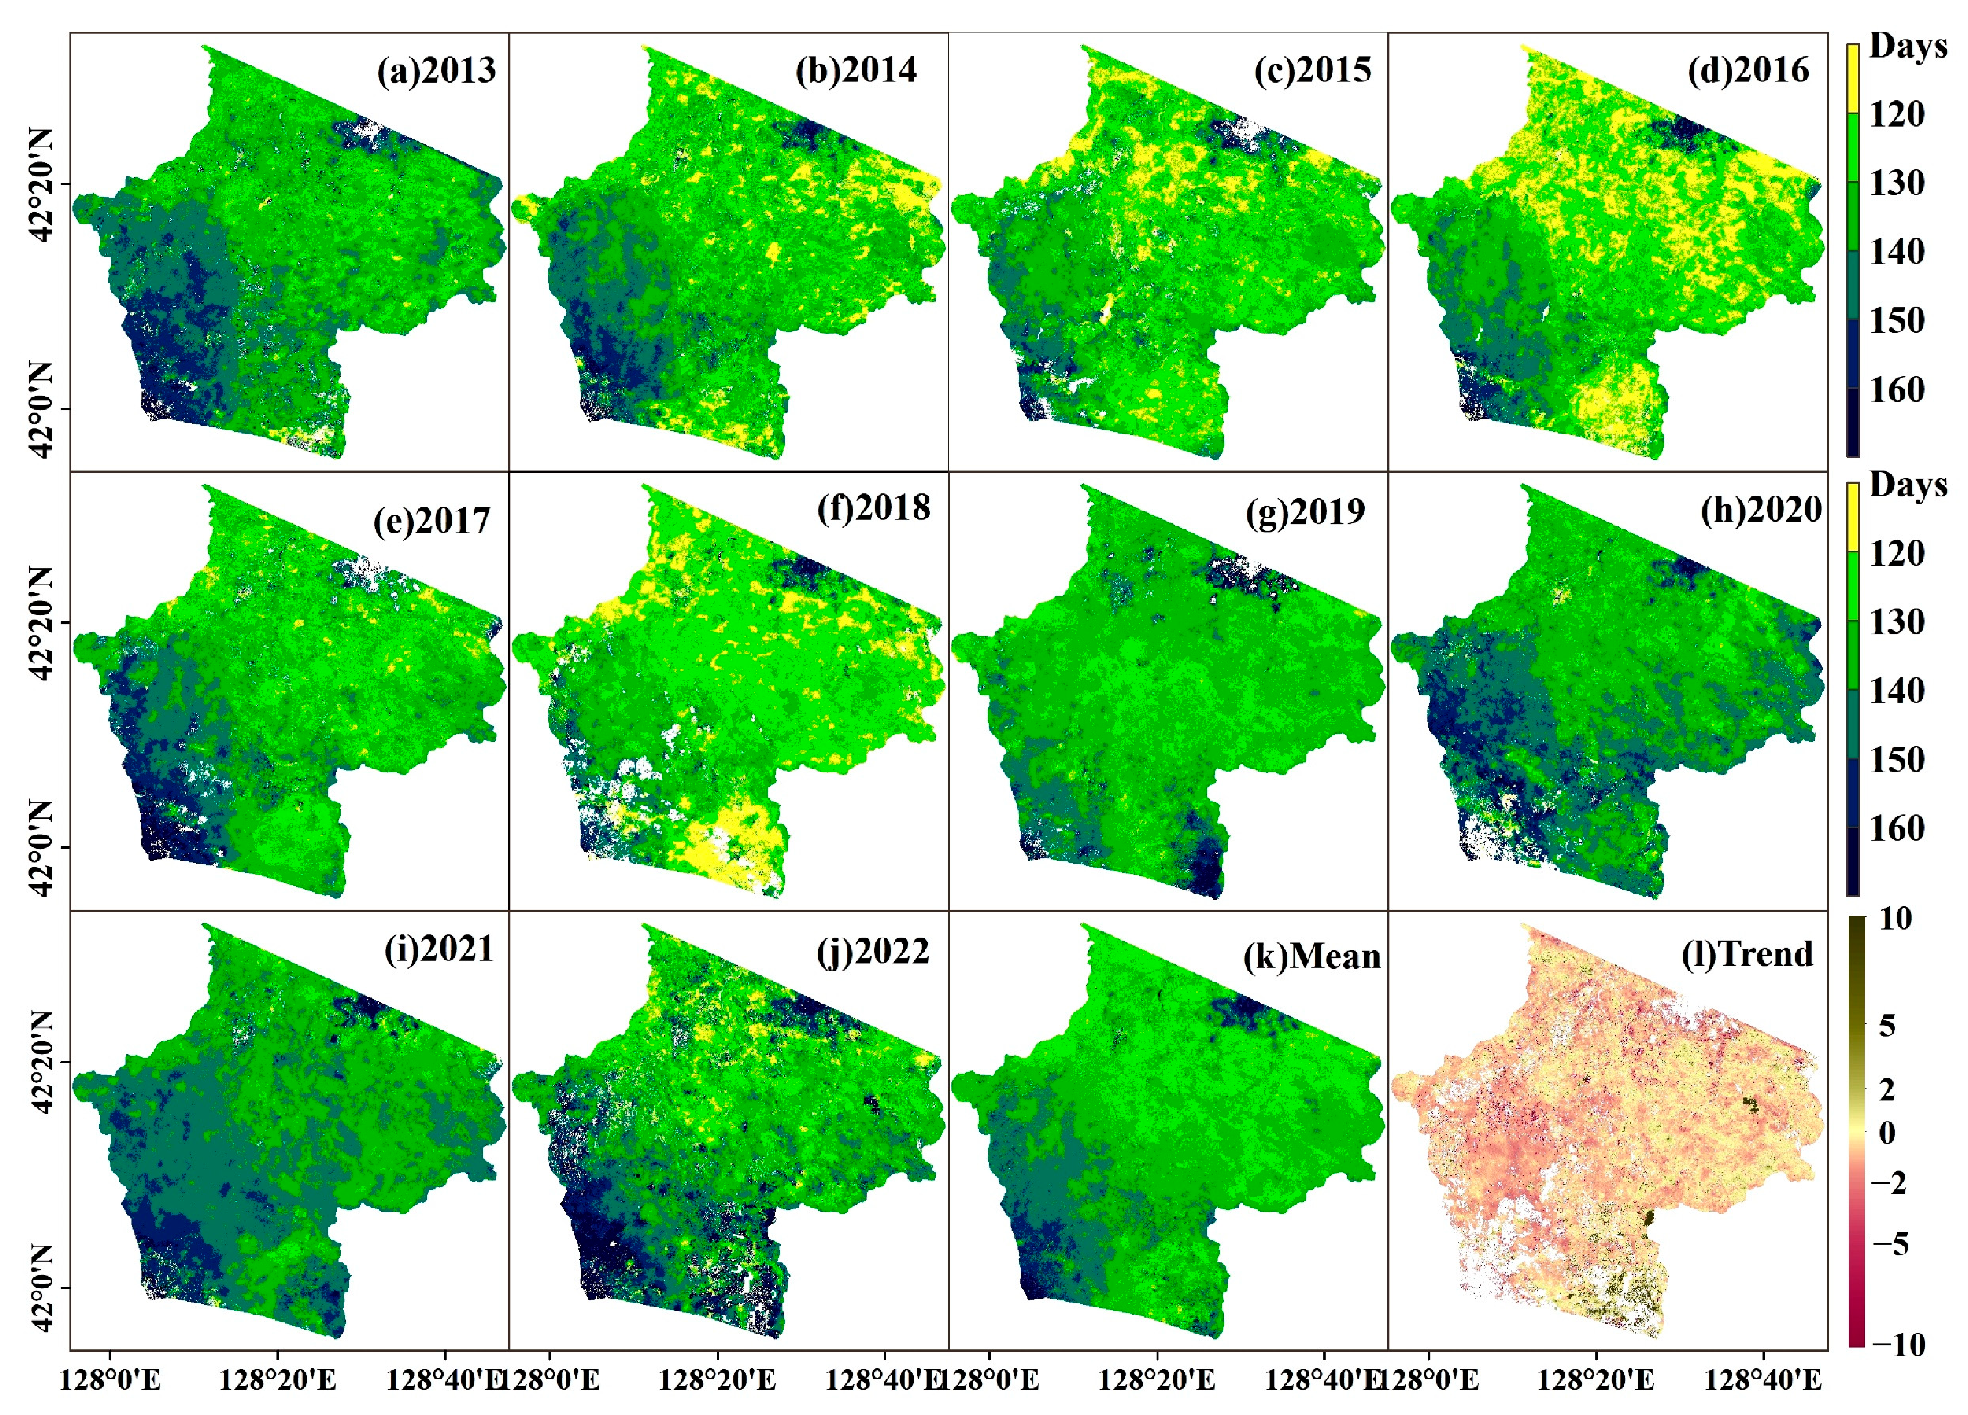
Based on the fusion data of 46 scenes of NDVI each year, the pattern maps of three phenology parameters (SOS, EOS, and LOS) of Changbai Mountain were extracted for each year. The mean values and trends of the three phenology parameters in the recent 10 years were calculated (Figure 4, Figure 5 and Figure 6).
SOS on the north slope of Changbai Mountain showed obvious spatial differentiation (Figure 4). The spatial differentiations between different years were similar. However, SOS showed the characteristics of the first advance and then a delay during those 10 years. The advance of SOS was significant in 2015, 2016, 2018, and 2019, and SOS was significantly delayed in 2017, 2021, and 2022. Figure 4k spatially illustrates that the SOS of forests in most areas was between 120–150 days in the last decade, indicating that forest growth occurs in May on the north slope of Changbai Mountain. The start of the growing season was gradually delayed from northeast to southwest, which is consistent with the elevation gradient distribution on the north slope of Changbai Mountain. The gradient was high in the southwest and low in the northeast aspects. Figure 4l shows that the SOS of the mixed forests of Korean pine in the central part of the study area was slightly advanced, the change of SOS in the coniferous forest and Yue birch forest in the high elevation area in the southwest was not significant, and the forest SOS of the southeast showed a trend of delay in the past 10 years. This may indicate the different responses of different forest types to climate characteristics in the last decade.
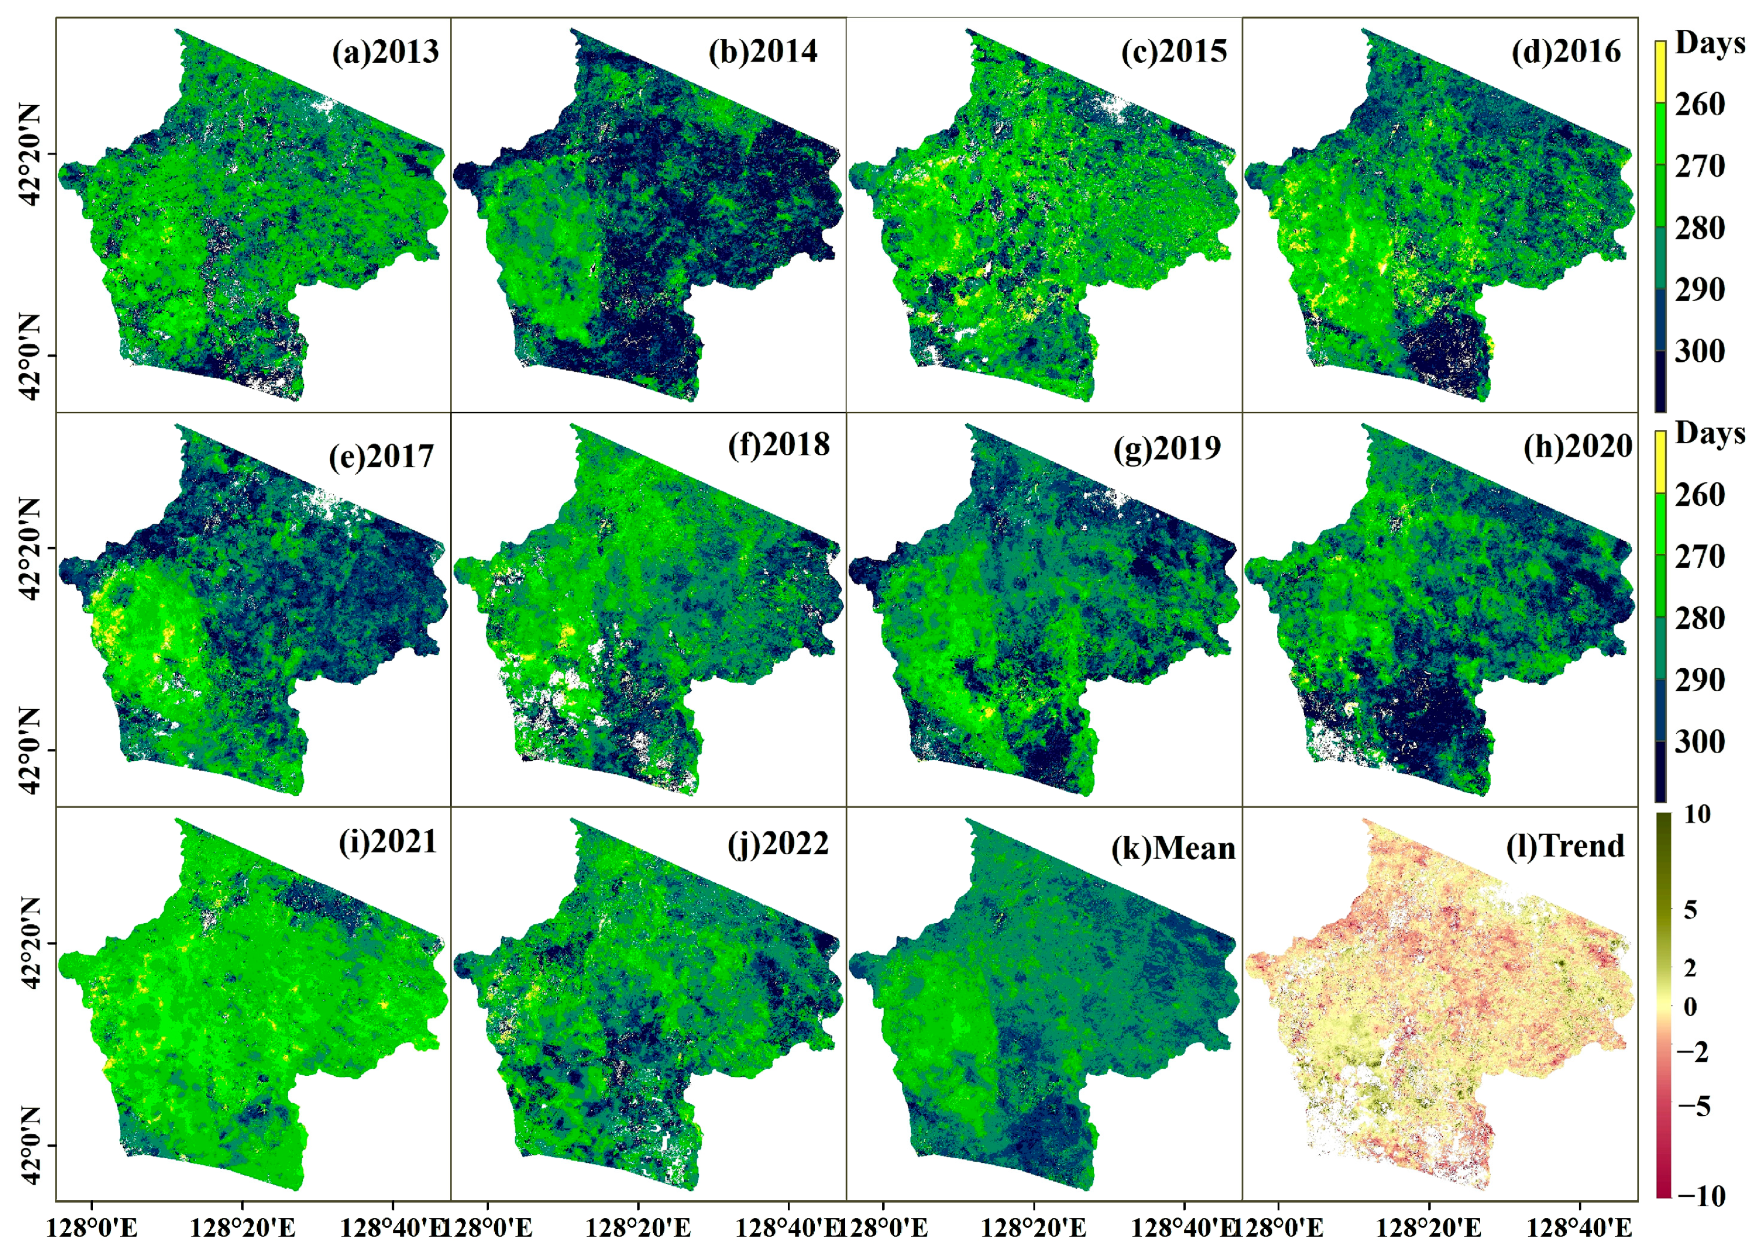
During the 10 years of the study, the spatial distribution of forest EOS on the north slope of Changbai Mountain showed no obvious trend, and the inter-annual changes were large. In most areas, the EOS occurred around the 270th–300th-day mark (Figure 5). The EOS of 2014, 2017, and 2020 were significantly delayed, while the EOS of 2016 and 2021 were significantly advanced. Among them, the EOS of 2014, 2017, and 2020 were significantly delayed, while the EOS of 2016 and 2021 were significantly advanced. As shown in Figure 5k, the average annual EOS gradually advanced from northeast to southwest, and the forest area that ended growing somewhere around the 270th–290th-day mark accounted for a large proportion. Figure 5l shows the rate of change in EOS over the last decade, with little change or a small advance trend in most regions. This may be a result of the general early EOS in 2021.
The spatial patterns of forest LOS on the north slope of Changbai Mountain during 2013–2022 are shown in Figure 6. The LOS showed a shortening trend from the northeast to the southwest of the study area, with LOS shortening from 190 days to 110 days. In 2014 and 2016, the climate was suitable for plant growth. The LOS in the study area was longer, while the LOS in most areas showed a trend of shortening in 2021. Figure 6k illustrates that the average multi-year LOS in most areas was 110–190 days. The area with an LOS of 130–170 days was relatively large. The area with an LOS of less than 130 days was located in the middle and high elevation areas in the southwest, while the area with an LOS of more than 170 days was located in the lower altitude area in the middle and east of the study area.

3.2. Forest Type Distribution Pattern and the Phenology Characteristics of Different Forest Types

Since the vegetation of Changbai Mountain has a vertical zonal distribution, we analyzed the distribution characteristics of forest vegetation types on the north slope of Changbai Mountain and investigated the phenology characteristics of different forest types. Based on the global 30-m fine land cover products in 2020 [39], we reclassified the forest in the study area into six types of ground objects: the deciduous broadleaved forest, the deciduous coniferous forest, the evergreen coniferous forest, the mixed leaf forest (broadleaved and needle-leaved), shrub vegetation, and non-vegetation (Figure 7). The results show that the overall accuracy was 82.5% and the Kappa coefficient was 0.784 under the verification system composed of 10 first-level classes. The overall accuracy was 68.7% and the Kappa coefficient was 0.662 under the verification system composed of 24 fine classes [39].
Our analysis shows that the forest types on the north slope of Changbai Mountain are diverse, and the forest has high canopy closure. The deciduous broadleaved forest area is the largest in the study area, reaching 2160.15 km2 and accounting for about 56.06%, followed by the deciduous coniferous forest (1299.66 km2, accounting for 33.73%), and the evergreen coniferous forest (179.44 km2, accounting for about 4.66%). The proportional areas of forest types are shown in Table 2.
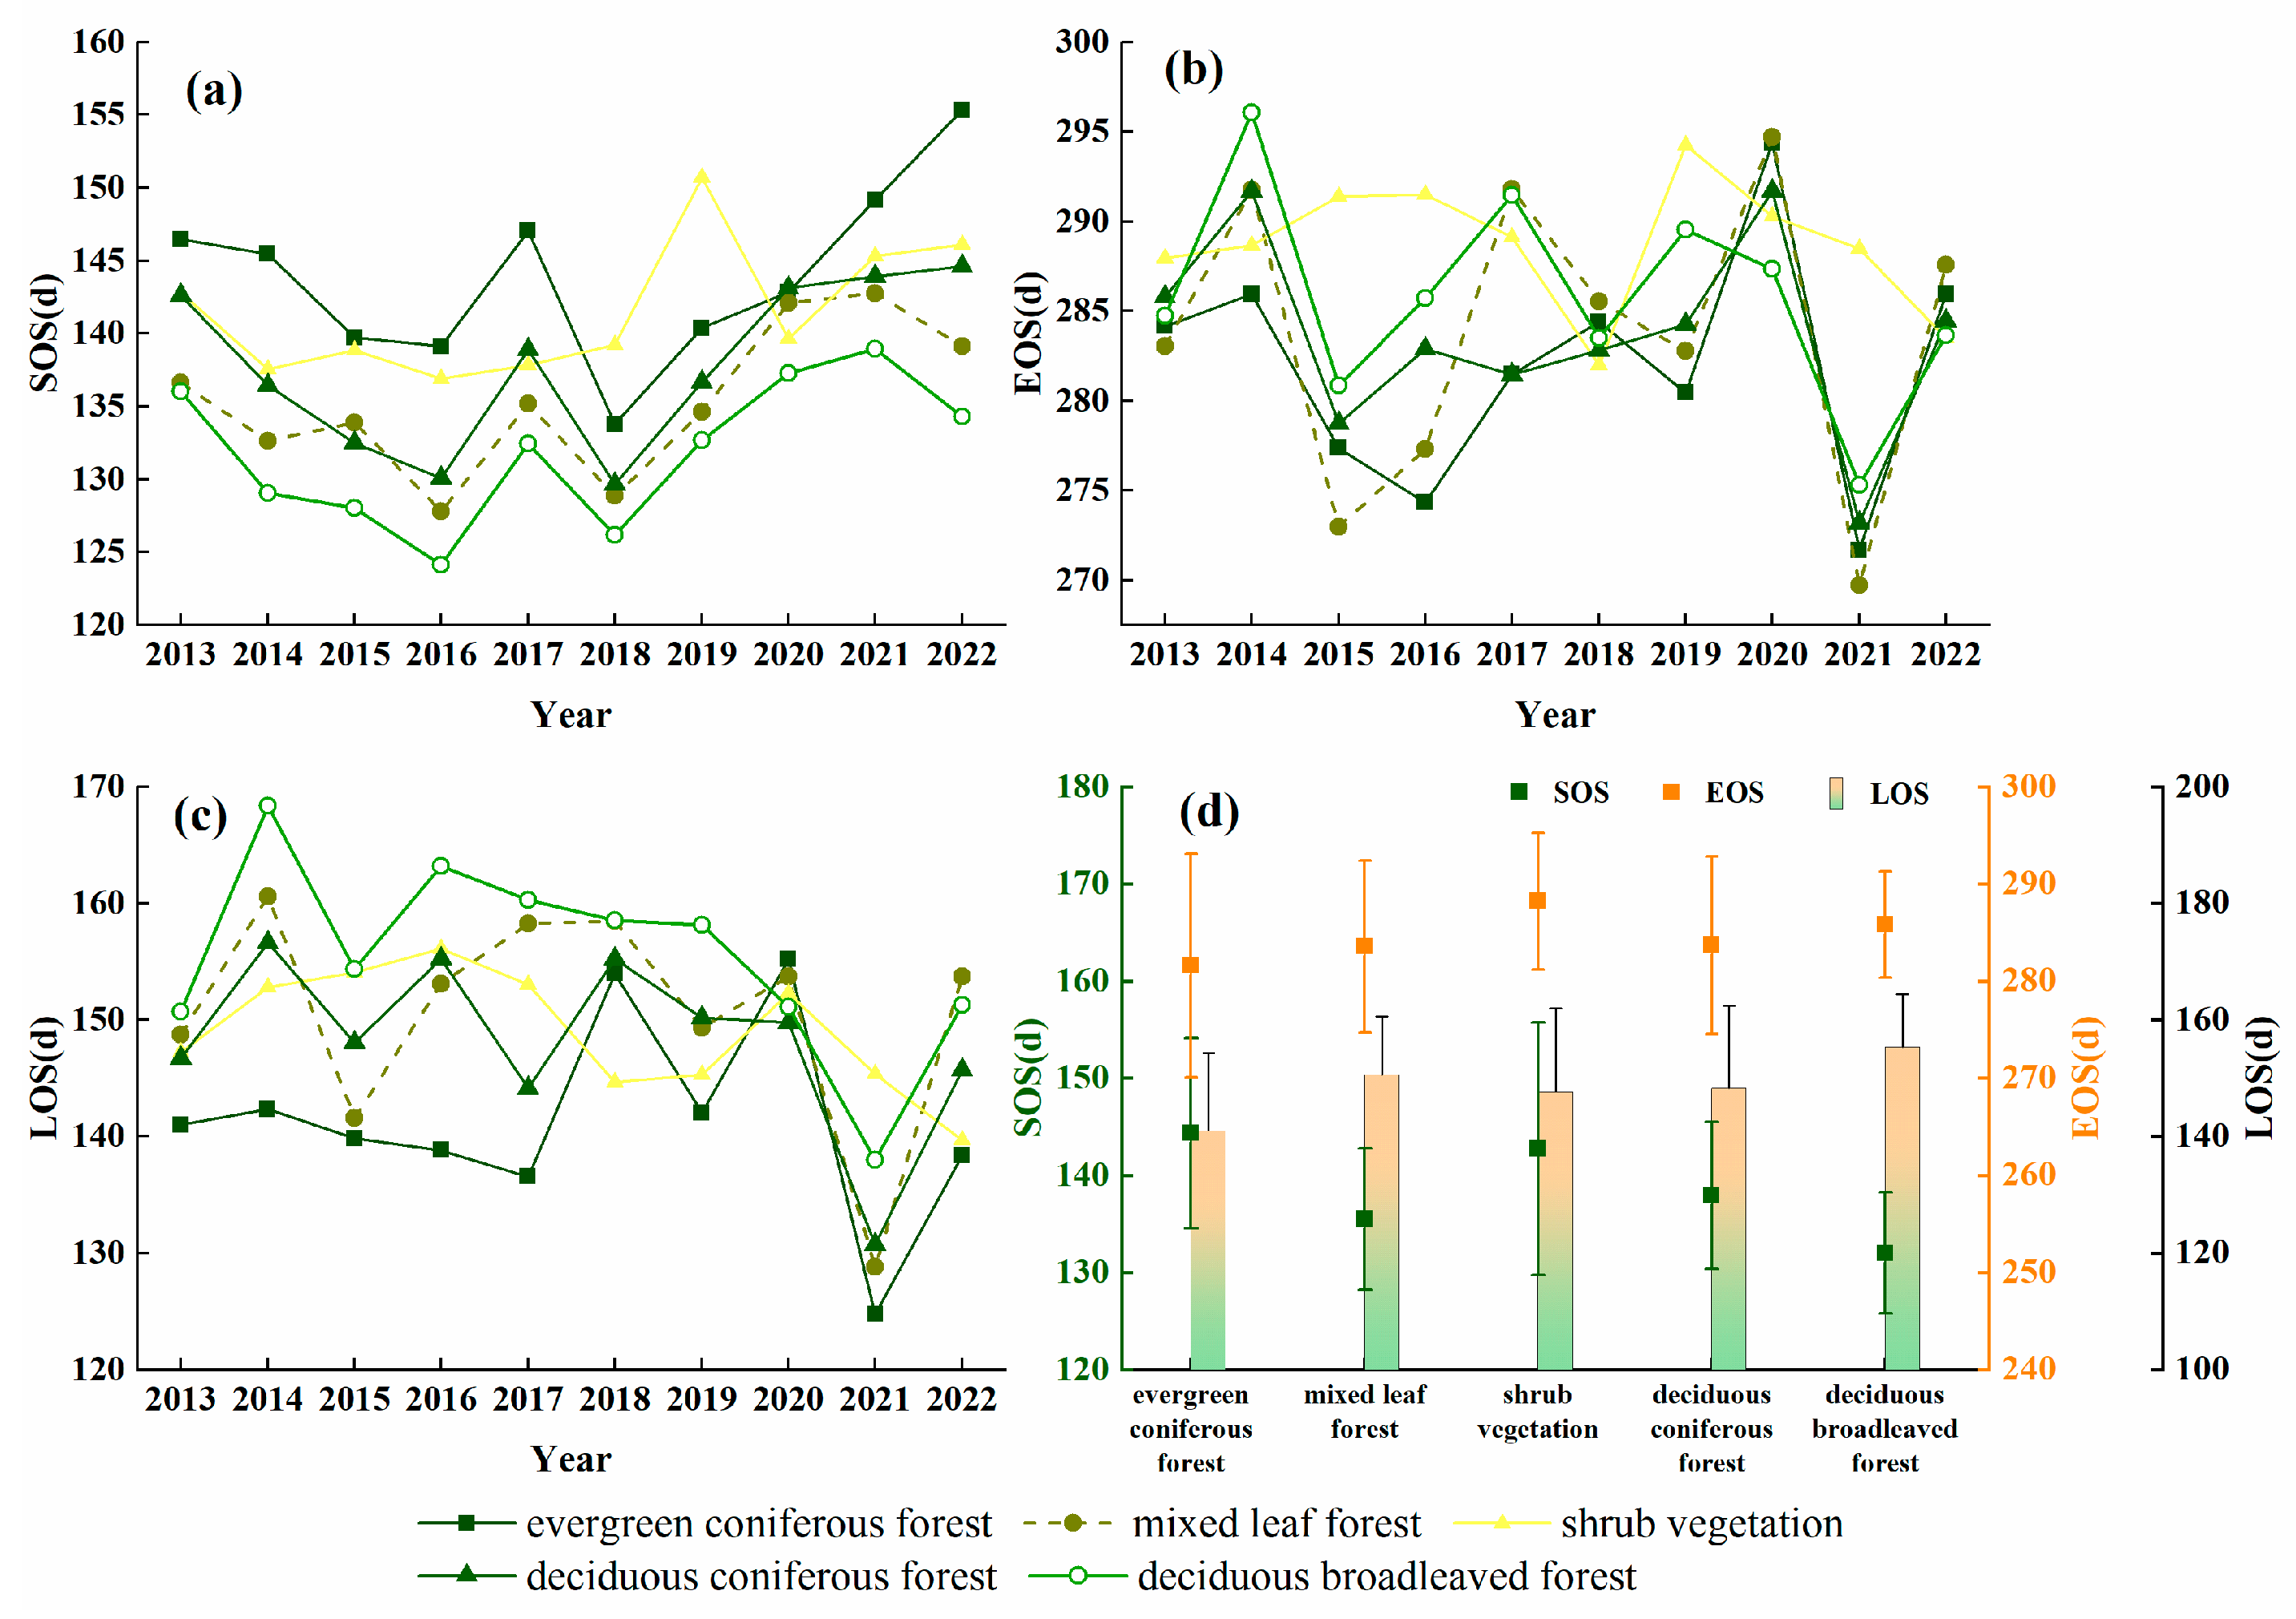
The phenological characteristics of the four main forest types and shrub vegetation on the north slope of Changbai Mountain showed different inter-annual fluctuations (Figure 8) during 2013–2022, but there was no obvious change.
Specifically, the year of the earliest SOS of the deciduous broadleaved forest was 2016, which occurred on the 124th day (Figure 8a). The latest SOS was 2021, 139 days, and there was a difference of 15 days. The SOS variation of the mixed broadleaved forest was similar to that of the deciduous broadleaved forest. The latest SOS also appeared in 2021 on the 143rd day, 15 days later than the earliest in 2016. The SOS of the evergreen coniferous forest and the deciduous coniferous forest was the latest in 2022, the 155th and 145th day, respectively, 21 days and 15 days later than the earliest year, respectively. The SOS of inter-annual variation of shrub vegetation was different from that of the other 4 forest types. In 2017, the SOS of the other 4 forest types was significantly delayed, but the inter-annual fluctuation range of shrub vegetation was much smaller. SOS of shrub vegetation in 2019 was postponed to the latest, 151st day.
With the exception of shrub vegetation, the minimum EOS values of the four forest types all appeared in 2021, between the 270th and 275th day, and the corresponding LOS values were also the shortest in 2021, between the 125th and138th day (Figure 8b). The EOS of shrub vegetation appeared as early as the 282nd day of 2018, and as late as the 294th day of 2019. The longest LOS of shrub vegetation was in 2016 (Figure 8c), with the 156th day, and the shortest LOS was in 2022, 16 days shorter than the longest year. The EOS of the deciduous broadleaved forest and the deciduous coniferous forest appeared the latest in 2014, on the 296th and 292nd day, 21 days and 19 days later than the earliest year, respectively. The EOS of the mixed broadleaved forest and the evergreen coniferous forest appeared the latest in 2020, and both were on the 294th day, 25 and 22 days later than the earliest year, respectively. The longest LOS of the deciduous broadleaved forest, the deciduous coniferous forest, and the mixed broadleaved forest occurred in 2014, on the 168th, 157th, and 161st day, respectively. The longest LOS of the evergreen coniferous forest occurred in 2020 and was 155 days.
The mean value of SOS of different forest types in the 10 years of the study ranged from the 130th to 145th day (Figure 8d). From earliest to latest, they were the deciduous broadleaved forest (132 ± 6.24 d), the mixed broadleaved forest (135.47 ± 7.27 d), the deciduous coniferous forest (137.94 ± 7.54 d), shrub vegetation (142.74 ± 12.98 d), and the evergreen coniferous forest (144.36 ± 9.8 d), respectively. This indicated that the deciduous broadleaved forest was the first to turn green while the evergreen coniferous forest was the last to turn green. The EOS time of each forest type was concentrated between the 280th to the 290th day. From the earliest to the latest, they were the evergreen coniferous forest (281.61 ± 11.51 d), the mixed broadleaved forest (283.54 ± 8.88 d), the deciduous coniferous forest (283.68 ± 9.11 d), the deciduous broadleaved forest (285.79 ± 5.48 d), and shrub vegetation (288.23 ± 7.05 d). The LOS from short to long was the evergreen coniferous forest (140.94 ± 13.39 d), shrub vegetation (147.67 ± 14.3 d), the deciduous coniferous forest (148.26 ± 14.22 d), the mixed broadleaved forest (150.6 ± 10.04 d), and the deciduous broadleaved forest (155.34 ± 9.12 d), respectively. In general, the growing season of the deciduous broadleaved forest in Changbai Mountain was 14.4 d longer than that of the evergreen coniferous forest, which is not only related to the biological characteristics of the species but may also be closely related to the elevation and terrain characteristics.

3.3. Topographic Differentiation of Forest Phenology

We analyzed the topographic differentiation of forest phenology in Changbai Mountain from the elevation, slope, and aspect, and combined the results with the forest phenology calculated in the 10 years of the study.

3.3.1. Differentiation of Forest Phenology with Altitude

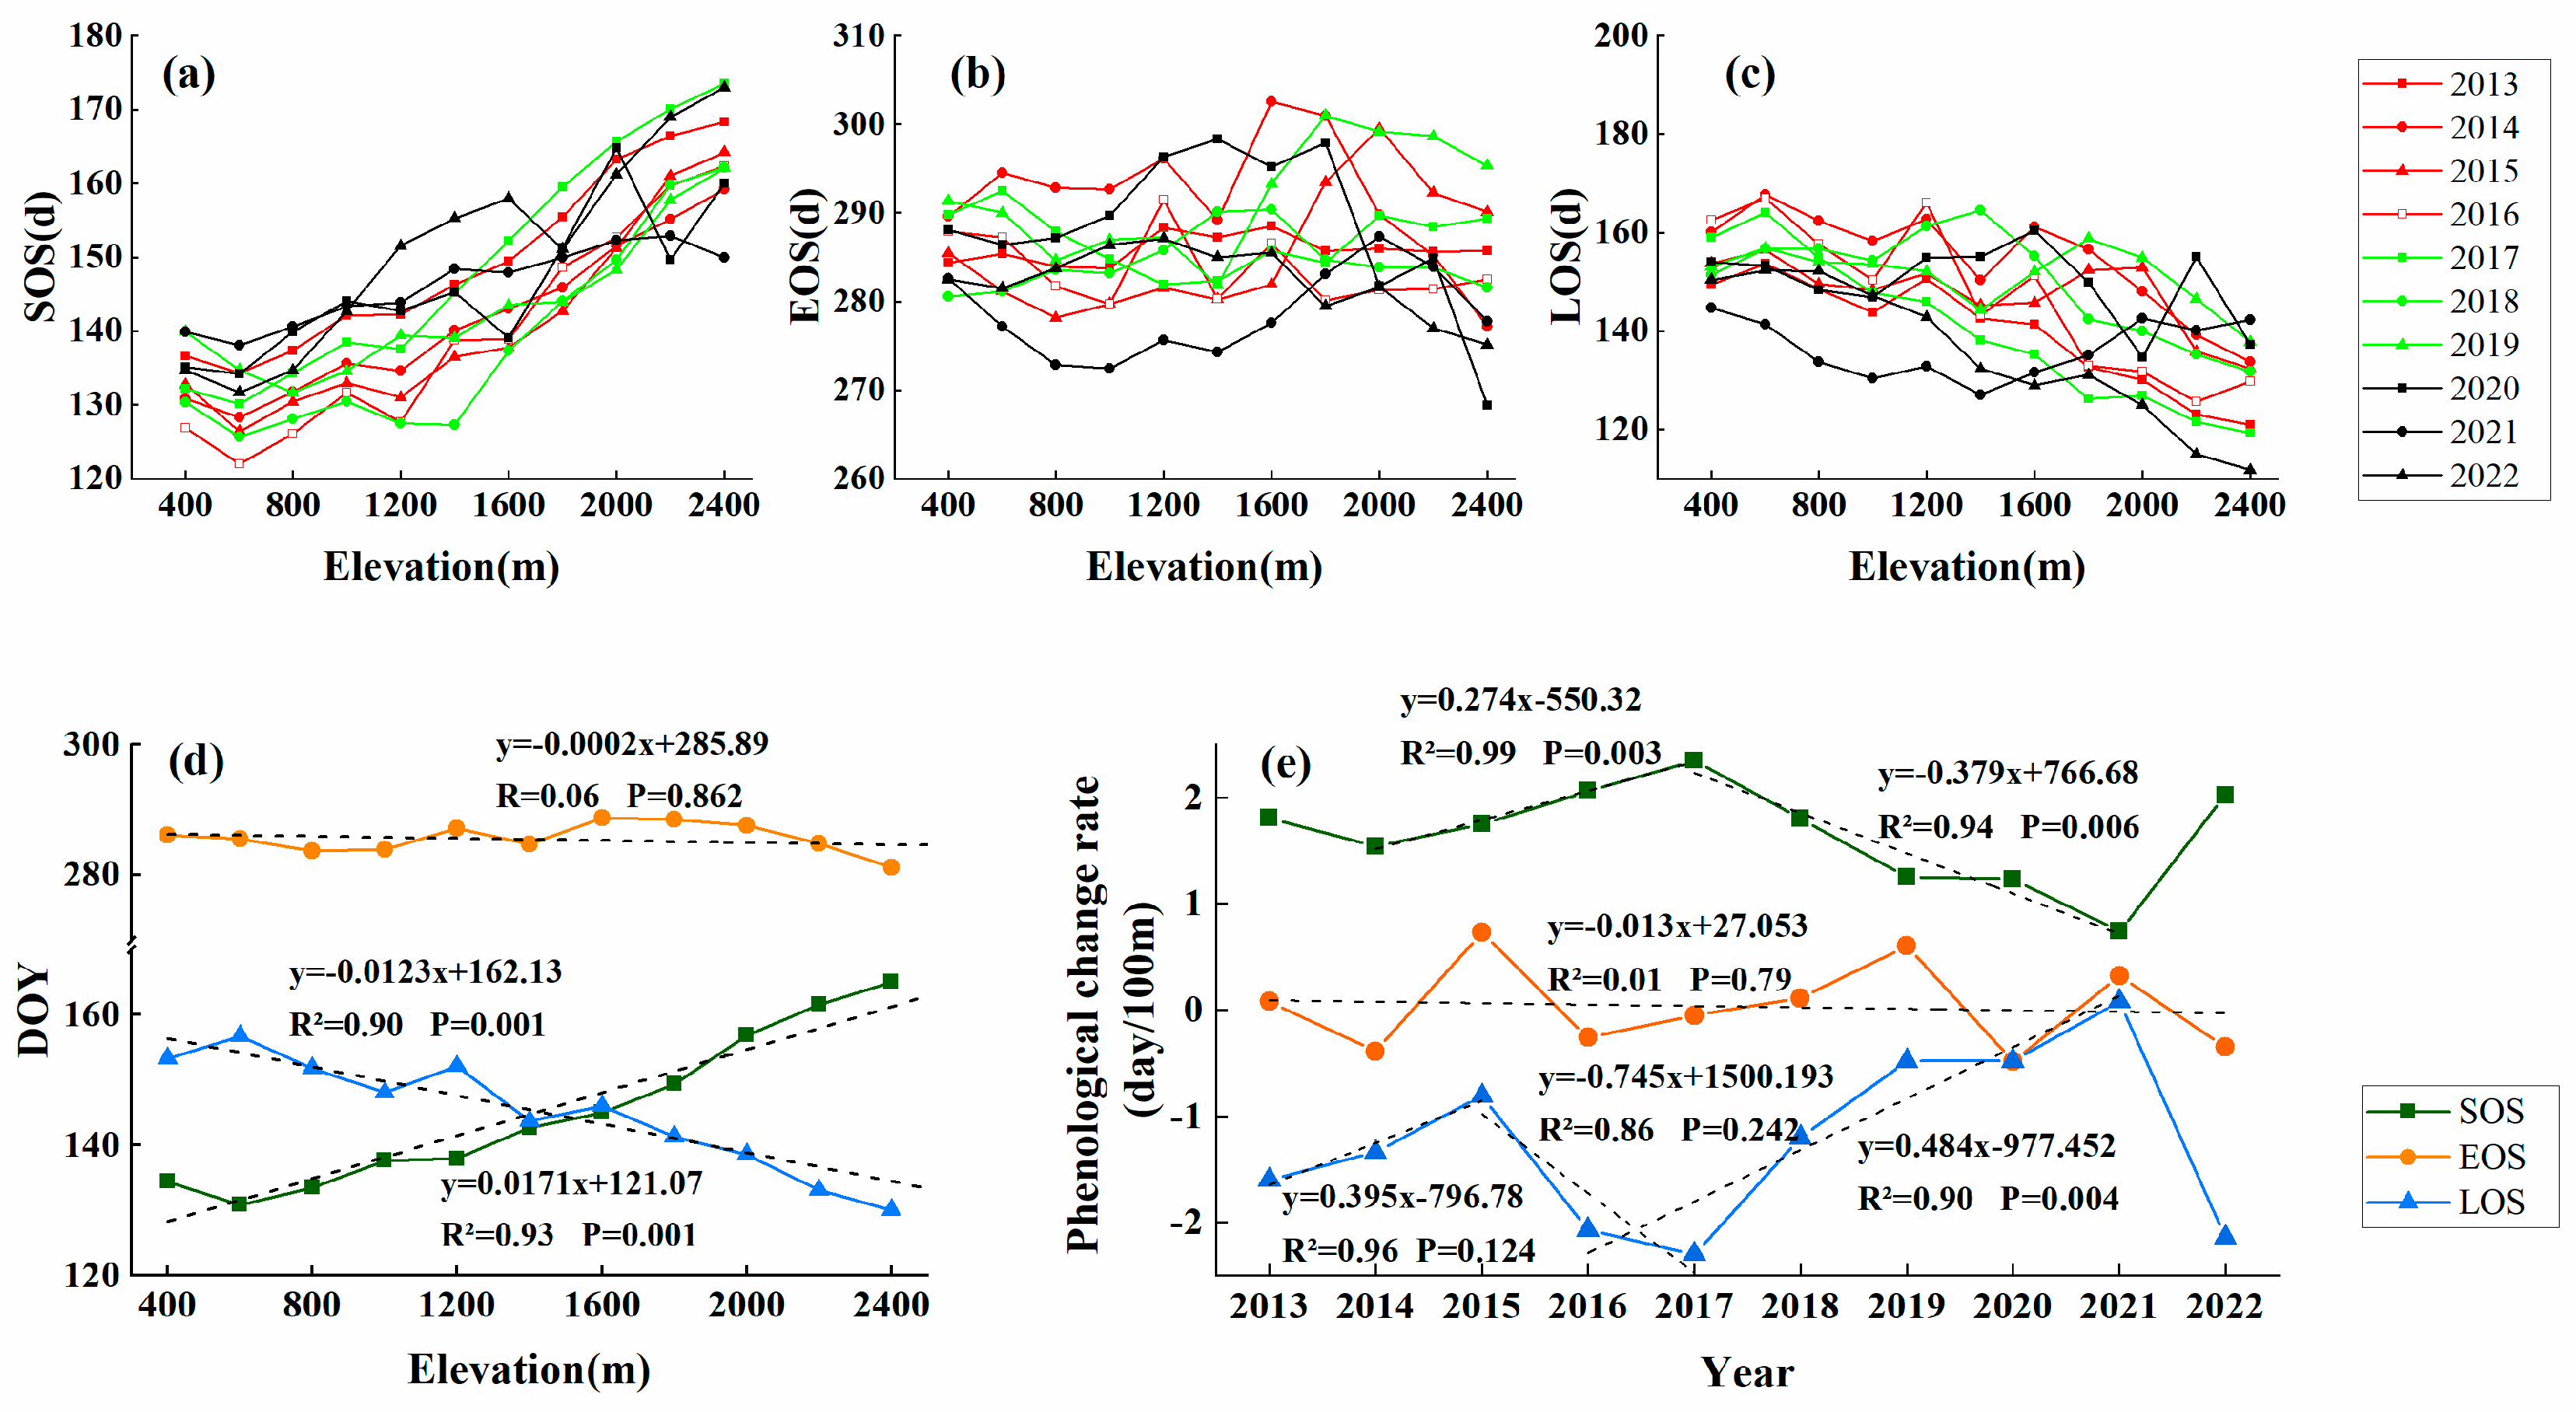
As shown in Figure 9, although the SOS varies from year to year in the decade, the trend of SOS changes with altitude was completely consistent each year. The SOS was delayed by the increase in the elevation. The growth season started on the 120th to 140th day at the low altitude area of around 600 m, while the vegetation began to grow on the 150th to 170th day at the high elevation area of around 2400 m. According to the fitting trend of SOS mean value with elevation in 10 years, SOS was delayed by 1.71d for every 100 m increase (R2 = 0.93, p < 0.01). The postponement rate of SOS with altitude showed an increasing trend from 2014 to 2017, and the postponement rate was 0.274 d/100 m per year (R2 = 0.99, p < 0.01), and the postponement rate decreased from 2017 to 2021, by 0.379 d/100 m per year (R2 = 0.94, p < 0.01). There was no obvious change in the tendency of EOS with altitude gradient (R2 = 0.06). During the 10 years of the study, there were also large differences in EOS of different years, especially in high altitude areas, where the annual changes of forest EOS were between the 260th–300th day, while in low altitude areas, the changes were relatively stable, concentrated in the 270th–300th day.
The LOS was determined by the changes in SOS and EOS. While the length of the growing season decreased with the increase in altitude, the LOS at high-altitude areas had a large inter-annual fluctuation range. The mean trend illustrates that the LOS decreases by 1.23 d (R2 = 0.90, p < 0.01) with a 100 m elevation increase (Figure 9d). In 2013–2015 and 2017–2021, the shortening rate of LOS was slower with the increase in altitude, and the rate of LOS shortening was accelerated in 2015–2017, and the rate of LOS shortening in 2017–2021 was 0.484(R2 = 0.90, p = 0.004), while the rate of LOS shortening in other years was not significantly correlated with time.

3.3.2. Change Characteristics of Forest Phenology with Slope Gradient

The terrain of the study area is relatively gentle on the whole, but the slope in the middle east and near the main peak in the south of the study area is larger. Therefore, the results of phenology characteristics in the study area were extracted every 3°, from 3° to 24° according to the slope map, and the trend of phenological changes along with the slope was analyzed. Forest phenology of different slopes in different years fluctuated, and the maximum difference in phenology in different years was 20 days (Figure 10). According to the change of the mean value of phenology with slope in the recent 10 years (Figure 10d), SOS showed a significant downward trend with the increase in slope. For every degree increase in slope, SOS advanced by 0.12 d (R2 = 0.53, p = 0.04). This suggested that the forests on steep slopes may develop leaf sprouts earlier than that on a gentle slope. With the increase in slope, EOS showed a significant upward trend. For every degree increase in slope, EOS was delayed by 0.18 d (R2 = 0.82, p = 0.002), indicating that the forest growing season ended later on steep slope areas. LOS in the growing season also tended to lengthen with the increase in slope (R2 = 0.78, p = 0.004), and the forest LOS increased by 0.28 d with the increase of 1 degree of slope. The phenology fluctuated with the slope to different degrees every year. The advance rate of SOS with the gradient was stable from 2015 to 2022, while the delay rate and elongation rate of EOS and LOS with the gradient increase gradually decreased after 2017, but the trend was not significant (p > 0.05).

3.3.3. Change Characteristics of Forest Phenology with Various Aspects

Aspect has an obvious control effect on EOS and LOS but has little influence on SOS. It was shown that the perennial SOS did not show significant differences in various aspects, while the perennial EOS and LOS showed certain slope direction differentiation Figure 11. The forest with the longest LOS was mainly located in the southwest, southeast, and due south directions, while the longest LOS was relatively short in the northeast, due north, and northwest directions. The mean LOS of the due south slope was 156.19 d, which was 6.47 d longer than that of the due north slope (149.72 d). This was caused by the difference in EOS on the northern and southern slopes at the end of the growing season. Compared with the north direction, the forest EOS of the south direction was delayed by 3.15 d. During the 10 years of the study, the phenology difference between the south and the north gradually decreased. The SOS difference decreased by 0.34 d (R2 = 0.41, p = 0.046), the EOS difference by 0.53 d (R2 = 0.57, p = 0.012), and the LOS difference by 0.85 d (R2 = 0.61, p = 0.007).

4. Discussion

4.1. The Response Characteristics of Temperate Forests to Climate Change

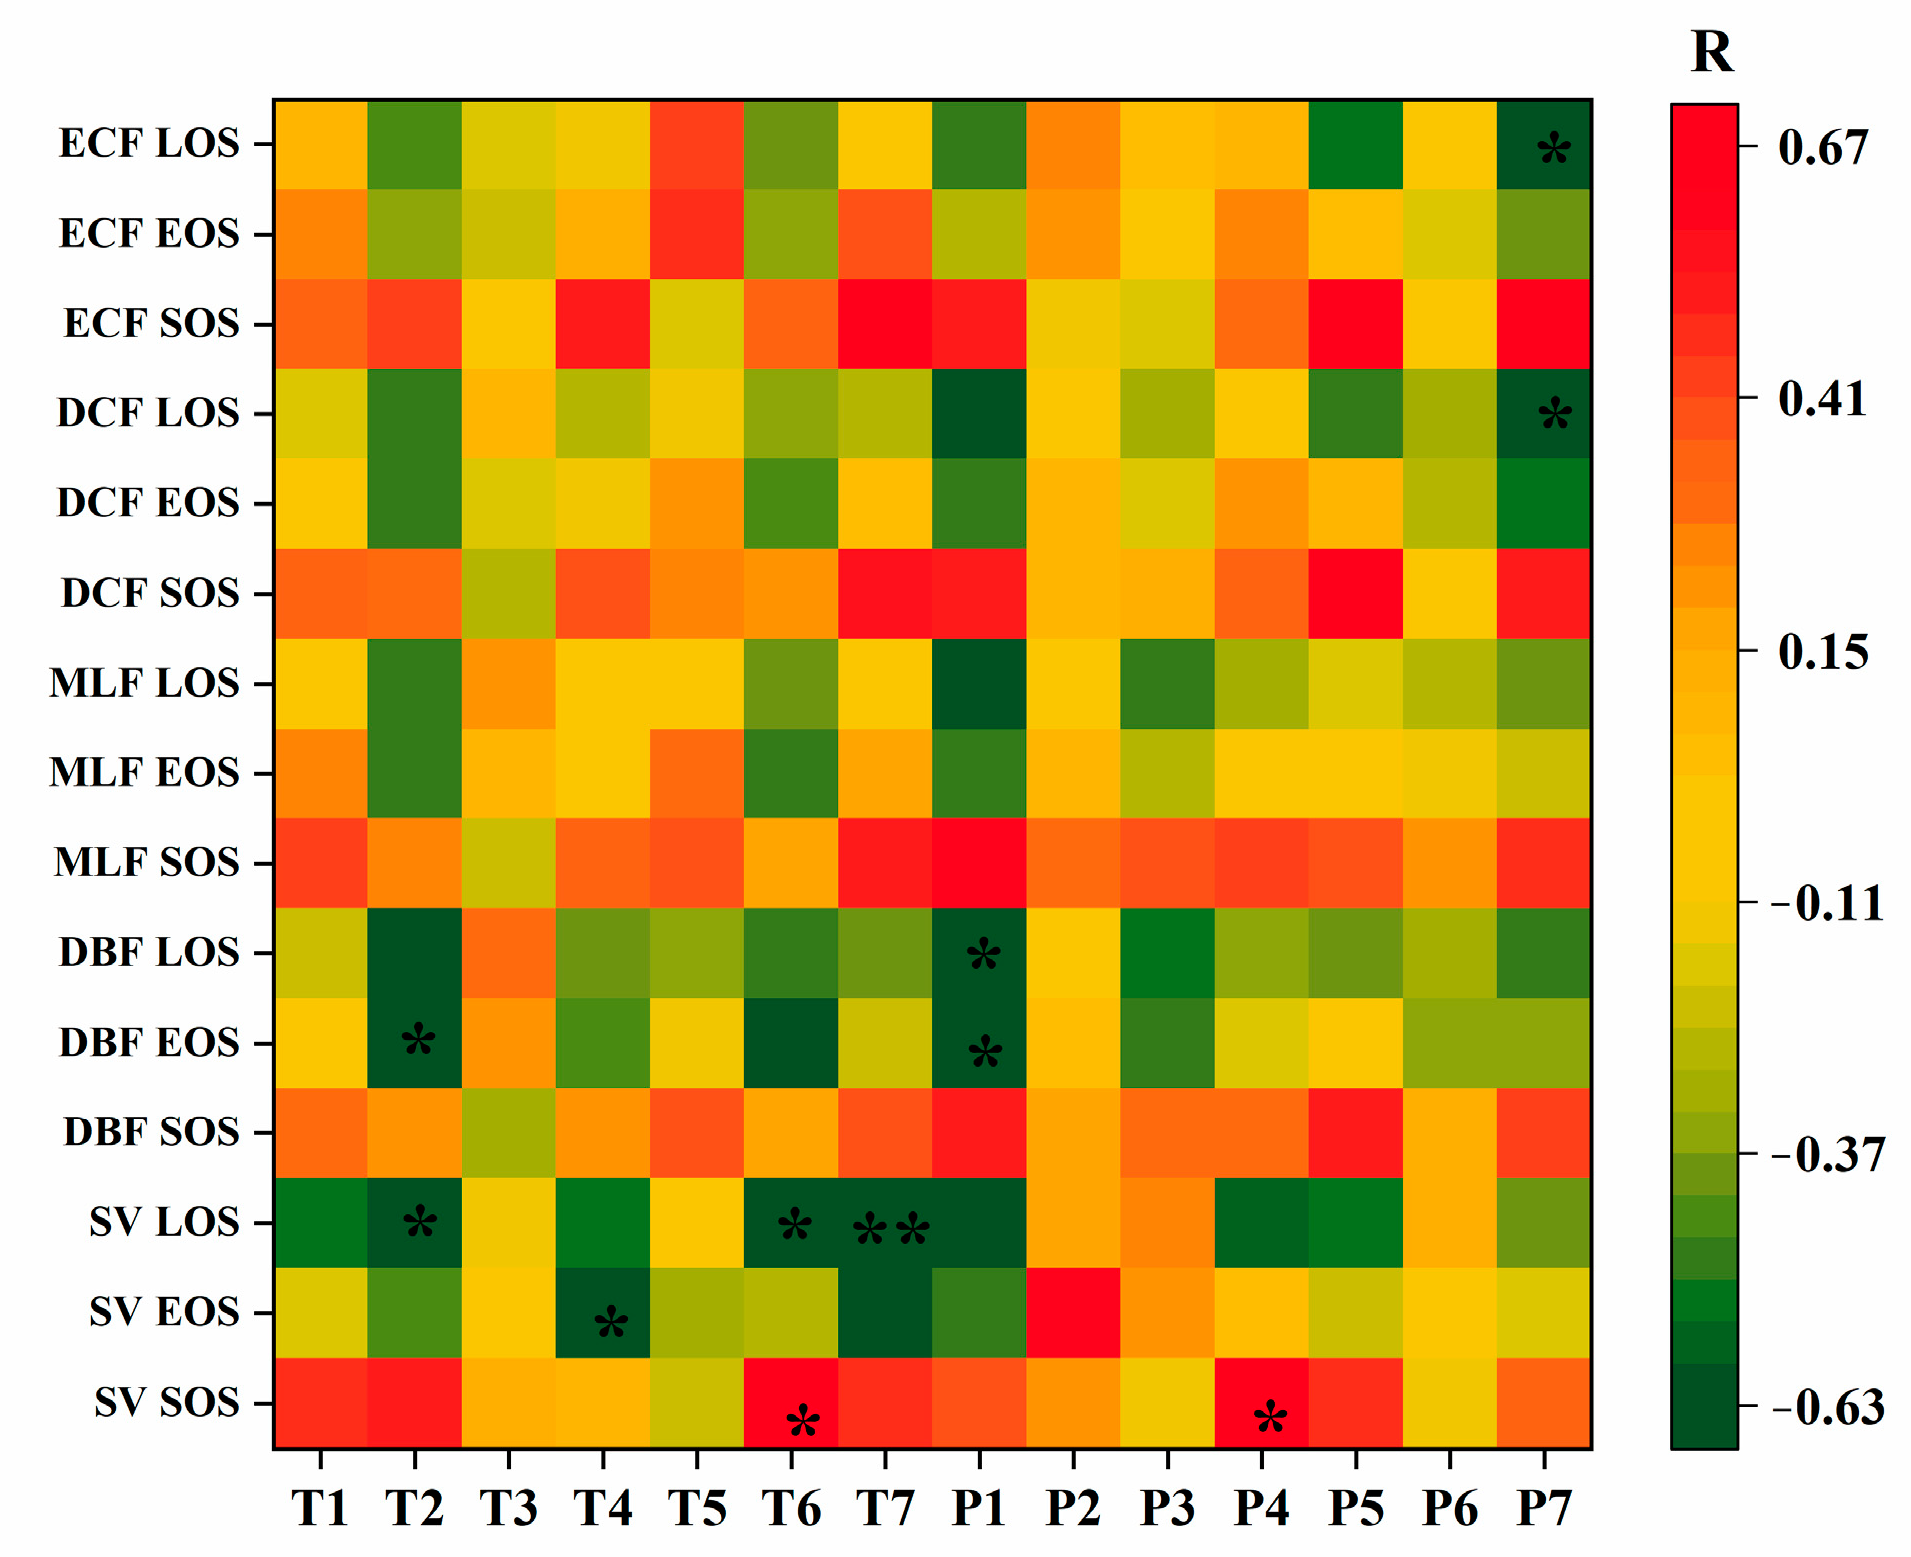
Based on the climatic characteristics and the previous studies, we analyzed the correlation between the phenological parameters of different forest types and the climatic factors of different seasons (Figure 12). For both needle-leaved forests and mixed broadleaved forests, the factors are not significant. This is likely related to the growth characteristics of the tree species. For the deciduous broadleaved forest, P1 and P4 were negatively correlated with EOS and LOS at 0.05 levels. P6 had a strong positive correlation with SOS. There are more factors influencing the growth of grassland, and precipitation is a main causality factor. P1, P2, and P3 were significantly negative with EOS and LOS, respectively, at 0.05 levels. T4 was negatively correlated with LOS at 0.01 level. T6 was the key factor influencing SOS. This was also supported by the findings from previously published studies. For example, some studies have shown that precipitation in fall provides an important source of soil water for the following growing season. Adequate rainfall helps to encourage germination. Photosynthetic rates decline in winter. Increasing rain and snow can inhibit respiration by lowering temperatures, causing vegetation to accumulate more organic matter [40,41,42,43]. This accounted for the early SOS in 2015 and 2016. Compared with the low temperature in the previous year, the temperature in the spring of 2017 showed an obvious increase, and the increase in temperature in the spring may account for excessive respiration to consume a large amount of organic matter accumulated by photosynthesis, thus inhibiting the greening of vegetation and delaying SOS [44,45]. Spatially, most of the forest growing season in the study area begins in May, and its SOS span is about 30 days. The spatial heterogeneity of EOS was relatively small and the inter-annual fluctuation was large. There were significant delays in EOS in 2014, 2017, and 2020, which may be due to higher precipitation in spring before the growing season than in the fall. However, EOS in 2016 and 2021 was significantly advanced, which may be due to the high rainfall in the fall. The large rainfall amounts in fall resulted in the premature end of the forest growing season in the whole study area and, thus, showed an early EOS trend [45].
The phenology of the 4 forest types and shrub vegetation in Changbai Mountain showed different characteristics of inter-annual fluctuation. The phenology of different forest types showed significant spatial heterogeneity. In the study area, the deciduous broadleaved forest, the deciduous coniferous forest, the evergreen coniferous forest, and the other forest types were distributed from northeast to southwest. SOS was gradually delayed, EOS was gradually advanced, and LOS was gradually shortened, which may reflect the difference in response of different forest types to the mountain microclimate characteristics in the recent 10 years [46,47]. The boreal forest is located in the middle and high latitudes of the northern hemisphere and is one of the most sensitive and earliest forest areas in the world to climate change [48,49]. Generally, temperature, precipitation, and solar radiation are the main driving factors affecting vegetation growth [50,51]. From 1971 to 2000, in more than 125,000 series of observations on flora and fauna across 21 European countries, the advancement of spring-summer phenology was found to be at a rate of 2.5 d per decade, closely correlated with the rising temperatures in the study areas [52]. Melaas et al. [53] showed that the temperature from March to May was sufficient to explain most of the inter-annual variation in the start time of spring, while the accumulation of low temperature in winter was minor. In this study, we found that premature spring precipitation or excessive autumn precipitation would lead to delayed forest SOS or advanced EOS. In addition, the rise in temperature in the autumn and winter of the previous year and in the spring of the current year resulted in advances in forest SOS.

4.2. Effects of Elevation and Topography on Forest Phenology

Previous studies have shown that, in response to climate factors, phenology can be used to study regional vegetation growth conditions by using topographic features with a higher spatial resolution (such as 30 m) (such as slope, aspect, and elevation) as the representative of local climate factors. Therefore, we analyzed the topographic differentiation of forest phenology in Changbai Mountain from the three factors of elevation, slope, and slope direction, combined with the forest phenology results. SOS was delayed by the increase in altitude gradient. According to the fitting trend, SOS will be delayed by 1.71 d (R2 = 0.93, p < 0.01) for every 100 m increase. The rate of delayed greening accelerated from 2014 to 2017, and slowed down from 2017 to 2021, showing a significant correlation within 0.01 level. There was no obvious tendency of EOS variation with altitude gradient. There were also large differences in EOS from year to year, especially at high altitudes. This may be due to the influence of snow cover in some years. The Logistic curve extraction method is difficult to accurately extract the end time of the growing season [54]. Several studies have shown that the changes in autumn phenology in temperate forests are not as obvious as those in spring [5,55]. While LOS decreased with increasing elevation, the inter-annual fluctuation of LOS at high altitudes was larger. According to the mean trend in the 10 years, LOS decreased by 1.23 d (R2 = 0.90, p < 0.01) with a 100 m elevation increase. The rate of LOS shortening was accelerated with the increase in altitude in 2013–2015 and 2017–2021, and the rate of LOS shortening was slower in 2015–2017, and the rate of LOS shortening in 2017–2021 was 0.484 (R2 = 0.90, p = 0.004), while the rate of LOS shortening in other years was not significantly. This result was similar to the results of Justine et al. [56]. The change in altitude is a key factor affecting the phenology of mountain vegetation [57,58], but altitude is not the only factor. Shen et al. [54] indicated that the vegetation growth rate of the Qinghai-Tibet Plateau also kept a stagnant trend above a certain altitude. Ding et al. [59] analyzed the phenology trend along the altitude gradient. With the increase in altitude, the advance amplitude of SOS decreased from 2.4 d per year to 0.3 d per year, the delay amplitude of EOS decreased from 1.3 d per year to 0 d per year, and the extension amplitude of LOS decreased from 3.4 d per year to 0.2 d per 100 m. The magnitude of phenological changes in different years may be related to different data sources, time scales, and regional differences [59,60,61,62].
We found that the phenology of each slope fluctuated in different years, with a maximum difference of about 20 d. The SOS mean value showed a significant downward trend with the increase in slope. For each degree increase in slope, the SOS advanced by 0.12 d. It indicated that forest vegetation on steep slopes would turn green earlier than that on gentle slopes. Meanwhile, some studies have shown that in areas where the slope is less than 30°, the influence of precipitation on the slope may be less than that of temperature, resulting in little difference in the greening date [63]. In this study, for every degree increase in slope, the mean EOS and LOS over the past 10 years were delayed by 0.18 d and increased by 0.28 d, respectively, indicating that the forest growing season ended later and the growing season was longer on a steep slope. This may be due to the fact that the soil temperature on the steep slopes was slightly lower and the soil moisture caused by snowmelt was relatively higher, which was more conducive to forest growth. In addition, steep slopes are generally located in valleys, and microclimatic conditions may be more conducive to forest growth [64,65]. From the perspective of time, phenology fluctuates with the change rate of slope to different degrees every year, but they are not significant.
The aspect has an obvious control effect on EOS and LOS but has little influence on SOS. This also indicates that the SOS may be influenced by precipitation and soil moisture rather than temperature [66]. The mean LOS of the south aspect is 156.19 d, which was 6.47 d longer than that of the north aspect (149.72 d). This phenomenon may be caused by the variation of local hydrothermal conditions caused by the difference in solar radiation intensity and radiation duration on different aspects [67]. Generally, the temperature of the shady slope was lower than that of the sunny slope, and the snowmelt time was also later [68]. At the same time, the lower temperature on the shady slope makes EOS advance, while the higher temperature on the sunny slope makes EOS later. In this study, the EOS of the south aspect forest generally lags about 3.15 d compared with that of the north aspect forest. The phenological difference between the south and the north gradually decreased. The LOS difference decreased significantly by 0.85 d per year (p < 0.01), and the SOS and the EOS decreased by 0.34 d and 0.53 d per year, respectively (p < 0.05).

4.3. Limitations and Prospects

As shown in the discussion, our study has both similarities and differences with previous studies. These differences may be due to a diversity in study areas, study periods, data sets, and methods of deriving phenology. In our study, the inconsistencies arising from different study areas are introduced. Different study periods will also affect the changing trend of vegetation phenology, and the trend obtained from long-term time series data should be more reliable than from short-term data. Although the period of our results spans 10 years, because forest phenology may also be affected by other factors, such as hydrothermal conditions of different terrains, extreme weather events, human activities, and their combined effects, the time series will need to be extended for further analysis in the future.
The reliability of remote sensing extraction of phenology is also related to the data set and extraction method. According to previous studies, there is uncertainty associated with AVHRR NDVI data, MODIS NDVI data, and SPOT-VGT NDVI data. Many research results show that the phenology trends obtained from AVHRR and MODIS data are very different [59,69,70]. The spatio-temporal fusion data of MODIS NDVI and Landsat NDVI used in our study was missing in some areas due to the clouds in remote sensing images. Our study used the Logistic curve function combined with the threshold method. The phenology obtained by us was the phenology of a 30 m remote sensing pixel scale, which differs by forest species.
In addition, it should be noted that the topographic difference analysis of forest phenology was based on the natural elevation gradient of Changbai Mountain in this study. The natural elevation gradient causes the vertical distribution of vegetation belts. Therefore, our analysis results to some extent reflect the phenological variation caused by the distribution of forest types. Further research in the future may consider the changes in phenology characteristics for the same forest type under different altitude gradients and topographic conditions.

5. Conclusions

On the north slope of Changbai Mountain, SOS was on the 120th–150th day, EOS was on the 270th–300th day, and LOS was on the 110th–190th day. In the last decade, SOS showed a trend of first advance and then delay, and the spatial differentiation between years was consistent. This may be related to seasonal climatic variations: sufficient precipitation in the autumn and winter of the previous year will advance SOS in the current year. However, the low temperature in the early spring of the previous year would lead to the delay of SOS. From the perspective of space, the SOS of the central Korean pine forest was slightly advanced; the change of SOS was not obvious in the coniferous forest and birch forest in the high-elevation area in the southwest. The SOS of forests in the southeast showed a delayed trend. EOS was gradually advanced, and LOS was gradually shortened.
The phenology of 4 main forest types and shrub vegetation on the north slope of Changbai Mountain showed different fluctuation characteristics. The SOS mean values of the 5 vegetation types ranged during the 130th–145th day, and they were the deciduous broadleaved forest, the mixed broadleaved forest, the deciduous coniferous forest, shrub vegetation, and the evergreen coniferous forest in chronological order from early to late. EOS was mainly in the 280th–290th-day range and was divided into the evergreen coniferous forest, the mixed broadleaved forest, the deciduous coniferous forest, the deciduous broadleaved forest, and shrub vegetation from early to late. LOS were the evergreen coniferous forest, shrub vegetation, the deciduous coniferous forest, the mixed broadleaved forest, and the deciduous broadleaved forest from short to long. LOS is determined by the biological characteristics of the species itself, and it may also be closely related to the elevation gradient and terrain characteristics.
The forest phenology changes obviously with altitude on the north slope of Changbai Mountain. SOS was delayed by 1.71 d for every 100 m increase in altitude (R2 = 0.93, p < 0.01). SOS accelerated from 2014 to 2017 with a delay rate of 0.274 (R2 = 0.99, p < 0.01), and decreased to 0.379 (R2 = 0.94, p < 0.01) per year from 2017 to 2021. EOS was stable at a low altitude area around the 270th–300th-day mark, and in the high elevation area, there was a large inter-annual fluctuation range of LOS. LOS shortened by 1.23 d per 100 m elevation rise (R2 = 0.90, p < 0.01). From 2017 to 2021, with the increasing altitude, the LOS shortening speed was accelerated, and the shortening rate was 0.484 (R2 = 0.90, p = 0.004). The changes in other years had no significant correlation with time.
The phenology of each slope fluctuated in different years, with a maximum difference of about 20 days. Because the microclimatic conditions of steep slopes may be more conducive to forest growth, forests on steep slopes will turn green earlier than that on gentle slopes, and the growing season will end later and the growing season will be longer. For every degree increase in slope, forest SOS advances 0.12 d (R2 = 0.53, p = 0.04), EOS delays 0.18 d (R2 = 0.82, p = 0.002), and LOS increases 0.28 d (R2 = 0.78, p = 0.004). From the perspective of time, the change rate of phenology with slopes varies from year to year and shows no significant trends.
Aspect had obvious control effects on EOS and LOS but had little influence on SOS. The region with the latest EOS and the longest LOS is due south, followed by southwest and southeast, and the shortest LOS occurs on the northeast aspect. Due to the difference in solar radiation intensity and radiation duration on different aspects, the hydrothermal conditions in local areas changed. The temperature on the shady slope was lower and snowmelt time was later than that on the sunny slope. The EOS of the southern aspect was 3.15 d later than that of the northern aspect, and the LOS was 6.47 d longer. The phenological difference between the south and the north aspect gradually decreased over the past 10 years. The difference in LOS decreased by 0.85 d, SOS decreased by 0.34 d, and EOS decreased by 0.53 d per year.
This study reveals the coupling mechanism between mountain topography and forest phenology. Our findings are helpful in further understanding the impact of topography on forest phenology and can provide a scientific basis for further phenology research in mountain areas against the background of global warming.

Author Contributions

J.J. and Q.Y. conceived this study, implemented field sampling, and wrote the paper; R.A.M., S.W. and K.S. revised the paper and carried out the paper analysis; Q.T. and T.L. participated in the data analysis; H.Z. participated in the fieldwork. All authors have read and agreed to the published version of the manuscript.

Funding

This research was funded by the National Natural Science Foundation of China, grant number 31800367, and the Natural Science Foundation of Shandong Province, grant numbers ZR2023MD129 and ZR2021MD090.

Data Availability Statement

Datasets analyzed during the current study mainly include MOD09Q1, Landsat 8, GLC_FCS30 (global land-cover product), and ASTER DEM. The MOD09Q1 and Landsat 8 datasets can be available at the Google Earth Engine (https://earthengine.google.com/, accessed on 21 May 2022). GLC_FCS30 is available in the Data Sharing Services System (https://data.casearth.cn/sdo/detail/5fbc7904819aec1ea2dd7061, accessed on 30 June 2022). ASTER DEM is available in the Geospatial Data Cloud (http://www.gscloud.cn/search, accessed on 13 June 2022).

Conflicts of Interest

The authors declare no conflict of interest.

References

  1. Bonan, G.B. Forests and climate change: Forcings, feedbacks, and the climate benefits of forests. Science 2008, 320, 1444–1449. [Google Scholar] [CrossRef] [PubMed] [Green Version]
  2. Chen, C.; Park, T.; Wang, X.H.; Piao, S.L.; Xu, B.D.; Chaturvedi, R.K.; Fuchs, R.; Brovkin, V.; Ciais, P.; Fensholt, R.; et al. China and India lead in greening of the world through land-use management. Nat. Sustain. 2019, 2, 122–129. [Google Scholar] [CrossRef] [PubMed]
  3. Song, W.Q.; Feng, Y.H.; Wang, Z.H. Ecological restoration programs dominate vegetation greening in China. Sci. Total Environ. 2022, 848, 157729. [Google Scholar] [CrossRef] [PubMed]
  4. Richardson, A.D.; Keenan, T.F.; Migliavacca, M.; Ryu, Y.; Sonnentag, O.; Toomey, M. Climate change, phenology, and phenological control of vegetation feedbacks to the climate system. Agric. For. Meteorol. 2013, 169, 156–173. [Google Scholar] [CrossRef]
  5. Aono, Y.; Kazui, K. Phenological data series of cherry tree flowering in Kyoto, Japan, and its application to reconstruction of springtime temperatures since the 9th century. Int. J. Climatol. 2008, 28, 905–914. [Google Scholar] [CrossRef] [Green Version]
  6. Zhang, X.Y.; Friedl, M.A.; Schaaf, C.B.; Strahler, A.H.; Hodges, J.C.F.; Gao, F.; Reed, B.C.; Huete, A. Monitoring vegetation phenology using MODIS. Remote Sens. Environ. 2003, 84, 471–475. [Google Scholar] [CrossRef]
  7. Piao, S.L.; Fang, J.Y.; Zhou, L.M.; Ciais, P.; Zhu, B. Variations in satellite-derived phenology in China’s temperate vegetation. Glob. Change Biol. 2006, 12, 672–685. [Google Scholar] [CrossRef]
  8. Shen, M.G.; Piao, S.L.; Dorji, T.; Liu, Q.; Cong, N.; Chen, X.Q.; An, S.; Wang, S.P.; Wang, T.; Zhang, G.X. Plant phenological responses to climate change on the Tibetan Plateau: Research status and challenges. Natl. Sci. Rev. 2015, 2, 454–467. [Google Scholar] [CrossRef] [Green Version]
  9. Ciais, P.; Reichstein, M.; Viovy, N.; Granier, A.; Ogée, J.; Allard, V.; Aubinet, M.; Buchmann, N.; Bernhofer, C.; Carrara, A.; et al. Europe-wide reduction in primary productivity caused by the heat and drought in 2003. Nature 2005, 437, 529–533. [Google Scholar] [CrossRef]
  10. Zhu, Z.C.; Piao, S.L.; Myneni, R.B.; Huang, M.T.; Zeng, Z.Z.; Canadell, J.G.; Ciais, P.; Sitch, S.; Friedlingstein, P.; Arneth, A.; et al. Greening of the Earth and its drivers. Nat. Clim. Change 2016, 6, 791–795. [Google Scholar] [CrossRef]
  11. Fang, Z.X.; Brandt, M.; Wang, L.H.; Fensholt, R. A global increase in tree cover extends the growing season length as observed from satellite records. Sci. Total Environ. 2022, 806, 151205. [Google Scholar] [CrossRef]
  12. Liu, Q.; Fu, Y.H.; Zhu, Z.C.; Liu, Y.W.; Liu, Z.; Huang, M.T.; Janssens, I.A.; Piao, S.L. Delayed autumn phenology in the Northern Hemisphere is related to change in both climate and spring phenology. Glob. Change Biol. 2016, 22, 3702–3711. [Google Scholar] [CrossRef]
  13. Huang, Z.; Zhou, L.; Chi, Y.G. Spring phenology rather than climate dominates the trends in peak of growing season in the Northern Hemisphere. Glob. Change Biol. 2023, 29, 4543. [Google Scholar] [CrossRef]
  14. Zheng, W.R.; Liu, Y.Q.; Yang, X.G.; Fan, W.Y. Spatiotemporal Variations of Forest Vegetation Phenology and Its Response to Climate Change in Northeast China. Remote Sens. 2022, 14, 2909. [Google Scholar] [CrossRef]
  15. Qader, S.H.; Priyatikanto, R.; Khwarahm, N.R.; Tatem, A.; Dash, J.A.J. Characterising the Land Surface Phenology of Middle Eastern Countries Using Moderate Resolution Landsat Data. Remote Sens. 2022, 14, 2136. [Google Scholar] [CrossRef]
  16. Yang, J.W.; Zhang, Q.L.; Song, W.Q.; An, Y.; Wang, X.C. Divergent response of Pinus pumila growth to climate warming at different latitudes and in different simulation predictions. Front. For. Glob. Change 2022, 5, 1075100. [Google Scholar] [CrossRef]
  17. Taylor, G.; Tallis, M.J.; Giardina, C.P.; Percy, K.E.; Miglietta, F.; Gupta, P.S.; Gioli, B.; Calfapietra, C.; Gielen, B.; Kubiske, W.E.; et al. Future atmospheric CO2 leads to delayed autumnal senescence. Glob. Change Biol. 2008, 14, 264–275. [Google Scholar] [CrossRef]
  18. Maignan, F.; Bréon, F.M.; Bacour, C.; Demarty, J.; Poirson, A. Interannual vegetation phenology estimates from global AVHRR measurements. Remote Sens. Environ. 2008, 112, 496–505. [Google Scholar] [CrossRef]
  19. Chen, L.; Huang, J.G.; Ma, Q.; Hänninen, H.; Rossi, S.; Piao, S.L.; Bergeron, Y. Spring phenology at different altitudes is becoming more uniform under global warming in Europe. Glob. Change Biol. 2018, 24, 3969–3975. [Google Scholar] [CrossRef]
  20. Asse, D.; Chuine, I.; Vitasse, Y.; Yoccoz, N.G.; Delpierre, N.; Badeau, V.; Delestrade, A.; Randin, C.F. Warmer winters reduce the advance of tree spring phenology induced by warmer springs in the Alps. Agric. For. Meteorol. 2018, 252, 220–230. [Google Scholar] [CrossRef]
  21. Gao, M.D.; Piao, S.L.; Chen, A.P.; Yang, H.; Liu, Q.; Fu, Y.H.; Janssens, I.A. Divergent changes in the elevational gradient of vegetation activities over the last 30 years. Nat. Commun. 2019, 10, 2970. [Google Scholar] [CrossRef] [PubMed] [Green Version]
  22. Vitasse, Y.; Signarbieux, C.; Fu, Y.H. Global warming leads to more uniform spring phenology across elevations. Proc. Natl. Acad. Sci. USA 2018, 115, 1004–1008. [Google Scholar] [CrossRef] [PubMed] [Green Version]
  23. Menzel, A.; Sparks, T.H.; Estrella, N.; Roy, D.B. Altered Geographic and Temporal Variability in Phenology in Response to Climate Change. Glob. Ecol. Biogeogr. 2006, 15, 498–504. [Google Scholar] [CrossRef]
  24. Wang, X.Y.; Zhou, Y.K.; Wen, R.H.; Zhou, C.H.; Xu, L.L.; Xi, X. Mapping Spatiotemporal Changes in Vegetation Growth Peak and the Response to Climate and Spring Phenology over Northeast China. Remote Sens. 2020, 12, 3977. [Google Scholar] [CrossRef]
  25. Cai, H.; Zhang, S.; Yang, X. Forest dynamics and their phenological response to climate warming in the Khingan Mountains, northeastern China. Int. J. Environ. Res. Public Health 2012, 9, 3943–3953. [Google Scholar] [CrossRef] [PubMed] [Green Version]
  26. Guo, J.T.; Hu, Y.M. Spatiotemporal Variations in Satellite-Derived Vegetation Phenological Parameters in Northeast China. Remote Sens. 2022, 14, 705. [Google Scholar] [CrossRef]
  27. Li, K.W.; Wang, C.Y.; Sun, Q.; Rong, G.Z.; Tong, Z.J.; Liu, X.P.; Zhang, J.Q. Spring Phenological Sensitivity to Climate Change in the Northern Hemisphere: Comprehensive Evaluation and Driving Force Analysis. Remote Sens. 2021, 13, 1972. [Google Scholar] [CrossRef]
  28. Hao, B.F.; Han, X.J.; Ma, M.G.; Liu, Y.T.; Li, S.W. Research progress on the application of Google Earth Engine in geoscience and environmental sciences. Remote Sens. Technol. Appl. 2018, 33, 600–611. [Google Scholar]
  29. Wang, C.; Fang, C.F.; Zhao, S.D.; Dong, S.L. Plantae Novae Salicum Sinicarum(Ⅰ). Bull. Bot. Res. 1980, 4, 1–21. [Google Scholar]
  30. Zhao, S.Q.; Fang, J.Y.; Zong, Z.J.; Zhu, B. Composition, structure and species diversity of plant communities along an altitudinal gradient on the northern slope of Mt. Changbai, Northeast China. Biodivers. Sci. 2004, 12, 164–173. [Google Scholar] [CrossRef]
  31. Xu, Z.Z.; Liu, Q.J.; Du, W.X.; Zhou, G.; Qin, L.H.; Sun, Z. Modelling leaf phenology of some trees with accumulated temperature in a temperate forest in northeast China. For. Ecol. Manag. 2021, 489, 119085. [Google Scholar] [CrossRef]
  32. Tang, G.A.; Na, J.M.; Cheng, W.M. Progress of digital terrain analysis on regional geomorphology in China. Acta Geod. Cartogr. Sin. 2017, 46, 1570–1591. [Google Scholar]
  33. Hou, J.W.; Van, D.A.I.J.M.; Renzullo, L.J. Merging Landsat and airborne LiDAR observations for continuous monitoring of floodplain water extent, depth and volume. J. Hydrol. 2022, 609, 127684. [Google Scholar] [CrossRef]
  34. Cao, R.Y.; Chen, Y.; Chen, J.; Zhu, X.L.; Shen, M.G. Thick cloud removal in Landsat images based on autoregression of Landsat time-series data. Remote Sens. Environ. 2020, 249, 112001. [Google Scholar] [CrossRef]
  35. Zhu, Z.; Woodcock, C.E. Object-based cloud and cloud shadow detection in Landsat imagery. Remote Sens. Environ. 2012, 118, 83–94. [Google Scholar] [CrossRef]
  36. Wulder, M.A.; Roy, D.P.; Radeloff, V.C.; Loveland, T.R.; Anderson, M.C.; Johnson, D.M.; Healey, S.; Zhu, Z.; Scambos, T.A.; Pahlevan, N.; et al. Fifty years of Landsat science and impacts. Remote Sens. Environ. 2022, 280, 113195. [Google Scholar] [CrossRef]
  37. Skakun, S.; Wevers, J.; Brockmann, C.; Doxani, G.; Aleksandrov, M.; Batič, M.; Frantz, D.; Gascon, F.; Gómez-Chova, L.; Hagolle, O.; et al. Cloud Mask Intercomparison eXercise (CMIX): An evaluation of cloud masking algorithms for Landsat 8 and Sentinel-2. Remote Sens. Environ. 2022, 274, 112990. [Google Scholar] [CrossRef]
  38. Chen, Y.; Cao, R.Y.; Chen, J.; Liu, L.C.; Matsushita, B. A practical approach to reconstruct high-quality Landsat NDVI time-series data by gap filling and the Savitzky–Golay filter. ISPRS J. Photogramm. Remote Sens. 2021, 180, 174–190. [Google Scholar] [CrossRef]
  39. Zhang, X.; Liu, L.Y.; Chen, X.D.; Gao, Y.; Xie, S.; Mi, J. GLC_FCS30: Global land-cover product with fine classification system at 30 m using time-series Landsat imagery. Earth Syst. Sci. Data 2021, 13, 2753–2776. [Google Scholar] [CrossRef]
  40. Chen, F.; Yuan, Y.J.; Wei, W.S.; Fan, Z.A.; Zhang, T.W.; Shang, H.M.; Zhang, R.B.; Yu, S.L.; Ji, C.R.; Qin, L. Climatic response of ring width and maximum latewood density of Larix sibirica in the Altay Mountains, reveals recent warming trends. Ann. Forest Sci. 2012, 69, 723–733. [Google Scholar] [CrossRef] [Green Version]
  41. Zhou, P.; Huang, J.G.; Liang, H.X.; Rossi, S.; Bergeron, Y.; Shishov, V.V.; Jiang, S.W.; Kang, J.; Zhu, H.X.; Dong, Z.C. Radial growth of Larix sibirica was more sensitive to climate at low than high altitudes in the Altai Mountains, China. Agric. For. Meteorol. 2021, 304, 108392. [Google Scholar] [CrossRef]
  42. Liu, B.H.; Xu, M.; Henderson, M.; Qi, Y.; Li, Y.Q. Taking China’s Temperature: Daily Range, Warming Trends, and Regional Variations, 1955–2000. Am. Meteorol. Soc. 2004, 17, 4453–4462. [Google Scholar] [CrossRef]
  43. Zhang, X.W.; Liu, X.H.; Zhang, Q.L.; Zeng, X.M.; Xu, G.B.; Wu, G.J.; Wang, W.Z. Species-specific tree growth and intrinsic water-use efficiency of Dahurian larch (Larix gmelinii) and Mongolian pine (Pinus sylvestris var. mongolica) growing in a boreal permafrost region of the Greater Hinggan Mountains, Northeastern China. Agric. For. Meteorol. 2018, 248, 145–155. [Google Scholar] [CrossRef]
  44. Tan, J.G.; Piao, S.L.; Chen, A.P.; Zeng, Z.Z.; Ciais, P.; Janssens, I.A.; Mao, J.F.; Myneni, R.B.; Peng, S.S.; Peñuelas, J.; et al. Seasonally different response of photosynthetic activity to daytime and night-time warming in the Northern Hemisphere. Glob. Change Biol. 2015, 21, 377–387. [Google Scholar] [CrossRef]
  45. Zhang, F.Y.; Liu, B.H.; Henderson, M.; Shen, X.J.; Su, Y.H.; Zhou, W.Y. Changing Spring Phenology of Northeast China Forests during Rapid Warming and Short-Term Slowdown Periods. Forests 2022, 13, 2173. [Google Scholar] [CrossRef]
  46. Vitasse, Y.; Delzon, S.; Dufrene, E.; Pontailler, J.Y.; Louvet, J.M.; Kremer, A.; Michalet, R. Leaf phenology sensitivity to temperature in European trees: Do within-species populations exhibit similar responses? Agric. For. Meteorol. 2009, 149, 735–744. [Google Scholar] [CrossRef]
  47. Jeong, S.J.; Medvigy, D.; Shevliakova, E.; Malyshev, S. Uncertainties in terrestrial carbon budgets related to spring phenology. J. Geophys. Res. Biogeosci. 2012, 117, 269. [Google Scholar] [CrossRef]
  48. Steffen, W.; Richardson, K.; Rockström, J.; Cornell, S.E.; Fetzer, I.; Bennett, E.M.; Biggs, R.; Carpenter, S.R.; Vries, W.; Wit, C.A.; et al. Planetary boundaries: Guiding human development on a changing planet. Science 2015, 347, 1259855. [Google Scholar] [CrossRef] [Green Version]
  49. Astrup, R.; Bernier, P.Y.; Genet, H.; Lutz, D.A.; Bright, R.M. A sensible climate solution for the boreal forest. Nat. Clim. Change 2018, 8, 11–12. [Google Scholar] [CrossRef] [Green Version]
  50. Jong, R.; Michael, E.S.; Furrer, R.; Bruin, S.; Verburg, P.H. Spatial relationship between climatologies and changes in global vegetation activity. Glob. Change Biol. 2013, 19, 1953–1964. [Google Scholar] [CrossRef]
  51. Nemani, R.R.; Keeling, C.D.; Hashimoto, H.; Jolly, W.M.; Piper, S.C.; Tucker, C.J.; Myneni, R.B.; Running, S.W. Climate-Driven Increases in Global Terrestrial Net Primary Production from 1982 to 1999. Science 2003, 300, 1560–1563. [Google Scholar] [CrossRef] [Green Version]
  52. Menzel, A.; Sparks, T.H.; Estrella, N.; Koch, E.; Assa, A.; Ahas, R.; Alm, K.; Bissolli, P.; Braslavska, O.; Briede, A.; et al. European phenological response to climate change matches the warming pattern. Glob. Change Biol. 2006, 12, 1969–1976. [Google Scholar] [CrossRef]
  53. Melaas, E.K.; Friedl, M.A.; Richardson, A.D. Multiscale modeling of spring phenology across Deciduous Forests in the Eastern United States. Glob. Change Biol. 2016, 22, 792–805. [Google Scholar] [CrossRef]
  54. Shen, M.G.; Zhang, G.X.; Cong, N.; Wang, S.P.; Kong, W.D.; Piao, S.L. Increasing altitudinal gradient of spring vegetation phenology during the last decade on the Qinghai–Tibetan Plateau. Agric. For. Meteorol. 2014, 189, 71–80. [Google Scholar] [CrossRef]
  55. Marchin, M.R.; Salk, C.F.; Hoffmann, W.A.; Dunn, R.R. Temperature alone does not explain phenological variation of diverse temperate plants under experimental warming. Glob. Change Biol. 2015, 21, 3138–3151. [Google Scholar] [CrossRef]
  56. Justine, C.S.; Yann, V.; Michael, M.; Sylvain, D.; Christof, B. Temperature rather than individual growing period length determines radial growth of sessile oak in the Pyrenees. Agric. For. Meteorol 2022, 317, 108885. [Google Scholar]
  57. Roberto, C.; Lorenzo, B.; Mirco, M.; Edoardo, C.; Michele, M.; Marta, G.; Micol, R.; Consolata, S.; Umberto, M.C. On the spatial and temporal variability of Larch phenological cycle in mountainous areas. Eur. J. Remote Sens. 2009, 41, 79–96. [Google Scholar]
  58. Dunn, A.H.; Beurs, K.M. Land surface phenology of North American mountain environments using moderate resolution imaging spectroradiometer data. Remote Sens. Environ. 2011, 115, 1220–1233. [Google Scholar] [CrossRef]
  59. Ding, M.J.; Zhang, Y.L.; Sun, X.M.; Liu, L.S.; Wang, Z.F.; Bai, W.Q. Spatiotemporal variation in alpine grassland phenology in the Qinghai-Tibetan Plateau from 1999 to 2009. Chin. Sci. Bull. 2013, 58, 396–405. [Google Scholar] [CrossRef] [Green Version]
  60. Tang, H.; Li, Z.W.; Zhu, Z.L.; Chen, B.R.; Zhang, B.H.; Xin, X.P. Variability and climate change trend in vegetation phenology of recent decades in the Greater Khingan Mountain area, Northeastern China. Remote Sens. 2015, 7, 11914–11932. [Google Scholar] [CrossRef] [Green Version]
  61. Roerink, G.J.; Menenti, M.; Verhoef, W. Reconstructing cloudfree NDVI composites using Fourier analysis of time series. Int. J. Remote Sens. 2000, 21, 1911–1917. [Google Scholar] [CrossRef]
  62. White, M.A.; Beurs, K.; Didan, K.; Inouye, D.; Richardson, A.D.; Jensen, O.; O’Keefe, J.; Zhang, G.; Nemani, R.; Leeuwen, W.V.; et al. Intercomparison, interpretation, and assessment of spring phenology in North America estimated from remote sensing for 1982–2006. Glob. Change Biol. 2009, 15, 2335–2359. [Google Scholar] [CrossRef]
  63. An, S.; Zhang, X.Y.; Chen, X.Q.; Yan, D.; Henebry, G.M. An Exploration of Terrain Effects on Land Surface Phenology across the Qinghai–Tibet Plateau Using Landsat ETM+ and OLI Data. Remote Sens. 2018, 10, 1069. [Google Scholar] [CrossRef] [Green Version]
  64. Fu, X.L.; Wang, J.L.; Wang, H.M.; Dai, X.Q.; Yang, F.T.; Zhao, M. Response of the fine root production, phenology, and turnover rate of six shrub species from a subtropical forest to a soil moisture gradient and shading. Plant Soil 2015, 399, 135–146. [Google Scholar] [CrossRef]
  65. Che, M.L.; Chen, B.Z.; Innes, J.L.; Wang, G.Y.; Dou, X.M.; Zhou, T.M.; Zhang, H.F.; Yan, J.W.; Xu, G.; Zhao, H.W. Spatial and temporal variations in the end date of the vegetation growing season throughout the Qinghai–Tibetan Plateau from 1982 to 2011. Agric. For. Meteorol. 2014, 189–190, 81–90. [Google Scholar] [CrossRef]
  66. Shen, M.G.; Piao, S.L.; Cong, N.; Zhang, G.X.; Jassens, I.A. Precipitation impacts on vegetation spring phenology on the Tibetan Plateau. Glob. Change Biol. 2015, 21, 3647–3656. [Google Scholar] [CrossRef] [Green Version]
  67. Dong, C.Y.; Qiao, R.R.; Chang, X.L. Effects of aspect on phenology of Larix gmelinii forest in Northeast China. Sci. Rep. 2022, 12, 22177. [Google Scholar] [CrossRef]
  68. Chen, W.N.; Wang, H.; Xiao, X.J.; Chen, F.J.; Zhang, Z.Y.; Qi, Z.M.; Huang, Z.X. Effects of slope aspect on growth and reproduction of Fritillaria unibracteata (Liliaceae). Acta Ecol. Sin. 2016, 36, 8174–8182. [Google Scholar]
  69. Zeng, H.Q.; Jia, G.S.; Epstein, H. Recent changes in phenology over the northern high latitudes detected from multi-satellite data. Environ. Res. Lett. 2011, 6, 045508. [Google Scholar] [CrossRef] [Green Version]
  70. Zhang, G.L.; Zhang, Y.J.; Dong, J.W.; Xiao, X.M. Green-up dates in the Tibetan Plateau have continuously advanced from 1982 to 2011. Proc. Natl. Acad. Sci. USA 2013, 110, 4309–4314. [Google Scholar] [CrossRef]
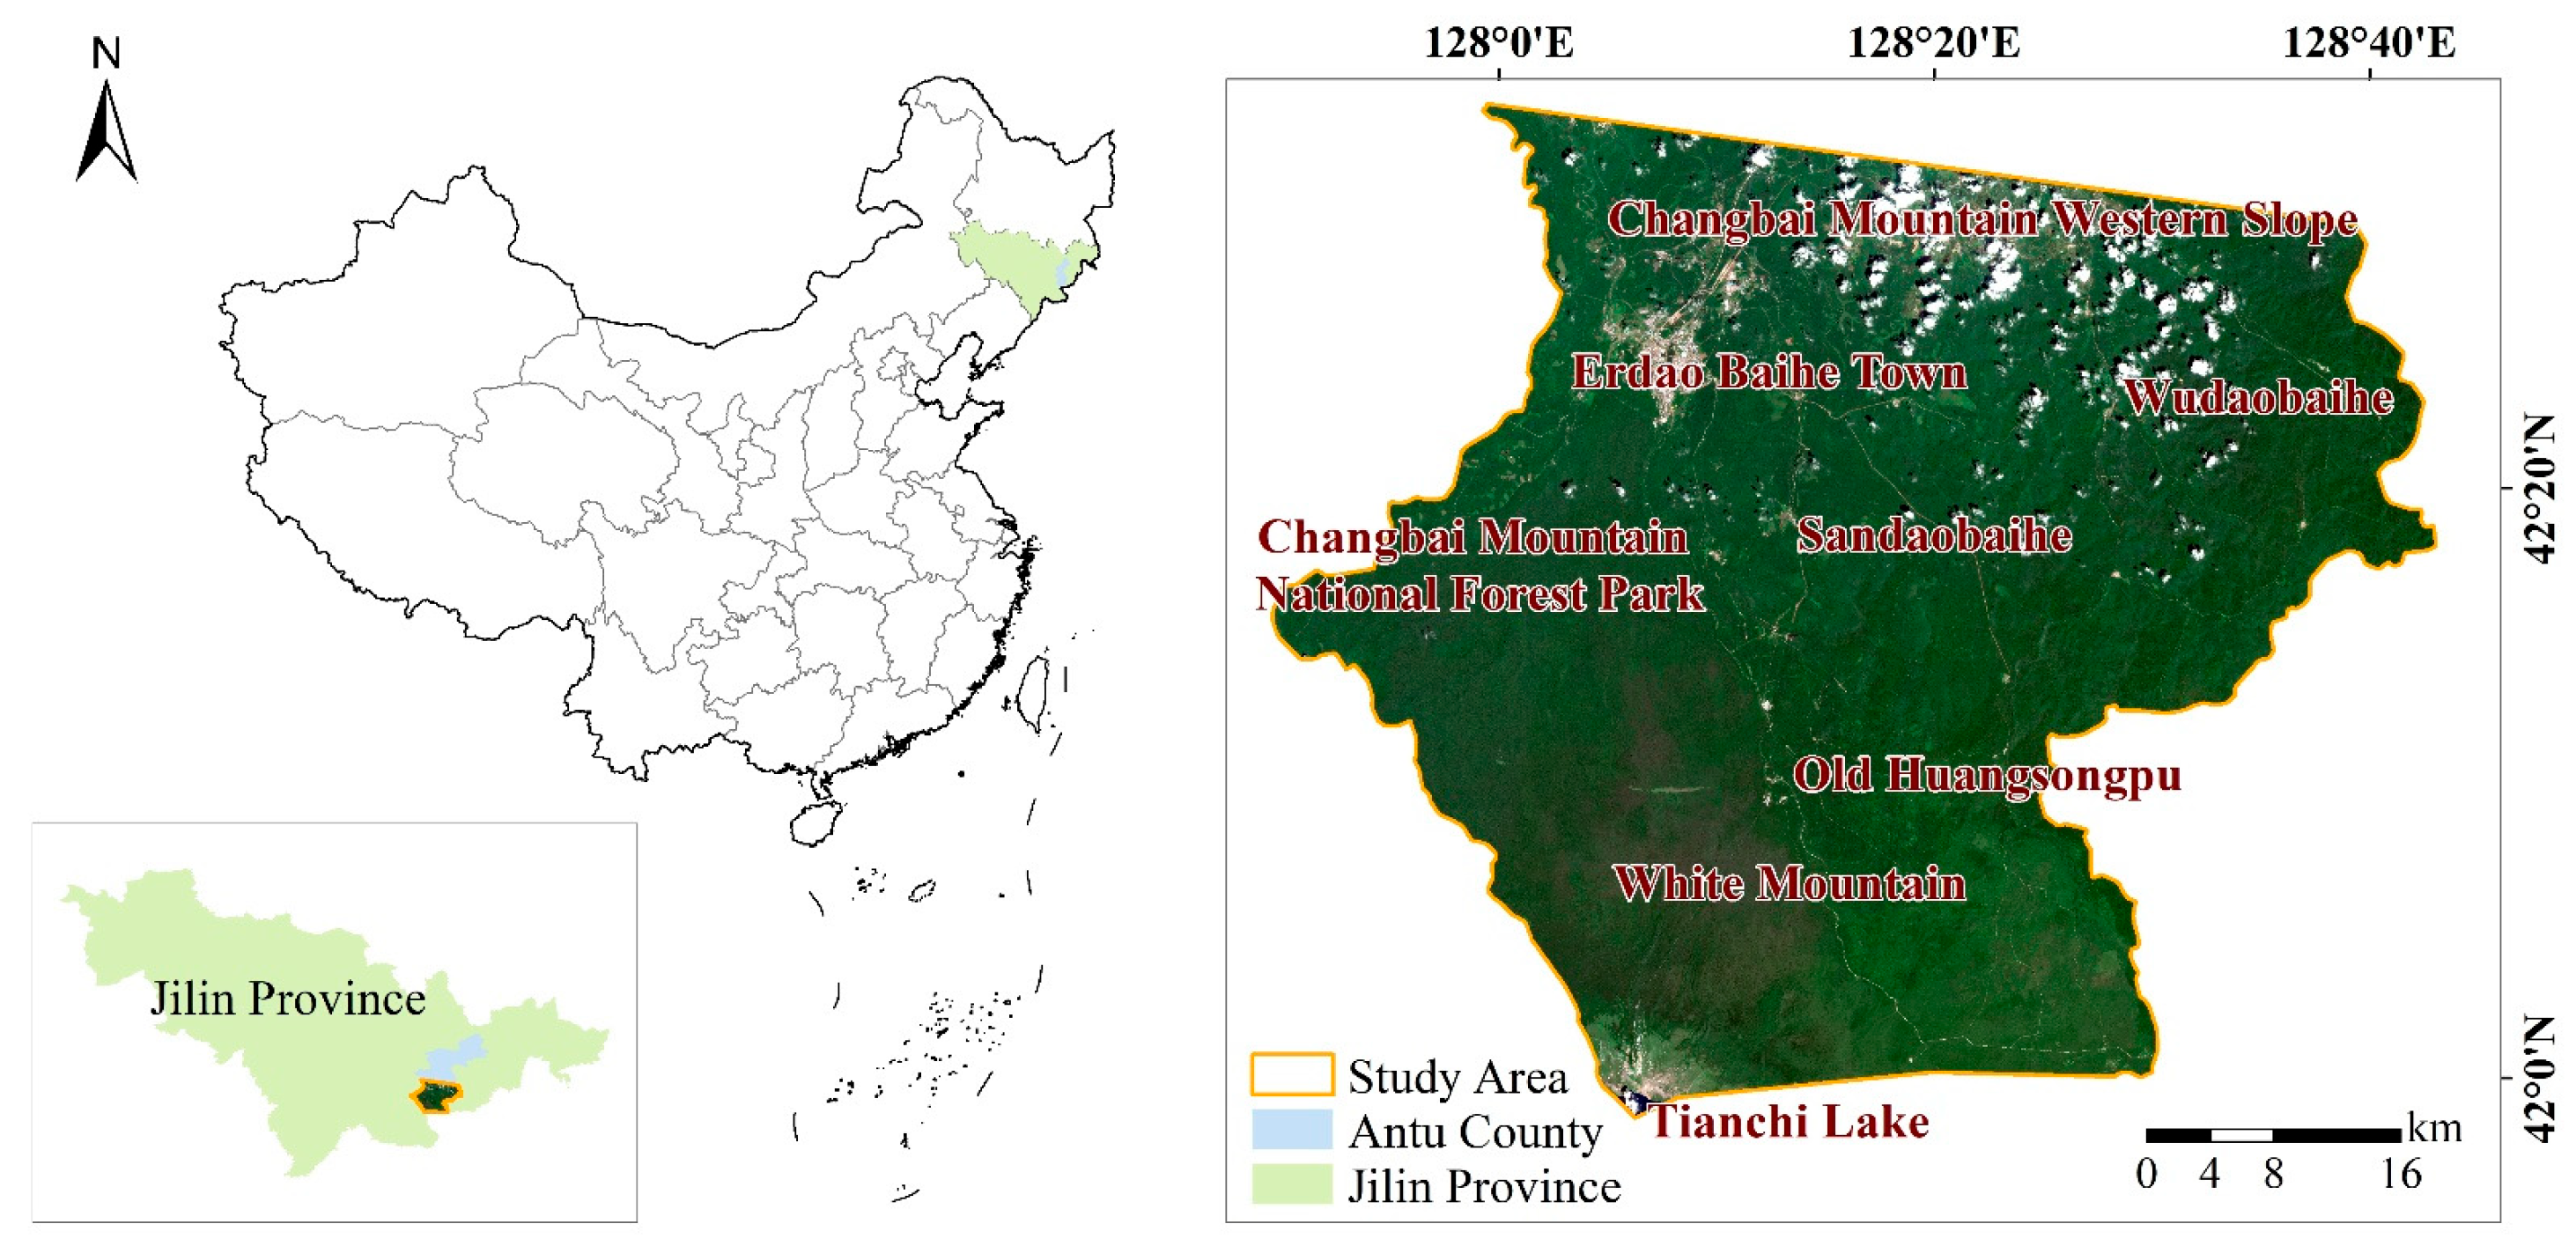
Figure 1. Location of the study area.
Forests 14 01466 g001
Figure 2. Sample points in the study area. ((a): Sample points throughout the study area; (b): Sample points in area (b); (c): Sample points in area (c); (d): Sample points in area (d); (e): Sample points in area (e)).
Forests 14 01466 g002
Figure 3. Map of topographic factors for altitude, slope, and aspect in the study area.
Forests 14 01466 g003
Figure 4. The SOS on the north slope of Changbai Mountain from 2013 to 2022.
Forests 14 01466 g004
Figure 5. The EOS on the north slope of Changbai Mountain from 2013 to 2022.
Forests 14 01466 g005
Figure 6. The LOS on the north slope of Changbai Mountain from 2013 to 2022.
Forests 14 01466 g006
Figure 7. Spatial distribution pattern and area proportion of each forest type and land cover.
Forests 14 01466 g007
Figure 8. Phenology changes of forest types and shrub vegetation from 2013 to 2022 ((a): SOS; (b): EOS; (c): LOS; (d): Average 10-year phenology changes).
Forests 14 01466 g008
Figure 9. Changes of phenology with altitude gradient from 2013 to 2022 ((a): SOS; (b): EOS; (c): LOS; (d): Phenology-mean; (e): Phenological change rate).
Forests 14 01466 g009
Figure 10. Variation characteristics of phenology with the slope factor from 2013 to 2022 ((a): SOS; (b): EOS; (c): LOS; (d): Phenology -mean; (e): Phenological change rate).
Forests 14 01466 g010
Figure 11. Variation characteristics of phenology in different slope directions from 2013 to 2022 ((a): SOS; (b): EOS; (c): LOS; (d): SOS-mean, LOS-mean; (e): EOS-mean; (f): Difference of phenological change rate between north and south slope).
Forests 14 01466 g011
Figure 12. Correlation of forest phenological characteristics with climate factors. (ECF: evergreen coniferous forest; DCF: deciduous coniferous forest; MLF: mixed leaf forest; DBF: deciduous broadleaved forest; SV: shrub vegetation; * indicates significant correlation at 0.05 level; ** indicates significant correlation at 0.01 level).
Forests 14 01466 g012
Table 1. Abbreviations for each climate factor.
Climate FactorAbbreviationClimate FactorAbbreviation
Annual TemperatureT1Annual PrecipitationP1
Spring TemperatureT2Spring PrecipitationP2
Summer TemperatureT3Summer PrecipitationP3
Autumn TemperatureT4Autumn PrecipitationP4
Winter TemperatureT5Winter PrecipitationP5
Pre-Autumn TemperatureT6Pre-Autumn PrecipitationP6
Pre-Winter TemperatureT7Pre-Winter PrecipitationP7
Table 2. Area and proportion of forest types in the study area.
Forest TypesPixel NumberArea (km2)Proportion (%)
Deciduous broadleaved forest2,400,1632160.146756.06
Deciduous coniferous forest1,444,0661299.659433.73
Evergreen coniferous forest199,382179.44384.66
Shrub vegetation158,680142.8123.70
Non-vegetation43,08438.77561.01
Mixed leaf forest36,31832.68620.84
Disclaimer/Publisher’s Note: The statements, opinions and data contained in all publications are solely those of the individual author(s) and contributor(s) and not of MDPI and/or the editor(s). MDPI and/or the editor(s) disclaim responsibility for any injury to people or property resulting from any ideas, methods, instructions or products referred to in the content.