Article

Identification of Late Flavonoid Biosynthesis Genes of Moso Bamboo Reveals the Potential Function of PeANR4 Involved in Osmotic and Salt Stress

Key Laboratory of State Forestry and Grassland Administration/Beijing on Bamboo and Rattan Science and Technology, Institute of Gene Science and Industrialization for Bamboo and Rattan Resources, International Center for Bamboo and Rattan, Beijing 100102, China
*
Author to whom correspondence should be addressed.
Forests 2023, 14(7), 1399; https://doi.org/10.3390/f14071399
Submission received: 25 May 2023 / Revised: 23 June 2023 / Accepted: 5 July 2023 / Published: 9 July 2023
(This article belongs to the Special Issue Genetic Regulation of Growth and Development of Woody Plants)

Abstract

:
Flavonoids are important secondary metabolites in plants, and their biosynthesis includes various enzymes. Although bamboo is a potential resource with abundant flavonoids, its flavonoids biosynthesis is still unclear. Based on the genome and transcriptome data of moso bamboo (Phyllostachys edulis), 24 late flavonoid biosynthesis genes (LFBGs) were identified. Further molecular characteristics analyses suggested they may have different biological functions in flavonoids biosynthesis. Sixteen differentially expressed genes were identified according to transcriptome data from different-height shoots, including five PeANSs, four PeANRs, three PeLARs, and PeDFR1. PeANR4 expressed continuously under drought stress was selected for further analysis. A co-expression network of PeANR4 and 27 differentially expressed transcription factors (DETFs) was constructed, and the regulatory relationship of four DETFs and PeANR4 was validated by Y1H assays. Furthermore, PeANR4 was ectopically expressed in Arabidopsis, and the transgenic lines had darker seed coat color and higher fresh, dry weight and proanthocyanidin (PA) content than the wild type and mutant. Moreover, the transgenic lines had higher germination rate and longer primary root than the wild type and mutant under osmotic and salt stress. These results provide a full understanding and lay a foundation for further functional studies on the LFBGs of bamboo.

1. Introduction

Flavonoids are a broad class of secondary metabolites derived from plants that have versatile biological roles to fulfil throughout plant growth. They play an indispensable part in the plant’s defenses against infections, insects, and microorganisms as well as in the absorption of UV radiation, free radicals, and beneficial symbionts [1,2,3,4]. Proanthocyanidins (PAs) are parts of metabolites produced in the flavonoid pathway, which also have significant protective effects against oxidative stress damage in animals, surpassing the effects of vitamins C and E. Therefore, PAs play an important role in anti-aging, antioxidant, and DNA protection and are natural products with broad development prospects [5,6].
The biosynthetic pathway of PAs has been well studied in model plant species (Figure S1) [7,8], of which late biosynthetic enzymes dihydroflavonol 4-reductase (DFR) and leucoanthocyanidin dioxygenase (LDOX/ANS) are key enzymes for the synthesis of leucoanthocyanidins and anthocyanidins, and leucoanthocyanidin reductase (LAR) and anthocyanidin reductase (ANR) catalyze the conversion of these substrates to (+)-catechin and (−) epicatechin, respectively [9]. Recent studies have identified two enzymes, epicatechin 3′-O-glucose transferase [10] and MATE transporter protein in Arabidopsis and Medicago truncatula [11], which can transport epicatechin 3′-O-glucoside to the vacuole for polymerization. It has been found that the ANR genes can affect color changes through studies in Arabidopsis [12,13,14,15], M. truncatula [13,16], and Vitis vinifera [9]. Mutants of Arabidopsis (ban) lacking PAs accumulation have excess anthocyanins, resulting in dark red stems.
Bamboo has received high attention due to its significant value for the development of human society [17]. Most studies on bamboo have focused on its material properties, such as cellulose and lignin content and proportion. Research has shown that flavonoids in bamboo leaves possess strong antioxidant capabilities, which can be used for immune modulation, anti-inflammation, antidepressants, and lipid-lowering [18,19,20]. Bamboo leaf flavonoids can clear ROS and reduce oxidative stress in cells by decreasing the activity of various antioxidant enzymes [21] and may help to reduce the risk of cardiovascular diseases, Alzheimer’s disease, and diabetes [22]. However, research on flavonoids and PAs has been limited to chemical studies [23,24,25], and studies on molecular mechanisms of flavonoids in bamboo are still scarce [26]. In this study, we identified the late flavonoid biosynthesis genes (LFBGs) in moso bamboo (Phyllostachys edulis) and then conducted comprehensive analyses of their molecular characteristics, evolutionary relationships, and expression patterns in bamboo. Furthermore, we verified the function of PeANR4 through heterologous expression in Arabidopsis and validated its transcriptional regulation through yeast one-hybrid (Y1H) assays. The results reveal that PeANR4 is involved in osmotic and salt stress responses by increasing PAs biosynthesis, which lays a foundation for future development and utilization of bamboo flavonoids.

2. Materials and Methods

2.1. Identification, Characteristics, and Phylogenetic Analysis of LFBGs in Moso Bamboo

The whole genome database of bamboo was obtained from the BamGDB database (http:bamboogdb.org/ accessed on 20 July 2022). The HMMER 3.0 program (https://www.ebi.ac.uk/Tools/hmmer/ accessed on 25 July 2022) with a threshold of E < e−10 was used to search for proteins containing the structural domains of bamboo flavonoid biosynthesis enzymes. The bamboo protein sequences were also searched against the National Center for Biotechnology Information (NCBI) (https://www.ncbi.nlm.nih.gov/ accessed on 5 August 2022) Blast P program with a threshold of E < e−10 and 50% identity. The results of the HMMER and Blast P analyses were used to preliminarily identify bamboo flavonoid biosynthesis genes. Finally, genes encoding proteins with incomplete conserved domains were removed using the NCBI-CD Search (https://www.ncbi.nlm.nih.gov/ accessed on 8 August 2022).
The physicochemical properties of above-identified proteins encoded by the LFBGs in moso bamboo were predicted using the ExPASy online tool (http://www.expasy.org/ accessed on 24 May 2023). Their subcellular localization was predicted using the Plant-mPLoc online program (http://www.csbio.sjtu.edu.cn/bioinf/plant-multi/ accessed on 12 August 2022). The phylogenetic tree of LFBG coding protein sequences of moso bamboo and other species was constructed by the Neighbor-Joining (N-J) method using MEGA7.0 software.

2.2. Expression Analysis of LFBGs in Moso Bamboo

The available transcriptome data of our previous studies were used for gene tissue- specific and spatiotemporal expression analyses, respectively, including the data generated from 26 different tissues of moso bamboo [27], abiotic stresses (drought and cold) [28], and those produced by the 13th internode of moso bamboo shoots [29]. The accession numbers were SRS1847048-SRS1847073, SRS1759772, and PRJNA673565 in the NCBI Sequence Read Archive (SRA) database (http://www.ncbi.nlm.nih.gov/sra/ accessed on 5 December 2022), correspondingly. The separated branches with full young unexpanded leaves were used in drought and cold treatments [28]. The branches were placed on the dry filter paper at room temperature (20 °C and 50% humidity) for drought treatment and put into a chamber set to 0 °C without light for cold treatment, respectively. After 2 h and 8 h, the unexpanded leaves were detached from each treatment and used for RNA-Seq. The values of fragments per kilobase per million (FPKM) representing LFBGs expression levels were retrieved, and TBtools software was used to draw a heat map to display gene expression levels [30].
Moso bamboo seeds gathered from the Guangxi Province of China were sown in our lab and cultivated in a greenhouse (25 ± 2 °C; 16 h/8 h light/dark cycle). After three months, the seedlings were treated with drought and cold stress according to a previous study [28]. Extraction of total RNA from leaf samples and qPCR experiments were conducted and analyzed according to the reference literature [31,32]. Primer 5.0 (Jin Wang, Soochow, Suzhou, China) was used to design the forward and reverse primers (Table S3).

2.3. Transcription Factor Binding Site Analysis in the Promoter of Above Identified Genes

Transcription factor (TF) binding sites were predicted based on promoter analysis software (http://plantregmap.gao-lab.org/binding_site_prediction.php/ accessed on 20 December 2022) [30], using Oryza sativa as the reference species and screening criteria of p ≤ e−4 and q ≤ 0.05, to analyze and select TF binding sites in the 1000 bp promoter region of the LFBGs. The Origin software was used to construct a histogram of TF binding sites.

2.4. Correlation Analysis and Co-Expression Network Construction

Based on the transcriptome data generated from samples at different development stages of moso bamboo shoots, the differentially expressed genes (DEGs) involved in late flavonoid biosynthesis were identified. A correlation analysis was conducted using the OmicShare online tool (https://www.omicshare.com/tools/ accessed on 25 December 2022). The key genes were screened based on the Pearson correlation coefficient (PCC), with the selection criteria set at |cor| ≥ 0.90 and p ≤ 0.05. The Cytoscape (v.3.9.1) software was used to construct and visualize the regulatory network of LFBGs and TFs.

2.5. Yeast One-Hybrid Assays

Yeast one-hybrid (Y1H) assays were performed using yeast strain Y187 according to the manufacturer’s instructions [29]. Two MYB-related and two NAC TFs co-expressed with PeANR4 were cloned into the pGADT7-Rec2 vector to generate the constructs of pGADT7-Rec2-TFs. The promoter fragments of PeANR4 were inserted into the pHIS2 vector. The positive control of pGADT7-Rec2-53 and p53-HIS2, negative control of pGADT7-Rec2-TFs and p53-HIS2, and experimental group of pGADT7-Rec2-TFs and pHIS2-Pro-PeANR4 were transformed into Y187 competent cells. The transformed cells were spread on solid DDO (SD/-Leu/-Trp) medium for positive clone screening. The single clone was cultured in liquid DDO medium, and the cell suspension with OD600 = 0.6~0.8 was spotted onto solid TDO (SD/-Leu/-Trp/-His) medium containing 30 mmol/L 3-amino-1,2,4-triazole (3-AT). The plates were incubated at 29 °C for 48–96 h with inversion, and photographs were taken for analysis.

2.6. Arabidopsis thaliana Transformation

PeANR4’s CDS sequence was obtained, sequenced, and subcloned into the Super1300 expression vector with a 35S promoter. The Super1300-PeANR4 vector was inserted into competent cells of Agrobacterium tumefaciens strain GV3101. Then, it was transferred to Arabidopsis by dipping flowers [33]. T3 homozygous seedlings were analyzed after selection with hygromycin (50 mg/mL).
Seeds of Arabidopsis thaliana ecotype Columbia (WT) and ANR mutant (ban) (SALK_040250C) were obtained from the Arabidopsis Biological Resource Center (ABRC, United States), and their seedlings were used as a control of the PeANR4 transgenic lines.

2.7. Fresh and Dry Weight Measurement of Transgenic Plants

The 21 d (days) seedlings were collected and immediately put into a small plastic ziplock bag of known weight. The samples were weighed to determine the fresh weight (FW, mg) by the total weight minus the bag weight. Then, the samples were taken out of the bag, re-wrapped in foil, and put in an oven to dry at 70 °C for 3 d. The dry weight (DW, mg) was determined by the total weight minus the foil weight (DW, mg).

2.8. Measurement of PAs and DMACA Staining

The extraction of PAs was conducted according to a previous study [34]. Absorption was measured at 640 nm at one-minute intervals for 20 min to obtain the highest readings. Triple technical replicates were performed to obtain mean values. The total PA levels were calculated using the standard molar absorbance curve prepared using catechin (Yuanye, Shanghai, China).
DMACA (p-dimethylamino cinnamaldehyde) can turn mature dry seeds containing PAs dark purple/brown because of other pigments in the seed and the quantity of PAs detected [35]. For the detection of the PAs in seed coat, the seeds were soaked in a 1% w/v solution of DMACA and prepared in ethanol/6 N HCl (1:1) for 1 h; then, photograph records were taken using a camera (SONY DSC-HX50).

2.9. Treatments of Osmotic and Salt Stress

Germination rate: the seeds of transgenic lines, WT, and ban were subjected to sterilization and then sowed on 1/2 MS media containing different concentrations of mannitol (0 mmol/L, 100 mmol/L, 200 mmol/L, and 300 mmol/L) or NaCl (0 mmol/L, 50 mmol/L, 75 mmol/L, and 100 mmol/L), respectively. The germination rate was counted within 7 d [36].
Root length: the seeds of transgenic lines, WT and ban were subjected to sterilization and evenly sown onto 1/2 MS media. After germination for 5 d, the seedlings were transplanted to 1/2 MS medium containing different concentrations of mannitol (0 mmol/L, 100 mmol/L, 200 mmol/L, and 300 mmol/L) or NaCl (0 mmol/L, 100 mmol/L, 150 mmol/L, and 200 mmol/L), respectively. The primary root length of Arabidopsis was measured after two weeks.

2.10. Statistical Analysis

SPSS Statistics for Windows (Version 22.0. SPSS Inc., Chicago, IL, USA) was used to conduct the analyses. The statistical significance of variations in means was assessed using SPSS software and a one-way analysis of variance. Significant differences were determined by Fisher’s Least-Significant-Difference test and indicated at * 0.01 ≤ p ≤ 0.05, ** p < 0.01, and ns: p > 0.05.

3. Results

3.1. Characterization of LFBGs in Moso Bamboo

Based on BLAST results and conserved domains analysis of the bamboo genome database, a total of 24 LFBGs were obtained, belonging to the families of ANS, DFR, ANR, and LAR. The genes were named as PeANS1-PeANS13, PeDFR1, PeANR1-PeANR5, and PeLAR1-PeLAR5, respectively, as shown in Table S1. The amino acid sequences encoded by PeANSs range from 305 aa (PeANS10) to 443 aa (PeANS12) residues, with molecular weights ranging from 34.10 kDa to 48.23 kDa and theoretical isoelectric points between 5.36 (PeANS5) and 7.01 (PeANS1). All of them are predicted to be localized in the cytoplasm. PeDFR1 encodes a protein of 356 aa, with a molecular weight of 38.94 kDa and a theoretical isoelectric point of 5.51, which is predicted to be localized in both chloroplast and cytoplasm. The amino acid sequences encoded by PeANRs range from 305 aa (PeANR3) to 338 aa (PeANR2 and PeANR4), with molecular weights ranging from 33.57 kDa to 36.71 kDa and theoretical isoelectric points between 4.99 (PeANR2) and 6.17 (PeANR3). PeANRs are predicted to be localized in both Golgi apparatus and cytoplasm. The amino acid sequences encoded by PeLARs range from 309 (PeLAR4) to 352 (PeLAR1) residues, with molecular weights ranging from 33.39 kDa to 38.15 kDa and theoretical isoelectric points between 5.39 (PeLAR1) and 6.65 (PeLAR5). PeLARs are predicted to be localized in both chloroplasts and cytoplasm.
To further reveal the similarity and diversity of the LFBGs in bamboo, gene structure analysis was conducted online (Figure S2). The result revealed that the number of introns in PeANSs varied from one to four, with four PeANSs containing one intron, six PeANSs containing two introns, and PeANS9 and PeANS10 with three introns. All PeANRs contained five introns except PeANR3 with six introns. PeLAR1 and PeLAR4 had four introns and the remaining three PeLARs had three introns. PeDFR1 contained four introns. The gene structure differences between these LFBGs indicate they may function differently in bamboo.

3.2. Phylogenetic Analysis of ANS, DFR, ANR, and LAR

LAR and ANR are members of the reductase-epimerase-dehydrogenase (RED) superfamily. ANS and LAR both use leucoanthocyanins as substrates, but ANS is a member of the superfamily of 2-oxy-glutarate-dependent dioxygenase (2-ODD). The phylogenetic tree of LAR, ANR, ANS, and DFR protein sequences of bamboo and other species was constructed (Figure 1). The tree was clearly divided into two clades: one clade consisted of RED proteins, and the other consisted of ANS proteins.
IFR and LAR formed a subgroup that was distantly connected to the subgroup made up by ANR and DFR groups. PeDFR1 had the highest homology with OsDFR and clustered with DFRs from other monocotyledonous plants (rice, wheat (Triticum aestivum), and maize (Zea mays)), suggesting that they all have the function of catalyzing dihydroflavonols to produce colorless anthocyanidins. PeANR2 and PeANR4 clustered with ZmANR, and PeANR3 and PeANR5 cluster with ANRs from Brachypodium distachyon and Hordeum vulgare; it was speculated that they may have similar functions correspondingly. PeLAR1 and the LARs of rice, wheat, and barley were grouped in the same branch. However, the other four bamboo LARs were separated from PeLAR1 and dispersed in the other two branches, and the specific reason for this requires further exploration. In the clade of ANS, all ANSs of monocotyledon plants clustered away from those of dicotyledon plants, which is consistent with the evolution of monocotyledon and dicotyledon plants.

3.3. Expression Patterns of LFBGs in Different Tissues of Moso Bamboo

Tissue-specific analysis of genes can predict their function to some extent. In this study, we analyzed the expression patterns of the LFBGs in different tissues of moso bamboo (Figure 2). Most LFBGs had high expression levels in roots, leaves, and shoots. However, a few genes showed tissue-specific expression, such as PeANS2, PeANS8, PeANS10, and PeANS11 only highly expressed in leaves, and PeANS9 only highly expressed in the basal part of 6.7 m (meters) shoots. Except for PeANR1 undetected, the other four PeANRs were detected in all tissues with higher expression level in roots and leaves. Only PeLAR2 and PeLAR3 were expressed in different tissues, while the other three PeLARs had higher expression levels only in roots or leaves. PeDFR1 was highly expressed in roots and hardly detected in shoots.
To further predict the function of LFBGs, we screened differentially expressed genes (DEGs) using published transcriptome data from bamboo shoots at different heights [29]. The results show that 16 DEGs had higher expression levels in shoots, which were higher in mature shoots than in younger ones. Most PeANSs had higher expression levels and changed significantly in the upper part of shoots with different heights. Most PeANRs and PeLARs had a rising trend in shoots with different heights, suggesting they function in a sequential manner. The expression level of PeDFR1 was higher in the top part of 2.0 m shoots and the middle part of 4.0 m shoots (Figure S3). These expression differences of the different genes in different bamboo tissues indicate that they may function differently.

3.4. Expression Patterns of LFBGs in Bamboo Leaves under Drought and Cold Stress

In order to investigate whether the expression of LFBGs was related to abiotic stress, we plotted their expression patterns using transcriptome data from drought and cold stress. The result showed that only nine of 24 LFBGs had significant changes under drought and cold stress, including five ANSs, three ANRs, and one LAR, most of which had an up-regulated expression tendency (Figure S4). Furthermore, four genes (PeANS2, PeANS3, PeANR2, and PeANR4) were carefully selected for qPCR analysis. The qPCR results show that four genes revealed the increased expression of all four genes (Figure 3). Four genes all reached the highest level at 8 h (hours), and PeANR4 was continuously upregulated during the drought and cold treatments. These expression patterns indicate that these four genes were induced by drought and cold stress.

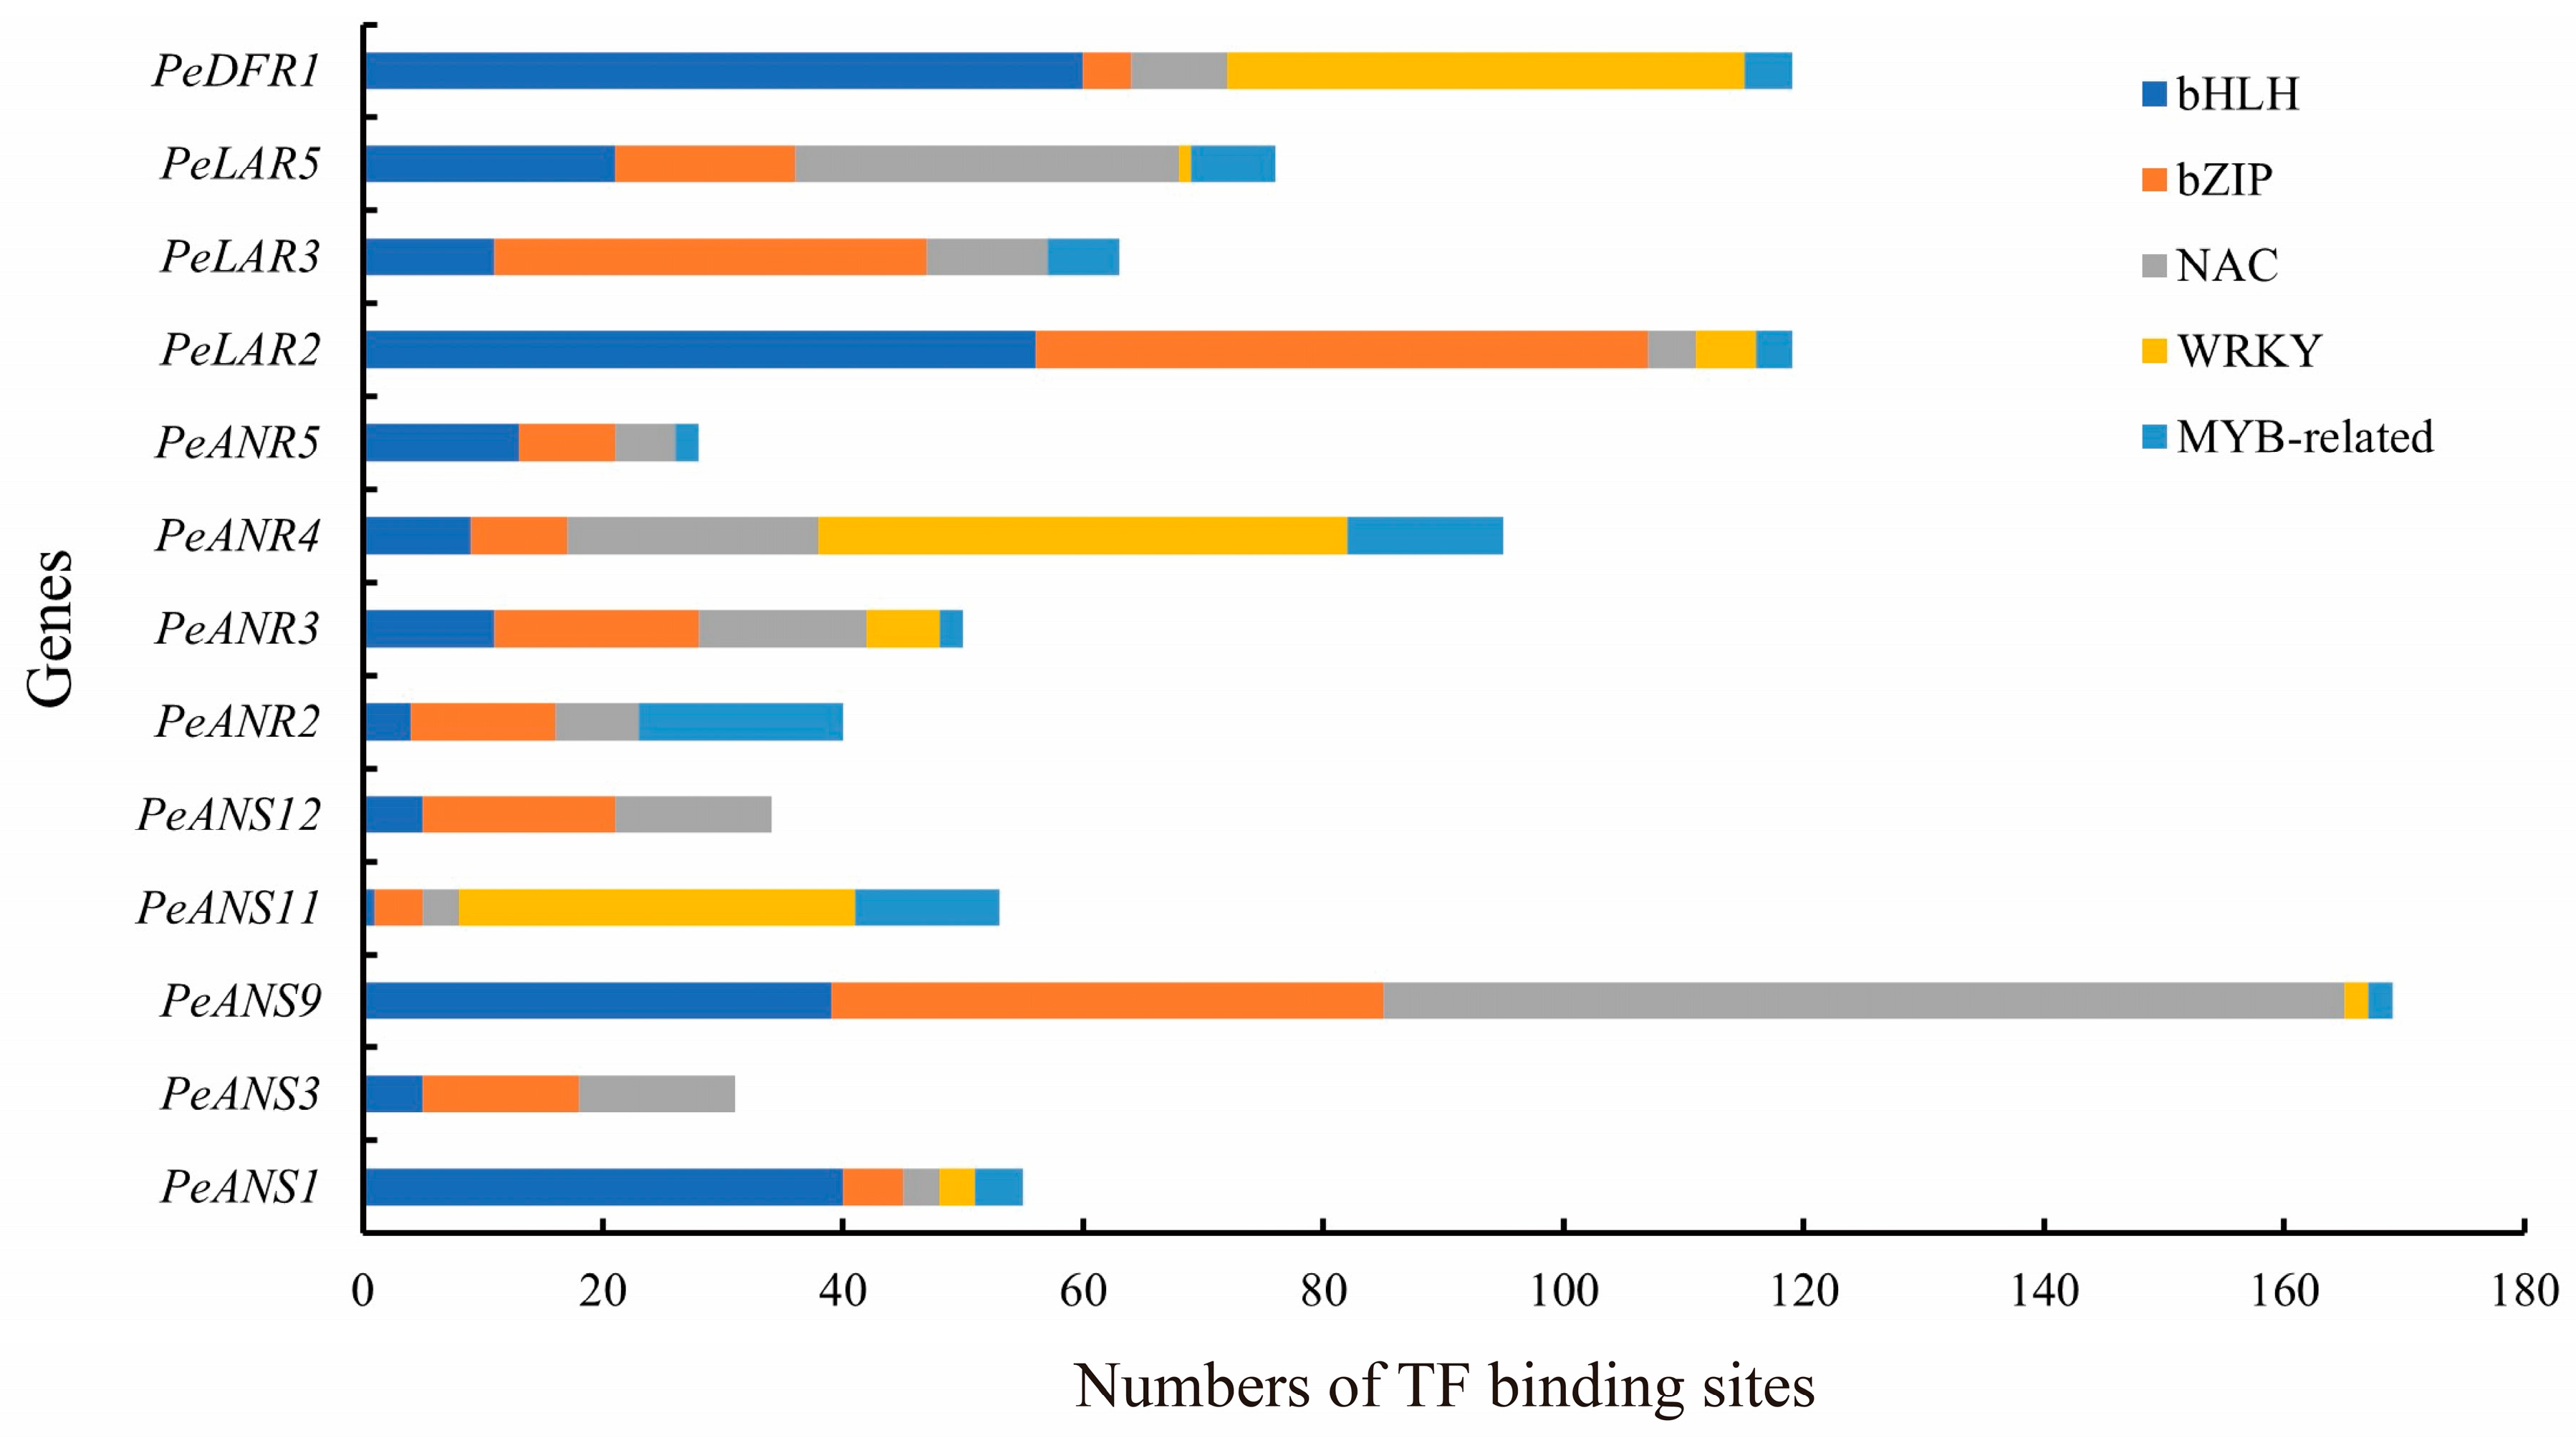
3.5. TF Binding Sites in LFBG Promoters of Moso Bamboo

To investigate the regulatory mechanisms of 16 differentially expressed genes involved in flavonoid biosynthesis, analysis of TF regulatory elements in the gene promoters was conducted. The results show that the binding sites of bHLH, bZIP, MYB, MYB-related, NAC, and WRKY were identified in the 1000 bp upstream sequences of these genes (Table S2). As shown in Figure 4, the binding sites of MYB, bZIP, and NAC were the most widely distributed in the promoters of all 16 differentially expressed genes. The top two numbers of MYB binding sites were 103 and 107, found in the promoters of PeANR4 and PeDFR1, respectively, while those of other PeANRs ranged from 3 to 71. The highest number of bZIP binding sites was 51, which appeared in the promoter of PeLAR2, while those of other PeANRs ranged from 4 to 46. The highest number of NAC binding sites was 80 in the promoter of PeANS9, while those of other PeANSs were 3 to 32. Among all the 16 differentially expressed genes, PeANR4 had all six types of TF binding sites in its promoter regions, and each type of binding site had more than three occurrences, which indicates that it may be regulated by multiple types of TFs and PAs synthesis to form a complex regulatory network.

3.6. Co-Expression Network Construction and Validation by Y1H

A total of 146 differentially expressed transcription factors (DETFs) were identified. These DETFs include important TF families such as MYB/MYB-related, NAC, WRKY, bHLH, and bZIP, which are speculated to play important regulatory roles in the expression of LFBGs. Co-expressed gene pairs were selected based on correlation analysis of LFBGs and DETFs, and a co-expression network was finally constructed, which consisted of PeANR4 and 27 DETFs, including two bHLH, five bZIP, five MYB, three MYB-related, 11 NAC, and one WRKY (Figure 5a).
The regulatory relationship between the TF and its target gene can be verified by Y1H assays. The results show that the yeasts harboring pGADT7-Rec2-TFs + pHIS2-PeANR4pro, and the positive controls of p53HIS2 and pGADT7-Rec2-53 could grow normally on triple-dropout medium. However, those negative controls of p53HIS2 + pGADT7-Rec2-TFs could not grow (Figure 5b). Therefore, they confirm that Pe_02572_MYB-related, Pe_06298_ MYB-related, Pe_05802_NAC, and Pe_08630_NAC could bind to the promoter of PeANR4, suggesting that the expression of PeANR4 may be regulated by these four TFs.

3.7. Ectopic Expression of PeANR4 in Arabidopsis

PeANR4 was transformed into Arabidopsis. Four PeANR4 overexpressing transgenic lines were obtained and identified by qPCR (Figure S3). OE-1 and OE-2 were used as further experiments due to their high expression levels. The results show that overexpression of PeANR4 significantly altered the growth characteristics of Arabidopsis plants. Under the same culture conditions, OE-1 and OE-2 had significantly larger rosette leaf areas compared to WT and ban, and ban had the smallest one (Figure 6a). Compared with the seed coat of ban, light brown, and that of WT, dark brown, the seed coat of OE-1 and OE-2 was deep-dark brown (Figure 6b), and the DMACA staining results supported this obviously (Figure 6c), indicating that the expression of PeANR4 had an effect on seed development.
The biomass measurement of 3-week-old Arabidopsis seedlings shows that OE-1 and OE-2 have higher fresh and dry weight than WT and ban plants (Figure 6d,e). These findings suggest that PeANR4 may play a role in promoting the growth of Arabidopsis plants during the vegetative growth stage. Further measurement shows that OE-1 and OE-2 have higher PA content in leaves and seeds than other plants (Figure 6f,g). These results suggest that overexpressing PeANR4 affects the growth and development of transgenic plants by participating in PAs biosynthesis.

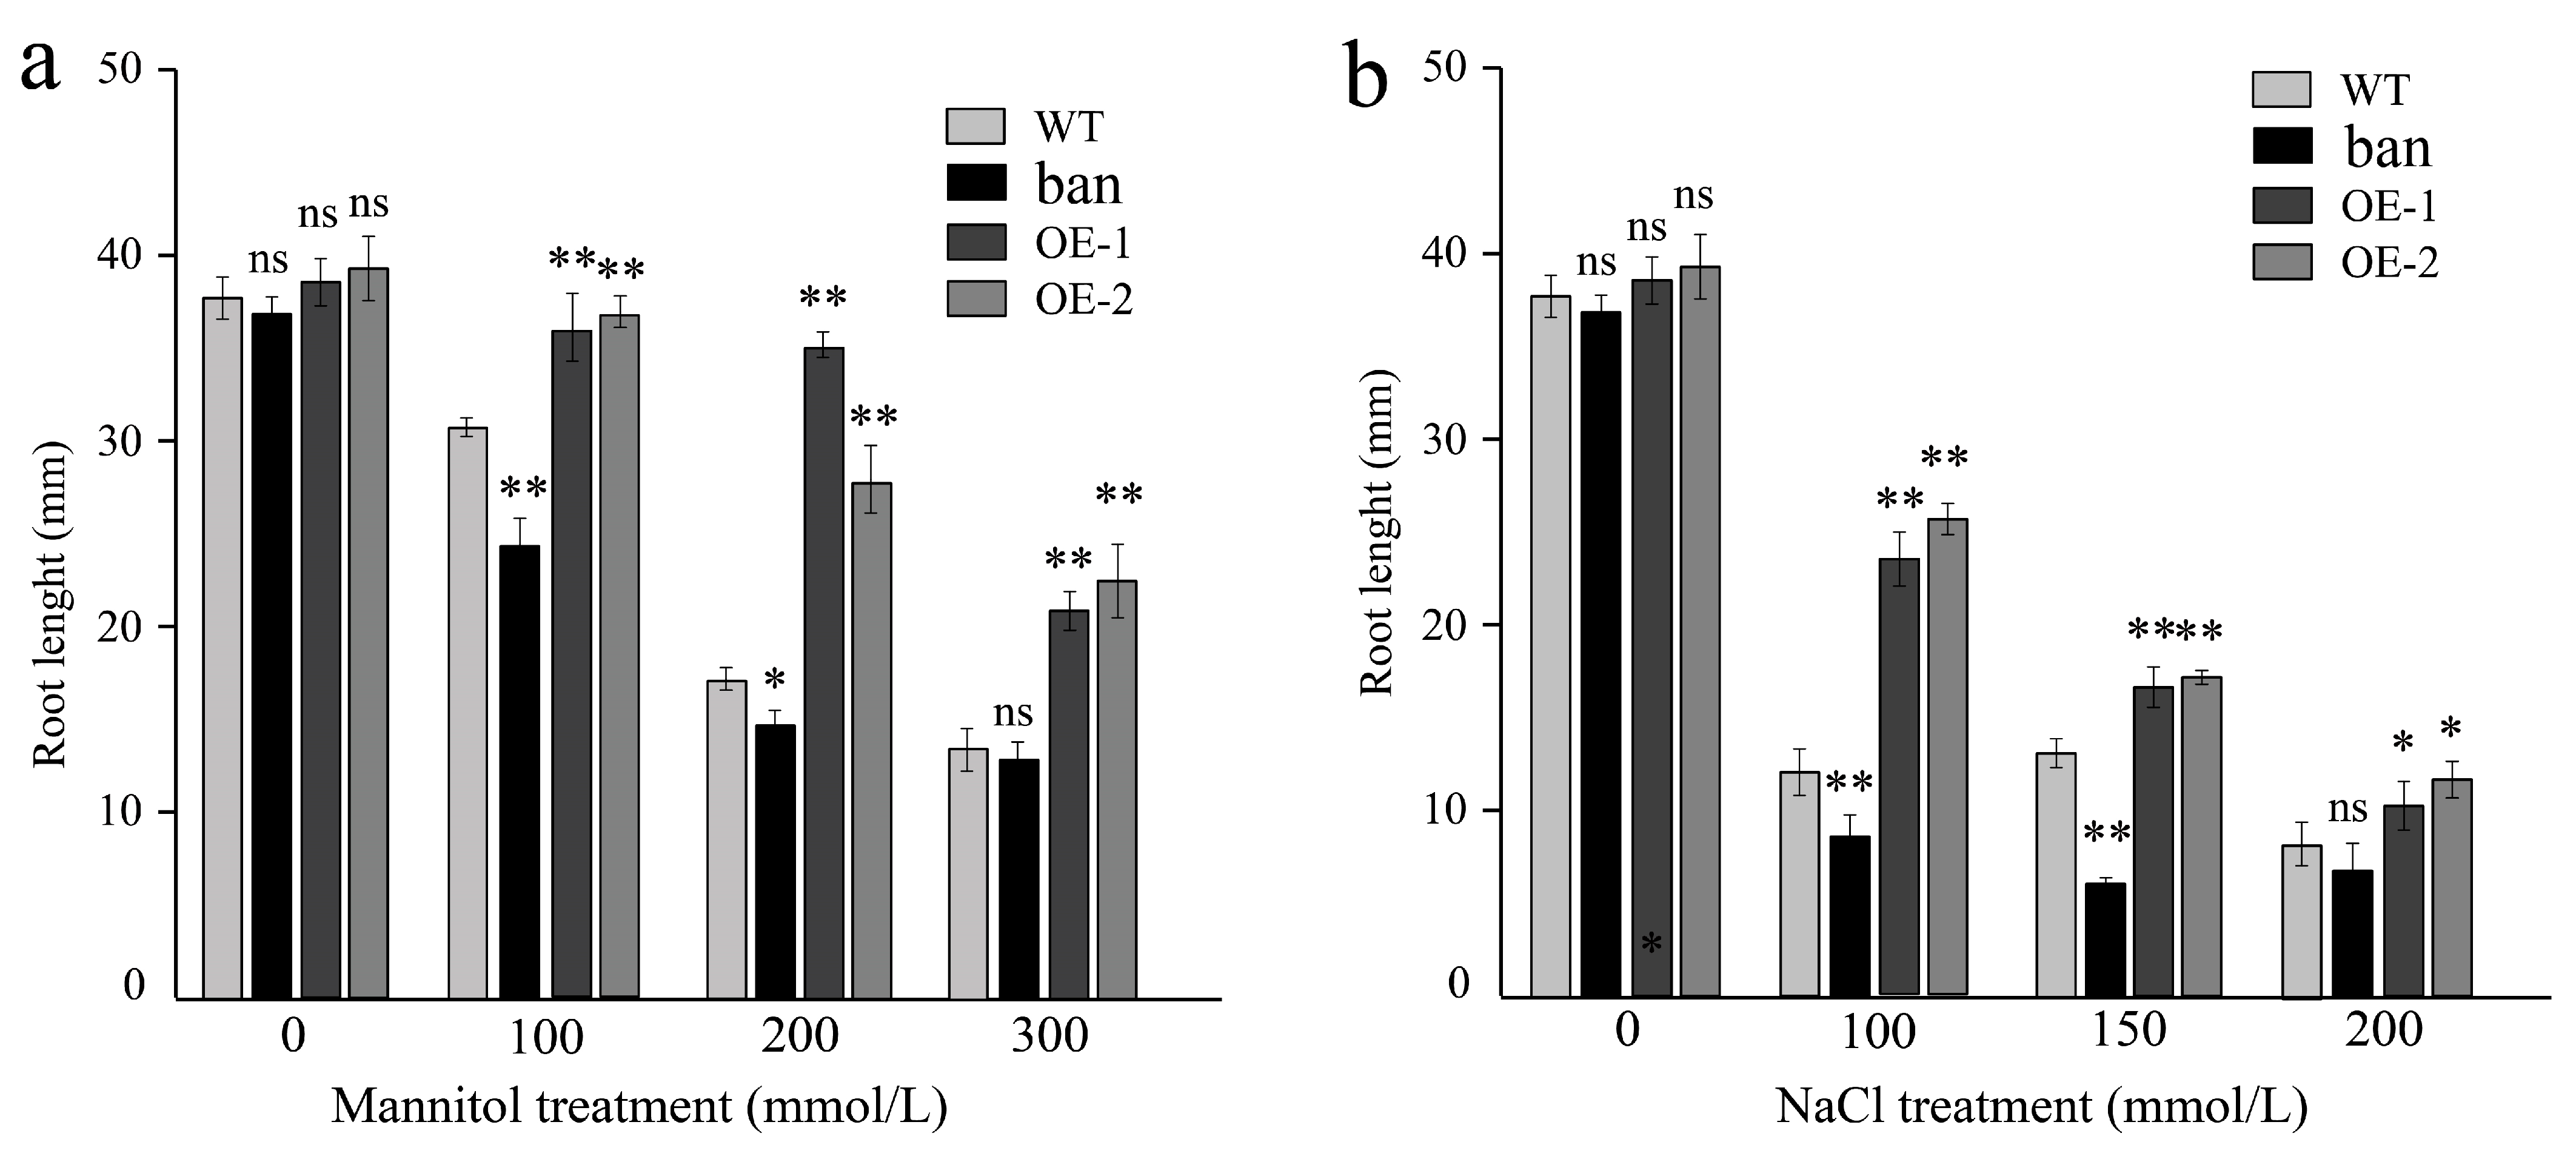
3.8. Effects of Osmotic and Salt Stress on PeANR4 Transgenic Arabidopsis

To test the tolerance of Arabidopsis plants overexpressing PeANR4 to abiotic stress, seeds were sown on 1/2 MS medium containing mannitol and NaCl, respectively, and the germination rates of each line were counted during 7 d. The results show that there was no significant difference in germination rates of the transgenic lines WT and ban on medium without mannitol and NaCl, but the germination rates were all inhibited on the medium with mannitol (Figure 7a) and NaCl (Figure 7b). Further statistics show that the germination rates of OE-1 and OE-2 were significantly higher than those of WT after 4 d on medium with 100 mmol/L mannitol and after 3 d on medium with 150 and 200 mmol/L mannitol, and those of ban were the lowest (Figure 7c). The germination rate of the transgenic lines WT and ban on medium without 50 mmol/L NaCl showed no significant difference, while those of transgenic lines were significantly higher than those of WT after 3 d on medium with 75 and 100 mmol/L NaCl, and those of ban were the lowest (Figure 7d). These results suggest that overexpressing PeANR4 may be helpful to improve the germination of seeds under abiotic stress.
Furthermore, the five-day transgenic lines were transplanted to 1/2 MS medium with different treatments, followed by vertical plate culture for 7 d. With increasing concentrations of mannitol and NaCl, the inhibition of root growth became more obvious, but overall, roots of OE-1 and OE-2 plants suffered less inhibition than those of WT and ban; those of ban were most severe (Figures S4 and S5). Further statistics show that the average primary root lengths of OE-1 and OE-2 plants were significantly longer than those of WT and ban; those of ban were the shortest under treatments of mannitol (Figure 8a) and NaCl (Figure 8b). These results indicate that overexpressing PeANR4 reduces the inhibitory effect on root growth under osmotic and salt stress.

4. Discussion

4.1. Evolution of Flavonoid Biosynthesis

From the phylogenetic, chemotaxonomic, enzymatic, and molecular perspectives, the evolution of flavonoids has been thoroughly investigated and debated [37,38]. The oldest vascular plants, ferns, are the source of the biosynthetic branch route of PAs [39]. Gymnosperms, angiosperms, and ferns all have been shown to contain flavanols, which are precursors to PAs production [40]. For instance, early gene duplication led to the formation of novel enzymes or activities, such as CHS, F3H, and CHI [41,42,43]. Studies have shown that ANS participates in the particular downstream step that catalyzes the formation of anthocyanins and PAs, which is the oxidative alteration of the flavonoid main chain C-ring [43]. The evolutionary relationships of early flavonoid biosynthesis genes in moso bamboo have been investigated, and they suggest that PeCHS14 and PeCHS16 may have the function of chalcone synthesis and that PeCHI1 and PeCHI5 have the function of naringin synthesis [44].
Research has shown that ANRs and LARs are key enzymes in the synthesis of flavan-3-ols [45,46,47]. ANRs are widely present in gymnosperms and angiosperms, but homologs of ANR have not yet been discovered in ferns [48]. The evolutionary analysis of the ANR homologs is consistent with the findings of our investigation. Studies had revealed that LAR proteins, which were assumed to fulfill the role of IFR proteins, were most linked to Arabidopsis IFR proteins [35]. Our study indicates that four PeLARs (except PeLAR1) are clustered close with IFR proteins in the phylogenetic tree, suggesting they may have similar function. According to previous studies, just one DFR gene should be the target for defining the color of flowers. OsDFR is the main reason for the purple coloration of the stigma in flowers [49]. We also found that PeDFR1, the sole DFR identified in bamboo, clustered in the same clade with OsDFR, indicating PeDFR1 has a similar function to OsDFR.

4.2. Regulation of Flavonoid Biosynthesis

The regulation of flavonoid synthesis-related genes has been extensively studied, especially in MYB TFs. LvMYB5 in lilium brownie was reported to enhance the expression of NbDFR and NbANS, thereby promoting the accumulation of anthocyanins in plants [50]. MrMYB39 and MrMYB58a in Myrica rubra were shown to activate the promoter of MrLAR1, leading to increased synthesis of flavanols in plants [51]. In addition, some TFs were found to negatively regulate flavonoid synthesis. MYB165 and MYB194 in populus were identified as the main inhibitors of the flavonoid pathway, as they interacted with bHLH131, resulting in reduced synthesis of anthocyanins and PAs [52]. PbMYB10b in Pyrus bretschneideri activates the promoter of the PbANR gene, resulting in increased PAs and anthocyanins synthesis [53]. FvMYB and FvbHLH in Fragaria vesca formed a binary complex that activated the DFR promoter and promoted the accumulation of PAs [54]. NtMYB12 in Narcissus tazetta was found to activate NtLAR expression and inhibit NtDFR expression, resulting in low levels of anthocyanins [55]. MdMYB9 in Malus domestica was shown to activate the promoters of ANR genes, contributing to increased synthesis of anthocyanins and PAs [56]. In this study, the most commonly studied and abundant families of transcription factors were MYB, MYB-like, and NAC.
In order to investigate the transcriptional regulation of PeANR4 in the synthesis of PAs in bamboo, Y1H assays were conducted; the results show that two PeMYB-related proteins could bind to the promoter of PeANR4, suggesting that these PeMYB-related proteins play an important role in regulating the synthesis of PAs in moso bamboo [57]. This is consistent with the important role of MYBs in regulating the synthesis of PAs in other plants, such as MYBs in apple and poplar that can directly regulate the ANR promoter to promote the synthesis of PAs [56,58]. Although MdNAC52 in apple can induce the expression of MdLAR by binding to its promoter, thereby synthesizing PAs [59], there has been little attention on whether NAC can directly regulate the expression of the ANR promoter. Our study suggests that PeNACs may regulate the PAs synthesis by binding to the promoter of PeANR4, but further studies are needed to confirm this transcriptional regulation in bamboo.

4.3. PAs Synthesis Affecting Plant Growth and Stress Tolerance

As a flavonoid compound, PAs play a crucial role in plant coloration and sexual reproduction and act as an important stress-responsive compound. Their role has been well studied in Arabidopsis, M. truncatula, and V. vinifera. In mango (Mangifera indica), PAs are important flavonoids and major contributors to fruit flavor and antioxidant capacity [59]. In Arabidopsis and M. truncatula, PAs function mostly in the seed husk. Owing to lack of PAs biosynthesis, accordingly the seed coat turns into light brown, different from the normal color [60,61,62]. According to previous research, ectopic expression of the MdANR gene leads to increased accumulation of PAs in transgenic tobacco petals [34]. The expression of the TcANR gene in Arabidopsis mutant complements phenotype [63].
Water loss from the plant body can affect its growth and development [64]. High salt concentrations can also lead to imbalanced water metabolism in plants. The high concentration of soluble salt affects the plant’s ability to absorb water from the surrounding soil, thereby causing physiological drought [65]. Early steps of PA biosynthesis had been reported to generate a concomitant contribution to help legume models (M. truncatula) enhance environmental adaptations and resistances to biotic and abiotic stresses [1,66]. Transformation of MdMYB3 into Arabidopsis thaliana enhanced the expression of the anthocyanin synthesis genes (LAR and ANR) in Arabidopsis under drought stress [67]. In previous studies, PAs regulated the activity of some key enzymes that controlled the levels of reactive oxygen species and antioxidant capacity during seed germination. Under high oxidative stress, the germination rate of PA-deficient mutants was lower than that of wild-type plants [68]. Under abiotic stress, the accumulation of anthocyanin in the roots of Cinnamomum camphora increased, further promoting root elongation [69]. In this study, under osmotic and salt stress, overexpression of PeANR4 improved the germination rate of Arabidopsis seeds. Moreover, compared with wild-type and mutant plants, the PeANR4 transgenic plants had longer primary roots and showed a better performance, indicating that the stress tolerance of transgenic plants was improved.

5. Conclusions

Bamboo is an important source of flavonoids with great economic value, while the flavonoid biosynthetic pathway and regulation are very complex. This study presents a full understanding of the LFBGs in bamboo. A total of 24 genes belonging to four different gene families of ANS, DFR, ANR, and LAR were identified, among which 16 were DEGs associated with different shoot heights. There are six types of TF binding sites in the promoters of these DEGs, and a co-expression network was constructed with the key anthocyanidin reductase gene PeANR4 and 27 TFs. Two MYB-related and two NAC TFs activating the promoter of PeANR4 were validated by Y1H assays. Moreover, overexpression of PeANR4 promoted growth and PAs synthesis in transgenic Arabidopsis plants, which enhanced tolerance to abiotic stress. Overall, this study provides a reference for revealing the molecular mechanism of bamboo flavonoid biosynthesis and has important practical significance for the development of flavonoid-rich bamboo.

Supplementary Materials

The following supporting information can be downloaded at: https://www.mdpi.com/article/10.3390/f14071399/s1, Figure S1: Scheme of the proanthocyanidin synthesis pathway [69]; Figure S2: Structural features of the genes involved in late-stage of flavonoids biosynthesis in moso bamboo; Figure S3: Expression analysis of PeANR4 in transgenic Arabidopsis. Asterisks indicate the significant level (* 0.01 ≤ p ≤ 0.05, ** p < 0.01, ns: p > 0.05); Figure S4: Root length phenotype of WT, ban, OE-1 and OE-2 lines under osmotic stress. Scale bar: 1 cm; Figure S5: Root length phenotype of WT, ban, OE-1 and OE-2 lines under salt stress Scale bar: 1 cm; Figure S6: Root length phenotype of ban, WT, OE-1 and OE-2 lines under osmotic stress. Scale bar: 1 cm; Figure S7: Root length phenotype of ban, WT, OE-1 and OE-2 lines under salt stress. Scale bar: 1 cm; Table S1: Putative basic physical and chemical characteristics of proteins encoded by the genes involved in late-stage of flavonoids biosynthesis in moso bamboo; Table S2: Numbers of the putative transcription factor binding sites detected in the promoter of genes involved in late-stage of flavonoids biosynthesis in moso bamboo; Table S3: Primer sequences used in this study.

Author Contributions

Conceptualization, X.X. and Z.G.; methodology, C.Z.; software, K.Y. and Y.L.; validation, X.X., C.Z. and K.Y.; formal analysis, Y.L.; investigation, K.Y.; resources, C.Z.; data curation, X.X.; writing—original draft preparation, X.X. and C.Z.; writing—review and editing, X.X.; visualization, X.X.; supervision, Z.G.; project administration, Z.G.; funding acquisition, Z.G. All authors have read and agreed to the published version of the manuscript.

Funding

This research was funded by the National Key Research and Development Program of China (Grant No. 2021YFD2200502). The funding recipient is corresponding author Zhimin Gao. The funding agency was not involved in the design of the study, collection, analysis, interpretation of data, and writing the manuscript.

Data Availability Statement

All data generated or analyzed during this study are included in the article and its information files.

Conflicts of Interest

The authors declare no conflict of interest.

Abbreviations

ANRAnthocyanidin reductase
CDSCoding sequence
DEGsDifferentially expressed genes
DETFsDifferentially expressed transcription factors
DFRDihydroflavonol 4-reductase
DMACAp-Dimethylamino cinnamaldehyde
DWDry weight
FPKMFragments per kilobase per million
FWFresh weight
LARLeucoanthocyanidin reductase
LDOX/ANS(Leuco)anthocyanidin dioxygenase
LFBGsLate flavonoid biosynthesis genes
MATEMultidrug and toxic compound extrusion
PAsProanthocyanidins or condensed tannins
PCCPearson correlation coefficient
ROSReactive oxygen species
TFTranscription factor
Y1HYeast one-hybrid

References

  1. Dixon, R.A.; Xie, D.Y.; Sharma, S.B. Proanthocyanidins—A final frontier in flavonoid research? New Phytol. 2005, 165, 9–28. [Google Scholar] [CrossRef] [PubMed] [Green Version]
  2. Martin, C.; Prescott, A.; Mackay, S.; Bartlett, J.; Vrijlandt, E. Control of anthocyanin biosynthesis in flowers of Antirrhinum majus. Plant J. 1991, 1, 37–49. [Google Scholar] [CrossRef] [PubMed]
  3. Saslowsky, D.; Winkel-Shirley, B. Localization of flavonoid enzymes in Arabidopsis roots. Plant J. 2001, 27, 37–48. [Google Scholar] [CrossRef]
  4. Winkel-Shirley, B. Biosynthesis of flavonoids and effects of stress. Curr. Opin. Plant Biol. 2002, 5, 218–223. [Google Scholar] [CrossRef]
  5. Xu, Z.C.; Yin, J.; Zhou, B.; Liu, Y.T.; Yu, Y.; Li, G.Q. Grape seed proanthocyanidin protects liver against ischemia/reperfusion injury by attenuating endoplasmic reticulum stress. World J. Gastroenterol. 2015, 21, 7468–7477. [Google Scholar] [CrossRef]
  6. Bakheet, S.A.; Alhuraishi, A.M.; Al-Harbi, N.O.; Al-Hosaini, K.A.; Al-Sharary, S.D.; Attia, M.M.; Alhoshani, A.R.; Al-Shabanah, O.A.; Al-Harbi, M.M.; Imam, F.; et al. Alleviation of aflatoxin B1-induced genomic damage by proanthocyanidins via modulation of DNA repair. J. Biochem. Mol. Toxicol. 2016, 30, 559–566. [Google Scholar] [CrossRef]
  7. Lepiniec, L.; Debeaujon, I.; Routaboul, J.M.; Baudry, A.; Pourcel, L.; Nesi, N.; Caboche, M. Genetics and biochemistry of seed flavonoids. Annu. Rev. Plant Biol. 2006, 57, 405–430. [Google Scholar] [CrossRef]
  8. Winkel-Shirley, B. It takes a garden. How work on diverse plant species has contributed to an understanding of flavonoid metabolism. Plant Physiol. 2001, 127, 1399–1404. [Google Scholar] [CrossRef]
  9. Bogs, J. Proanthocyanidin synthesis and expression of genes encoding leucoanthocyanidin reductase and anthocyanidin reductase in developing grape berries and grapevine leaves. Plant Physiol. 2005, 139, 652–663. [Google Scholar] [CrossRef] [Green Version]
  10. Pang, Y.; Peel, G.J.; Sharma, S.B.; Tang, Y.; Dixon, R.A. A transcript profiling approach reveals an epicatechin-specific glucosyltransferase expressed in the seed coat of Medicago truncatula. Proc. Natl. Acad. Sci. USA 2008, 105, 14210–14215. [Google Scholar] [CrossRef] [PubMed]
  11. Zhao, J.; Dixon, R.A. MATE transporters facilitate vacuolar uptake of epicatechin 3′-O-glucoside for proanthocyanidin biosynthesis in Medicago truncatula and Arabidopsis. Plant Cell 2009, 21, 2323–2340. [Google Scholar] [CrossRef] [PubMed] [Green Version]
  12. Zhao, J.; Pang, Y.; Dixon, R.A. The mysteries of proanthocyanidin transport and polymerization. Plant Physiol. 2010, 153, 437–443. [Google Scholar] [CrossRef] [Green Version]
  13. Xie, D.Y.; Sharma, S.B.; Paiva, N.L.; Ferreira, D.; Dixon, R.A. Role of anthocyanidin reductase, encoded by BANYULS in plant flavonoid biosynthesis. Science 2003, 299, 396–399. [Google Scholar] [CrossRef] [Green Version]
  14. Devic, M.; Guilleminot, J.; Debeaujon, I.; Bechtold, N.; Bensaude, E.; Koornneef, M.; Pelletier, G.; Delseny, M. The BANYULS gene encodes a DFR-like protein and is a marker of early seed coat development. Plant J. 1999, 19, 387–398. [Google Scholar] [CrossRef]
  15. Pelletier, M.K.; Murrell, J.R.; Shirley, B.W. Characterization of flavonol synthase and leucoanthocyanidin dioxygenase genes in Arabidopsis. Further evidence for differential regulation of “early” and “late” genes. Plant Physiol. 1997, 113, 1437–1445. [Google Scholar] [CrossRef] [Green Version]
  16. Pang, Y.; Peel, G.J.; Wright, E.; Wang, Z.; Dixon, R.A. Early steps in proanthocyanidin biosynthesis in the model legume Medicago truncatula. Plant Physiol. 2007, 145, 601–615. [Google Scholar] [CrossRef] [PubMed] [Green Version]
  17. Zhao, H.; Zhao, S.; Fei, B.; Liu, H.; Yang, H.; Dai, H.; Wang, D.; Jin, W.; Tang, F.; Gao, Q.; et al. Announcing the genome atlas of bamboo and gattan (GABR) project: Promoting research in evolution and in economically and ecologically beneficial plants. Gigascience 2017, 6, 1–7. [Google Scholar] [CrossRef] [Green Version]
  18. Wedler, J.; Daubitz, T.; Schlotterbeck, G.; Butterweck, V. In vitro anti-inflammatory and wound-healing potential of a Phyllostachys edulis leaf extract--identification of isoorientin as an active compound. Planta Med. 2014, 80, 1678–1684. [Google Scholar] [CrossRef] [PubMed]
  19. Gong, J.; Xia, D.; Huang, J.; Ge, Q.; Mao, J.; Liu, S.; Zhang, Y. Functional components of bamboo shavings and bamboo leaf extracts and their antioxidant activities in vitro. J. Med. Food 2015, 18, 453–459. [Google Scholar] [CrossRef]
  20. Shu, G.; Kong, F.; Xu, D.; Yin, L.; He, C.; Lin, J.; Fu, H.; Wang, K.; Tian, Y.; Zhao, X. Bamboo leaf flavone changed the community of cecum microbiota and improved the immune function in broilers. Sci. Rep. 2020, 10, 12324. [Google Scholar] [CrossRef]
  21. Yu, Y.; Li, Z.; Cao, G.; Huang, S.; Yang, H. Bamboo leaf flavonoids extracts alleviate oxidative stress in HepG2 cells via naturally modulating reactive oxygen species production and Nrf2-mediated antioxidant defense responses. J. Food Sci. 2019, 84, 1609–1620. [Google Scholar] [CrossRef]
  22. Li, H.; Chen, Y.; Peng, Q.; Tan, X.; Chen, G.; Zhou, H.; Yan, R. Flavonoids from bamboo leaves improve the stability of unsaturated fatty acids in the lipids of walnut emulsions. Ind. Crops Prod. 2022, 178, 114609. [Google Scholar] [CrossRef]
  23. Wang, J.; Yue, Y.D.; Tang, F.; Sun, J. TLC screening for antioxidant activity of extracts from fifteen bamboo species and identification of antioxidant flavone glycosides from leaves of Bambusa. textilis McClure. Molecules 2012, 17, 12297–12311. [Google Scholar] [CrossRef] [Green Version]
  24. Wang, H.; Lu, P.; Li, Z.; Yuan, C.; Liu, H.; Zhao, J.; Lu, W.; Wang, J. Oligomeric proanthocyanidins and bamboo leaf flavonoids improve the quality of bull semen cryopreservation. Molecules 2022, 27, 1144. [Google Scholar] [CrossRef] [PubMed]
  25. Wang, Y.; Zhang, Y.; Cheng, J.; Zhao, J.; Shi, R.; He, L.; Li, Q.; Chen, Y. Efficient purification of flavonoids from bamboo shoot residues of Phyllostachys edulis by macroporous resin and their hypoglycemic activity. Food Chem. X 2022, 16, 100505. [Google Scholar] [CrossRef]
  26. Sun, H.; Wang, S.; Zhu, C.; Yang, K.; Liu, Y.; Gao, Z. A new biotechnology for in-planta gene editing and its application in promoting flavonoid biosynthesis in bamboo leaves. Plant Methods 2023, 19, 20. [Google Scholar] [CrossRef] [PubMed]
  27. Zhao, H.; Gao, Z.; Wang, L.; Wang, J.; Wang, S.; Fei, B.; Chen, C.; Shi, C.; Liu, X.; Zhang, H.; et al. Chromosome-level reference genome and alternative splicing atlas of moso bamboo (Phyllostachys edulis). Gigascience 2018, 7, giy115. [Google Scholar] [CrossRef]
  28. Huang, Z.; Jin, S.H.; Guo, H.D.; Zhong, X.J.; He, J.; Li, X.; Jiang, M.Y.; Yu, X.F.; Long, H.; Ma, M.D.; et al. Genome-wide identification and characterization of TIFY family genes in moso bamboo (Phyllostachys edulis) and expression profiling analysis under dehydration and cold stresses. Peer J. 2016, 4, e2620. [Google Scholar] [CrossRef] [Green Version]
  29. Yang, K.; Li, L.; Lou, Y.; Zhu, C.; Li, X.; Gao, Z. A regulatory network driving shoot lignification in rapidly growing bamboo. Plant Physiol. 2021, 187, 900–916. [Google Scholar] [CrossRef]
  30. Ma, X.; Zhao, H.; Xu, W.; You, Q.; Yan, H.; Gao, Z.; Su, Z. Co-expression gene network analysis and functional module identification in bamboo growth and development. Front. Genet. 2018, 9, 574. [Google Scholar] [CrossRef] [PubMed]
  31. Yang, K.; Li, Z.; Zhu, C.; Liu, Y.; Sun, H.; Li, X.; Gao, Z. Identification of KFB family in moso bamboo reveals the potential function of PeKFB9 involved in stress response and lignin polymerization. Int. J. Mol. Sci. 2022, 23, 12568. [Google Scholar] [CrossRef]
  32. Fan, C.; Ma, J.; Guo, Q.; Li, X.; Wang, H.; Lu, M. Selection of reference genes for quantitative real-time PCR in bamboo (Phyllostachys edulis). PloS ONE 2013, 8, e56573. [Google Scholar] [CrossRef] [Green Version]
  33. Clough, S.J.; Bent, A.F. Floral dip: A simplified method for Agrobacterium-mediated transformation of Arabidopsis thaliana. Plant J. 1998, 16, 735–743. [Google Scholar] [CrossRef] [Green Version]
  34. Liu, Y.; Shi, Z.; Maximova, S.; Payne, M.J.; Guiltinan, M.J. Proanthocyanidin synthesis in Theobroma cacao: Genes encoding anthocyanidin synthase, anthocyanidin reductase, and leucoanthocyanidin reductase. BMC Plant Biol. 2013, 13, 202. [Google Scholar] [CrossRef] [PubMed] [Green Version]
  35. Stafford, H.A. Flavonoid evolution: An enzymic approach. Plant Physiol. 1991, 96, 680–685. [Google Scholar] [CrossRef] [Green Version]
  36. Ma, Q.; Xia, Z.; Cai, Z.; Li, L.; Cheng, Y.; Liu, J.; Nian, H. GmWRKY16 enhances drought and salt tolerance through an ABA-mediated pathway in Arabidopsis thaliana. Front. Plant Sci. 2019, 9, 1979. [Google Scholar] [CrossRef] [PubMed] [Green Version]
  37. Koes, R.E.; Quattrocchio, F.; Mol, J.N.M. The flavonoid biosynthetic pathway in plants: Function and evolution. BioEssays 1994, 16, 123–132. [Google Scholar] [CrossRef]
  38. Wang, P.; Zhang, L.; Jiang, X.; Dai, X.; Xu, L.; Li, T.; Xing, D.; Li, Y.; Li, M.; Gao, L.; et al. Evolutionary and functional characterization of leucoanthocyanidin reductases from Camellia sinensis. Planta 2018, 247, 139–154. [Google Scholar] [CrossRef] [PubMed] [Green Version]
  39. Peng, Q.Z.; Zhu, Y.; Liu, Z.; Du, C.; Li, K.G.; Xie, D.Y. An integrated approach to demonstrating the ANR pathway of proanthocyanidin biosynthesis in plants. Planta 2012, 236, 901–918. [Google Scholar] [CrossRef]
  40. Verwoert, I.I.; Verbree, E.C.; van der Linden, K.H.; Nijkamp, H.J.; Stuitje, A.R. Cloning, nucleotide sequence, and expression of the Escherichia coli fabD gene, encoding malonyl coenzyme A-acyl carrier protein transacylase. J. Bacteriol. 1992, 174, 2851–2857. [Google Scholar] [CrossRef] [Green Version]
  41. Jez, J.M.; Bowman, M.E.; Dixon, R.A.; Noel, J.P. Structure and mechanism of the evolutionarily unique plant enzyme chalcone isomerase. Nat. Struct. Biol. 2000, 7, 786–791. [Google Scholar]
  42. Winkel-Shirley, B. Flavonoid biosynthesis. A colorful model for genetics, biochemistry, cell biology, and biotechnology. Plant Physiol. 2001, 126, 485–493. [Google Scholar] [CrossRef] [Green Version]
  43. Xiao, X.; Zhu, C.; Yang, K.; Liu, Y.; Li, Z.; Guo, D.; Gao, Z. Low temperature promotes flavonoid synthesis and expression pattern analysis of the related genes in leaves of Phyllostachys edulis. J. Trop. Subtrop. Bot. 2022. accepted. [Google Scholar]
  44. Cheng, A.X.; Han, X.J.; Wu, Y.F.; Lou, H.X. The function and catalysis of 2-oxoglutarate-dependent oxygenases involved in plant flavonoid biosynthesis. Int. J. Mol. Sci. 2014, 15, 1080–1095. [Google Scholar] [CrossRef] [Green Version]
  45. Xie, D.Y.; Sharma, S.B.; Dixon, R.A. Anthocyanidin reductases from Medicago truncatula and Arabidopsis thaliana. Arch. Biochem. Biophys. 2004, 422, 91–102. [Google Scholar] [CrossRef] [Green Version]
  46. Tanner, G.J.; Francki, K.T.; Abrahams, S.; Watson, J.M.; Larkin, P.J.; Ashton, A.R. Proanthocyanidin biosynthesis in plants. Purification of legume leucoanthocyanidin reductase and molecular cloning of its cDNA. J. Biol. Chem. 2003, 278, 31647–31656. [Google Scholar] [CrossRef] [Green Version]
  47. Li, H.; Tian, J.; Yao, Y.Y.; Zhang, J.; Song, T.T.; Li, K.T.; Yao, Y.C. Identification of leucoanthocyanidin reductase and anthocyanidin reductase genes involved in proanthocyanidin biosynthesis in Malus crabapple plants. Plant Physiol. Biochem. 2019, 139, 141–151. [Google Scholar] [CrossRef] [PubMed]
  48. Meng, L.; Qi, C.; Wang, C.; Wang, S.; Zhou, C.; Ren, Y.; Cheng, Z.; Zhang, X.; Guo, X.; Zhao, Z.; et al. Determinant factors and regulatory systems for anthocyanin biosynthesis in rice apiculi and stigmas. Rice 2021, 14, 37. [Google Scholar] [CrossRef] [PubMed]
  49. Yin, X.; Zhang, Y.; Zhang, L.; Wang, B.; Zhao, Y.; Irfan, M.; Chen, L.; Feng, Y. Regulation of MYB transcription factors of anthocyanin synthesis in lily flowers. Front. Plant Sci. 2021, 12, 761668. [Google Scholar] [CrossRef] [PubMed]
  50. Cao, Y.; Jia, H.; Xing, M.; Jin, R.; Grierson, D.; Gao, Z.; Sun, C.; Chen, K.; Xu, C.; Li, X. Genome-wide analysis of MYB gene family in chinese bayberry (Morella rubra) and identification of members regulating flavonoid biosynthesis. Front. Plant Sci. 2021, 12, 691384. [Google Scholar] [CrossRef]
  51. Ma, D.; Reichelt, M.; Yoshida, K.; Gershenzon, J.; Constabel, C.P. Two R2R3-MYB proteins are broad repressors of flavonoid and phenylpropanoid metabolism in poplar. Plant J. 2018, 96, 949–965. [Google Scholar] [CrossRef] [Green Version]
  52. Zhai, R.; Wang, Z.; Zhang, S.; Meng, G.; Song, L.; Wang, Z.; Li, P.; Ma, F.; Xu, L. Two MYB transcription factors regulate flavonoid biosynthesis in pear fruit (Pyrus bretschneideri Rehd.). J. Exp. Bot. 2016, 67, 1275–1284. [Google Scholar] [CrossRef] [Green Version]
  53. Xu, P.; Wu, L.; Cao, M.; Ma, C.; Xiao, K.; Li, Y.; Lian, H. Identification of MBW complex components implicated in the biosynthesis of flavonoids in woodland strawberry. Front. Plant Sci. 2021, 12, 774943. [Google Scholar] [CrossRef]
  54. Yang, J.; Wu, X.; Aucapiña, C.B.; Huang, J.; Hao, Z.; Zhang, Y.; Ren, Y.; Miao, N. NtMYB12 requires for competition between flavonol and (pro)anthocyanin biosynthesis in Narcissus tazetta tepals. Mol. Hortic. 2023, 3, 2. [Google Scholar] [CrossRef]
  55. An, X.H.; Tian, Y.; Chen, K.Q.; Liu, X.J.; Liu, D.D.; Xie, X.B.; Cheng, C.G.; Cong, P.H.; Hao, Y.J. MdMYB9 and MdMYB11 are involved in the regulation of the JA-induced biosynthesis of anthocyanin and proanthocyanidin in apples. Plant Cell Physiol. 2015, 56, 650–662. [Google Scholar] [CrossRef] [Green Version]
  56. Hong, M.; Hu, K.; Tian, T.; Li, X.; Chen, L.; Zhang, Y.; Yi, B.; Wen, J.; Ma, C.; Shen, J.; et al. Transcriptomic analysis of seed coats in yellow-seeded brassica napus reveals novel genes that influence proanthocyanidin biosynthesis. Front. Plant Sci. 2017, 8, 1674. [Google Scholar] [CrossRef] [PubMed] [Green Version]
  57. Wang, W.; Gu, L.; Ye, S.; Zhang, H.; Cai, C.; Xiang, M.; Gao, Y.; Wang, Q.; Lin, C.; Zhu, Q. Genome-wide analysis and transcriptomic profiling of the auxin biosynthesis, transport and signaling family genes in moso bamboo (Phyllostachys heterocycla). BMC Genom. 2017, 18, 870. [Google Scholar] [CrossRef] [PubMed] [Green Version]
  58. Sun, Q.; Jiang, S.; Zhang, T.; Xu, H.; Fang, H.; Zhang, J.; Su, M.; Wang, Y.; Zhang, Z.; Wang, N.; et al. Apple NAC transcription factor MdNAC52 regulates biosynthesis of anthocyanin and proanthocyanidin through MdMYB9 and MdMYB11. Plant Sci. 2019, 289, 110286. [Google Scholar] [CrossRef]
  59. Sudha, M.L.; Indumathi, K.; Sumanth, M.S.; Rajarathnam, S.; Shashirekha, M.N. Mango pulp fibre waste: Characterization and utilization as a bakery product ingredient. J. Food Meas. Charact. 2015, 9, 382–388. [Google Scholar] [CrossRef]
  60. Ma, X.; Wu, H.; Liu, L.; Yao, Q.; Wang, S.; Zhan, R.; Xing, S.; Zhou, Y. Polyphenolic compounds and antioxidant properties in mango fruits. Sci. Hortic. 2011, 29, 102–107. [Google Scholar] [CrossRef]
  61. Abrahams, S.; Tanner, G.J.; Larkin, P.J.; Ashton, A.R. Identification and biochemical characterization of mutants in the proanthocyanidin pathway in Arabidopsis. Plant Physiol. 2002, 130, 561–576. [Google Scholar] [CrossRef] [PubMed] [Green Version]
  62. Han, Y.; Vimolmangkang, S.; Soria-Guerra, R.E.; Korban, S.S. Introduction of apple ANR genes into tobacco inhibits expression of both CHI and DFR genes in flowers, leading to loss of anthocyanin. J. Exp. Bot. 2012, 63, 2437–2447. [Google Scholar] [CrossRef] [PubMed] [Green Version]
  63. Grillo, S.; Blanco, A.; Cattivelli, L.; Coraggio, I.; Leone, A.; Salvi, S. Plant genetic and molecular responses to water deficit. Ital. J. Agron. 2011, 1, 617–637. [Google Scholar] [CrossRef]
  64. Ma, J.; Wang, L.Y.; Dai, J.X.; Wang, Y.; Lin, D. The NAC-type transcription factor CaNAC46 regulates the salt and drought tolerance of transgenic Arabidopsis thaliana. BMC Plant Biol. 2021, 21, 11. [Google Scholar] [CrossRef] [PubMed]
  65. Fornalé, S.; Lopez, E.; Salazar-Henao, J.E.; Fernández-Nohales, P.; Rigau, J.; Caparros-Ruiz, D. AtMYB7, a new player in the regulation of UV-sunscreens in Arabidopsis thaliana. Plant Cell Physiol. 2014, 55, 507–516. [Google Scholar] [CrossRef] [Green Version]
  66. Zhang, D.H. Characterization of Transcription Factors MdMYB88, MdMYB124, and MdMYB3 in Response to Drought and Low Nitrate Stresses in Apple. Ph.D. Thesis, Northwest A&F University, Xianyang, China, 2021. [Google Scholar]
  67. Ramakrishna, A.; Ravishankar, G.A. Influence of abiotic stress signals on secondary metabolites in plants. Plant Signal. Behav. 2011, 6, 1720–1731. [Google Scholar]
  68. Osawa, H.; Endo, I.; Hara, Y.; Matsushima, Y.; Tange, T. Transient proliferation of proanthocyanidin-accumulating cells on the epidermal apex contributes to highly aluminum-resistant root elongation in camphor tree. Plant Physiol. 2011, 155, 433–446. [Google Scholar] [CrossRef] [Green Version]
  69. Tan, L.; Wang, M.; Kang, Y.; Azeem, F.; Zhou, Z.; Tuo, D.; María Preciado Rojo, L.; Khan, I.A.; Pan, Z. Biochemical and Functional Characterization of Anthocyanidin Reductase (ANR) from Mangifera indica L. Molecules 2018, 23, 2876. [Google Scholar] [CrossRef] [Green Version]
Figure 1. Phylogenetic analysis of the LAR, ANS, ANR, IFR, and DFR proteins in different plant species. (Pe: Phyllostachys edulis; Os: Oryza sativa; Zm: Zea mays; Vv: Vitis vinifera; Ft: Fagopyrum tataricum; Mi: Mangifera indica; Mr: Morella rubra; Rr: Rosa rugosa; At: Arabidopsis thaliana; Hv: Hordeum vulgare; Nt: Nicotiana tabacum; Ta: Triticum aestivum; Gm: Glycine max; Mt: Medicago truncatula; Pt: Populus trichocarpa; Tu: Triticum Urartu; Bd: Brachypodium distachyon; Sb: Sorghum bicolor; Lc: Lycoris chinensis; Fe: Fagopyrum esculentum; Cs: Citrus sinensis). Different groups are highlighted in various colors.
Forests 14 01399 g001
Figure 2. Analysis of LFBG expression in 26 moso bamboo tissues. High levels are shown by red and low levels by blue on the map.
Forests 14 01399 g002
Figure 3. Expression verification of representative genes under stresses: (a) drought; (b) cold. Asterisks indicate the significance level (** p < 0.01) as determined by Fisher’s Least-Significant-Difference test.
Forests 14 01399 g003
Figure 4. Statistics of TF binding sites in the promoters of 16 LFBGs.
Forests 14 01399 g004
Figure 5. Co-expression network and validation of PeANR4 with key TFs. (a) The co-expression network of PeANR4 with key TFs. The red triangle represents PeANR4; the blue circles represent TFs. (b) Y1H assays: positive control: pGADT7-Rec2-53 + p53HIS2; negative control: pGADT7-Rec2-TFs + p53HIS2; TDO: SD/-Leu/-Trp/-His.
Forests 14 01399 g005
Figure 6. Analysis of PeANR4 ectopic expression in Arabidopsis. (a) Phenotypes of rosette leaf (scale bar: 1 cm); (b) phenotypes of seeds (scale bar: 1 cm); (c) DMACA stained seeds; (d) fresh weights; (e) dry weights; (f) PA content in seeds; (g) PA content in leaves. OE-1 and OE-2 represent different transgenic lines; WT and ban represent wild type and mutant, respectively. Red bars = 1 cm. Asterisks indicate the significance level (* 0.01 ≤ p ≤ 0.05, ** p < 0.01) as determined by Fisher’s Least-Significant-Difference test.
Forests 14 01399 g006
Figure 7. Germination phenotype (a,b) and germination rate of Arabidopsis under osmotic and salt stress (c,d). Asterisks indicate the significance level (* 0.01 ≤ p ≤ 0.05, ** p < 0.01, ns: p > 0.05) as determined by Fisher’s Least-Significant-Difference test. Scale bar: 1 cm.
Forests 14 01399 g007
Figure 8. Germination phenotype and rate of Arabidopsis under osmotic and salt stress. (a) Osmotic stress; (b) salt stress. Asterisks indicate the significance level (* 0.01 ≤ p ≤ 0.05, ** p < 0.01, ns: p > 0.05) as determined by Fisher’s Least-Significant-Difference test.
Forests 14 01399 g008
Disclaimer/Publisher’s Note: The statements, opinions and data contained in all publications are solely those of the individual author(s) and contributor(s) and not of MDPI and/or the editor(s). MDPI and/or the editor(s) disclaim responsibility for any injury to people or property resulting from any ideas, methods, instructions or products referred to in the content.

