Article

Biochar Application: A Viable and Pyrolysis Temperature Dependent Option for Enhancing Leaf Secondary Metabolites of Cyclocarya paliurus

1
College of Forestry, Nanjing Forestry University, Nanjing 210037, China
2
Co-Innovation Center for Sustainable Forestry in Southern China, Nanjing Forestry University, Nanjing 210037, China
*
Author to whom correspondence should be addressed.
Forests 2023, 14(7), 1298; https://doi.org/10.3390/f14071298
Submission received: 26 May 2023 / Revised: 18 June 2023 / Accepted: 22 June 2023 / Published: 24 June 2023
(This article belongs to the Section Forest Ecology and Management)

Abstract

:
While numerous studies have suggested that pyrolysis of the forestry residues to produce biochar and return it back for forestry use is an effective way for the utilization of forestry wastes, there have been few reports addressing the effect of pyrolysis temperature on its agronomic functions, especially the secondary metabolism of the medicinal tree. In this study, two kinds of biochar were pyrolyzed using poplar sawdust at 350 °C (C350) and 600 °C (C600), respectively, then applied as auxiliary substrate material for the cultivation of Cyclocarya paliurus seedlings in a greenhouse to study their effects on soil properties, seedling growth and the accumulation of main secondary metabolites in C. paliurus leaves. The results showed that biochar application definitely ameliorated most of the soil properties, and this improvement was further enhanced as the pyrolysis temperature of the biochar increased. Compared with the basic substrate (CK), the growth of C. paliurus seedlings increased under C600 and decreased under C350, but the application of two biochars had no significant effect on the content of the main secondary metabolites in the leaves. In contrast, the seedling growth with the direct application of poplar sawdust (C0) was significantly inhibited, while the content of secondary metabolites in the leaves increased significantly. In terms of the yield of leaf secondary metabolites, the application of biochar with high pyrolysis temperature (C600) had the highest yield, while the direct application of poplar sawdust had the lowest yield. In addition, the contents of several metabolite monomers were higher under C0 than these of the other three treatments. The results indicated a certain trade-off between the primary growth and the synthesis of leaf secondary metabolites in C. paliurus affected by different biochars and poplar sawdust application, while the accumulation of leaf secondary metabolites was generally dependent on leaf biomass.

1. Introduction

With the rapid expansion of plantations in China, a huge amount of forestry residue is produced during timber harvest and processing [1]. According to Duan et al. [2], annual forestry residue produced in China exceeded 450 million tons in 2014, of which only a small portion was reused. The direct combustion of large amounts of forestry wastes has led to a serious waste of resources and a certain risk of environmental pollution [3]. The Chinese government has been promoting the direct return of agricultural residues to cropland since 2008 to address environmental issues and to improve soil fertility in the agriculture system [4]; however, less attention has been paid to forestry.
Many researchers have advocated the use of agricultural and forestry residues to produce biochar and use it as a soil amendment, which can be considered an economical and environmentally friendly way to utilize organic wastes. Biochar is the pyrolysis product of organic material under anaerobic conditions, containing a large amount of stable aromatic hydrocarbons [5], developed pore structure, large specific surface area and superior adsorption properties [6], which can increase soil cation exchange capacity and improve soil fertility [7] when applied as a soil amendment. In addition, biochar is usually alkaline due to its high ash content, which can be used to improve acidic soil [8]. Many studies have verified the effects of biochar application in plant cultivation, but the evaluation was obviously controversial. Spokas et al. [9] summarized previous studies and found that 50% of the studies demonstrated that biochar application significantly promoted plant growth, 30% of the studies did not show any effect, and 20% of the studies found a restrained effect on plant growth. The inconsistency of this research was probably related to biochar properties, which were accordingly related to the feedstocks, the pyrolysis temperature and the pyrolysis process, and the pyrolysis temperature was generally the most important factor [10]. When the pyrolysis temperature was between 300 °C and 800 °C, the pH value, available nutrient content, and specific surface area of biochar were positively correlated with the pyrolysis temperature [11,12,13].
In addition, most previous studies have focused on the effects of biochar application on plant growth and yield, while there has been a lack of attention on the effects of biochar application on plant secondary metabolism or bioactive substance accumulation, among which even less attention has been paid to the synthesis of secondary metabolite monomers. However, the yield of some target monomers was even essential for the cultivation of medicinal plants. Limited studies have shown that biochar application had certain effects on the synthesis and accumulation of secondary metabolites in plants, such as significantly increasing the content of total alkaloids, organic acids and water-soluble extracts in Pinellia ternate [14] and increasing the content of polyphenols, flavones, and flavonoids in Alpinia zerumbet and Andrographis paniculate [15,16]. In this regard, the effects of pyrolysis temperature are currently even more lack of study. The synthesis and accumulation of secondary metabolites were often considered to be a response of plants to unfavorable growth conditions, so there was generally a trade-off between primary growth and secondary metabolism of plants [17,18]. If biochar application could improve the growth condition of plants, then it might reduce the synthesis and accumulation of secondary metabolites. Therefore, we hypothesized that biochar application could promote the growth of medicinal plants by improving soil conditions, but it would lead to a decrease in the synthesis of secondary metabolites and changes in the composition of main metabolite monomers, and this effect had a certain correlation with the pyrolysis temperatures of biochar.
Hence, aimed at the re-utilization of forestry residues, we prepared biochar with poplar sawdust under relatively low and high pyrolysis temperatures and used them as auxiliary substrate material for the cultivation of Cyclocarya paliurus seedlings. C. paliurus is a medicinal tree species rich in secondary metabolites such as flavonoids, triterpenes and polysaccharides in leaves [19,20]. Using the pot experiment, we tried to explore the effects of pyrolysis temperatures of biochar on the properties of the cultivation substrates and the composition and accumulation of major secondary metabolites in the leaves of C. paliurus. The results can provide valuable information for the effective reuse of forestry residues by producing biochar in the cultivation of medicinal plant resources.

2. Materials and Methods

2.1. Experiment Design, Pot Cultivation, Investigation and Sampling

Two kinds of biochar were prepared from the sawdust of southern-type poplar (Populus deltoides) using a muffle furnace. Poplar sawdust was loaded into corundum crucibles, sealed and preheated at 200 °C for 0.5 h and then heated to 350 °C or 600 °C, respectively, for continuous pyrolysis for 3 h. After the end of pyrolysis, the furnace temperature was first reduced to 250 °C before opening the furnace, and after the temperature dropped to 120 °C, the prepared biochars were taken out for the subsequent pot experiments.
The pot experiments for seedling cultivation of C. paliurus were carried out from May to October 2020 in the greenhouse of Nanjing Forestry University. Square containers with upper and lower diameters and heights of 100 mm, 70 mm and 90 mm, respectively, were used. The basic substrate for cultivation was made from a compound of yellow-brown soil, organic fertilizer and perlite with a volume ratio of 6:1:1.
Four substrate treatments were designed with the basic substrate as the control (CK) and adding 15% (v/v) of poplar sawdust (C0) or poplar sawdust biochar pyrolyzed at 350 °C or 600 °C (C350 and C600), respectively, to basic substrate as treatments. In early May 2020, the various substrates, according to the design, were prepared and potted, and uniformly selected seedlings of C. paliurus were transplanted, with one plant per container. The cultivation experiment was carried out in a completely randomized design. Each substrate treatment consisted of three replicates, and each replicate included 30 containers. The replicates of each treatment were randomly arranged on the ground. Five additional containers without seedling transplant for each substrate treatment in each replicate were also prepared for the investigation of the physical properties of the substrate. Routine water and weed management were carried out during the cultivation process, and yellow sticky traps were used to prevent pests, and disease were prevented by ensuring ventilation. Fertilizer was applied once by adding 100 mL of 1.0 g·L−1 urea solution per container on 30 June. The position of each replicate was regularly exchanged during the cultivation to keep even cultivation conditions.
Five equal containers were selected from each replicate for each treatment to measure seedling height and ground diameter once a month from mid-June to mid-October 2020. All the leaves of every single plant were harvested after the measurements in October. The leaf samples were brought back to the laboratory, dried at 65 °C and weighed to obtain the leaf biomass of the individual plants. The dried leaves were then ground and passed through a 100-mesh sieve for the determination of flavonoid, triterpene, polyphenol and their major monomer content.
Soil samples were collected twice in July and October 2020, respectively, from 10 randomly selected containers within each replicate of different treatments. When collecting soil samples, a hole punch (Ø = 16 mm) was used to extract soil vertically from the soil surface with three random locations in each container. All soil samples collected from 10 containers were mixed as one compound sample, then brought back to the laboratory immediately. After sieving through a 2-mm mesh, the soil samples were stored in a 4 °C freezer for subsequent determination of soil chemical properties and microbial biomass. In October 2020, undisturbed soil cores were sampled using cylindrical steel ring from the five containers without seedling cultivation in each replicate of different treatments for the determination of soil bulk density and porosity.

2.2. Analysis of the Properties of Sawdust and Biochar

The pH value of biochar and poplar sawdust was determined using a pH meter (pH 700, EUTECH Instruments, Vernon Hills, IL, USA) at a 1:2.5 (w/v) solid-to-water ratio with CO2-free distilled water. Organic carbon (OC) and total nitrogen (TN) contents of biochar and poplar sawdust were measured using an elemental analyzer (Vario Max CN, Elementar, Langenselbold, Germany). The pore characteristics of biochar and poplar sawdust were determined using the ASAP2020 specific surface area and porosity determination system (ASAP2020, Micromeritics, Norcross, GA, USA). The specific surface area and pore volume were determined by N2 adsorption isotherms at 77 K.

2.3. Analysis of Soil Properties and Microbial Biomass

Soil bulk density and total porosity, capillary porosity and non-capillary porosity were determined by core method [21]. Soil pH, organic carbon and total nitrogen content were determined in the same way as for biochar and poplar sawdust. Contents of soil inorganic nitrogen (TIN) were extracted by 2 mol·L−1 KCl solution, ammonium-N was determined by indophenol blue method and nitrate-N was determined by dual-wavelength ultraviolet spectrophotometry.
Contents of soil microbial biomass were analyzed using the chloroform fumigation-extraction method [22]. Fresh soil before and after chloroform fumigation was extracted with 0.5 mol·L−1 K2SO4 solution. The K2SO4-extracted C was determined using a total organic C analyzer (TOC-L, Shimadzu, Kyoto, Japan), and the K2SO4-extracted N was determined by the ninhydrin-reaction method. Soil microbial biomass C (MBC) and N (MBN) were calculated as the difference between the fumigated and un-fumigated soil samples by multiplying with a constant of 2.22 for MBC and 5.0 for MBN.

2.4. Analysis of Leaf Secondary Metabolites

The secondary metabolites were ultrasound-assisted extracted and purified [23]. In detail, 0.8 g of dried leaf powder of C. paliurus was extracted by 10 mL of 70% ethanol (v/v) with ultrasound assistance (44 kHz, 500 W) at 70 °C for 45 min, then centrifugated at 10,000 rpm for 10 min. The extracts were then purified by passing through a solid phase extraction column and stored at 4 °C for the determination of the contents of total flavonoid, triterpene, polyphenol, and the main monomers.
Content of total flavonoids was measured by reference to the method of Yue et al. [24]. One mL of aluminum trichloride methanol solution (1%, mass fraction) was added after aspirating 0.1 mL of the extract, mixed and placed under ambient temperature for 15 min for color development, followed by fixing the volume to 10 mL with methanol, and the absorbance was measured at 410 nm using a spectrophotometer (Specord 200 plus, Analytik Jena AG, Langewiesen, Germany). The flavonoid content was calculated using rutin (Shanghai Yuanye Bio-Technology Co., Ltd., Shanghai, China) as the standard and expressed as milligrams of rutin equivalent per gram of the dried sample of the leaves.
Content of total triterpenoid was measured by reference to the method of Fan et al. [25]. 0.1 mL of the extract was pipetted into a 10 mL centrifuge tube, evaporated in a water bath at 60 °C, 0.5 mL of vanillin–glacial acetic acid solution (5%, v/v) and 1.4 mL of perchloric acid were added, mixed well, placed in a water bath at 70 °C for 15 min for color development, cooled and fixed to 10 mL with ethyl acetate, and the absorbance was measured at 550 nm with the spectrophotometer. The triterpenoid content was calculated using oleanolic acid (Shanghai Yuanye Bio-Technology Co., Ltd., Shanghai, China) as the standard and expressed as the number of milligrams equivalent to oleanolic acid per gram of the dried sample of the leaves.
Content of total polyphenol was measured by referring to the method of Alothman et al. [26]. A total of 0.5 mL of the extract was aspirated into a 10 mL centrifuge tube, and 2 mL of foline–phenol reagent was added. After mixing well and placing at ambient temperature for 5 min, 1.5 mL of sodium carbonate solution (20%, mass fraction) was added and mixed well again. Then, the solution was placed for 1 h under dark conditions for color development. The absorbance was measured at 765 nm with the spectrophotometer. The total polyphenolic content was calculated using gallic acid (Shanghai Yuanye Bio-Technology Co., Ltd., Shanghai, China) as the standard and expressed as milligrams of gallic acid equivalent per gram of the dried leaf sample.
Contents of the major monomers of flavonoid, triterpene and polyphenol were determined according to the method of Cao et al. [27] using the HPLC system (Alliance 2695, Waters, Milford, CT, USA). The chromatographic separation was performed on an X-Bridge C18 column, 250 × 4.6 mm, packed with 5 µm particles (Waters Corp, MA, Milford, CT, USA). The mobile phases A and B were ultrapure water containing 0.01% formic acid (v/v) and acetonitrile containing 0.01% formic acid (v/v), respectively, at a flow rate of 1.0 mL·min−1, column temperature 45 °C, UV detector wavelength 205 nm, injection volume 10 µL. The gradient elution procedure: 0–13 min, 8%–19%; 13–28 min, 19%–21% B; 28–42 min, 21%–50% B; 42–46 min, 50% B; 46–60 min, 50%–55% B; 60–64 min, 55%–56% B; 74–90 min, 66%–85% B; 90–95 min, 85%–100% B; 95–100 min, 100% B. The equilibration time after the gradient elution was 15 min.

2.5. Statistical Analysis

Accumulation of the secondary metabolite in the leaf of a single plant was calculated by multiplying the content of corresponding secondary metabolite with the leaf dry mass of the plant.
Microsoft EXCEL software (version 2019 MSO) was adopted for data statistics; SPSS 26.0 software was adopted for analysis of variance and multiple comparisons by Duncan’s new complex polar difference method. The redundancy analysis (RDA) calculations were performed using CANOCO version 5.0. All results were presented as the mean ± standard deviation (SD).

3. Results

3.1. Poplar Sawdust and Biochar Properties

The basic properties of the poplar sawdust and the two biochars are shown in Table 1. The organic carbon and total nitrogen content, pH, surface area and pore characteristics of both biochars were significantly higher than those of sawdust, and such traits increased significantly with the increase in pyrolysis temperature, especially in terms of specific surface area and pore characteristics. However, the C/N ratio of biochar pyrolyzed at 600 °C was the lowest, significantly lower than that of poplar sawdust and biochar pyrolyzed at 350 °C by 21.16% and 45.21%, respectively.

3.2. Soil Physical and Chemical Properties

The effects of biochar pyrolyzed at different temperatures and poplar sawdust additions on the physical properties of the soil are presented in Table 2. Soil bulk density was significantly lower in the two biochar application treatments (C350 and C600) and the poplar sawdust application treatment (C0) than that of the control (CK) by 4.85% to 5.82% (p < 0.05), with no significant difference in soil bulk density between C350 and C600. The highest total soil porosity was found under C600, which was significantly higher than CK by 5.71% (p < 0.05), and the difference in soil porosity between the two kinds of biochar and poplar sawdust application was not significant.
Soil chemical properties of the different treatments were compared in July and October 2020, i.e., the second and fifth months after potting initiation (Table 3). After two months of cultivation, soil pH was higher in C350 and C600 than that of C0 and CK. The SOC content of C600 was 2.09 and 2.86 times higher than that of C0 and CK in July (p < 0.05) and 2.51 and 4.14 times higher in October (p < 0.05), respectively. There was no significant difference in SOC content between C350 and C600 in July, but the SOC content of C600 significantly increased by 30.40% in October compared with that of C350 (p < 0.05). The TN content of C600 was the lowest in July, which was significantly lower than that of C0 by 18.68% (p < 0.05). The TN content increased under the application of biochar at the late stage of cultivation, showing significantly higher values in C350 and C600 by 29.10% and 41.79% more, respectively, than that of CK (p < 0.05) in October. The TN content of C0 was significantly higher by 39.55% (p < 0.05) in October than CK. There was no significant difference in TN content between the application of two biochar pyrolyzed at different temperatures. In July, the content of soil TIN was significantly higher under C350 and C600 by 59.81%–385.46% (p < 0.05) increase compared with C0 and CK; in addition, soil TIN content was significantly increased by 17.12% (p < 0.05) under C600 compared with C350. Application of both biochars significantly reduced soil TIN content by 8.93%–16.03% (p < 0.05) compared with C0 in October, and there was no significant difference in soil TIN content between C350 and C600. In October, the TIN content was significantly higher by 12.01% (p < 0.05) in C600 than that of the control.

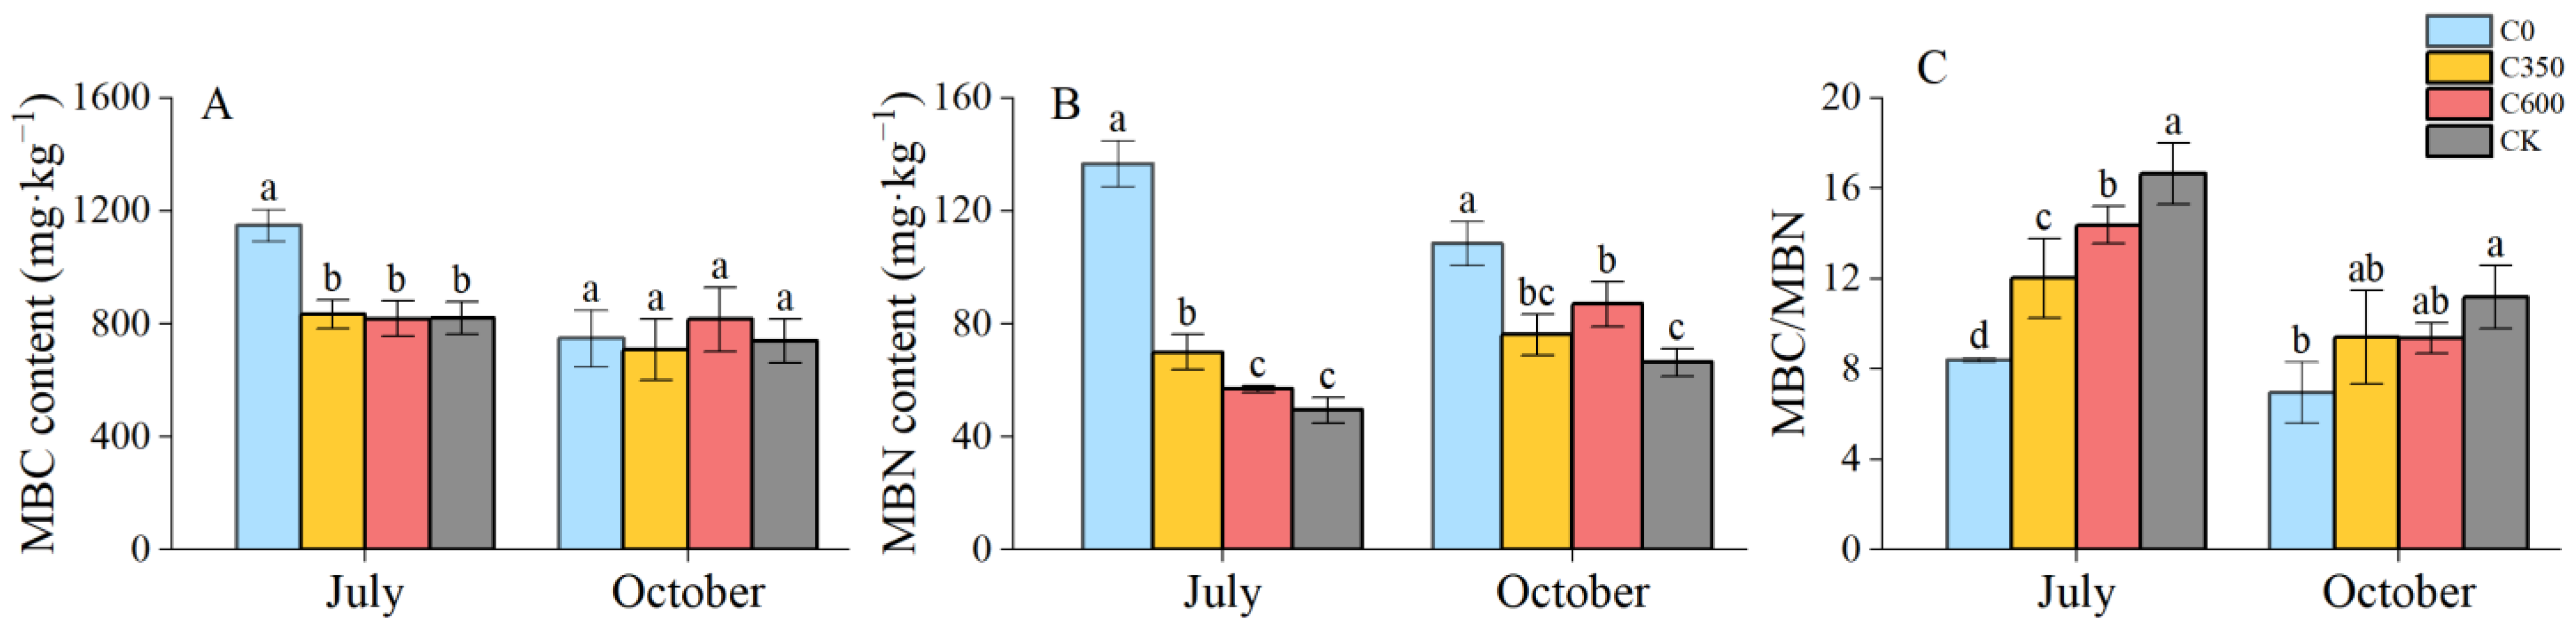
3.3. Soil Microbial Biomass

The effects of two kinds of biochar and poplar sawdust application on soil MBC and MBN content and MBC/MBN ratio are shown in Figure 1. In July, soil MBC content showed no significant difference with biochar application when compared with the control, while C0 significantly increased by 40.01% (p < 0.05); there was also no significant difference between the two biochar treatments. In terms of soil MBN content, C350 was significantly higher than that of the control by 41.50% (p < 0.05), but there was no significant difference in MBN content between C600 and CK, while the MBN content of C0 significantly increased by 176.45% (p < 0.05) compared with CK. Soil MBC/MBN ratio showed the opposite trend to MBN. MBC/MBN ratio with biochar and poplar sawdust application was significantly lower in July than that of the control (p < 0.05), with a range of 15.86% to 98.10%, but C600 was significantly higher than that of C350 by 19.63% (p < 0.05). In October, no significant difference existed in soil MBC between each treatment, while the MBN content with biochar application was significantly lower than that in C0 by 19.83%–29.83% (p < 0.05), and the soil MBN in C600 was also significantly higher by 31.27% (p < 0.05) than that of control. The MBC/MBN ratio was significantly higher by 60.63% (p < 0.05) in poplar sawdust application treatment in October compared with that of CK.

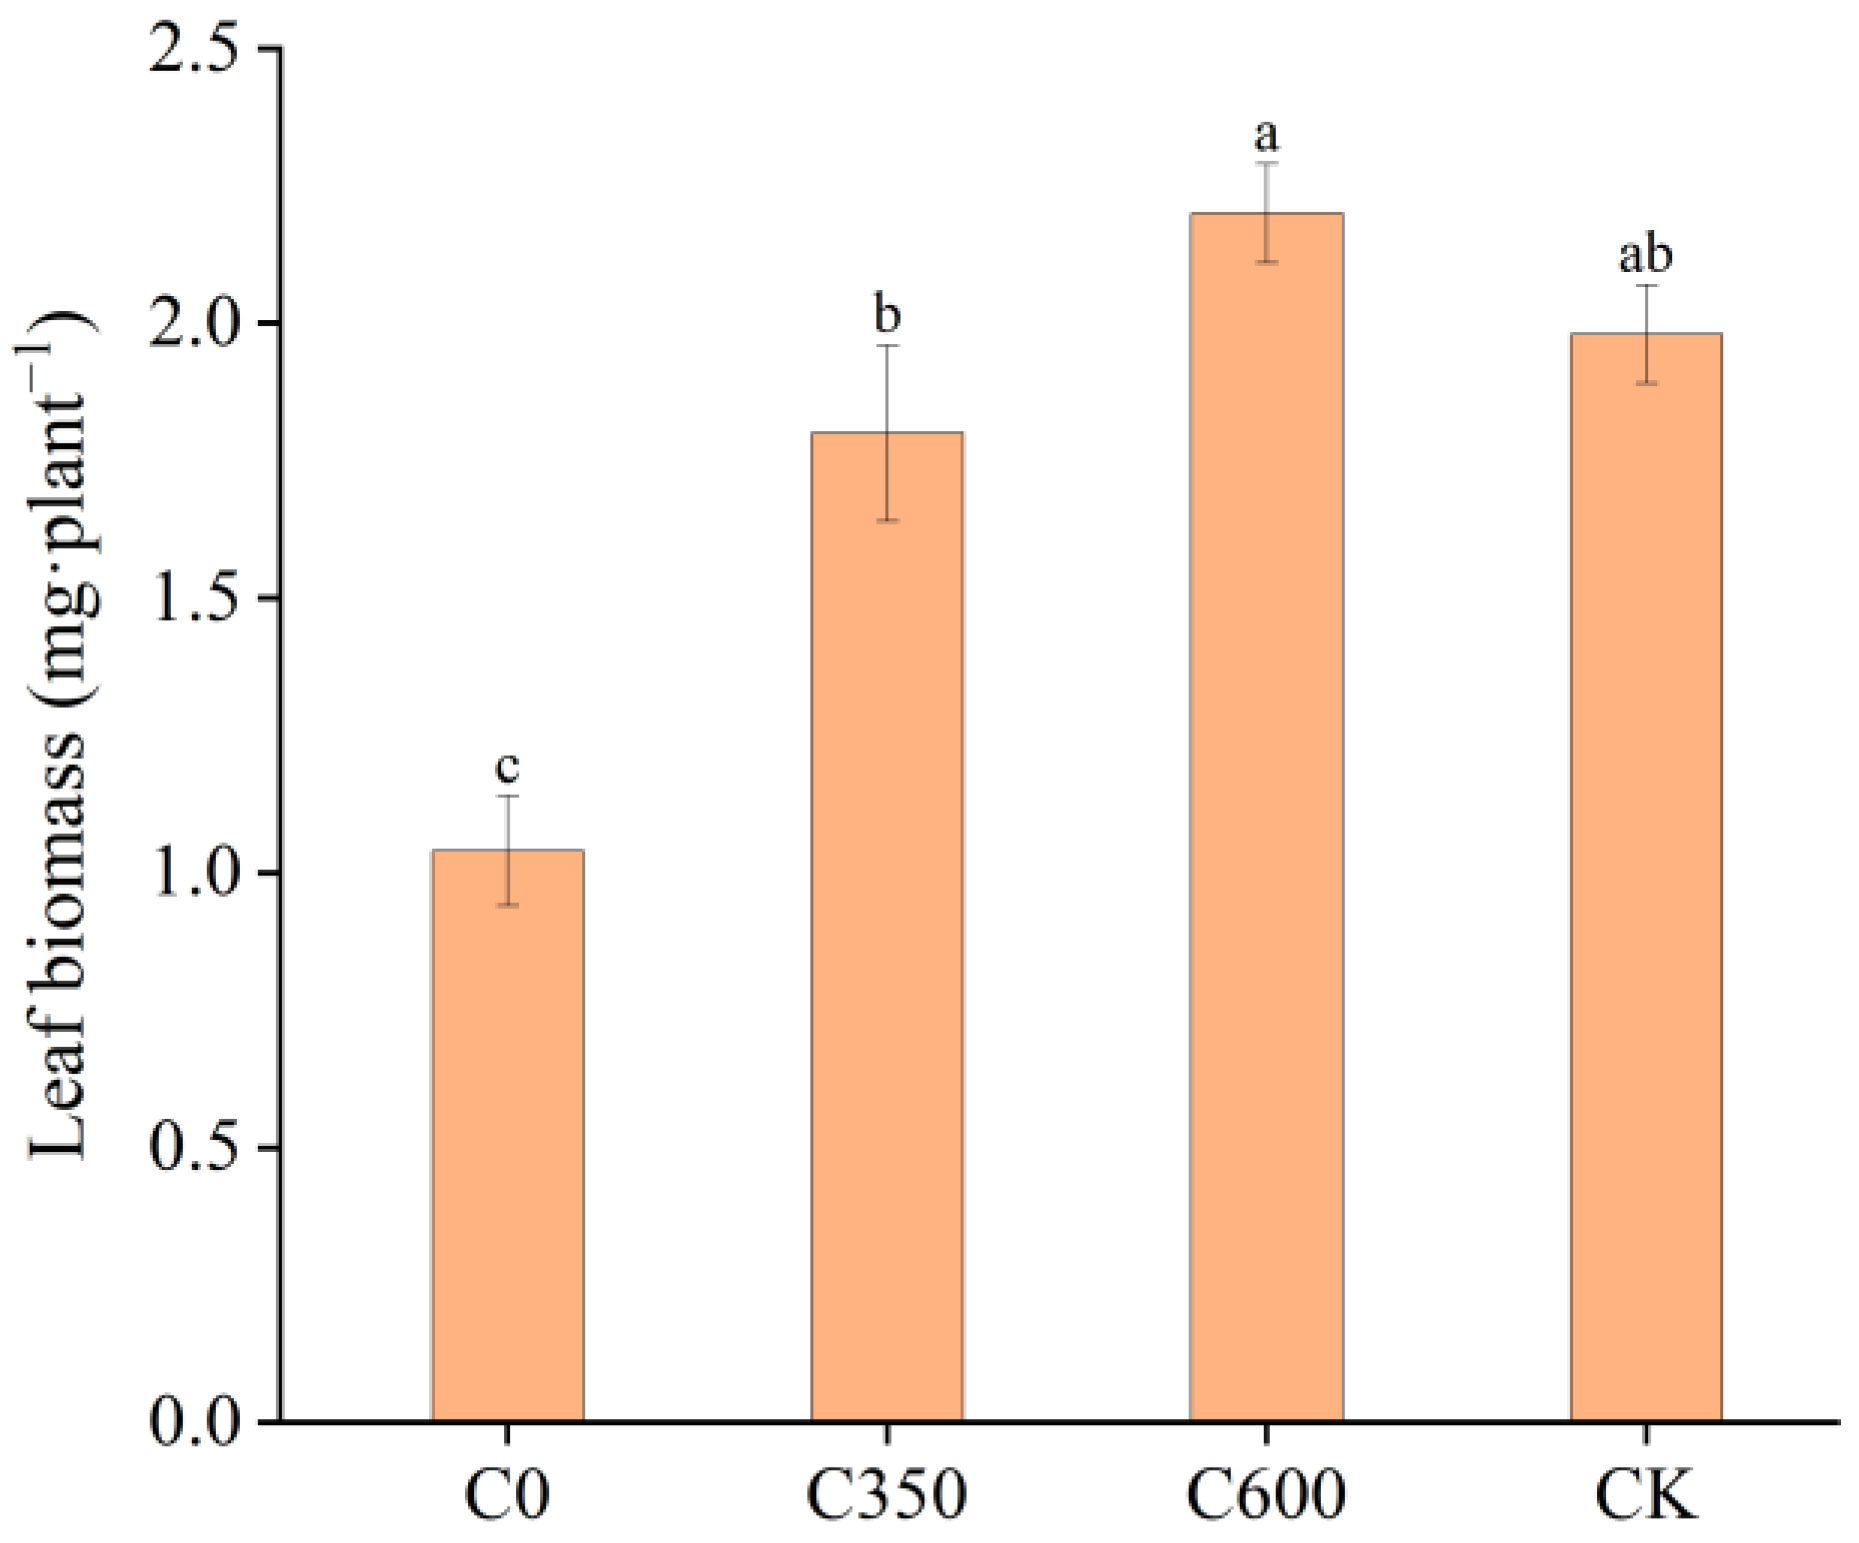
3.4. Seedling Growth and Leaf Biomass of C. paliurus

In the early stage (before July) of the pot experiment, the height and ground diameter of the C. paliurus seedling under the biochar application were slightly lower than those of CK; however, in the later stage, C350 almost reached the same level as CK, while C600 was gradually higher than CK (Figure 2). The seedling height of C600 was significantly higher than that of C350 by 10% (p < 0.05) in July and higher than that of CK and C350 from August to October, while the ground diameter was lower than that of CK from July to August but higher than that of C350 and CK in September to October (Figure 2). Compared with CK, the seedling height and diameter of C0 were significantly lower from July to October, especially in July, the early stage of cultivation, with the seedling height and diameter of C0 being 50% and 25% lower than those of CK (p < 0.05).
The leaf biomass per plant of C. paliurus was the highest under C600, but there was no significant difference between C600 and CK (Figure 3). The leaf biomass increased with the increase in pyrolysis temperature of biochar, showing a significant increase of 22.22% under C600 than that under C350 (p < 0.05). The leaf biomass was also significantly higher under C350 than that of C0 by 73.08% (p < 0.05). The leaf biomass was lowest in C0, with 47.47% lower in C0 than that in CK (p < 0.05).

3.5. Leaf Secondary Metabolite Accumulation

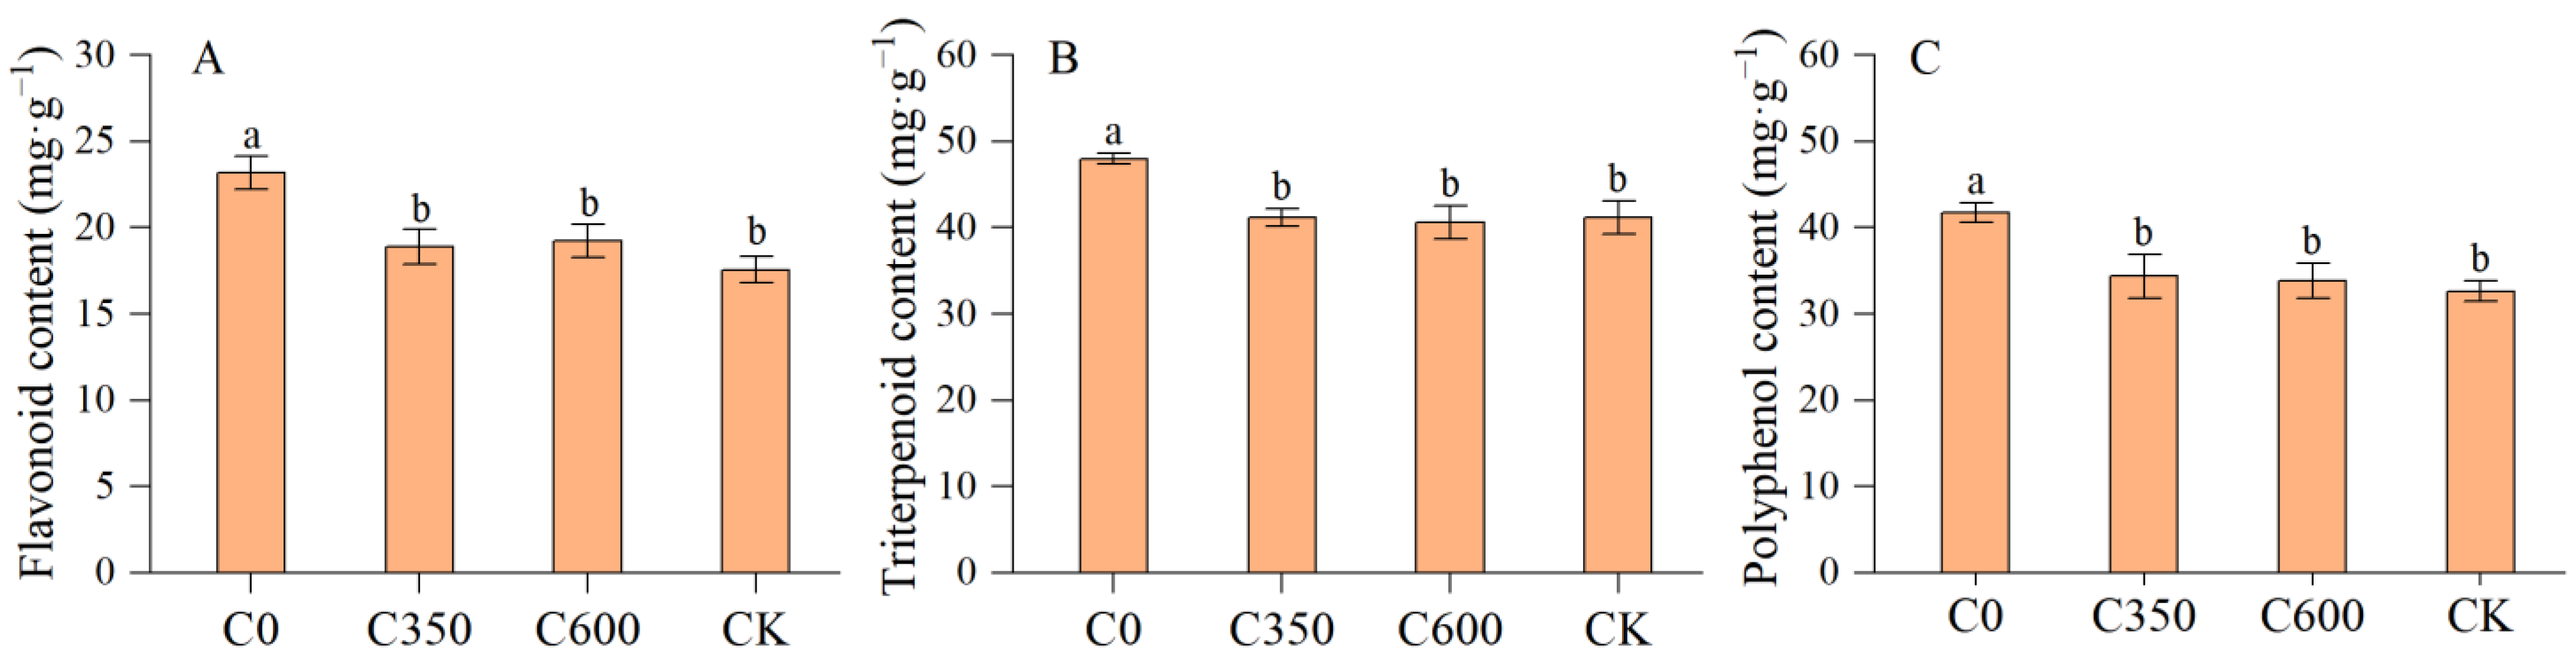
3.5.1. Secondary Metabolite Contents

The effects of two kinds of biochar and poplar sawdust additions on the content of secondary metabolites in C. paliuru leaves are shown in Figure 4. C0 had the highest content of all secondary metabolites, with a significant increase by 20.54%–32.08% in flavonoid, by about 17% in triterpenoid, and by 21.45%–27.89% in polyphenol (p < 0.05) compared with the other three treatments. However, no significant difference existed in secondary metabolite content between the treatments with biochar application and CK.
The HPLC chromatograms of six flavonoid monomers, three triterpenoid monomers and six polyphenolic monomers are shown in Figure 5, and the content of each monomer is illustrated in Figure 6. For the flavonoid monomers, the contents of isoquercitrin and kaempferol-3-O-glucuronide under C0 were the highest among the four treatments. The content of isoquercitrin was significantly higher in C0 by 1.56 and 1.63 times compared with C350 and C600, respectively (p < 0.05), and the content of kaempferol-3-O-glucuronide was significantly higher in C0 by 17.87%–96.52% (p < 0.05) compared with biochar application and the control, while the treatment of biochar pyrolyzed at 600 °C application significantly increased by 66.21% (p < 0.05) compared with the control. The content of kaempferol-3-O-rhamnoside was the lowest in C350 among the four treatments, showing about 44% lower than that of C0 and CK (p < 0.05) but not significantly different from that of C600. The contents of the triterpenoid monomer pterocaryoside B and the polyphenol monomer 3-O-caffeoylquinic acid were the highest in C0 among the four treatments. The content of pterocaryoside B was significantly increased by 86.66%–91.96% (p < 0.05), and the content of 3-O-caffeoylquinic acid was significantly increased by 44.93%–82.95% (p < 0.05) in C0 compared with the control and both biochar. There were no significant differences between the treatments for the remaining monomers.

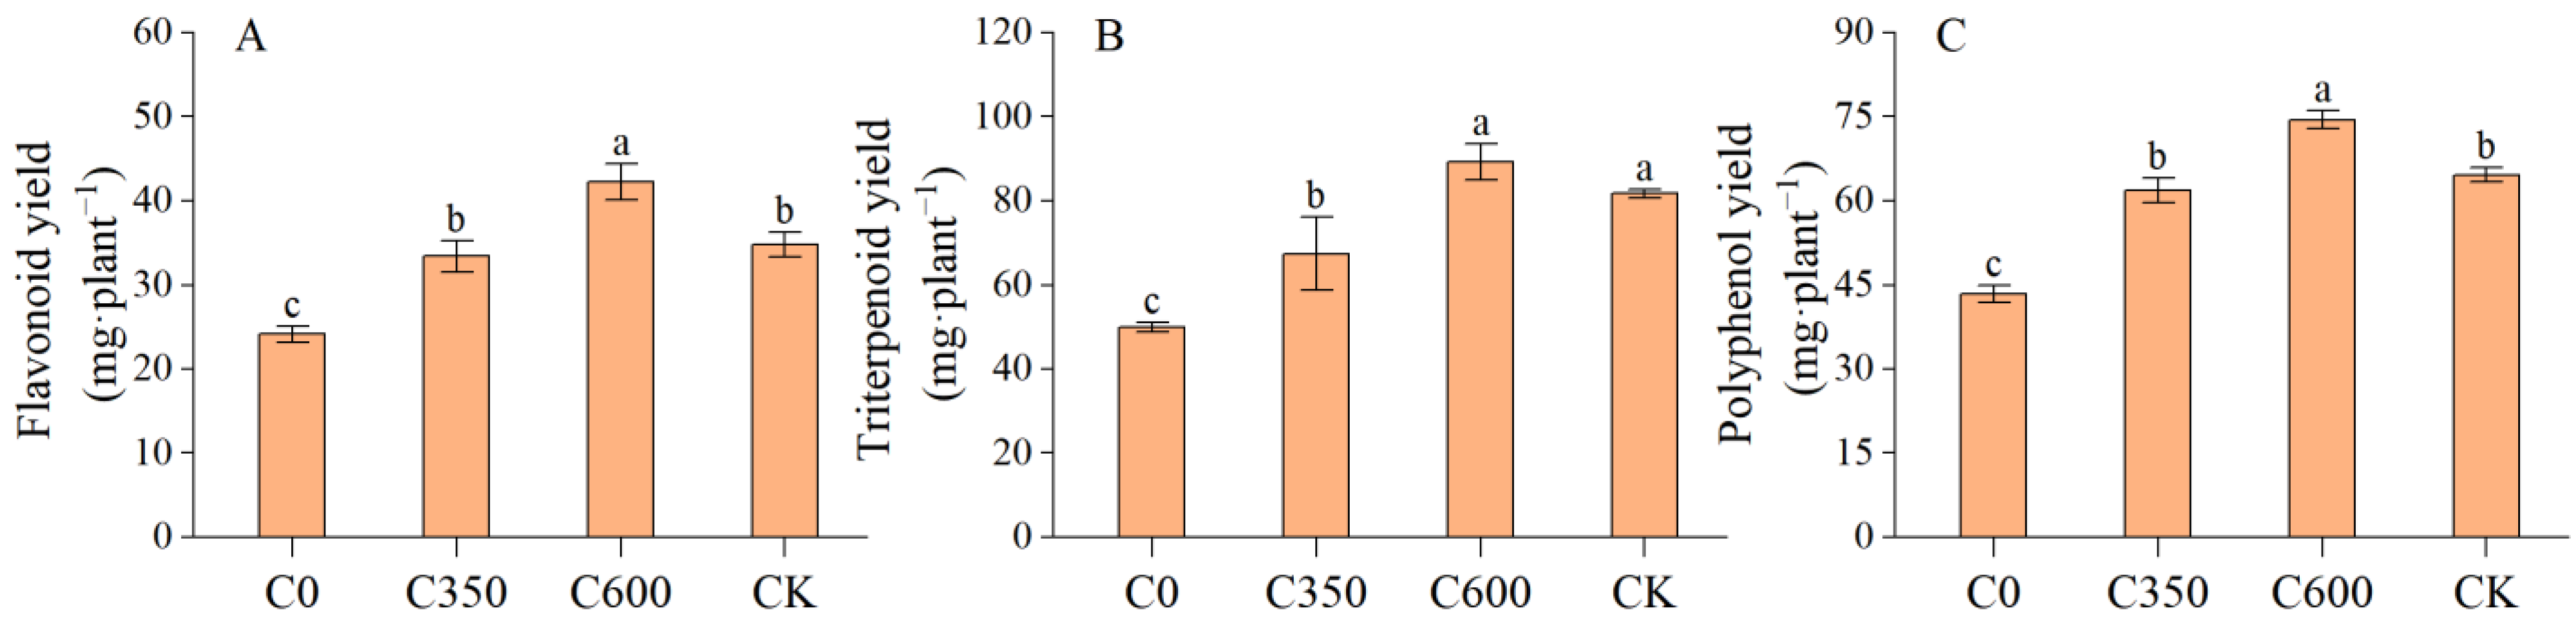
3.5.2. Secondary Metabolite Yield

The yield of flavonoid, triterpenoid and polyphenol in C. paliurus leaf under C600 was the highest among the four treatments and the lowest at C0 (Figure 7). The yield of flavonoid was significantly increased by 21.43%–75.10% (p < 0.05) under C600 compared with C0, C350, and CK, while the yield of flavonoid was significantly decreased by about 30% (p < 0.05) under C0 compared with C350 and CK. There was no significant difference in the yield of flavonoids between C350 and CK. Compared with C0 and C350, the yield of triterpenoid of C600 was significantly increased by 78.52% and 32.34% (p < 0.05), respectively. The polyphenol yield of C. paliurus leaf in C600 significantly increased by 71.50%, 20.34% and 15.18% compared with C0, C350, and CK (p < 0.05), respectively, while that of C0 significantly decreased by 29.83% and 32.84% compared with C350 and CK (p < 0.05), respectively. There was no significant difference in the polyphenol yield between C350 and CK.
The yield of the metabolite monomers in C. paliurus leaf under different treatments is shown in Table 4. The yield of kaempferol-3-O-glucuronide significantly decreased by 47.62% (p < 0.05) under C0 compared with CK (p < 0.05). The yield of kaempferol-3-O-rhamnoside under C350 significantly decreased by 48.69% (p < 0.05) than in CK, while the difference between C600 and CK was not significant, but C0 significantly decreased by 47.27% (p < 0.05). The yield of kaempferol-3-O-rhamnoside in C600 significantly increased by 36.21% compared with C350 (p < 0.05). The yield of cyclocaric acid B in the leaves of C. paliurus was the highest among the four treatments under C600, which significantly increased by 118.72%, 62.67% and 32.34% (p < 0.05) compared with C0, C350 and CK, respectively, and C0 was the lowest as it significantly decreased 39.50% (p < 0.05) compared with CK.

3.6. Linking Leaf Biomass and Secondary Metabolite Content of Soil Properties

The results of the redundancy analysis, using leaf biomass and secondary metabolite content of C. paliurus as dependent variables and soil properties as environmental variables, are shown in Figure 8. The environmental factors accounted for 61.46% of the variance of leaf biomass, secondary metabolism and monomer content of C. paliurus, of which the RDA axis 1 accounted for 44.91% and the RDA axis 2 accounted for 16.55%. The RDA axis 1 represented the trade-off between primary growth and secondary metabolism of C. paliurus, while the RDA axis 2 represented the differentiation between secondary metabolites. The soil pH was significantly correlated with the primary and secondary metabolism of C. paliurus (p < 0.05), explaining 20.4% of the component changes, followed by the total porosity of the soil, explaining 19.3% (p < 0.05) of the component changes, respectively.

4. Discussion

4.1. Trade-off between Primary Growth and Secondary Metabolism under Biochars Application

Most of the previous studies demonstrated that biochar application was beneficial to plant growth by improving soil physical properties and nutrient availability [28,29,30]. However, our study showed that there was no significant difference in the effect of biochar pyrolyzed at two temperature applications on the growth of C. paliurus compared to the control. The impact of biochar application on plant growth was related to the nutrient supply capacity of the soil itself. The functions of biochar, such as adsorption of nutrients, water retention, and air permeability, may only play a leading role in extremely poor soil [31]. From the nutrient characteristics of potted soil, the soil TIN content of biochar applied in July, the early period of cultivation, was significantly higher than that of the control, but the growth of C. paliurus was almost the same for the treatments of biochar application and control from July to October, indicating that the nutrient status of this study was well suited to the growth requirements of the C. paliurus, so the effect of biochar application on the growth of the C. paliurus was not revealed. The results of a study by Güereña [32] showed that applying biochar to fertile soil in temperate zones does not improve crop growth. From the view of plant growth, due consideration should be given to the limiting factors of different soils in order to increase soil nutrient effectiveness and thus improve plant habitat. The research by Deng et al. [33] showed that compared with the addition of biochar pyrolyzed at 300 °C, the application of biochar pyrolyzed at 500 °C significantly improved plant growth. Similar to the results of this study, compared with the low-temperature pyrolysis biochar treatment, the high-temperature pyrolysis biochar treatment resulted in better growth of C. paliurus. On the one hand, the results of redundancy analysis show that the total porosity of soil is closely related to the biomass of C. paliurus leaves. Compared with biochar pyrolysis at 350 °C, biochar pyrolysis at 600 °C has a larger specific surface area and more pores. After application, the total porosity of potted soil is significantly increased, which is consistent with previous research results [34]. As the pyrolysis temperature rises, the number of micropores in biochar increases and the area and volume of micropores increase, which enhances the adsorption capacity of biochar for soil nutrients [10,35], reducing nutrient leaching and increasing the nutrient use efficiency of plants, which may improve plant growth when used as a seedling substrate. On the other hand, the increase in effective nutrients may be the reason for the better growth of C. paliurus under high-temperature pyrolysis biochar treatment. Compared with C350, the application of biochar pyrolyzed at 600 °C significantly increased the soil TIN content. In addition, some studies have shown that there may be some toxic substances in the low-temperature pyrolysis biochar, which is not conducive to plant growth [36].
The synthesis and accumulation of secondary metabolites was usually a response of plants to adversity [37]. This study showed that the content of secondary metabolites C. paliurus treated with the addition of biochar pyrolysis at different temperatures did not differ compared with CK, probably because the biotope of C. paliurus was better during the pot trial and no stress of adversity was caused to C. paliurus. The mechanism of the effect of biochar on plant secondary metabolites is currently unclear, and the results of a study on Chrysanthemum morifolium showed that straw biochar (20%, w/w) application significantly increased its flavonoid content [38]. Also, the results of a study by Petruccelli [39] showed that compared with the addition of 10% poplar biochar (w/w), increasing the application to 20% significantly improved the flavonoid content but decreased the polyphenol content of tomato (Lycopersicon esculentum). It has also been suggested that high application rates of biochar may improve nutrient uptake and utilization by plants, thereby affecting the accumulation of secondary metabolites [16]. Compared with previous studies, the lower biochar application rate (15%, v/v) in this study may not have affected the secondary metabolism of the C. paliurus to the extent that it did. Future studies should consider both the amount of biochar applied and the pyrolysis temperature in order to accurately assess the effect of biochar on the secondary metabolite content of plants.

4.2. Effect of Direct Application of Poplar Sawdust on Growth and Secondary Metabolism

We found that direct application of poplar sawdust reduced the biomass but increased the content of secondary metabolites in C. paliurus significantly compared with the other treatments, suggesting that C. paliurus under C0 was subjected to adversity stress. From the nutrient characteristics of the potted soil, in the early period, the C0 had the lowest soil TIN content, and the MBC and MBN content was the highest among the four treatments, indicating that the C0 may be able to provide sufficient effective carbon sources to the soil microbes, but the amount of nitrogen and other nutrients provided was relatively insufficient, and while the soil microbes proliferated and multiplied, they consumed a large amount of effective nitrogen in the soil, resulting in excessive nutrient competition with the C. paliurus, leading to the early growth of the C. paliurus being inhibited. It has been suggested that the direct return of straw may increase soil N mineralization and fixation, which could lead to soil N deficiency and reduced crop yields [40]. Plants usually produce more secondary metabolites in adverse conditions for growth [41]. Many studies have shown that compared with plants, soil microbes have the characteristics of rapid reproduction, large surface area and volume ratio. Therefore, plants are often at a disadvantage in nutrient competition with soil microbes, and plant growth is restricted [42,43,44,45,46], resulting in a significant increase in the content of secondary metabolites in the leaves of C. paliuru. The carbon/nutrient balance hypothesis, which explains the physiological mechanism of environmental conditions inducing the formation and accumulation of secondary metabolites in plants, suggests that C-based secondary metabolites in plants, such as phenols, terpenes and other compounds with only C, H and O as the main structures, are positively correlated with the C/N ratio in plants [47]. In the early growth stage of C. paliuru, the soil TIN content under C0 in July was significantly lower than that of other treatments. Nitrogen deficiency may lead to an increase in C/N in C. paliuru treated with the direct addition of poplar sawdust, thereby increasing the content of secondary metabolites. In addition, the heat released during the decomposition of poplar sawdust may stress the growth of the roots of C. paliuru seedlings, resulting in an increase in the content of secondary metabolites. However, in the later period, the soil microbial biomass of the C0 had fallen back, indicating that the effective carbon source provided by the sawdust for microbes had been depleted and that microbes would release effective state nitrogen into the soil while degrading sawdust at which point the soil inorganic N content increased significantly, in general agreement with the other treatments. The results of a study by Recous [48] showed that the soil TIN content decreased significantly at the beginning of the straw return period, while the soil TN content increased significantly after 40 d of return. Therefore, the low growth of C. paliurus under the C0 was mainly related to the fermentation of sawdust in the early stages and the competition for nutrients from microbes, and this competitive effect was moderated in the later stages as the fermentation and degradation process of sawdust weakened, and the growth of C. paliurus under this treatment picked up in the later stages. Our results of this study are highly inconsistent with those of most residues return studies [49,50]. The main reason why the results of most straw return studies do not agree with this study is probably related to the timing of the return. Straw is usually returned to the field in autumn and winter [51,52] when no crops are being grown, and the straw material has been fermented over the winter (including early spring) and is primed for degradation and does not compete with crops for nutrients. Therefore, if poplar sawdust is applied directly, it must be applied prior to planting to encourage the completion of early fermentation and nutrient processes that are more beneficial to plant growth.

4.3. Response of Secondary Metabolite Monomers to Biochars and Poplar Sawdust Application

Under the application of poplar sawdust, the contents of isoquercetin, kaempferol-3-O-glucuronide, kaempferol-3-O-rhamnoside, pterocaryoside B and 3-O-caffeioylquinic acid were higher than those of other treatments. Isoquercetin, kaempferol-3-O-glucuronide and kaempferol-3-O-rhamnoside are produced by naringin through dihydrokaempferol under the successive action of flavanone-3-hydroxylase(F3H) and flavonol synthase (FLS) [53]. 3-O-caffeioylquinic acid is a phenylalanine substance formed by phenylalanine under the action of phenylalanine ammonia-lyase (PAL) through the shikimic acid pathway [54,55,56]. The synthesis pathway of Pterocaryoside B is unclear. In the early stage of the pot experiment, excessive nutrient competition between soil microbes and C. paliurus caused by poplar sawdust application and the heat generated by the decomposition of poplar sawdust may have an impact on key enzymes in the synthesis process of secondary metabolites in C. paliurus leaves, thereby affecting the monomer content of secondary metabolites. Phenylalanine ammonia–lyase (PAL), cinnamic acid 4-hydroxylase (C4H), and 4-coumarate-CoA ligase (4CL) are crucial enzymes in the synthesis of polyphenolic compounds, playing an important role in the synthesis and metabolism of benzoic acid, salicylic acid, p-coumaric acid, caffeic acid, flavonoids and other substances [57]. Studies have found that when plants were subjected to low/high temperature, mechanical injury or other stresses; PAL, C4H and 4CL activities increased rapidly; and a large number of phenolic acids, flavonoids and other substances were accumulated [58,59,60]. Glycosyl transferases (GT) are usually located at the most downstream of triterpenoid saponin synthesis to regulate the conversion between triterpenoid saponins types with similar structures [61]. Pecetti et al. [62] showed that total saponins increased in alfalfa (Medicago sativa) with high daytime temperature during the growth period, revealing that moderate-high temperature increased sterol GT enzyme activity. The redundancy analysis of our research indicated a trade-off existed between different secondary metabolite monomers from the RDA axis 2, which implied a possible substituting synthesis of the monomers with similar functions to protect the plants against external stresses. Currently, the regulatory mechanism of environmental factors on the synthesis of secondary metabolite monomers is not clearly understood. Some future research should emphasize the synthesis process and regulatory mechanism of target monomers of plants with biochar application to facilitate the re-use of forestry residues for the cultivation of medicinal plants.

5. Conclusions

The application of biochars at both pyrolysis temperatures improved soil properties to a certain extent, with an even increased soil improvement effect as the pyrolysis temperature of biochar increased. The high pyrolysis temperature of biochar increased the accumulation of secondary metabolites in C. paliurus by increasing the leaf biomass, whereas the low pyrolysis temperature of biochar had no effect on the accumulation of secondary metabolites in C. paliurus. The direct application of poplar sawdust caused stress on the growth of C. paliurus, reducing its leaf biomass while increasing secondary metabolite content and their monomers, leading to a decrease in secondary metabolite yield. Therefore, a trade-off between primary growth and secondary metabolism in C. paliurus existed, and the accumulation of secondary metabolites was dominated by the leaf biomass. Hence, when using forestry residue to produce biochar for medicinal plant cultivation and trying to achieve a high yield of target secondary metabolites, future research should focus on the balance between primary growth and secondary metabolism in plants which was adjusted by the application of biochar. Although we demonstrated that the addition of biochar prolyzed under relatively high temperatures could increase the yield of secondary metabolites in the leaves of the C. paliurus seedling using pot experiment, corresponding field experiments using mature plants need to be carried out in the future for further verification.

Author Contributions

Y.T. and W.L. were responsible for the conceptualization, methodology used, data evaluation, data validation, and formal analysis. W.L., Y.T., C.L., R.Y., Y.J. and T.L. conducted pot experiments and data collection. The original draft of this article was prepared by Y.T. and W.L., who were also responsible for the review and editing process of this article. All authors have read and agreed to the published version of the manuscript.

Funding

This research was funded by the National Key Research and Development Program of China, grant number 2021YFD2201202.

Data Availability Statement

Data is available upon request to the corresponding author.

Acknowledgments

We acknowledge Jiayu Zhang and Zheng Zhai from Nanjing Forestry University for their laboratory assistance and suggestions for the manuscript.

Conflicts of Interest

The authors declare no conflict of interest.

References

  1. Xie, G.U.; Fu, T.C.; Ma, L.Y.; Li, H.; Bao, W.Q.; Li, S. An overview of definition and classification of forestry residue. J. China Agric. Univ. 2018, 23, 141–149. [Google Scholar] [CrossRef]
  2. Duan, X.F.; Zhou, Z.F.; Xu, J.M.; Wang, R. Utilization situation and suggestion of forestry residues resources in China. China Wood-Based Panel. 2017, 24, 1–5. [Google Scholar]
  3. Xu, Y.; Du, X.Z.; Qi, Y.J.; Ma, L.; Zheng, G. Utilization of wood processing residues. China For. Prod. Ind. 2015, 42, 40–44. [Google Scholar] [CrossRef]
  4. Qiu, H.G.; Yan, J.B.; Lei, Z.; Sun, D. Rising wages and energy consumption transition in rural China. Energy Policy. 2018, 119, 545–553. [Google Scholar] [CrossRef]
  5. Sohi, S.P.; Krull, E.; Lopez-capel, E.; Bol, R. A review of biochar and its use and function in soil. Adv. Agron. 2010, 105, 47–82. [Google Scholar] [CrossRef]
  6. Lehmann, J.; Gaunt, J.; Rondon, M. Bio-char sequestration in terrestrial ecosystems—A review. Mitig. Adapt. Strateg. Glob. Change 2006, 11, 403–427. [Google Scholar] [CrossRef]
  7. Chen, F.W.; Zhang, W.M.; Meng, J. Biochar and Agro-ecological Environment: Review and Prospect. J. Agro-Environ. Sci. 2014, 33, 811–818. [Google Scholar] [CrossRef]
  8. Liang, B.; Lehmann, J.; Solomon, D.; Kinyangi, J.; Grossman, J.; O’Neill, B.; Skjemstad, J.O.; Thies, J.; Luizão, F.J.; Petersen, J.; et al. Black carbon increases cation exchange capacity in soils. Soil Sci. Soc. Am. J. 2006, 70, 1719–1730. [Google Scholar] [CrossRef] [Green Version]
  9. Spokas, A.K.; Cantrell, B.K.; Novak, M.J.; Archer, D.W.; Ippolito, J.A.; Collins, H.P.; Boateng, A.A.; Lima, I.M.; Lamb, M.C.; McAloon, A.J.; et al. Biochar: A synthesis of its agronomic impact beyond carbon sequestration. J. Environ. Qual. 2012, 41, 973–989. [Google Scholar] [CrossRef] [Green Version]
  10. Tomczyk, A.; Sokolowska, Z.; Boguta, P. Biochar physicochemical properties: Pyrolysis temperature and feedstock kind effects. Rev. Environ. Sci. Bio/Technol. 2020, 19, 191–215. [Google Scholar] [CrossRef] [Green Version]
  11. Yuan, S.; Zhao, L.X.; Meng, H.B.; Shen, Y.J. The main types of biochar and their properties and expectative researches. J. Plant Nutr. Fertil. 2016, 22, 1402–1417. [Google Scholar]
  12. Ippolito, J.A.; Cui, L.Q.; Kammann, C.; Wrage-Mönnig, N.; Estavillo, J.M.; Fuertes-Mendizabal, T.; Cayuela, M.L.; Sigua, G.; Novak, J.; Spokas, K.; et al. Feedstock choice, pyrolysis temperature and type influence biochar characteristics: A comprehensive meta-data analysis review. Biochar 2020, 2, 421–438. [Google Scholar] [CrossRef]
  13. Ajayi, A.E.; Horn, R. Modification of chemical and hydrophysical properties of two texturally differentiated soils due to varying magnitudes of added biochar. Soil Tillage Res. 2016, 164, 34–44. [Google Scholar] [CrossRef]
  14. Tang, H.M. Effects of Microbial Fertilize and Biochar Applications on the Yield and Quality of Pinelia Ternata and Soil Microecology; Huazhong Agricultural University: Wuhan, China, 2020; Volume 2. [Google Scholar] [CrossRef]
  15. Zulfiqar, F.; Chen, J.J.; Younis, A. Biochar, compost, and biochar-compost blend applications modulate growth, photosynthesis, osmolytes, and antioxidant system of medicinal plant Alpinia zerumbet. Front. Plant Sci. 2021, 12, 707061. [Google Scholar] [CrossRef]
  16. Saha, A.; Basak, B.B.; Gajbhiye, N.A.; Kalariya, K.A.; Manivel, P. Sustainable fertilization through co-application of biochar and chemical fertilizers improves yield, quality of Andrographis paniculata and soil health. Ind. Crops Prod. 2019, 140, 111607. [Google Scholar] [CrossRef]
  17. Coruzzi, G.; Bush, D.R. Nitrogen and Carbon Nutrient and Metabolite Signaling in Plants. Plant Physiol. 2001, 125, 61–64. [Google Scholar] [CrossRef] [PubMed] [Green Version]
  18. Stamp, N. Out of the quagmire of plant defense hypotheses. Q. Rev. Biol. 2003, 78, 23–55. [Google Scholar] [CrossRef] [PubMed] [Green Version]
  19. Kuang, K.Q.; Li, P.Q. Flora of China; Science Press: Beijing, China, 1979; pp. 18–19. [Google Scholar]
  20. Chen, Y.; Chen, W.; Li, F.T.; Ma, L. Research progress on chemical constituents and pharmacological actions of Cyclocarya paliurus. Anim. Husb. Feed. Sci. 2019, 40, 12–13. [Google Scholar] [CrossRef]
  21. Huang, Y.; Wang, S.L.; Feng, Z.W.; Wang, H.; Huang, H. Comparative study of selected soil properties following introduction of broad-leaf trees into clear-felled Chinese fir forest. Commun. Soil Sci. Plant Anal. 2005, 36, 1385–1403. [Google Scholar] [CrossRef]
  22. Vance, E.D.; Brookes, P.C.; Jenkinson, D.S. An extraction method for measuring soil microbial biomass C. Soil Biol. Biochem. 1987, 19, 703–707. [Google Scholar] [CrossRef]
  23. Feng, Z.S.; Wu, C.E.; Fang, S.Z.; Yang, W.X.; Yang, J.T.; Li, T.T. Technology optimization of total flavonoids extraction from Cyclocarya paliurus leaves by ultrasonic assistance. Trans. Chin. Soc. Agric. Mach. 2009, 49, 130–134. [Google Scholar]
  24. Yue, X.L.; Qin, J.; Fu, X.X.; Shang, X.L.; Fang, S.Z. Effects of nitrogen fertilization on secondary metabolite accumulation and antioxidant capacity of Cycolcurya paliurus (Batal.) Iljinskaja Leaves. J. Nanjing For. Univ. Nat. Sci. Ed. 2020, 44, 35–42. [Google Scholar] [CrossRef]
  25. Fan, J.P.; He, C.H. Simultaneous quantification of three major bioactive triterpene acids in the leaves of Diospyros kaki by high performance liquid chromatography method. J. Pharm. Biomed. Anal. 2006, 41, 950–956. [Google Scholar] [CrossRef]
  26. Alothman, M.; Bhat, R.; Karim, A.A. Antioxidant capacity and phenolic content of selected tropical fruits from Malaysia, extracted with different solvent. Food Chem. 2009, 115, 785–788. [Google Scholar] [CrossRef]
  27. Cao, Y.N.; Fang, S.Z.; Yin, Z.Q.; Fu, X.X.; Shang, X.L.; Yang, W.X.; Yang, H.M. Chemical fingerprint and multicomponent quantitative analysis for the quality evaluation of Cyclocarya paliurus leaves by HPLC–Q–TOF–MS. Molecules 2017, 22, 1927. [Google Scholar] [CrossRef] [Green Version]
  28. Steiner, C.; Teixeira, W.G.; Lehmann, J.; Nehls, T.; Macêdo, J.L.; Blum, W.; Zech, W. Long term effects of manure, charcoal and mineral fertilization on crop production and fertility on a highly weathered Central Amazonian upland soil. Plant Soil. 2007, 291, 275–290. [Google Scholar] [CrossRef] [Green Version]
  29. Jeffery, S.; Verheijen, F.G.A.; Velde, M.; Bastos, A.C. A quantitative review of the effects of biochar application to soils on crop productivity using meta-analysis. Agric. Ecosyst. Environ. 2011, 144, 175–187. [Google Scholar] [CrossRef]
  30. Major, J.; Rondon, M.; Molina, D.; Riha, S.J.; Lehmann, J. Maize yield and nutrition during 4 years after biochar application to a Colombian savanna oxisol. Plant Soil. 2010, 333, 117–128. [Google Scholar] [CrossRef]
  31. Zwieten, L.V.; Kimber, S.; Morris, S.; Chan, K.Y.; Downie, A.; Rust, J.; Joseph, S.; Cowie, A. Effects of biochar from slow pyrolysis of papermill waste on agronomic performance and soil fertility. Plant Soil. 2010, 327, 235–246. [Google Scholar] [CrossRef]
  32. Güereña, D.; Lehmann, J.; Hanley, K.; Enders, A.; Hyland, C.; Riha, S. Nitrogen dynamics following field application of biochar in a temperate North American maize-based production system. Plant Soil. 2013, 365, 239–254. [Google Scholar] [CrossRef]
  33. Deng, R.; Lan, Z.Y.; Shang, X.L.; Fang, S.Z. Effects of biochar application pyrolyzed at different temperatures on soil properties, growth and leaf secondary metabolite accumulation in Cyclocarya paliurus. Forsets 2022, 13, 1572. [Google Scholar] [CrossRef]
  34. Glaser, B.; Lehmann, J.; Zech, W. Ameliorating physical and chemical properties of highly weathered soils in the tropics with charcoal-a review. Biol. Fertil. Soils 2002, 35, 119–130. [Google Scholar] [CrossRef]
  35. Weber, K.; Quicker, P. Properties of biochar. Fuel 2018, 217, 240–261. [Google Scholar] [CrossRef]
  36. Abideen, Z.; Koyro, H.W.; Huchzermeyer, B.; Ansari, R.; Zulfiqar, F.; Gulet, B. Ameliorating effects of biochar on photosynthetic efficiency and antioxidant defence of Phragmites karka under drought stress. Plant Biol. 2020, 22, 259–266. [Google Scholar] [CrossRef]
  37. Frischknecht, P.M.; Schuhmacher, K.; Müller-Schärer, H.; Baumann, T.W. Phenotypic plasticity of Senecio vulgaris from contrasting habitat types: Growth and pyrrolizidine alkaloid formation. J. Chem. Ecol. 2001, 27, 343–358. [Google Scholar] [CrossRef]
  38. Chen, G.; Qiao, J.; Zhao, G.H.; Zhang, H.M.; Shen, Y.Q.; Cheng, W.D. Rice-straw biochar regulating effect on Chrysanthemum morifolium Ramat. cv. ‘Hangbaiju’. Agron. J. 2018, 110, 1996–2003. [Google Scholar] [CrossRef]
  39. Petruccelli, R.; Bonetti, A.; Traversi, M.L.; Faraloni, C.; Valagussa, M.; Pozzi, A. Influence of biochar application on nutritional quality of tomato (Lycopersicon esculentum). Crop Pasture Sci. 2015, 66, 747–755. [Google Scholar] [CrossRef] [Green Version]
  40. Zhao, J.; Ni, T.; Xun, W.B.; Huang, X.L.; Huang, Q.W.; Ran, W.; Shen, B.; Zhang, R.F.; Shen, Q.R. Influence of straw incorporation with and without straw decomposer on soil bacterial community structure and function in a rice-wheat cropping system. Appl. Microbiol. Biotechnol. Vol. 2017, 101, 4761–4773. [Google Scholar] [CrossRef]
  41. Kaye, J.; Hart, S. Competition for nitrogen between plants and soil microorganisms. Trends Ecol. Evol. 1997, 12, 139–143. [Google Scholar] [CrossRef]
  42. Li, H.; Dai, M.W.; Dai, S.L.; Dong, X.J. Current status and environment impact of direct straw return in China’s cropland–A review. Ecotoxicol. Environ. Saf. 2018, 159, 293–300. [Google Scholar] [CrossRef]
  43. Liang, J.P.; Jia, X.Y.; Liu, Y.L.; Wu, Y.; Zhou, R.; Feng, Q.J. Effects of drought stress on seedling growth and accumulation of secondary metabolites in the roots of Astragalus membranaceus var. mongholicus. Acta Ecol. Sinica. 2016, 36, 4415–4422. [Google Scholar] [CrossRef]
  44. Xu, X.L.; Ouyang, H.; Pei, Z.Y.; ZHOU, C.P. Long-term partitioning of ammonium and nitrate among different components in an alpine meadow ecosystem. Acta Bot. Sinica. 2004, 46, 279–283. [Google Scholar] [CrossRef]
  45. Jiang, J.; Song, M.H. Review of the roles of plants and soil microorganisms in regulating ecosystem nutrient cycling. Chin. J. Plant Ecol. 2010, 38, 979–988. [Google Scholar] [CrossRef]
  46. Hodge, A.; Robinson, D.; Fitter, A. Are microorganisms more effective than plants at competing for nitrogen? Trends Plant Sci. 2000, 5, 304–308. [Google Scholar] [CrossRef] [PubMed]
  47. Bryant, J.P.; Chapin, F.S.; Klein, D.R. Carbon/nutrient balance of boreal plants in relation to vertebrate herbivory. Oikos 1983, 40, 357–368. [Google Scholar] [CrossRef] [Green Version]
  48. Recous, S.; Robin, D.; Darwis, D.; Mary, B. Soil inorganic N availability: Effect on maize residue decomposition. Soil Biol. Biochem. 1995, 27, 1529–1538. [Google Scholar] [CrossRef]
  49. Liu, C.; Lu, M.; Cui, J.; Li, B.; Fanget, C.M. Effects of straw carbon input on carbon dynamics in agricultural soils: A meta-analysis. Glob. Change Biol. 2014, 20, 1366–1381. [Google Scholar] [CrossRef] [PubMed]
  50. Zhao, H.; Sun, B.F.; Lu, F.; Zhang, G.; Wang, X.K.; Ouyang, Z.Y. Straw incorporation strategy on cereal crop yield in China. Crop Sci. 2015, 55, 1773–1781. [Google Scholar] [CrossRef]
  51. Lou, Y.; Xu, M.; Wang, W.; Sun, X.L.; Zhao, K. Return rate of straw residue affects soil organic C sequestration by chemical fertilization. Soil Tillage Res. 2011, 113, 70–73. [Google Scholar] [CrossRef]
  52. Thomsen, I.K.; Christensen, B.T. Yields of wheat and soil carbon and nitrogen contents following long-term incorporation of barley straw and ryegrass catch crops. Soil Use Manag. 2004, 20, 432–438. [Google Scholar] [CrossRef]
  53. Lin, C.C.; Chen, D.W.; Dai, J.G. Advances of synthetic biology of flavonoids. Acta Pharm. Sin. 2022, 57, 1322–1335. [Google Scholar] [CrossRef]
  54. Ulbrich, B.; Zenk, M.H. Partial purification and properties of hydroxycinnamoyl-CoA: Quinate hydroxycinnamoyl transferase from higher plants. Phytochemistry 1979, 18, 929–933. [Google Scholar] [CrossRef]
  55. Villegas, R.J.; Kojima, M. Purification and characterization of hydroxycinnamoyl D-glucose. Quinate hydroxycinnamoyl transferase in the root of sweet potato, Ipomoea batatas Lam. J. Biol. Chem. 1986, 261, 8729–8733. [Google Scholar] [CrossRef] [PubMed]
  56. Gao, Y.; Ma, S.; Dai, M.; Feng, X.Y. Progress in Research on the biosynthesis pathway and metabolic regulation of phenolic acids. Food Sci. 2018, 39, 286–293. [Google Scholar] [CrossRef]
  57. Strissel, T.; Halbwirth, H.; Hoyer, U.; Zistler, C.; Stich, K.; Treutter, D. Growth-promoting nitrogen nutrition affects flavonoid biosynthesis in young apple (Malus domestica Borkh) leaves. Plant Biol. 2005, 7, 677–685. [Google Scholar] [CrossRef]
  58. Romanazzi, G.; Sanzani, S.M.; Bi, Y.; Tian, S.P.; Martínez, P.G.; Alkan, N. Induced resistance to control postharvest decay of fruit and vegetables. Postharvest Biol. Technol. 2016, 122, 82–94. [Google Scholar] [CrossRef]
  59. Ling, Y.; Qing, J.; Shang, X.L.; Yang, W.X.; Fang, S.Z. Effect of applying amount of nitrogen on growth and total phenolic accumulation in Cyclocarya paliurus seedling. J. Plant Resour. Environ. 2020, 29, 45–51. [Google Scholar] [CrossRef]
  60. Rivero, R.M.; Ruiz, J.M.; Romero, L. Can grafting in tomato plants strengthen resistance to thermal stress? J. Sci. Food Agric. 2003, 83, 1315–1319. [Google Scholar] [CrossRef]
  61. Jiao, X.L.; Gao, W.W. Advances in studies on influence of environmental factors on triterpenoid saponin synthesis in medicinal plants. Chin. Tradit. Herb. Drugs. 2011, 42, 398–420. [Google Scholar]
  62. Pecetti, L.; Tava, A.; Romani, M.; Benedetto, M.G.; Corsiet, P. Variety and environment effects on the dynamics of saponins in Lucerne (Medicago sativa L.). Eur. J. Agron. 2006, 25, 187–192. [Google Scholar] [CrossRef]
Figure 1. Soil microbial biomass carbon (MBC, (A)) and nitrogen (MBN, (B)) content and MBC/MBN ratio (C) with the application of poplar sawdust and biochars pyrolyzed at 350 °C and 600 °C. C0, treatment with 15% addition (volume ratio) of poplar sawdust; C350, treatment with 15% addition (volume ratio) of biochar pyrolyzed under 350 °C; C600, treatment with 15% addition (volume ratio) of biochar pyrolyzed under 600 °C. CK, the control with no biochar or poplar sawdust addition. Data were presented as the mean ± standard deviation (SD). Different lowercase letters indicate significant differences in each property between different treatments, according to Duncan’s test (p < 0.05).
Forests 14 01298 g001
Figure 2. Growth dynamics of seedling height (A) and ground diameter (B) of C. paliurus with the application of poplar sawdust and biochars pyrolyzed at 350 °C and 600 °C. C0, treatment with 15% addition (volume ratio) of poplar sawdust; C350, treatment with 15% addition (volume ratio) of biochar pyrolyzed under 350 °C; C600, treatment with 15% addition (volume ratio) of biochar pyrolyzed under 600 °C. CK, the control with no biochar or poplar sawdust addition. Data were presented as the mean ± standard deviation (SD).
Forests 14 01298 g002
Figure 3. Leaf biomass of C. paliurus with the application of poplar sawdust and biochars pyrolyzed at 350 °C and 600 °C. C0, treatment with 15% addition (volume ratio) of poplar sawdust; C350, treatment with 15% addition (volume ratio) of biochar pyrolyzed under 350 °C; C600, treatment with 15% addition (volume ratio) of biochar pyrolyzed under 600 °C. CK, the control with no biochar or poplar sawdust addition. Data were presented as the mean ± standard deviation (SD). Different lowercase letters indicate significant differences in each property between different treatments, according to Duncan’s test (p < 0.05).
Forests 14 01298 g003
Figure 4. Content of flavonoid (A), triterpenoid (B) and polyphenol (C) in leaves of C. paliurus with the application of poplar sawdust and biochars pyrolyzed at 350 °C and 600 °C. C0, treatment with 15% addition (volume ratio) of poplar sawdust; C350, treatment with 15% addition (volume ratio) of biochar pyrolyzed under 350 °C; C600, treatment with 15% addition (volume ratio) of biochar pyrolyzed under 600 °C. CK, the control with no biochar or poplar sawdust addition. Data were presented as the mean ± standard deviation (SD). Different lowercase letters indicate significant differences in each property between different treatments, according to Duncan’s test (p < 0.05).
Forests 14 01298 g004
Figure 5. HPLC chromatograms of main secondary metabolite monomers of representative leaf samples of C. paliurus with the application of poplar sawdust and biochars pyrolyzed at 350 °C and 600 °C. C0, treatment with 15% addition (volume ratio) of poplar sawdust; C350, treatment with 15% addition (volume ratio) of biochar pyrolyzed under 350 °C; C600, treatment with 15% addition (volume ratio) of biochar pyrolyzed under 600 °C. CK, the control with no biochar or poplar sawdust addition. 1, 3-O-caffeoylquinic acid; 2, 4-O-caffeoylquinic acid; 3, Quercetin-3-O-glucuronide; 4, Quercetin-3-O-galactoside; 5, Isoquercitrin; 6, Kaempferol-3-O-glucuronide; 7, Kaempferol-3-O-glucoside; 8, 4, 5-di-O-caffeoylquinic acid; 9, Kaempferol-3-O-rhamnoside; 10, Arjunolic acid; 11, Cyclocaric acid B; 12, Pterocaryoside B; 13, Pterocaryoside A; 14, Hederagenin; 15, Oleanolic acid.
Forests 14 01298 g005
Figure 6. Contents of main monomers of flavonoid (A), triterpenoid (B) and polyphenol (C) in leaf of C. paliurus with the application of poplar sawdust and biochars pyrolyzed at 350 °C and 600 °C. The unit of the content for each monomer is ug·g−1. C0, treatment with 15% addition (volume ratio) of poplar sawdust; C350, treatment with 15% addition (volume ratio) of biochar pyrolyzed under 350 °C; C600, treatment with 15% addition (volume ratio) of biochar pyrolyzed under 600 °C. CK, the control with no biochar or poplar sawdust addition. “*” indicate significant difference exists for the corresponding monomer between different treatments according to Duncan’s test (p < 0.05).
Forests 14 01298 g006
Figure 7. Yield of leaf flavonoid (A), triterpenoid (B) and polyphenol (C) in C. paliurus with the application of poplar sawdust and biochars pyrolyzed at 350 °C and 600 °C. C0, treatment with 15% addition (volume ratio) of poplar sawdust; C350, treatment with 15% addition (volume ratio) of biochar pyrolyzed under 350 °C; C600, treatment with 15% addition (volume ratio) of biochar pyrolyzed under 600 °C. CK, the control with no biochar or poplar sawdust addition. Different lowercase letters indicate significant differences in each property between different treatments, according to Duncan’s test (p < 0.05).
Forests 14 01298 g007
Figure 8. Correlation between leaf biomass and secondary metabolites content of C. paliurus and soil environmental factors was determined by redundancy analysis (RDA). SBD, soil bulk density; SCP, soil capillary pore; SNP, soil non-capillary pore; STP, soil total porosity; SOC, soil organic carbon; TN, total nitrogen; TIN, soil total inorganic nitrogen; MBC, microbial biomass carbon nitrogen; MBN, microbial biomass nitrogen.
Forests 14 01298 g008
Table 1. Basic properties of poplar sawdust and biochars pyrolyzed at 350 °C and 600 °C. Data were presented as the mean ± standard deviation (SD). “-” means undetectable. Different lowercase letters indicate significant differences in each property between sawdust and biochars according to Duncan’s test (p < 0.05).
MaterialOrganic C ContentTotal N ContentC/N RatiopHBET Surface AreaTotal Pore Volumet-Plot Mesopore Volumet-Plot Micropore Area
g·kg−1 m2·g−1cm3·g−1cm2·g−1
Poplar sawdust45.53 ± 0.06 c0.17 ± 0.00 b267.82 ± 10.78 b6.84 ± 0.18 c1.81 b0.003 b0.003 b-
Biochar-350 °C74.09 ± 0.32 b0.19 ± 0.01 b385.42 ± 21.03 a7.43 ± 0.01 b2.18 b0.003 b0.003 b-
Biochar-600 °C87.04 ± 0.43 a0.41 ± 0.04 a211.16 ± 12.54 c9.82 ± 0.31 a147.05 a0.08 a0.02 a108.28
Table 2. Effects of the application of sawdust and biochar pyrolyzed at 350 °C and 600 °C on soil bulk density and porosity. C0, treatment with 15% addition (volume ratio) of poplar sawdust; C350, treatment with 15% addition (volume ratio) of biochar pyrolyzed under 350 °C; C600, treatment with 15% addition (volume ratio) of biochar pyrolyzed under 600 °C. CK, the control with no biochar or poplar sawdust addition. Data were presented as the mean ± standard deviation (SD). Different lowercase letters indicate significant differences in each property between different treatments, according to Duncan’s test (p < 0.05).
TreatmentSoil Bulk DensitySoil Porosity
Capillary PorosityNon-Capillary PorosityTotal
(g·cm−3)(%)
C00.98 ± 0.02 b44.93 ± 0.38 a7.97 ± 0.98 a52.93 ± 1.14 ab
C3500.98 ± 0.01 b45.40 ± 1.21 a7.92 ± 0.57 a53.61 ± 1.62 ab
C6000.97 ± 0.02 b45.99 ± 0.77 a7.41 ± 1.03 a54.41 ± 1.34 a
CK1.03 ± 0.02 a44.72 ± 1.40 a6.97 ± 0.52 a51.47 ± 0.88 b
Table 3. Effects of the application of sawdust and biochar pyrolyzed at 350 °C and 600 °C on soil chemical properties. C0, treatment with 15% addition (volume ratio) of poplar sawdust; C350, treatment with 15% addition (volume ratio) of biochar pyrolyzed under 350 °C; C600, treatment with 15% addition (volume ratio) of biochar pyrolyzed under 600 °C. CK, the control with no biochar or poplar sawdust addition. Data were presented as the mean ± standard deviation (SD). Different lowercase letters indicate significant differences in each property between different treatments, according to Duncan’s test (p < 0.05).
TreatmentMonthpHOrganic C
Content
(g·kg−1)
Total N
Content
(g·kg−1)
C/N RatioTotal Inorganic N Content
(mg·kg−1)
C0July6.36 ± 0.14 a18.69 ± 1.06 b1.82 ± 0.16 a10.28 ± 0.79 c19.12 ± 1.19 d
C3506.54 ± 0.23 a37.57 ± 0.45 a1.63 ± 0.12 ab23.06 ± 1.31 b79.25 ± 5.77 b
C6006.45 ± 0.31 a39.09 ± 0.99 a1.48 ± 0.69 b26.48 ± 0.96 a92.82 ± 8.79 a
CK6.36 ± 0.16 a13.86 ± 1.87 c1.73 ± 0.23 ab7.46 ± 0.92 d49.59 ± 0.71 c
C0October7.91 ± 0.06 b18.17 ± 2.71 c1.87 ± 0.15 a9.71 ± 1.04 c11.98 ± 0.77 a
C3507.95 ± 0.15 b34.96 ± 4.85 b1.73 ± 0.22 a20.23 ± 2.91 b10.06 ± 0.72 bc
C6008.17 ± 0.06 a45.59 ± 2.08 a1.90 ± 0.17 a24.03 ± 1.30 a10.91 ± 0.44 b
CK7.60 ± 0.02 c11.00 ± 0.96 d1.34 ± 0.10 b8.20 ± 0.25 d9.74 ± 0.29 c
Table 4. Yield of leaf secondary metabolite monomers in C. paliurus with the application of poplar sawdust and biochars pyrolyzed at 350 °C and 600 °C. C0, treatment with 15% addition (volume ratio) of poplar sawdust; C350, treatment with 15% addition (volume ratio) of biochar pyrolyzed under 350 °C; C600, treatment with 15% addition (volume ratio) of biochar pyrolyzed under 600 °C. CK, the control with no biochar or poplar sawdust addition. Data were presented as the mean ± standard deviation (SD). Different lowercase letters indicate significant differences in each property between different treatments, according to Duncan’s test (p < 0.05).
Secondary Metabolite Monomers Content (mg·plant−1)C0C350C600CK
Quercetin-3-O-glucuronide1.46 ± 0.51 a1.60 ± 0.16 a2.03 ± 0.54 a2.37 ± 0.21 a
Quercetin-3-O-galactoside5.18 ± 1.70 a3.51 ± 0.18 a5.08 ± 0.92 a3.75 ± 0.70 a
Isoquercitrin2.75 ± 0.36 b3.85 ± 0.79 ab4.49 ± 0.60 ab5.25 ± 0.57 a
Kaempferol-3-O-glucuronide3.15 ± 0.70 a3.10 ± 0.29 a5.66 ± 0.62 a3.052 ± 0.31 a
Kaempferol-3-O-glucoside0.93 ± 0.22 a0.96 ± 0.09 a1.13 ±0.08 a1.15 ± 0.20 a
Kaempferol-3-O-rhamnoside0.41 ± 0.08 b0.40 ± 0.03 b0.63 ± 0.07 a0.78 ± 0.05 a
Arjunolic acid0.29 ± 0.04 a0.39 ± 0.10 a0.70 ± 0.28 a0.44 ± 0.05 a
Cyclocaric acid B0.26 ± 0.04 c0.34 ± 0.03 bc0.56 ± 0.05 a0.42 ± 0.04 b
Pterocaryoside B5.49 ± 1.06 a5.09 ± 1.05 a6.12 ± 0.40 a5.44 ± 0.36 a
Pterocaryoside A0.34 ± 0.12 a0.32 ± 0.17 a0.42 ± 0.20 a0.38 ± 0.17 a
Hederagenin1.85 ± 0.07 a1.85 ± 0.83 a1.74 ± 0.19 a2.00 ± 0.07 a
Oleanolic acid0.02 ± 0.01 a0.25 ± 0.09 a0.24 ± 0.08 a0.29 ± 0.08 a
3-O-caffeoylquinic acid10.77 ± 1.36 a10.61 ± 0.96 a15.72 ± 2.28 a11.21 ± 1.63 a
4-O-caffeoylquinic acid12.72 ± 1.28 a16.08 ± 2.19 a17.71 ± 2.54 a16.17 ± 3.23 a
4, 5-di-O-caffeoylquinic acid1.89 ± 0.33 a3.11 ± 0.39 a3.06 ± 0.84 a3.68 ± 0.60 a
Different lowercase letters indicate significant differences among treatments, according to Duncan’s test (p < 0.05).
Disclaimer/Publisher’s Note: The statements, opinions and data contained in all publications are solely those of the individual author(s) and contributor(s) and not of MDPI and/or the editor(s). MDPI and/or the editor(s) disclaim responsibility for any injury to people or property resulting from any ideas, methods, instructions or products referred to in the content.

