Article

A Study to Assess the Conservation Effectiveness of Nature Reserves in Hainan, China, from 2000 to 2021

1
Key Laboratory of Earth Observation of Hainan Province, Hainan Aerospace Information Research Institute, Sanya 572029, China
2
International Research Center of Big Data for Sustainable Development Goals, Beijing 100094, China
3
Key Laboratory of Digital Earth Science, Aerospace Information Research Institute, Chinese Academy of Sciences, Beijing 100094, China
*
Authors to whom correspondence should be addressed.
Forests 2023, 14(7), 1293; https://doi.org/10.3390/f14071293
Submission received: 6 April 2023 / Revised: 9 June 2023 / Accepted: 12 June 2023 / Published: 23 June 2023
(This article belongs to the Section Forest Inventory, Modeling and Remote Sensing)

Abstract

:
Nature reserves are special habitats established for representative plant and animal ecosystems, and it is important to strengthen the monitoring and protection of nature reserves for ecological environmental protection. In this paper, 23 typical nature reserves of different levels and types on Hainan Island were selected as the study area. The InVEST model and LandTrendr algorithm were applied in habitat quality assessment and to anthropogenic disturbances of the study area from 2000 to 2021, respectively. Finally, an assessment mode was established, coupling the habitat quality assessment and anthropogenic disturbances, to analyze the spatial and temporal conservation effectiveness of the 23 nature reserves. The results indicate that the 23 nature reserves had good overall conservation effectiveness; 21 had an excellent effectiveness rating, and 2 had a good effectiveness rating between 2000 and 2021. Three of the nature reserves, namely, Dazhoudao, Dongzhaigang and Bangxi, have become significantly more effective. Provincial nature reserves are less effective than national nature reserves in terms of conservation, and are a key concern for follow-up. The conservation effectiveness of the four provincial nature reserves—Nanwan, Qinglangang, Dongfangheilianpilu and Qilinlai—is low, and there has been no significant trend of improvement over the past 21 years. The spatial and temporal changes in the conservation effectiveness of 23 nature reserves on Hainan Island over 21 years can provide scientific data support for the development of nature reserves and departmental supervision in Hainan Province.

1. Introduction

A nature reserve refers to an area of importance for natural ecosystems, with a naturally concentrated distribution of rare and endangered wildlife species, natural relics of special significance, and other protection objects; these are reserved and managed to conserve and provide special opportunities for study or research [1,2,3]. The establishment of nature reserves is the most direct measure we can take to protect biodiversity [4,5,6]. The total area and conservation effectiveness of nature reserves are important indicators of conservation and preservation efforts [7]. Globally, the number and area of nature reserves are still increasing; the inefficiency of nature reserves has been widely recognized due to the different roles of different nature reserves in biodiversity conservation [8]. The conservation effectiveness of many nature reserves is not clear at present, and some of them only exist in name [9,10,11,12].
After the establishment of the first nature reserve, Dinghushan Nature Reserve [13], China placed great emphasis on the establishment of such areas. To date, China has established 2750 nature reserves, of which 474 are at the national level, and the total area of nature reserves has reached 1.47 million square kilometers, accounting for 15% of China’s land area. Scholars have carried out relevant research on many aspects of nature reserves, such as protection objects, protection boundaries, management policies and biodiversity [14,15,16]. As the impact of human activities on nature reserves intensifies, uncertainties in the management of nature reserves are increasing. Therefore, maximizing the efficacy of established nature reserves and quantitatively evaluating the conservation effectiveness of nature reserves have become research topics of great interest.
Traditional effectiveness assessments of nature reserves have focused on the assessment of nature reserve management, mainly relying on the literature and expert knowledge. Recently, with the progress in remote sensing and GIS, studies of spatial and quantitative conservation assessment for nature reserves have been carried out. Remote sensing technology plays a key role in the computational acquisition of large-scale and long-term time series ecological evaluation data, and most researchers have applied Landsat series image data in order to generate new remote sensing ecological indices, alongside constructing improved remote sensing ecological indices to evaluate the spatial and temporal variability characteristics of the effectiveness of nature reserves [17]. Wang et al. (2013) [18] evaluated the conservation effectiveness of a nature reserve on Hainan Island by detecting changes in the forest area within, near, and outside the nature reserve. Nori et al. (2016) [19] studied the conservation effectiveness of the nature reserve network in the Gran Chaco Plain (Gran Chaco) in South America, and found that the nature reserve network protected only 9% of the Gran Chaco Plain, and 9.1% of endemic species.
As a biodiversity hotspot, Hainan Island preserves the largest concentration of tropical rainforests and numerous endemic plant and animal species in China, and has a strong regulating capacity in terms of soil and water conservation, water connotation, and ecological sustainability. By the end of 2017, there were 49 nature reserves of different levels and types in Hainan Province, with a total area of about 2,706,600 km2. However, the rapid population and economic growth of Hainan has led to a gradual deepening of the impact of human activities and an intensification of land resource exploitation [20,21]. The management of nature reserves faces serious challenges, and there is an urgent need to use remote sensing and other technical means to comprehensively monitor human activities and ecosystem health in nature reserves. Due to the uncertainty of the impact of human activities, a scientific and comprehensive conservation effectiveness assessment system needs to be established, that we might accurately judge changes in the effectiveness of conservation in Hainan’s nature reserves [22].
In this study, 23 nature reserves of Hainan Island were selected to conduct an effectiveness assessment using a comprehensive model based on habitat quality and human disturbance data. The habitat quality of 23 nature reserves was first calculated using the Integrated Valuation of Ecosystem Services and Trade-offs (InVEST) model. Second, human activity disturbances were detected using the Landsat-based Detection of Trends in Disturbance and Recovery (LandTrendr) model, which can discriminate vegetation anomalies from the long-term time series remote sensing data of the nature reserves. Finally, the conservation effectiveness of 23 nature reserves was obtained by integrating the assessment results of habitat quality and human disturbance over the past 20 years to indicate the status of the main protected objects and our achievements in maintaining biodiversity and ecosystem function. The establishment of integrated assessments allows for a scientific and comprehensive assessment of the effectiveness of nature reserves, the timely identification of problems, and the provision of data to support the formulation of management policies for different reserves.

2. Study Area and Dataset

2.1. Study Area

Hainan Island is located at 18°08′–20°10′ N and 108°37′–111°03′ E, as the only tropical island of China, with an area of 33,900 km2. The landforms of Hainan Island are mainly mountains, hills, terraces, and terraced plains. Mountains are mainly located in the central southern part of the island, with the highest peak being Wuzhishan, at 1867 m above sea level. The hills are mainly located in the center of the island, and in the northwest and southwest areas. Hainan Island has a tropical monsoon climate divided into wet and dry seasons; the four seasons are non-distinct, and the average annual rainfall is high, at approximately 1640 mm [23]. Studies have concluded that Hainan Island has one of the highest rainfall rates in the world compared to other countries at the same latitude. Hainan has excellent hydrothermal conditions and a rich and diverse composition of vegetation, with a forest cover of over 62% up to the end of 2020.
Some 23 national and provincial nature reserves on Hainan Island were selected as the study area; they have the largest concentration of tropical rainforests and many species of flora and fauna unique to Hainan. The selected nature reserves include various types: 3 marine coastal types, 6 wildlife types, 2 wild plant types and 12 forest ecological types. The nature reserves can be roughly divided into two categories, with forest and wetland being the main habitat types. Most of the forests in the nature reserve are located in mountainous areas, represented by the Wuzhishan and Diaoluoshan nature reserves, and the more specific mangrove forests are mostly located in bays or estuaries that are relatively closed with deep silt, represented by Dongzhaigang and Qinglangang, respectively. The wetland parts of the reserves are all distributed in coastal areas, with marine ecology and benthic organisms as the conservation objects. Specific information is shown in Table 1, Figure 1.

2.2. Dataset

The data used in this study are classified as land use, products, remote sensing data, socio-economic statistics data and other data.
The land use classification of Hainan Province in 2000, 2010, 2020 and 2021 came from the Geographic Sciences and Nature Resources Research, with a spatial resolution of 30 m and a classification accuracy of more than 85%. These sets of classification products were used to drive the InVEST model. Time series Landsat images with cloud cover of less than 10% for each year were selected to run LandTrendr. The socio-economic statistics were mainly obtained from the Statistics Bureau of Hainan Province (http://stats.hainan.gov.cn/ (accessed on 16 March 2020)) and the Hainan Statistical Yearbook of the National Library for every year. Other data include road data and boundary data. The road network data of Hainan Province were obtained from the website Open Street (https://www.openstreetmap.org (accessed on 10 April 2020)). The administrative boundary data and nature reserve boundary data were derived from Hainan Academy of Forestry Science, and the projection of boundary data was converted into the coordinate system, consistent with other data.

2.3. Methods

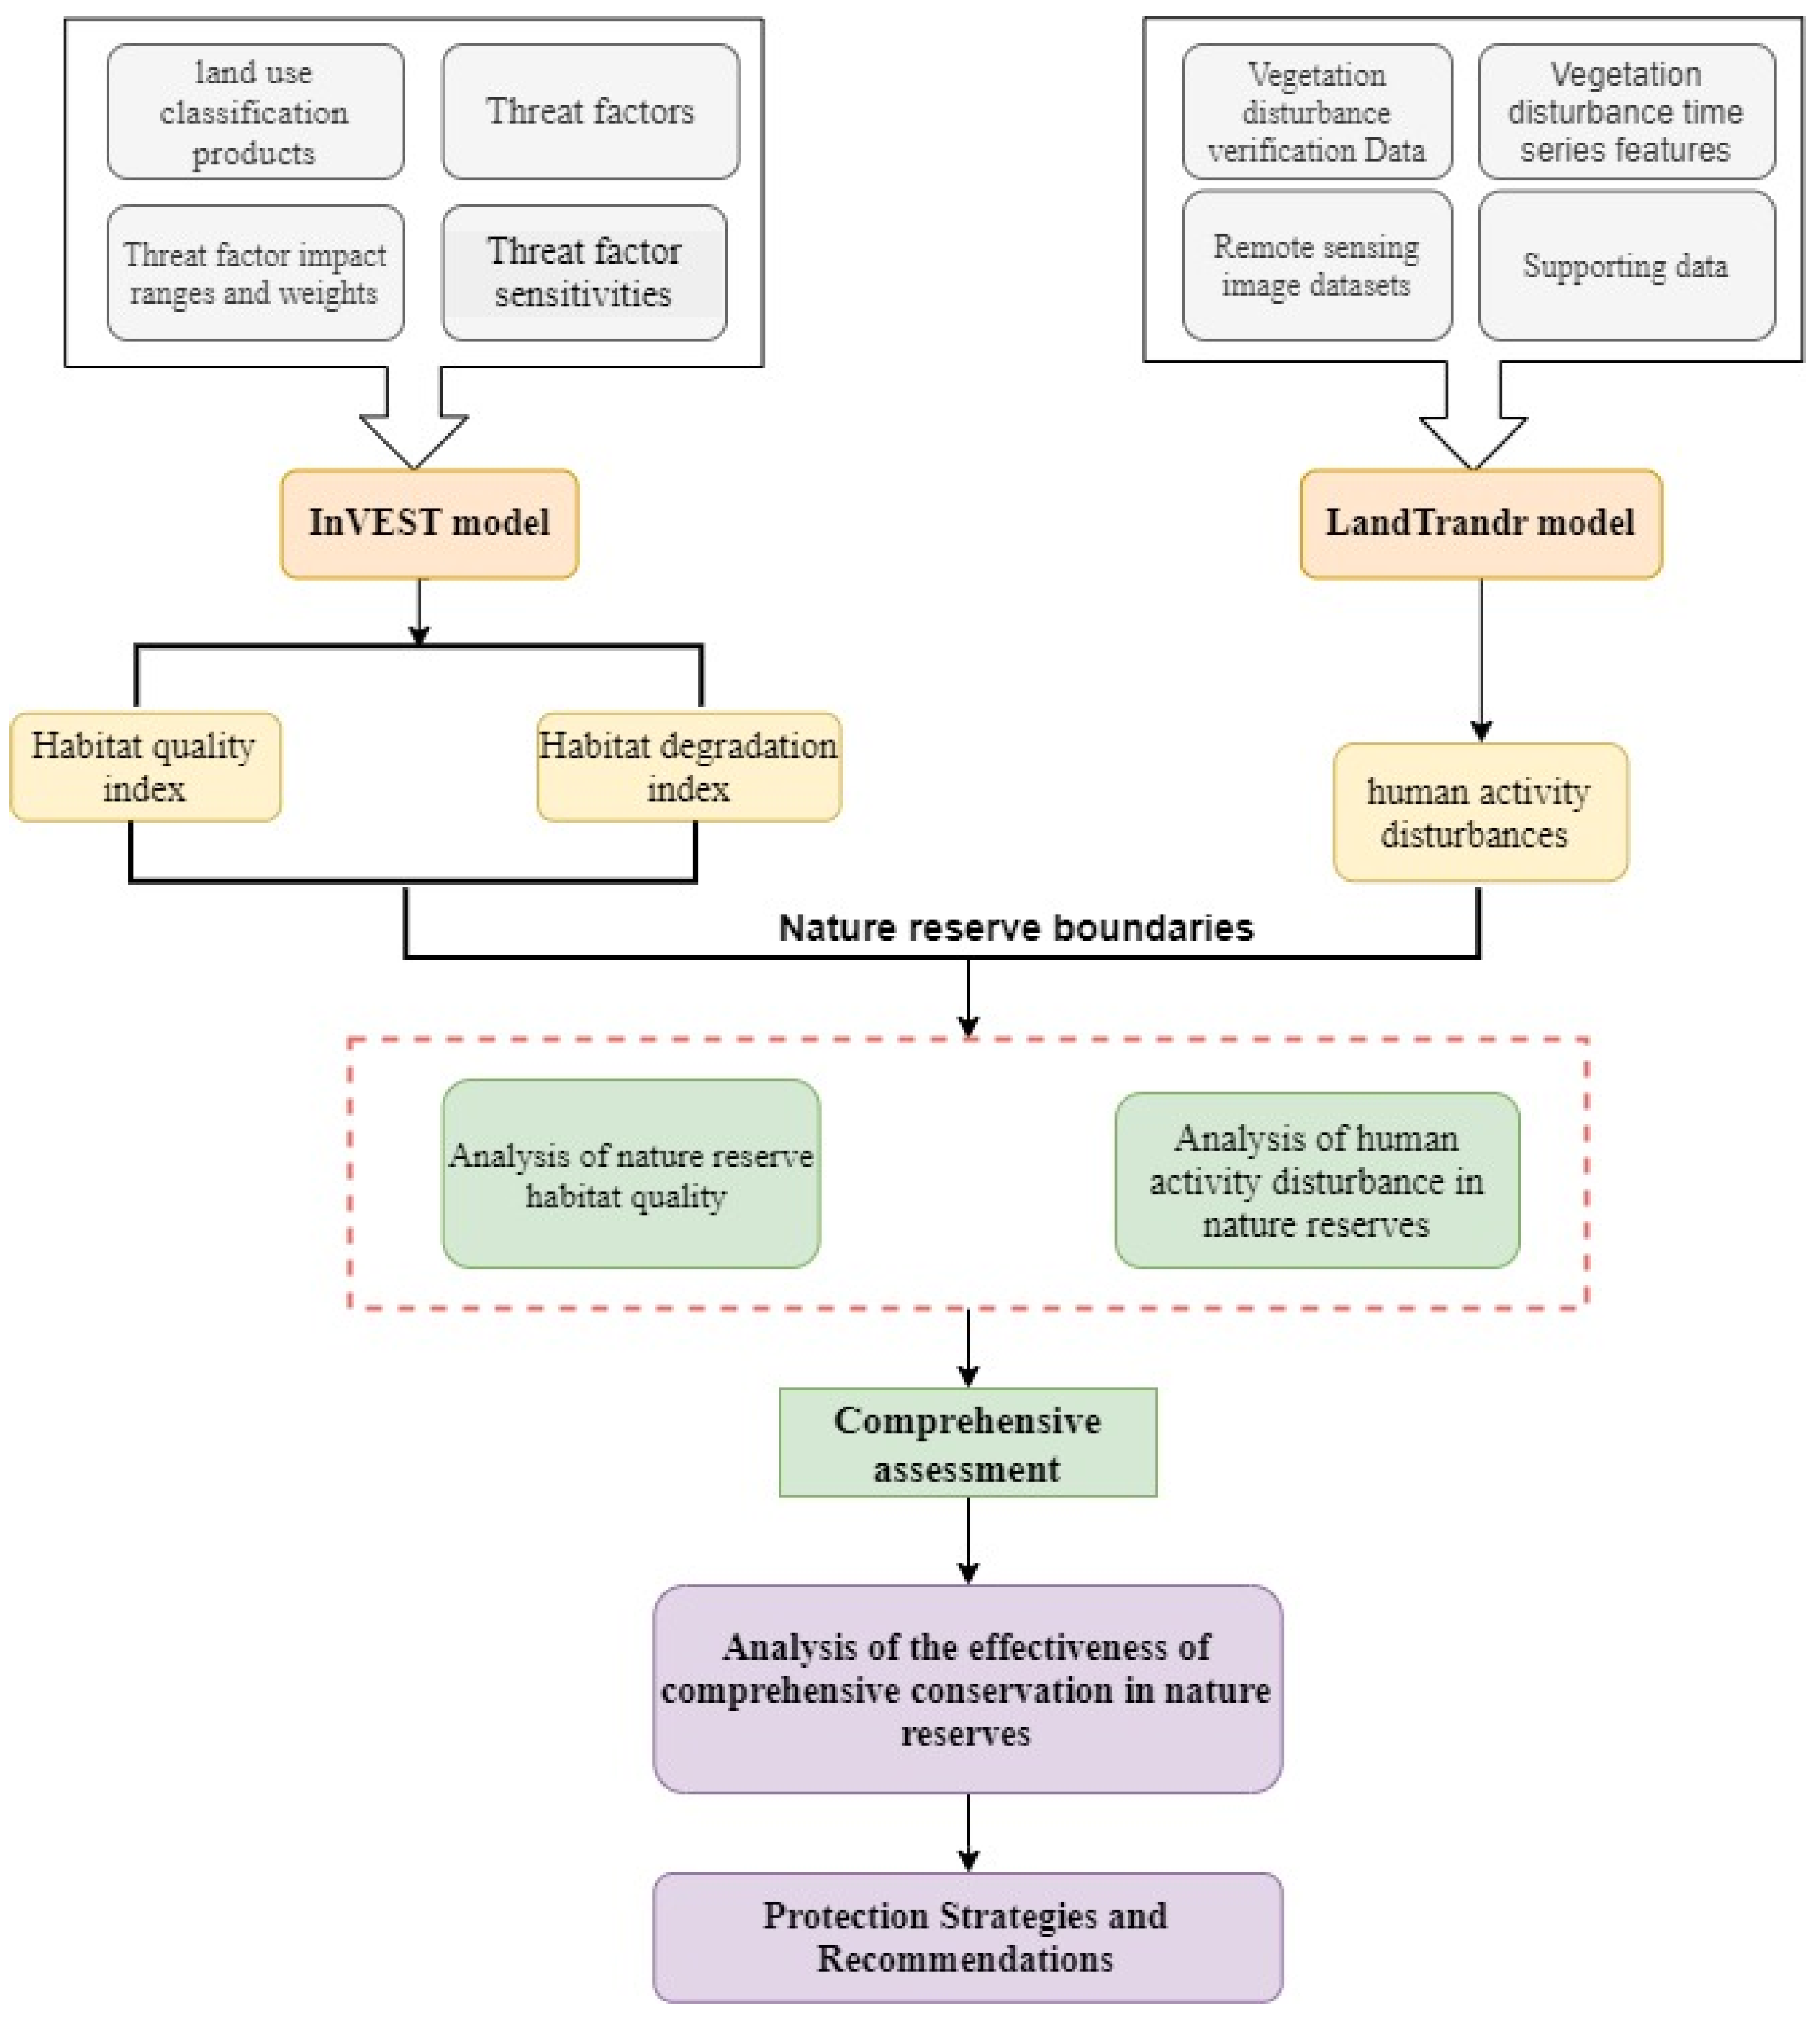
Figure 2 shows a flow chart of the comprehensive assessment of the conservation effectiveness of the nature reserves on Hainan Island, which consists of four main steps: (1) habitat quality and habitat degradation study of the nature reserves using the InVEST model, based on land use data; (2) based on Landsat data, the LandTrendr model was used to obtain long-term time series data from human activity disturbance assessments of the nature reserves; (3) a comprehensive conservation effectiveness analysis of the nature reserves was carried out using the integrated index method, based on the coupling of ecological and disturbance aspects; and (4) based on the results of the study, an analysis of the drivers was carried out in conjunction with local policies and related studies.

2.3.1. Habitat Quality Assessment

The InVEST model was jointly developed by Stanford University, The Nature Conservancy (TNC) and the World Wide Fund for Nature (WWF) [24,25,26,27,28]. This model is commonly used by scholars in China and abroad in habitat quality evaluation, which takes into account the extent of the influence of threat factors, weights, and the sensitivity of each ecological threat factor to the influence of the type of land use cover, etc. [29,30,31]. Its main purpose is to simulate changes in the quality and value of ecosystems under different land use/cover scenarios, and its research results can provide a scientific basis for decision makers. Based on the land cover data and road network data of Hainan Island from 2000 to 2021, the habitat quality module of InVEST was used to obtain the habitat quality and habitat degradation.

Habitat Quality Index

Habitat quality is defined as the existence of resources and the conditions in an area, the main function of which is to provide a habitat for living organisms, accommodating their survival and reproduction [32,33,34]. Generally, the natural ecosystem type is healthy and stable, and less threatened areas have higher habitat quality than other areas. However, if the natural ecosystem is internally unstable and vulnerable to external threats, its habitat quality is lower. Therefore, it is quick and easy to evaluate the biodiversity conservation function of ecosystems at larger spatial scales using data such as land use/cover and disturbance factors. The study quantifies the role of anthropogenic impact factors on habitats, and takes into account the weight of threat factors and threat accessibility to calculate a habitat quality index, using the ecosystem type and disturbance source as data, and raster data as evaluation units.
Q x j = H j 1 N x j Z N x j z + k z
where  Q x i  is the habitat quality of grid  x  in land use type  j H j  is the habitat adaptability of land use type j, which is determined by using an expert scoring method and reading the related literature.  k  is half full and constant, when
1 N x j Z N x j z + k z = 0.5
w h e r e k  is equal to  N x j z  is a normalized constant, usually 2.5;  a n d   N x j  is the habitat degradation degree of grid  x  in land use type  j .

Habitat Degradation Index

Evaluation of the habitat degradation index was mainly affected by the influence distance of the ecological threat factors, the sensitivity of habitats to threat factors, and the number of threat factors [35]. The formula for calculating the habitat degradation index is as follows:
D x j = R = 1 R y = 1 Y r M r r = 1 R M r r y i r x y β x S j r
where  D x j  represents the level of habitat degradation;  R  is the number of threat factors;  Y r  is the grid number of threat factor  r r y  represents the number of threat factors on grid y M r  represents the weight of the threat factor;  β x  represents the accessibility level of the habitat species raster x; and  S j r  is the sensitivity of ground type j to threat factor  r . The values of  M r β x , a n d S j r  are 0–1.  i r x y  represents the threat level of  r y  to habitat grid  x , which can be divided into linear and exponential types:
( linear ) i r x y = 1 d x y d r   m a x
( exponential ) i r x y = exp ( 2.99 d r   m a x d x y )
In Formulas (4) and (5),  i r x y  represents the influence of habitat of grid  x  threatening  r  on grid  y d x y  represents the linear distance between two grids  x y d r   m a x  represents the maximum influence distance of threat factor r. There is a correlation between the distance and decay rate based on the maximum attenuation distance (linear and exponential) of the threat in this study [36].

2.3.2. Human Activity Disturbance

Each pixel in a time series image can reflect the historical events that occurred locally at that time. Domestic and international research scholars have applied the model of time series to the modelling of remote sensing data, which can analyze the time and magnitude of local disturbances that occurred. LandTrendr is a track-based spectrum–time segmentation algorithm, used to detect changes using time series Landsat images, and generating track-based spectral data without inter-annual signal noise [37,38,39,40]. The model takes into account seasonal differences in time series remote sensing data, the inconsistency of images between different years, etc., and is commonly used to monitor real-time disturbances and vegetation changes, which can be used to monitor human activity disturbances in long time series and provide technical support for the regulation of human activities in nature reserves [41]. As shown in Figure 3, the blue pixels identify normal vegetation conditions for a period of time, then interferences occur and the pixels turn a grayish brown, before finally slowly returning to green over time. The three-line segments in the bottom figure represent the change in vegetation state in a certain region, and the break point represents the time point of disturbance occurrence and recovery [42,43,44]. In this study, disturbances found using LandTrendr were considered to be part of the trajectory of human activity, and were applied to evaluate the intensity of human activity [45].
LandsatLinkr (LLR) is an automatic Landsat image processing system, based on the data preprocessing module LandTrendr algorithm, later improved as a separate data processing tool at http://www.landsatlinkr.jdbcode.com (accessed on 13 April 2020). LLR is designed to systematically process Landsat images, linking MSS, TM, ETM+ and OLI data through spatial relationships [46,47,48]. The cloud mask file in Landsat data is used to mask the cloud, and cloud-free images are constructed every year. Based on Landsat Level 2 data of each annual growing season (days 150–240 of the year; cloud cover less than 80%), LLR was used to synthesize time series. The within-year synthesis makes full use of the multiple predictions of Landsat during the year. Using the mean value for the within-year synthesis can suppress noise to a certain extent, making the synthesized images less different for the same land class; after the within-year synthesis, there are still some null values present, but these can be filled in by the adjacent years to obtain a more complete time series.

2.3.3. Conservation Effectiveness Evaluation

By coupling habitat quality/degradation and disturbance factors, a comprehensive model for the evaluation of conservation effectiveness was constructed. Then, changes in conservation effectiveness were calculated for 23 nature reserves, on the basis of which a conservation effectiveness analysis was carried out for these nature reserves.

Determination of Index Weight

The weight reflects the relative importance of each index in the comprehensive model, and calculating the weight of the index is the basis of multi-index comprehensive evaluation [49]. The entropy weight method is designed to determine the target weight based on the influence of the change in index information on the whole system, and this method has been widely used in many fields, such as statistics, and proven to have strong research value. The calculation steps of the entropy method are as follows. (1) Standardization of original data: in order to eliminate the influence of different dimensions among indices, the standardized values (rij) of the measured data of each index were obtained using the standardized formula; (2) Determination of the entropy of the index (Hi); (3) Calculation of the entropy weight (Wi) of the index.
r i j = r i j min r i j max r i j max r i j × 10
H i = k j 1 n f i j ln f i j
w i = 1 H i m i 1 m H i
where  r i j  is used for the case of a sample, i j for indicators, the value of the original data  r i j ´  for the standardized index,  f i j = r i j j 1 n r i j k = 1 ln n H i 0  (assumptions:  f i j  = 0,  f i j ln f i j = 0), and m for system evaluation index number.
The weights of each evaluation index of the effectiveness evaluation of the nature reserves were obtained using the above steps.

Evaluation Model Establishment

The comprehensive index method mainly establishes a linear weighted comprehensive index model based on the standardized value and weight of the index. In this paper, a comprehensive index method is adopted to evaluate the conservation effectiveness of 23 nature reserves [50]. The formula is as follows:
Y j = 1 n X i × W i
where  Y j  represents the protection effectiveness value of the grid cell,  X i  represents the normalized value of the  i  indicator, n is the number of indicators, and  W i  represents the weight of the  i  indicator.

3. Results

3.1. Habitat Quality Assessment

3.1.1. Habitat Quality Index Change Status Analysis

The change in habitat quality in Hainan Nature Reserve in the past 21 years is shown in Figure 4. As can be seen in the figure, the habitat quality of the nature reserve is significantly higher than that of the surrounding areas. The habitat quality index of the nature reserve located in the central mountainous area is higher than that of other areas, and the habitat quality index of the nature reserve located around the coastal zone is lower than that of other areas. The average habitat quality of the Dongfangheilianpilu reserve is only about 0.5, which is much lower than that of other nature reserves. In the past 21 years, the overall habitat quality of the study area increased by 0.308, and the habitat quality index was the lowest in 2000. In 2010, after ecological restoration work, the habitat quality index increased by 0.2. In 2020, Hainan focused on ecological development, and its mangrove restoration work achieved great success, which improved the overall ecological quality of Hainan.
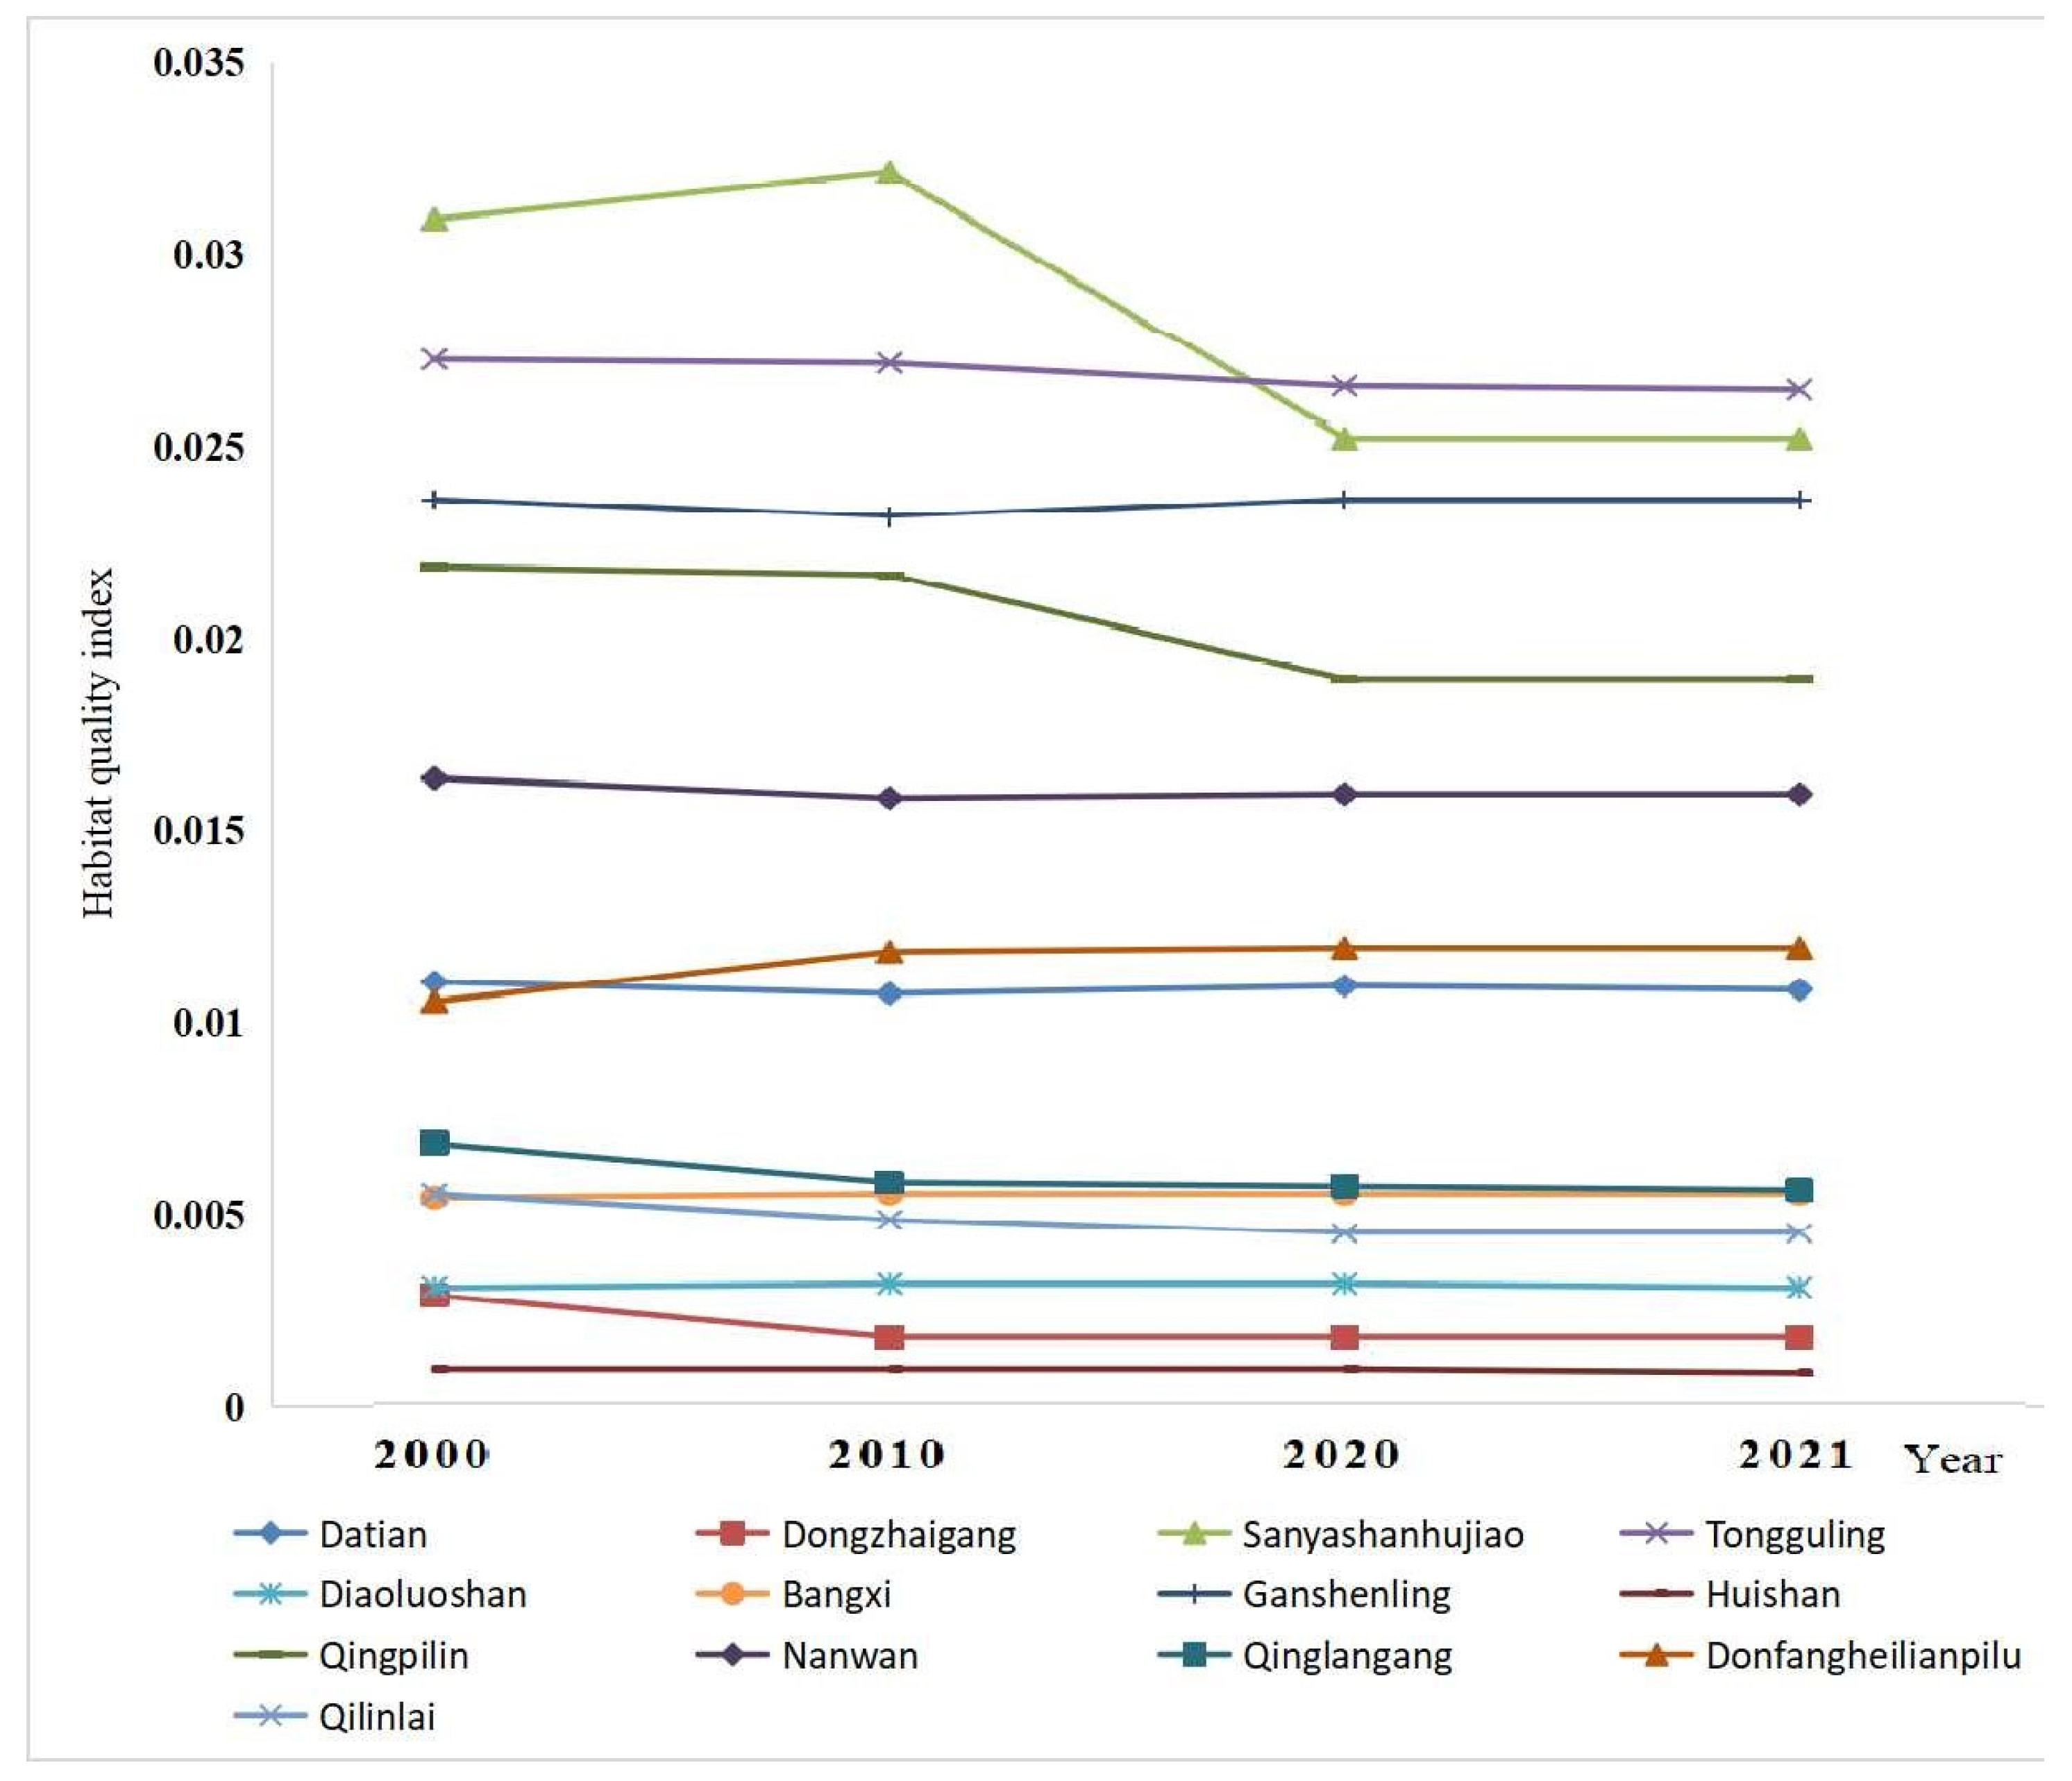
The habitat quality indices of the nature reserve in different years are shown in Figure 5. From 2000 to 2021, there were eleven nature reserves with an increased habitat quality index, namely Datian, Dongzhaigang, Sanyashanhujiao, Bangxi, Fanjia, Jiaxi, Qingpilin, Nanlin, Nanwan, Shangxi, and Qilinlai, accounting for 50% of the study area. There were seven nature reserves with an unchanged habitat quality index (Jianfengling, Tongguling, Wuzhishan, Bawangling, Diaoluoshan, Jianling, and Liulianling), which accounted for 30% of the study area. There were five nature reserves with a decreased habitat quality index (Dazhoudao, Ganshiling, Huishan, Qinglangang and Dongfangheilianpilu), which accounted for 20% of the study area. The lowest habitat quality was found in Qilinlai, followed by Dongfangheilianpilu, and the best habitat quality was found in Wuzhishan.

3.1.2. Habitat Degradation Index Change Status Analysis

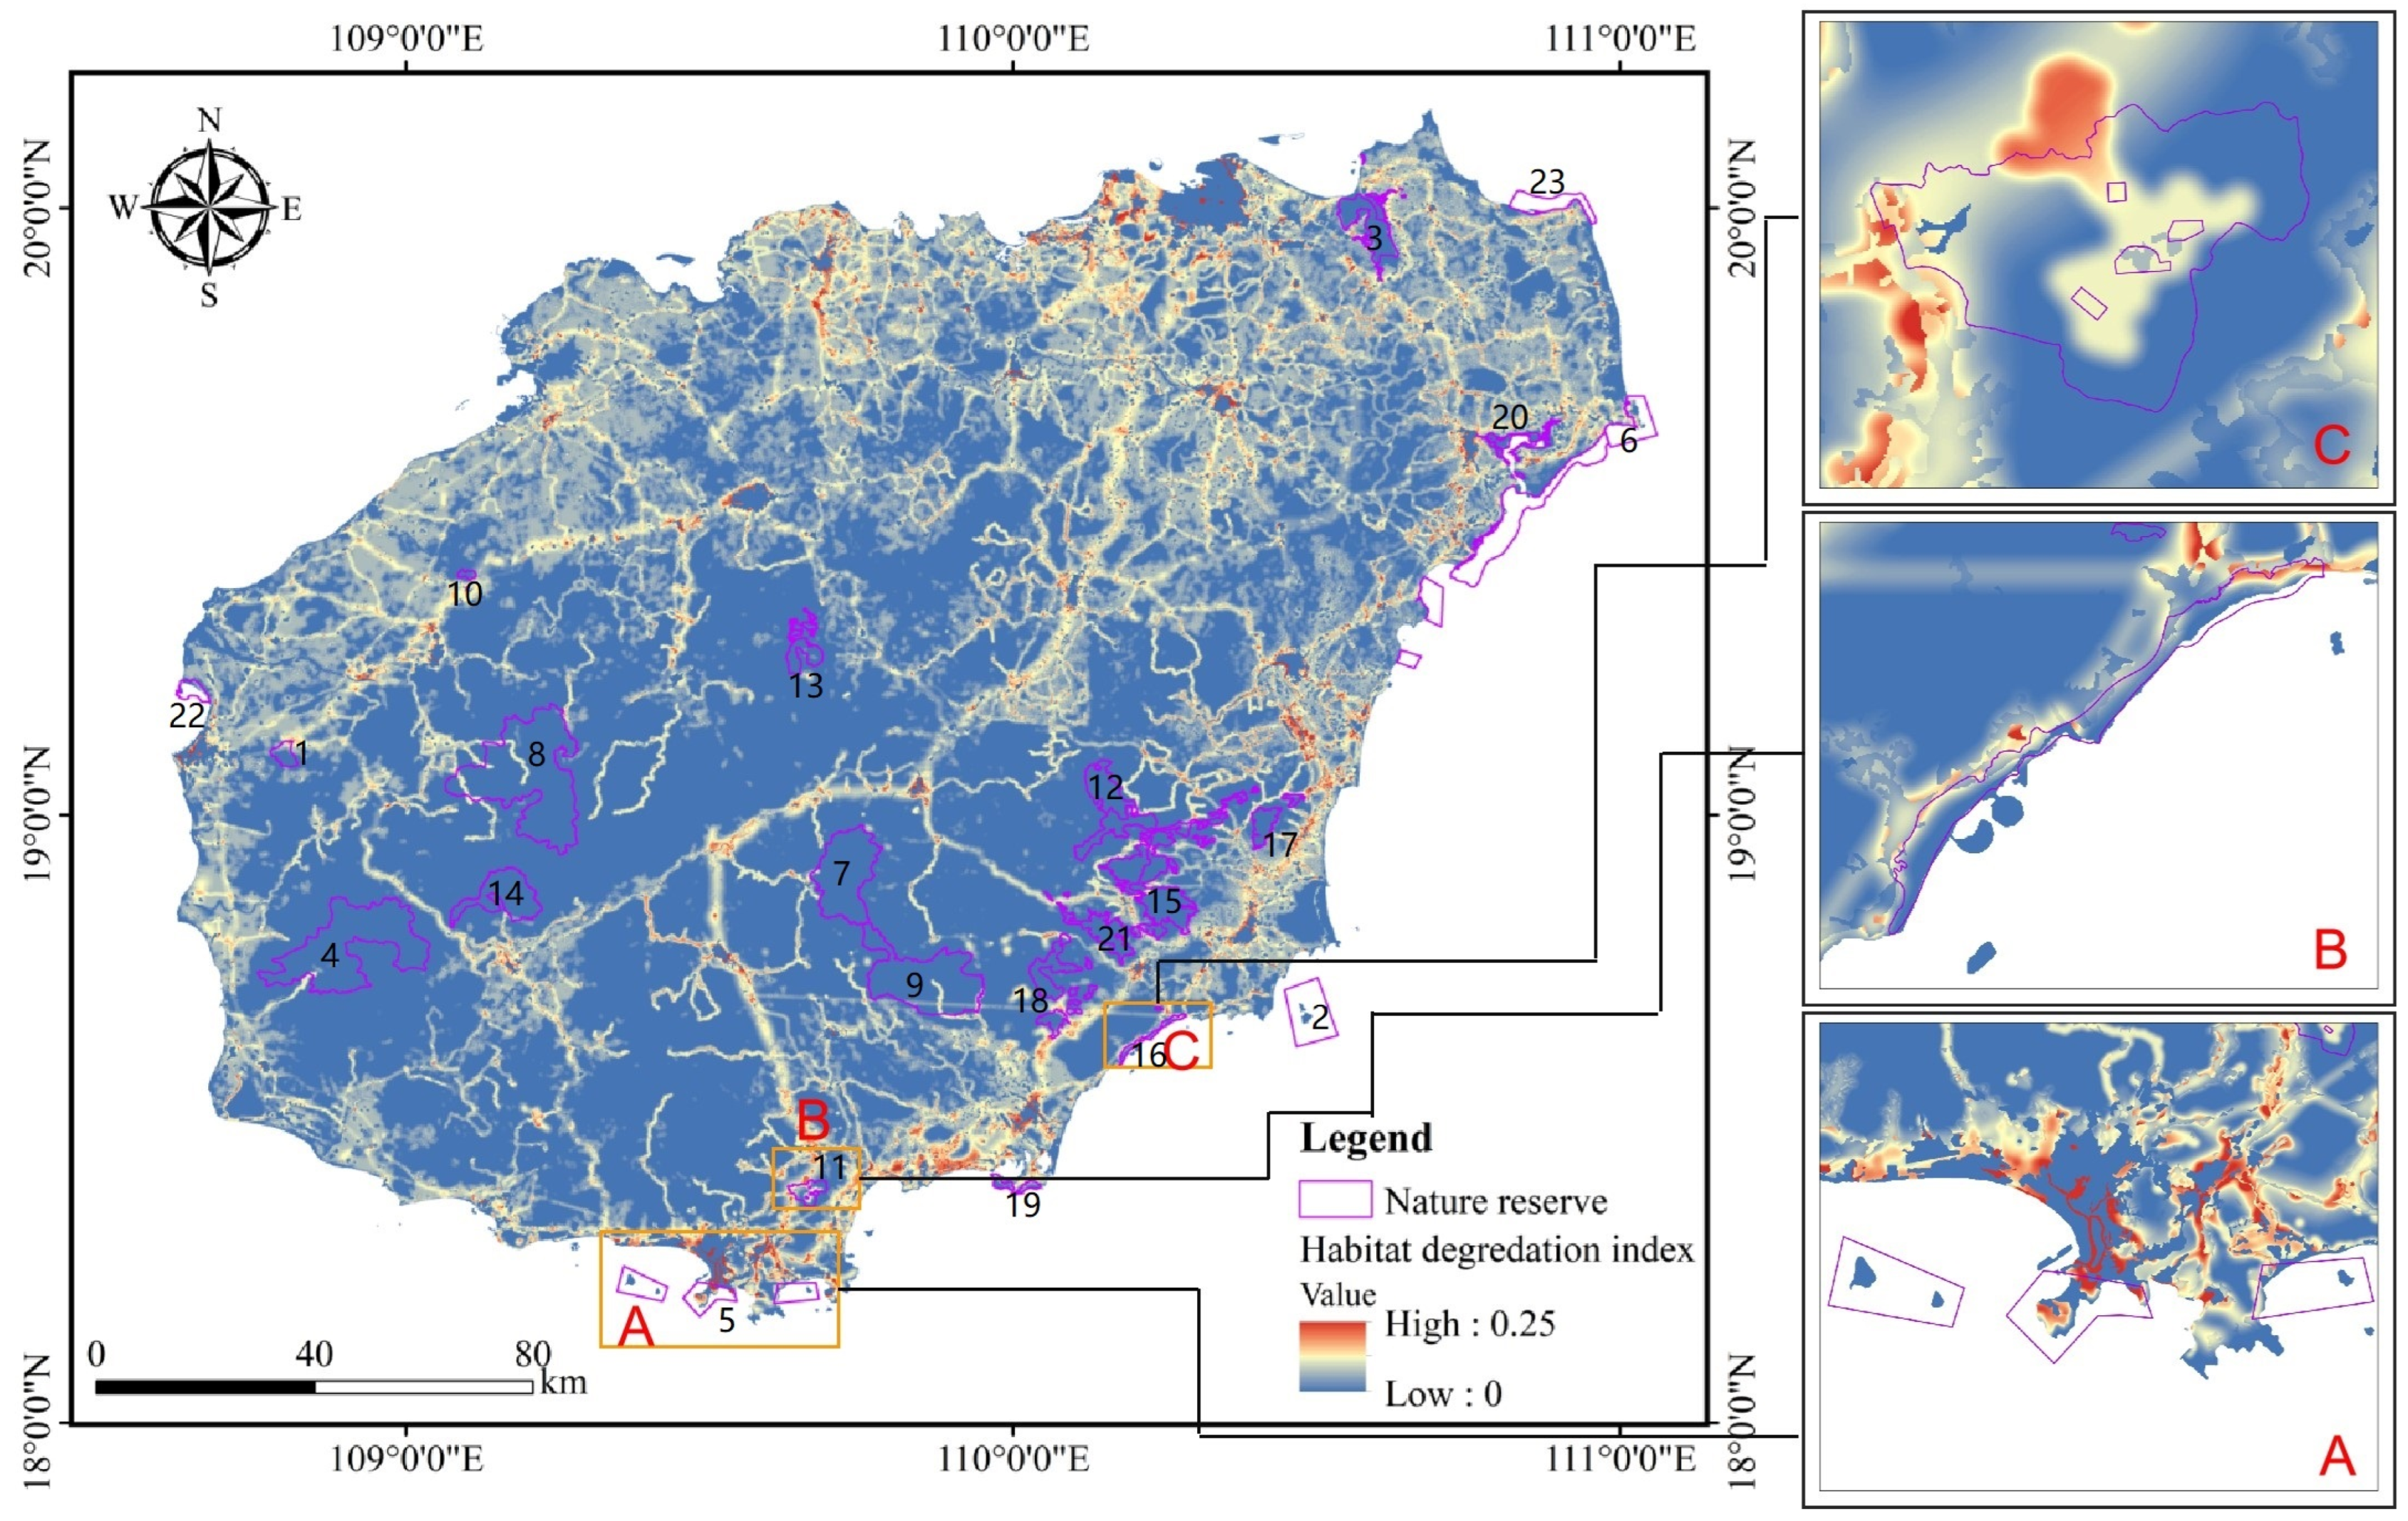
In terms of the overall situation, the degree of habitat degradation in the 23 nature reserves was reduced, with the majority of the habitat degradation index of the nature reserves continuing to decrease or remaining unchanged. In particular, the degradation indices of Wuzhishan and Jianfengling, which are located in the central mountainous region of Hainan Island, are less than 0.01; however, the degradation of nature reserves around the coastal zone, such as Tongguling and Qingpilin, is relatively significant, with degradation indices greater than 0.02. The year 2000 was the most significant year of degradation, when the establishment of nature reserves did not receive much attention, coupled with the influence of traditional living habits. By 2010, the degradation of habitats in nature reserves such as Ganshiling and Qingpilin had been reduced.Since 2020 and 2021, the overall degradation of the nature reserves has been significantly reduced, and the ecological vegetation has been restored. As can be seen in Figure 6, habitat degradation in nature reserves is significantly influenced by transport facilities, followed by arable land and construction land, which are also important causes of habitat degradation.
The habitat degradation indices in different years are shown in Figure 6 and Figure 7. From 2000 to 2021, there were nine nature reserves with a decreased habitat degradation index, namely Datian, Dongzhaigang, Sanyashanhujiao, Tongguling, Huishan, Qingpilin, Nanwan, Qinglan Gang, and Qilinlai, accounting for 40% of the study area. Eleven conservation areas, namely Dazhoudao, Jianfengling, Wuzhishan, Bawangling, Diaoluoshan, Ganshiling, Fanjia, Jianling, Liulanling, Nanlin and Shangxi, maintained the same habitat degradation index, accounting for 50% of the study area. The habitat degradation index increased in Bangxi and Dongfangheilianpilu from 0.0054 to 0.0055 and from 0.0105 to 0.0119, respectively. The increase rate of the black-faced spoonbill in the eastern region was higher, especially from 2000 to 2010, from 0.0105 to 0.0118, showing an increase of 12%. The reserve is a provincial nature reserve with the black-faced spoonbill as its main protection object. Being established in 2006, in these years, the reserve was in the early stages of its development. Due to the lack of relevant policies and facilities, as well as the weak ideology of the local people, the degradation of the habitat intensified during this period.

3.2. Human Activity Disturbance

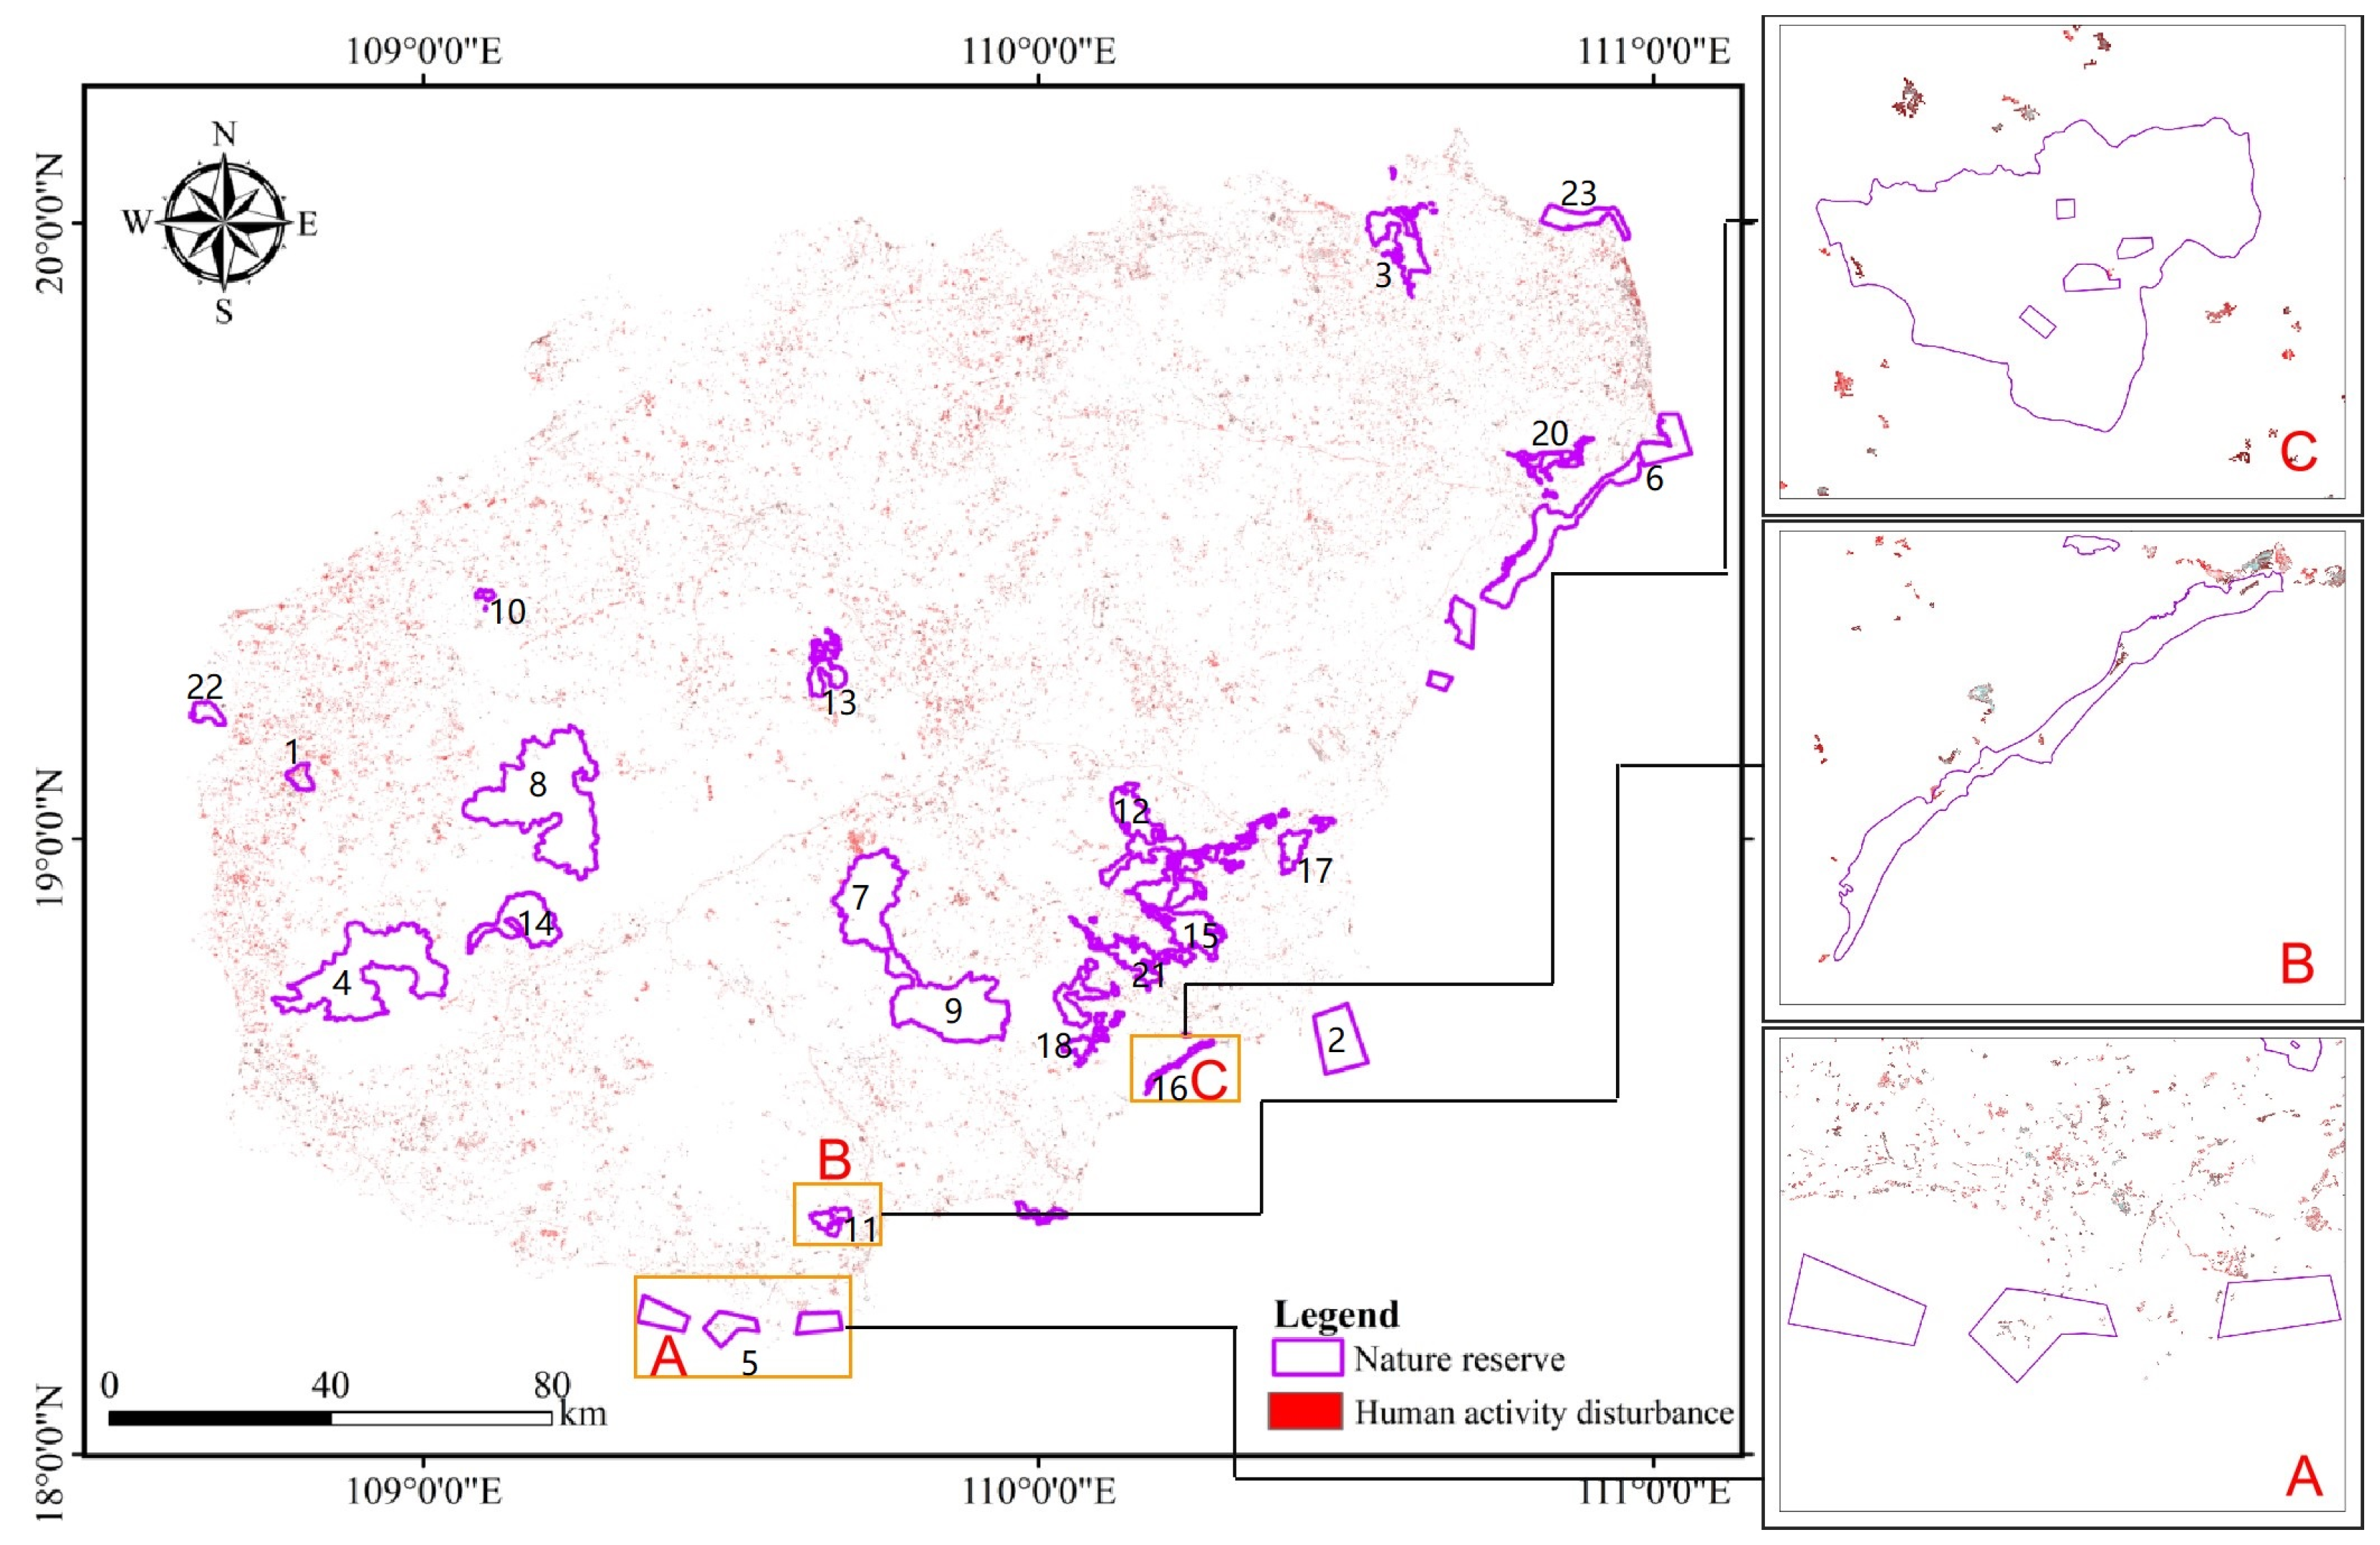
As a special area, the nature reserve is less disturbed by human activities compared with its surrounding areas; however, some of the reserves closer to areas of human activity are still influenced by them. The darker the color, the higher the disturbance level of the area. The results of this study are shown in Figure 8.
According to the results of the model, the disturbance results of human activities in 23 nature reserves were divided into five levels, I, II, III, IV and V, among which I indicated the lightest disturbance, and V indicated the most intense disturbance. The specific research results are shown in Table 2.
In 2000, among the 23 nature reserves on Hainan Island, there was 1 nature reserve with a grade V, 4 with a grade IV, 3 with a grade III, 3 with a grade II and 12 with a grade I. The Qingpilin nature reserve was the study area with the most human disturbance. In 2021, there was 1 nature reserve with a grade V, 5 with a grade IV, 2 with a grade III, 2 with a grade II and 13 with a grade I. Over the past 21 years, the disturbance caused by human activities decreased in Dongzhaigang and Qingpilin, while the disturbance increased in Tongguling, Ganshiling and Nanwan, which merits attention.

3.3. Comprehensive Evaluation of the Effectiveness of Nature Reserve Protection

This study shows that the overall conservation effectiveness of nature reserves on Hainan Island is good; the specific results are shown in Table 3. In 2000, there were six excellent conservation areas, accounting for 26% of the total study area; eight good conservation areas, accounting for 35%; five moderate conservation areas, accounting for 22%; and four qualified conservation areas, accounting for 17% of the total study area. By 2021, nine nature reserves were rated excellent, accounting for 39% of the total study area; six nature reserves were rated good, accounting for 26% of the total study area; one nature reserve was rated moderate, accounting for 4% of the total study area; and seven nature reserves were rated qualified, accounting for 30% of the total study area. In the past 21 years, the number of excellent-grade nature reserves increased by three, and the number of qualified-grade nature reserves also increased by three (namely Datian, Sanyashanhujiao and Qingpilin).
According to the results of the rate of change, the nature reserves can be classified into three trends of continuous negative change, continuous positive change and negative followed by positive change, all of which are analyzed in conjunction with the results of habitat quality and vegetation disturbance in Section 3. Continuous negative change refers to nature reserves that have been deteriorating in conservation effectiveness for two decades, mainly including Sanyashanhujiao, Qingpilin, Dongfangheilianpilu and Qilinlai. This type of nature reserve has a low level of conservation effectiveness and a trend of deteriorating conservation effectiveness, so special attention should be paid to this type of nature reserve, and a scientific and reasonable management system should be formulated to eliminate the influence of human activities in order to promote the benign development of these nature reserves. Continuous positive change refers to nature reserves whose conservation effectiveness has continued to improve over two decades, mainly including Jianfengling, Bawangling, Diaoluoshan, Ganshiling, Liulianling and Qinglangang. This type of nature reserve, with a trend of better conservation effectiveness, indicates that the local management policies are relatively reasonable and should continue to maintain their management measures concerning future development and protection, and should improve their management policies on this basis. First negative and then positive change refers to nature reserves whose conservation effectiveness has showed a trend of first negative and then positive change over the two decades, mainly including DaZhoudao, Tongguling, Huishan, Fanjia, Jiaxi, Jianling, Nanlin and Shangxi. The conservation effectiveness of these nature reserves ranges from poor to good, which proves that the improvement of management policies in local management departments has a positive effect on the conservation role of nature reserves, and that management measures for nature reserves should continue to be improved on the basis of maintaining the existing management policies.
In order to explore the conservation effectiveness of the current study area, this paper extracts assessment results from 2021 and analyzes the current conservation effectiveness of each nature reserve. The results can provide the most time-efficient scientific data for the management of the nature reserves.
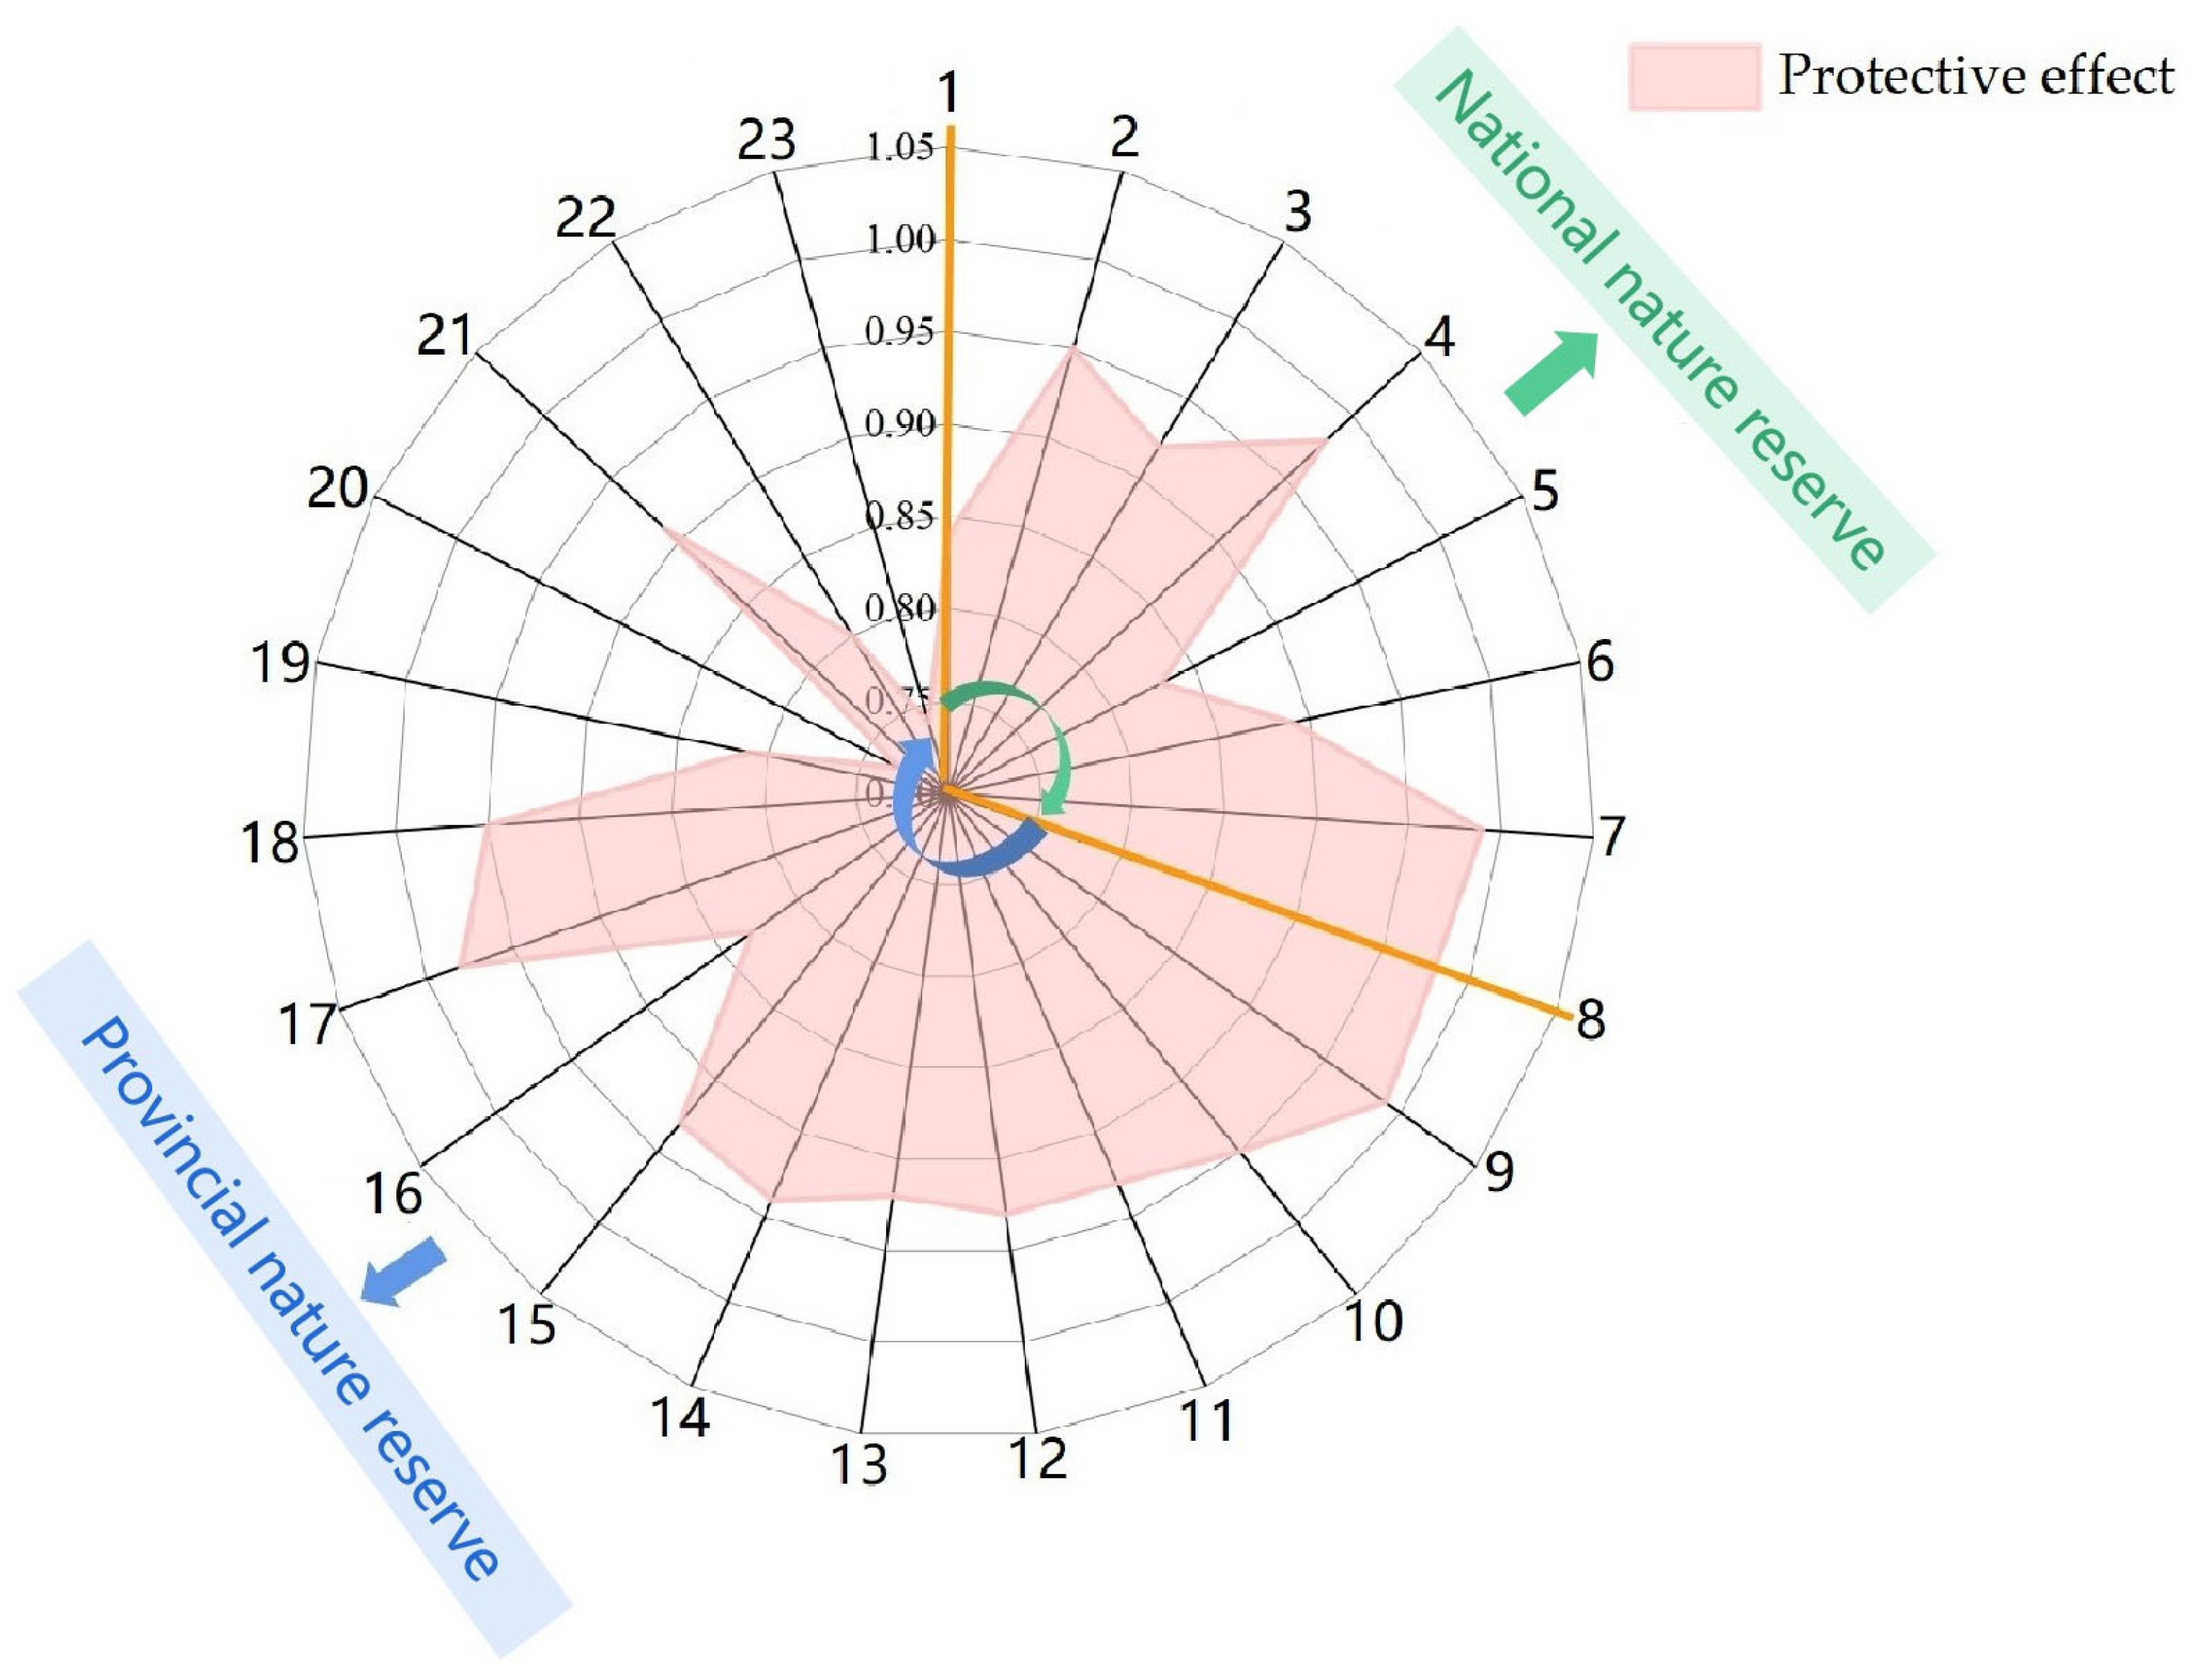
As shown in Figure 9, the overall conservation effectiveness of national nature reserves is good. Jianfengling, Wuzhishan and Bawangling are the three national nature reserves with the best conservation effect. Although the conservation effect of other national nature reserves is slightly lower than that of other national nature reserves at the same level, it is slightly better than provincial nature reserves. The overall conservation effect of provincial nature reserves is slightly lower than that of national nature reserves, among which Qinglan nature reserve, the black-faced spoonbill nature reserve, and Qilinlai nature reserve are the three worst. In these areas, more efforts should be made to maximize the positive role of nature reserves.

4. Discussion

The conservation effectiveness of nature reserves is a measure used to represent the comprehensive effectiveness that they have in protecting their main objects, maintaining biodiversity, and safeguarding ecosystem services. It is a nature-based solution proposed against the background of global climate change. Current studies have carried out effectiveness evaluations of various nature reserves using a single index or model, ignoring the integrated influences of nature or human activities. In this study, we developed a comprehensive model to evaluate the conservation effectiveness of 23 Hainan nature reserves. The overall conservation effectiveness of Hainan nature reserves shows a positive trend. Moreover, the habitat quality improved and the habitat degradation was reduced. Human activity interference in the 23 nature reserves was alleviated with improvements in management measures. These findings are almost consistent with previous studies on nature reserve evaluation in Hainan [51,52].
As the only tropical island in China, Hainan has superior climatic conditions, and its biological species and endemic groups rank among the highest in China [53]. The overall conservation effectiveness of nature reserves is high. Remote sensing monitoring shows that human disturbance was high in 2000, and gradually decreased after 2010. The survey found that most nature reserves on Hainan Island were established in the 1990s and the early 21st century [54,55]. During the early stages of the nature reserves development, management policies were not perfect, and living habits around the nature reserves led to serious disturbances from human activities, high habitat degradation, and poor habitat quality. Disturbance intensities and approximate times can be found using LandTrendr, which could provide data-led support for management departments.
By evaluating the changes in conservation effectiveness within different levels of nature reserves, it was found that the conservation effectiveness of national nature reserves is obviously higher than that of provincial nature reserves. Compared with the superior management systems of national nature reserves, the management mechanisms of some provincial nature reserves show a general lack of integrity, a lack of clarity regarding the powers and responsibilities of management bodies, a separation of the upper and lower management and power structures, and insufficient methods of attracting professional talent. It is therefore difficult for them to introduce outstanding high-tech technical personnel.
It is necessary to continuously observe the conservation effectiveness of nature reserves in the future. It has been suggested that nature reserves should be divided according to different functional areas, that is, the core area, buffer area, and experimental area should be protected and monitored according to different principles. Remote sensing imagery with high spatial and temporal resolution can be used to discover the problems affecting nature reserves in a more timely and clear manner, and to provide management departments with time-efficient scientific data.

5. Conclusions

Habitat quality changes were simulated based on the InVEST model, and human disturbance results were obtained based on the LandTrendr model. Coupled with habitat quality and human disturbance results, changes in conservation effectiveness within 23 nature reserves on Hainan Island were analyzed. Based on the findings of this study, in the past 21 years, the degree of habitat degradation in Hainan Island nature reserves has decreased, and the quality of habitats has improved. However, the habitat degradation in Dongfangheilianpilu nature reserve was significant, and the quality of the habitat was low, which requires attention. The overall habitat quality of the nature reserves located in the inner mountainous areas of Hainan Island was higher than that of the coastal nature reserves, and these areas were also less disturbed by human activities. The overall conservation effect of the nature reserves is good, but Qinglangang, Oriental Black-faced Spoonbill, and Qilinlai are the three poorest nature reserves and require more attention.

Author Contributions

Conceptualization, X.Z. and M.Y.; methodology, X.Z. and B.C.; validation, X.Z. and M.Y.; formal analysis, X.Z.; resources, L.Z.; data curation, X.Z.; writing—original draft preparation, B.C.; writing—review and editing, X.Z. and B.C.; visualization, B.C.; supervision, L.Z.; project administration, X.Z.; funding acquisition, L.Z. All authors have read and agreed to the published version of the manuscript.

Funding

This research was financially supported by the Provincial Natural Science Foundation of China (421QN279).

Acknowledgments

The author would like to thank Institute of Geographic Sciences and Nature Resources Research for providing the land use classification data. We would like to thankthe Department of Ecology and Environment of Hainan Province.

Conflicts of Interest

The authors declare no conflict of interest.

References

  1. Nelson, A.; Chomitz, K.M. Effectiveness of Strict vs Multiple Use Nature reserve in Reducing Tropical Forest Fires: A Global Analysis Using Matching Methods. PLoS ONE 2011, 6, e22722. [Google Scholar] [CrossRef]
  2. Hockings, M. Evaluting Nature Reserve Management—A Review of System for Assessing Management Effectiveness of Nature Reserve; University of Queensland: Lawes, Australia, 2000. [Google Scholar]
  3. Geldmann, J.; Barnes, M.; Coad, L.; Craigie, I.D.; Hockings, M.; Neil, D. Burgess. Effectiveness of terrestrial nature reserve in reducing habitat loss and population declines. Biol. Conserv. 2013, 161, 230–238. [Google Scholar] [CrossRef]
  4. Chen, Y.; Zhang, J.; Jiang, J.; Nielsen, S.E.; He, F. Assessing the effectiveness of China’s nature reserve to conserve current and future amphibian diversity. Divers. Distrib. 2017, 23, 146–157. [Google Scholar] [CrossRef] [Green Version]
  5. Armsworth, P.R.; Jackson, H.B.; Cho, S.-H.; Clark, M.; Fargione, J.E.; Iacona, G.D.; Kim, T.; Larson, E.R.; Minney e, T.; Sutton, N.A. Is conservation right to go big Nature reserve size and conservation return-on-investment. Biol. Conserv. 2018, 225, 229–236. [Google Scholar] [CrossRef]
  6. Watson, J.E.M.; Dudley, N.; Segan, D.B.; Hockings, M. The performance and potential of nature reserve. Nature 2014, 515, 67. [Google Scholar] [CrossRef] [PubMed]
  7. Bertzky, B.; Corrigan, C.; Kemsey, J. Protected Planet Report 2010: Tracking Progress towards Global Targets for Nature Reserve; IUCN: Gland, Switzerland; UNEP-WCMC: Cambridge, UK, 2012. [Google Scholar]
  8. Zupan, M.; Bulleri, F.; Evans, J.; Fraschetti, S.; Guidetti, P.; Garcia-Rubies, A.; Sostres, M.; Asnaghi, V.; Caro, A.; Deudero, S.; et al. How good is your marine nature reserve at curbing threats. Biol. Conserv. 2018, 221, 237–245. [Google Scholar] [CrossRef] [Green Version]
  9. Rodriguez-Galiano, V.F.; Ghimire, B.; Rogan, J.; Chica-Olmo, M.; Rigol-Sanchez, J.P. An assessment of the effectiveness of a random forest classifier for land-cover classification. Isprs J. Photogramm. Remote Sens. 2012, 67, 93–104. [Google Scholar] [CrossRef]
  10. Laurance, W.F.; Camargo, J.L.C.; Luizão, R.C.C.; Laurance, S.G.; Pimm, S.L.; Bruna, E.M.; Stouffer, P.C.; Williamson, G.B.; Benítez-Malvido, J.; Vasconcelos, H.L. The fate of Amazonian forest fragments: A 32-year investigation. Biol. Conserv. 2011, 144, 56–67. [Google Scholar] [CrossRef]
  11. Geldmann, J.; Manica, A.; Burgess, N.D.; Balmford, A. A global analysis of nature reserve management effectiveness. Environ. Manag. 2010, 46, 685–698. [Google Scholar]
  12. Gray, C.L.; Hill, S.L.L.; Newbold, T.; Hudson, L.N.; Börger, L.; Contu, S.; Hoskins, A.J.; Ferrier, S.; Purvis, A.; Scharlemann, J.P.W. Local biodiversity is higher inside than outside terrestrial nature reserve worldwide. Nat. Commun. 2016, 7, 12306. [Google Scholar] [CrossRef] [Green Version]
  13. Fuller, R.A.; McDonald-Madden, E.; Wilson, K.A.; Carwardine, J.; Grantham, H.S.; Watson, J.E.M.; Klein, C.J.; Green, D.C.; Possingham, H.P. Replacing underperforming nature reserve achieves better conservation outcomes. Nature 2010, 466, 365. [Google Scholar] [CrossRef] [PubMed]
  14. Nagendra, H.; Lucas, R.; Honrado, J.P.; Jongman, R.H.; Tarantino, C.; Adamo, M.; Mairota, P. Remote sensing for conservation monitoring: Assessing nature reserve, habitat extent, habitat condition, species diversity, and threats. Ecol. Indic. 2013, 33, 45–59. [Google Scholar] [CrossRef]
  15. Blom, A.; Yamindou, J.; Prins, H.H.T. Status of the nature reserve of the Central African Republic. Biol. Conserv. 2004, 118, 479–487. [Google Scholar] [CrossRef]
  16. Ellis, E.C.; Ramankutty, N. Putting people in the map: Anthropogenic biomes of the world. Front. Ecol. Environ. 2008, 6, 439–447. [Google Scholar] [CrossRef] [Green Version]
  17. Erle, C.; Kees, E.; Goldewijk, K.; Siebert, S.; Lightman, D.; Ramankutty, N. Anthropogenic transformation of the biomes, 1700 to 2000. Glob. Ecol. Biogeogr. 2010, 19, 589–606. [Google Scholar]
  18. Smith, E.R. An Overview of EPA’s Regional Vulnerability Assessment (ReVA) Program. Environ. Monit. Assess. 2000, 64, 9–15. [Google Scholar] [CrossRef]
  19. Nelson, E.; Mendoza, G.; Regetz, J.; Polasky, S.; Tallis, H.; Cameron, D.; Chan, K.M.; Daily, G.C.; Goldstein, J.; Kareiva, P.M.; et al. Modeling Multiple Ecosystem Services, Biodiversity Conservation, Commodity Production, and Tradeoffs at Landscape Scales. Front. Ecol. Environ. 2009, 7, 4–11. [Google Scholar] [CrossRef]
  20. Chen, L.-C.; Papandreou, G.; Kokkinos, I.; Murphy, K.; Yuille, A.L. Deeplab: Semantic Image Segmentation with Deep Convolutional Nets, Atrous Convolution, and Fully Connected Crfs. IEEE Trans. Pattern Anal. Mach. Intell. 2017, 40, 834–848. [Google Scholar] [CrossRef] [Green Version]
  21. Zhang, Z.; Xia, F.; Yang, D.; Huo, J.; Wang, G.; Chen, H. Spatiotemporal characteristics in ecosystem service value and its interaction with human activities in Xinjiang, China. Ecol. Indic. 2020, 110, 105826. [Google Scholar] [CrossRef]
  22. Balme, G.A.; Slotow, R.; Hunter, L.T.B. Edge effects and the impact of nonprotected areas in carnivore conservation: Leopards in the Phinda-MkhuzeComplex, South Africa. Anim. Conserv. 2010 13, 315–323.
  23. Bertzky, B.; Corrigan, C.; Kemsey, J.; Kenney, S.; Ravilious, C.; Besancon, C.; Burgess, N.D. Protected Planet Report: Tracking Progress towards Global Targets for Protected Areas; IUCN and UNEP-WCMC: Gland, Switzerland; Cambridge, UK, 2012. [Google Scholar]
  24. Hilborn, R.; Arcese, P.; Borner, M.; Hando, J.; Hopcraft, G.; Loibooki, M.; Mduma, S.; Sinclair, A.R.E. Effective enforcement in a conservation area. Science 2006, 314, 1266. [Google Scholar] [CrossRef]
  25. Chape, S.; Harrison, J.; Spalding, M.; Lysenko, I. Measuring the extent and eddectiveness of nature reserve as an indicator for meeting global biodiversity targets. Philos. Trans. R. Soc. Lond. 2005, 360, 443–455. [Google Scholar] [CrossRef] [PubMed] [Green Version]
  26. Hockings, M.; Stolton, S.; Leverington, F.; Dudley, N.; Courrau, J. Evaluating Effectiveness: A Framework for Assessing Management Effectiveness of Protected Areas, 2nd ed.; IUCN: Gland, Switzerland; Cambridge, UK, 2006; p. xiv + 105. [Google Scholar]
  27. Soutullo, A. Extent of the global network of terrestrial nature reserve. Conserv. Biol. 2010, 24, 362–363. [Google Scholar]
  28. Berger, A.R.; Hodge, R.A. Natural Change in the Environment: A Challenge to the Pressure-State-Response Concept. Soc. Indic. Res. 1998, 44, 255–265. [Google Scholar] [CrossRef]
  29. Sánchez-Canales, M.; Benito, A.L.; Passuello, A.; Terrado, M.; Ziv, G.; Acuña, V.; Schuhmacher, M.; Elorza, F.J. Sensitivity analysis of ecosystem service valuation in a Mediterranean watershed. Sci. Total Environ. 2012, 440, 140–153. [Google Scholar] [CrossRef] [PubMed]
  30. Leh, M.D.K.; Matlock, M.D.; Cummings, E.C.; Nalley, L.L. Quantifying and mapping multiple ecosystem services change in West Africa. Agric. Ecosyst. Environ. 2013, 165, 6–18. [Google Scholar] [CrossRef]
  31. Jin, S.; Sader, S.A. MODIS time-series imagery for forest disturbance detection and quantification of patch size effects. Remote Sens. Environ. 2005, 99, 462–470. [Google Scholar] [CrossRef]
  32. Pouliot, D.; Latifovic, R.; Fernandes, R.; Olthof, I. Evaluation of annual forest disturbance monitoring using a static decision tree approach and 250 m MODIS data. Remote Sens. Environ. 2009, 113, 1749–1759. [Google Scholar] [CrossRef]
  33. DeVries, B.; Verbesselt, J.; Kooistra, L.; Herold, M. Robust monitoring of small-scale forest disturbances in a tropical montane forest using Landsat time series. Remote Sens. Environ. 2015, 161, 107–121. [Google Scholar] [CrossRef]
  34. Huang, C.; Goward, S.N.; Masek, J.G.; Thomas, N.; Zhu, Z.; Vogelmann, J.E. An automated approach for reconstructing recent forest disturbance history using dense Landsat time series stacks. Remote Sens. Environ. 2010, 114, 183–198. [Google Scholar] [CrossRef]
  35. Huang, C.; Goward, S.N.; Schleeweis, K.; Thomas, N.; Masek, J.G.; Zhu, Z. Dynamics of national forests assessed using the Landsat record: Case studies in eastern United States. Remote Sens. Environ. 2009, 113, 1430–1442. [Google Scholar] [CrossRef]
  36. Blake, S.; Deem, S.L.; Strindberg, S.; Maisels, F.; Momont, L.; Isia, I.-B.; Douglas-Hamilton, I.; Karesh, W.B.; Kock, M.D. Roadless wilderness area determines forest Elephant movements in the Congo Basin. PLoS ONE 2008, 3, e3546. [Google Scholar] [CrossRef] [PubMed]
  37. Verbesselt, J.; Zeileis, A.; Herold, M. Near real-time disturbance detection using satellite image time series. Remote Sens. Environ. 2012, 123, 98–108. [Google Scholar] [CrossRef]
  38. Kennedy, R.E.; Yang, Z.; Gorelick, N.; Braaten, J.; Cavalcante, L.; Cohen, W.B.; Healey, S. Implementation of the LandTrendr Algorithm on Google Earth Engine. Remote Sens. 2018, 10, 691. [Google Scholar] [CrossRef] [Green Version]
  39. Andam, K.S.; Ferraro, P.J.; Hanauer, M.M. The effects of nature reserve systems on ecosystem restoration: A quasi-experimental design to estimate the impact of Costa Rica’s nature reserve system on forest regrowth. Conserv. Lett. 2013, 6, 317–323. [Google Scholar]
  40. Kennedy, R.E.; Yang, Z.; Cohen, W.B. Detecting trends in forest disturbance and recovery using yearly Landsat time series: 1. LandTrendr—Temporal segmentation algorithms. Remote Sens. Environ. 2010, 114, 2911–2924. [Google Scholar] [CrossRef]
  41. Kennedy, R.E.; Cohen, W.B.; Schroeder, T.A. Trajectory-based change detection for automated characterization of forest disturbance dynamics. Remote Sens. Environ. 2007, 110, 370–386. [Google Scholar] [CrossRef]
  42. Running, S.W.; Nemani, R.R.; Heinsch, F.A.; Zhao, M.; Reeves, M.; Hashimoto, H. A continuous satellite-derived measure of global terrestrial primary production. BioScience 2004, 54, 547−560. [Google Scholar] [CrossRef] [Green Version]
  43. Masek, J.G.; Huang, C.; Wolfe, R.; Cohen, W.B.; Kutler, J.; Hall, F.G.; Nelson, P. North American forest disturbance mapped from a decadal Landsat record: Methodology and initial results. Remote Sens. Environ. 2008, 112, 2914–2926. [Google Scholar] [CrossRef]
  44. Cohen, W.B.; Yang, Z.; Healey, S.P.; Kennedy, R.E.; Gorelick, N. A LandTrendr multispectral ensemble for forest disturbance detection. Remote Sens. Environ. 2018, 205, 131–140. [Google Scholar] [CrossRef]
  45. Zhu, Z.; Woodcock, C.E. Object-based cloud and cloud shadow detection in Landsat imagery. Remote Sens. Environ. 2012, 118, 83–94. [Google Scholar] [CrossRef]
  46. Bartz, K.K.; Ford, M.J.; Beechie, T.J.; Fresh, K.L.; Pess, G.R.; Kennedy, R.E.; Rowse, M.L.; Sheer, M. Trends in Developed Land Cover Adjacent to Habitat for Threatened Salmon in Puget Sound, Washington, USA. PLoS ONE 2015, 10, e0124415. [Google Scholar] [CrossRef] [PubMed] [Green Version]
  47. Zhu, Z. Change detection using Landsat time series: A review of frequencies, preprocessing, algorithms, and applications. ISPRS J. Photogramm. Remote Sens. 2017, 130, 370–384. [Google Scholar] [CrossRef]
  48. Griffiths, P.; Kuemmerle, T.; Kennedy, R.E.; Abrudan, I.V.; Knorn, J.; Hostert, P. Using annual time-series of Landsat images to assess the effects of forest restitution in post-socialist Romania. Remote Sens. Environ. 2012, 118, 199–214. [Google Scholar] [CrossRef]
  49. Schneibel, A.; Stellmes, M.; Röder, A.; Frantz, D.; Kowalski, B.; Haß, E.; Hill, J. Assessment of spatio-temporal changes of smallholder cultivation patterns in the Angolan Miombo belt using segmentation of Landsat time series. Remote Sens. Environ. 2017, 195, 118–129. [Google Scholar] [CrossRef] [Green Version]
  50. Healey, S.P.; Cohen, W.B.; Yang, Z.; Brewer, C.K.; Brooks, E.B.; Gorelick, N.; Hernandez, A.J.; Huang, C.; Hughes, M.J.; Kennedy, R.E.; et al. Mapping forest change using stacked generalization: An ensemble approach. Remote Sens. Environ. 2018, 204, 717–728. [Google Scholar] [CrossRef]
  51. Homer, C.; Dewitz, J.; Fry, J.; Coan, M.; Hossain, N.; Larson, C.; Herold, N.; McKerrow, A.; VanDriel, J.N.; Wickham, J. Completion of the 2001 National Land Cover Database for the conterminous United States. Photogramm. Eng. Remote Sens. 2007, 73, 337–341. [Google Scholar]
  52. Macedo, D.R.; Hughes, R.M.; Ferreira, W.R.; Firmiano, K.R.; Silva, D.R.; Ligeiro, R.; Kaufmann, P.R.; Callisto, M. Development of a benthic macroinvertebrate multimetric index (MMI) for Neotropical Savanna headwater streams. Ecol. Indic. 2016, 64, 132–141. [Google Scholar] [CrossRef]
  53. Mazari-Hiriart, M.; PMazari-Hiriart, M.; P´erez-Ortiz, G.; Orta-Ledesma, M.T.; Armas-Vargas, F.; Tapia, M.A. Final opportunity to rehabilitate an urban river as a water source for Mexico City. PLoS ONE 2014, 9, e102081. [Google Scholar] [CrossRef]
  54. Bojorge, G.M.; Carmona, J.; Beltrán, Y.; Cartajena, M. Temporal and spatial distribution of macroalgal communities of mountain streams in Valle de Bravo Basin, central Mexico. Hydrobiologia 2010, 641, 159–169. [Google Scholar] [CrossRef]
  55. Almeida, L.L.; Revollo-Fernandez, D.; Caro-Borrero, A.; Ruiz-Mallen, I.; Corbera, E.; Mazari-Hiriart, M.; Figueroa, F. Not the same for everyone: Community views of Mexico’s payment for environmental services programmes. Environ. Conserv. 2017, 44, 201–211. [Google Scholar] [CrossRef]
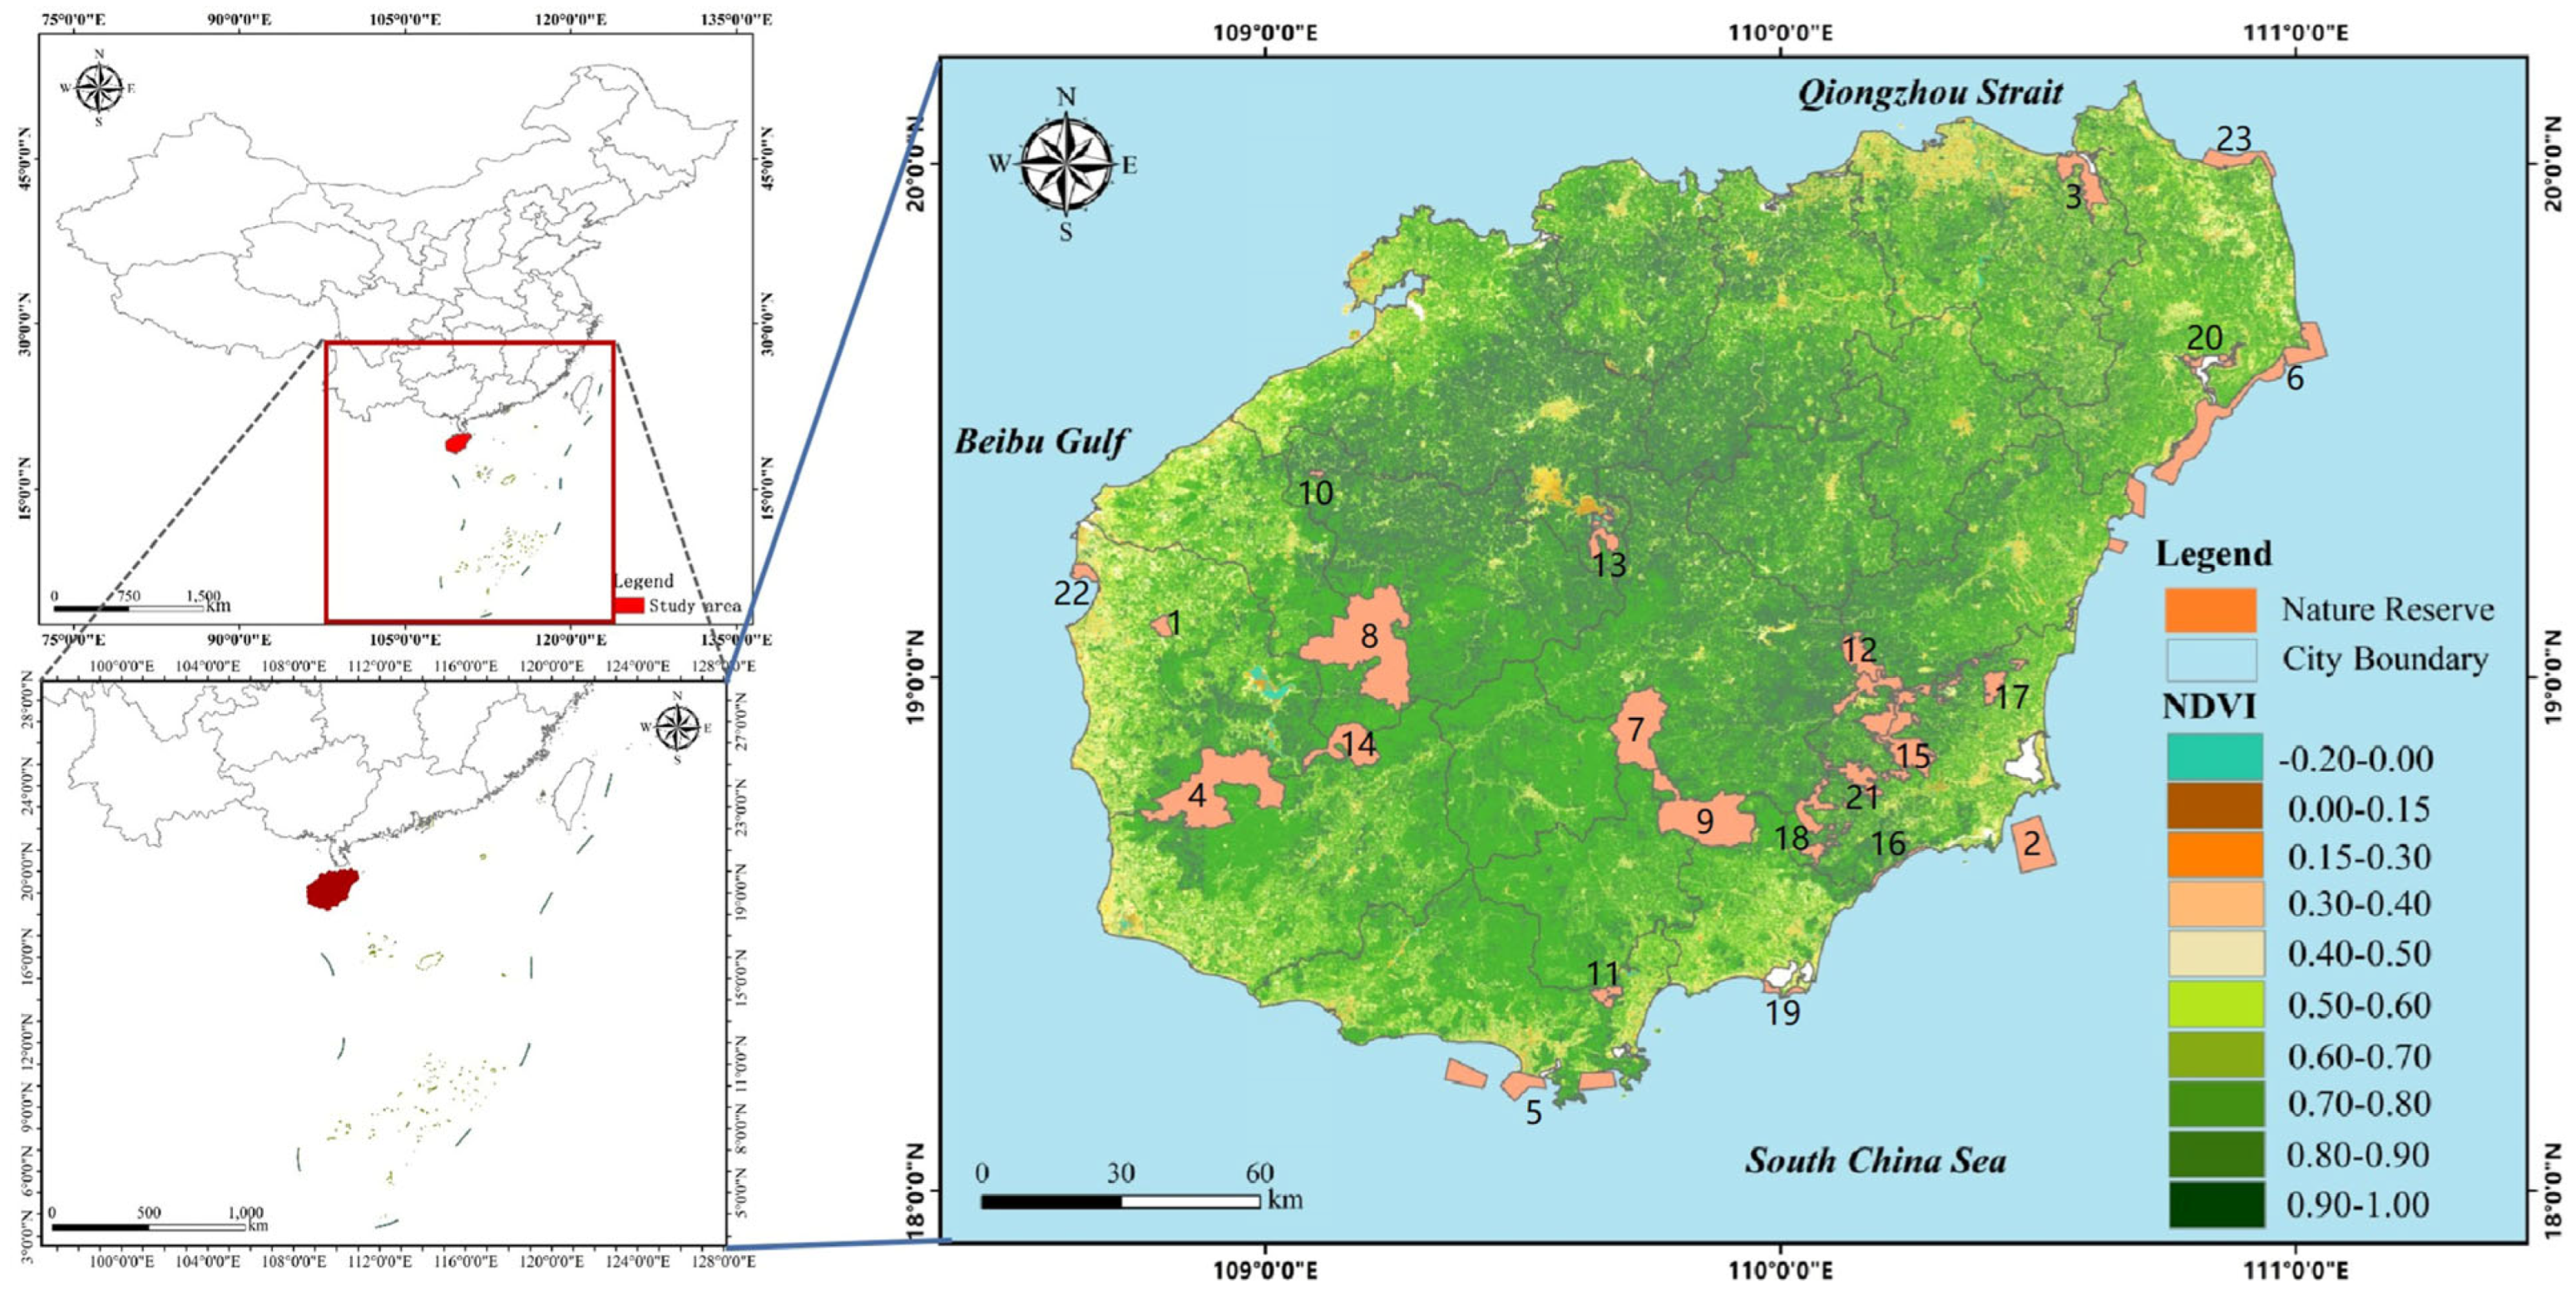
Figure 1. Study area. The figures in Figure 1 correspond to the location of each protected area in Table 1.
Forests 14 01293 g001
Figure 2. Technology roadmap for conservation effectiveness.
Forests 14 01293 g002
Figure 3. Concept of LandTrendr change detection algorithm.
Forests 14 01293 g003
Figure 4. Habitat quality index distribution. Left subfigure in the figure is overall habitat quality in nature reserves across the island. Right subfigure in the figure representative: (A) Dazhoudao; (B) Qingpilin; (C) Ganshenling. The figures in the Figure 4 correspond to Table 1.
Forests 14 01293 g004
Figure 5. Habitat quality trends in the study area.
Forests 14 01293 g005
Figure 6. Habitat degradation index distribution. Left subfigure in the figure is overall habitat degradation in nature reserves across the island. Right subfigure in the figure representative: (A) Dazhoudao; (B) Qingpilin; (C) Ganshenling. The figures in the Figure 5 correspond to Table 1.
Forests 14 01293 g006
Figure 7. Changes in habitat degradation indices in different nature reserves.
Forests 14 01293 g007
Figure 8. Human activity disturbance distribution. Left subfigure in the figure is overall human activity disturbance distribution nature reserves across the island. Right subfigure in the figure representative: (A) Dazhoudao; (B) Qingpilin; (C) Ganshenling. The figures in the Figure 8 correspond to Table 1.
Forests 14 01293 g008
Figure 9. Current status of nature reserve protection.
Forests 14 01293 g009
Table 1. Names and protection types of nature reserves.
No.LevelNameType
1NationalDatianWildlife
2DazhoudaoWildlife
3DongzhaigangForest ecology
4JianfenglingForest ecology
5SanyashanhujiaoOcean coast
6TonggulingOcean coast
7WuzhishanForest ecology
8BawanglingWildlife
9DiaoluoshanForest ecology
10ProvincialBangxiWildlife
11GanshenlingWild plants
12HuishanForest ecology
13FanjiaForest ecology
14JiaxiForest ecology
15JianlingForest ecology
16QingpilinForest ecology
17LiulianlingForest ecology
18NanlinForest ecology
19NanwanWildlife
20QinglangangOcean coast
21ShangxiForest ecology
22DongfangheilianpiluWildlife
23QilinlaiWild plants
Table 2. Scale of disturbance of human activities in nature reserves.
Name2000201020202021
DatianIIIIIIIIIII
DazhoudaoIIII
DongzhaigangIIIII
JianfenglingIIII
SanyashanhujiaoIVIVIVIV
TonggulingIIIIVIIII
WuzhishanIIII
BawanglingIIII
DiaoluoshanIIII
BangxiIVIVIVIV
GanshenlingIIIIIIIIIII
HuishanIIIIIIII
FanjiaIIII
JiaxiIIII
JianlingIIII
QingpilinVIVIVIV
LiulianlingIIII
NanlinIIII
NanwanIIIIIIIII
QinglangangIVIVIVIV
ShangxiIIII
DonfangheilianpiluIVIVIVIV
QilinlaiIVVVV
Table 3. Grades of each nature reserve.
Name2000201020202021
DatianForests 14 01293 i001Forests 14 01293 i001Forests 14 01293 i002Forests 14 01293 i002
DazhoudaoForests 14 01293 i003Forests 14 01293 i003Forests 14 01293 i004Forests 14 01293 i004
DongzhaigangForests 14 01293 i003Forests 14 01293 i003Forests 14 01293 i004Forests 14 01293 i004
JianfenglingForests 14 01293 i004Forests 14 01293 i004Forests 14 01293 i004Forests 14 01293 i004
SanyashanhujiaoForests 14 01293 i001Forests 14 01293 i001Forests 14 01293 i002Forests 14 01293 i002
TonggulingForests 14 01293 i001Forests 14 01293 i001Forests 14 01293 i001Forests 14 01293 i001
WuzhishanForests 14 01293 i004Forests 14 01293 i004Forests 14 01293 i004Forests 14 01293 i004
BawanglingForests 14 01293 i004Forests 14 01293 i004Forests 14 01293 i004Forests 14 01293 i004
DiaoluoshanForests 14 01293 i004Forests 14 01293 i004Forests 14 01293 i004Forests 14 01293 i004
BangxiForests 14 01293 i003Forests 14 01293 i004Forests 14 01293 i004Forests 14 01293 i004
GanshenlingForests 14 01293 i001Forests 14 01293 i003Forests 14 01293 i003Forests 14 01293 i003
HuishanForests 14 01293 i003Forests 14 01293 i003Forests 14 01293 i003Forests 14 01293 i003
FanjiaForests 14 01293 i003Forests 14 01293 i001Forests 14 01293 i003Forests 14 01293 i003
JiaxiForests 14 01293 i003Forests 14 01293 i003Forests 14 01293 i003Forests 14 01293 i003
JianlingForests 14 01293 i003Forests 14 01293 i001Forests 14 01293 i003Forests 14 01293 i003
QingpilinForests 14 01293 i001Forests 14 01293 i001Forests 14 01293 i002Forests 14 01293 i002
LiulianlingForests 14 01293 i004Forests 14 01293 i004Forests 14 01293 i004Forests 14 01293 i004
NanlinForests 14 01293 i004Forests 14 01293 i003Forests 14 01293 i004Forests 14 01293 i004
NanwanForests 14 01293 i002Forests 14 01293 i002Forests 14 01293 i002Forests 14 01293 i002
QinglangangForests 14 01293 i002Forests 14 01293 i002Forests 14 01293 i002Forests 14 01293 i002
ShangxiForests 14 01293 i003Forests 14 01293 i003Forests 14 01293 i003Forests 14 01293 i003
DonfangheilianpiluForests 14 01293 i002Forests 14 01293 i002Forests 14 01293 i002Forests 14 01293 i002
QilinlaiForests 14 01293 i002Forests 14 01293 i002Forests 14 01293 i002Forests 14 01293 i002
Note: Forests 14 01293 i004 excellent, Forests 14 01293 i003 good, Forests 14 01293 i001 moderate, Forests 14 01293 i002 qualified.
Disclaimer/Publisher’s Note: The statements, opinions and data contained in all publications are solely those of the individual author(s) and contributor(s) and not of MDPI and/or the editor(s). MDPI and/or the editor(s) disclaim responsibility for any injury to people or property resulting from any ideas, methods, instructions or products referred to in the content.