Article

Radial Growth–Climate Relationship Varies with Spatial Distribution of Schima superba Stands in Southeast China’s Subtropical Forests

1
Key Laboratory of Vegetation Restoration and Management of Degraded Ecosystems, South China Botanical Garden, Chinese Academy of Sciences, Guangzhou 510650, China
2
Guangdong Provincial Key Laboratory of Applied Botany, South China Botanical Garden, Chinese Academy of Sciences, Guangzhou 510650, China
3
Guangxi Key Laboratory of Forest Ecology and Conservation, College of Forestry, Guangxi University, Nanning 530004, China
4
Key Laboratory of Ecological Restoration of Loess Plateau, Institute of Loess Plateau, Shanxi University, Taiyuan 030006, China
*
Author to whom correspondence should be addressed.
Forests 2023, 14(7), 1291; https://doi.org/10.3390/f14071291
Submission received: 23 May 2023 / Revised: 12 June 2023 / Accepted: 20 June 2023 / Published: 22 June 2023
(This article belongs to the Special Issue Effects of Climate Change on Tree-Ring Growth)

Abstract

:
To understand the impact of climate change on the tree radial growth in Southeast China’s subtropical evergreen broadleaved forest, comparative research on the radial growth–climate associations of Schima superba was conducted. This dominant evergreen broadleaved tree species was examined at both its southern and northern distribution margins through dendroclimatology. The results showed that the radial growth of S. superba stands at a high elevation in the southern margin and stands in the northern margin were positively correlated with springtime temperatures, mostly in April (e.g., mean temperature: r = 0.630, p < 0.05) and May (e.g., maximum temperature: r = 0.335, p < 0.05), respectively. Meanwhile, the temperature in the late rainy season had a significant negative effect on the radial growth of S. superba stands in the southern margin, including high-elevation stands (e.g., the mean temperature in previous and current September: r = −0.437 and −0.383, p < 0.05) and low-elevation stands (e.g., the mean temperature in previous August and October: r = −0.577 and −0.348, p < 0.05). It was shown that temperature was the key climatic factor affecting the radial growth of S. superba, and the response of radial growth to temperature had obvious spatial differences. The findings indicate that the radial growth of S. superba stands in warm growth environments will be negatively impacted by future climate warming. On the contrary, the radial growth of S. superba stands growing in relatively cold growth environments may benefit from warmer spring. The results enhance the understanding of tree growth responses to climate change in the subtropical forests of China.

1. Introduction

Compared to the leaves and fine roots with rapid turnover, the tree radial growth in the trunk is a relatively more stable component of the forest carbon pool. Therefore, studying the response of the tree radial growth to climate is often used to assess the dynamics of forest tree growth and forest carbon sink under climate change [1,2,3,4]. Subtropical forests in Southeast China are among the regions with the highest net ecosystem productivity (341 ± 67 g C m−2 year−1) in the world [5]. However, previous studies have found that climate warming may limit the radial growth of trees [6,7] and even cause the mortality of large trees in these forests [8,9]. Consequently, it may result in the depletion of these stable carbon pool components within the forest ecosystem. Therefore, to accurately predict the impact of climate change on the dynamics of forest growth and carbon sink in subtropical China, we need to fully understand the response of radial growth of trees in Southeast China’s subtropical forests to climate change.
Extensive research has been conducted on the relationship between tree growth and climate in China’s subtropical forests. For example, Shi et al. [10] found that the radial growth of the evergreen conifer species Pinus taiwanensis in the Tianmu Mountains, located in the northern subtropical region, exhibited a negative correlation with winter temperatures. He et al. [11] found that the radial growth of Cercidiphyllum japonicum, an endemic evergreen broad-leaved tree species in Shennongjia located in the northern subtropical region, was positively correlated with the temperatures in spring, summer, and growing season. Zheng et al. [12] found that the radial growth of Abies fargesii, an evergreen conifer species in Shennongjia located in the northern subtropical region, was positively correlated with the spring temperatures. Wang and Gao [13] discovered that the radial growth of Cinnamomum camphora, an evergreen broad-leaved tree species, was positively correlated with the spring temperatures and summer precipitation in Dagangshan, located in the central subtropical region. Chen et al. [14] found that the radial growth of the evergreen conifer species Tsuga longibracteata in the Tianbaoyan National Nature Reserves was positively correlated with autumn temperatures. In addition, the radial growth of Pinus massoniana was found to be positively correlated with spring and/or winter temperatures at a high elevation in the southern subtropical region [15,16,17,18], and the radial growth of different conifer tree species in the southern subtropical region was found to be negatively correlated with the high temperatures in the late rainy season [19,20,21,22]. These results indicate that the radial growth of subtropical trees in our study area is sensitive to temperature, with distinct interspecific and spatial differences (i.e., the positive effect of the temperature on radial growth of trees in the northern and high-elevation stands, but the negative effect of the temperature in the southern and low-elevation stands) [23,24].
Changing climate (e.g., rising temperature, increasing drought frequency) was reported to impair the tree radial growth in other moist tropical and subtropical regions [25,26,27]. The negative impacts of changing climate on tree growth have overridden the small positive influence of rising atmospheric CO2 [28]. This highlights the knowledge of tree growth response to climate in this moist forest. Previous studies on the relationship between the tree radial growth and climate in our study area mainly focus on conifer tree species, such as Pinus massoniana [22,24,29]. However, evergreen broad-leaved tree species form the predominant component of subtropical forests. The relationship between radial growth and climate in evergreen broad-leaved tree species is rarely studied, and the spatial differences (i.e., latitude and elevation pattern) of such a relationship have not been reported yet. Therefore, to better understand the response of tree growth to climate change in subtropical forests in Southeast China and evaluate forest carbon sink potential under climate change, we need to further elucidate the relationship between climate and the radial growth of evergreen broad-leaved trees and its potential spatial differences.
S. superba is a dominant evergreen broad-leaved tree species with wide distribution in Chinese subtropical forests. It is a representative tree species, successfully in forests during both early and late stages of succession. Therefore, it is very important to study the relationship between the radial growth of S. superba and climate. Moreover, it can be studied at a large spatial scale due to its wide distribution. In this study, dendroclimatology was used to conduct comparative research on the relationship between the radial growth of S. superba stands at its southern and northern distribution margins and climate (i.e., temperature, precipitation, and sunshine time). The specific goal of this study was to identify the common climatic factors affecting the radial growth of S. superba and explore the spatial differences (latitude and elevation pattern) of the relationship between the radial growth of S. superba and climate. Based on the relevant results from studies on Pinus massoniana and the unimodal pattern of the intra-annual radial growth rate of S. superba at the southern margin with the fastest growth period of xylem cells from April to May (Figure A2), we assumed that high springtime temperature would benefit the radial growth, while the high temperature in the late rainy season would inhibit the radial growth. Further, its radial growth would have spatial differences in response to temperature. The stands in a relatively cold growth environment (i.e., high elevation and northern margin) would be a more positive response to rising temperature than the stands in a relatively warm growth environment (i.e., southern margin, especially with low elevation). This study helps further understand the response of trees’ radial growth and carbon sink potential to climate change in Chinese subtropical forests.

2. Materials and Methods

2.1. Study Area

Our research area is located in the East Asian monsoon region of Southeast China, with a latitudinal and longitudinal gradient range of 23.16–29.80° N and 112.63–121.79° E (Figure 1). The climate in this region is characterized by warm and wet summers, as well as mild and dry winters. The average annual maximum, minimum, and mean temperatures were 23.2 °C, 14.9 °C, and 18.3 °C, respectively. The mean annual total precipitation was 1688 mm, and the mean annual sunshine time was 1614.2 h [24]. More detailed information on the site-specific climate is shown in Table A1 and Table A2. The main forest type in this study’s area is a subtropical monsoon evergreen broad-leaved forest. The dominant soil type within the forests in our research area is ultisol.

2.2. Field Sampling of Tree-Ring Cores

The sampling sites were designed in five national nature reserves, including Dinghu Mountain (DHS), Shimentai (SMT), and Jiulian Mountain (JLS) in the southern subtropical region, and Gutian Mountain (GTS) and Tiantong Mountain (TTS) in the northern subtropical region (Figure 1). In each national nature reserve, one to two natural S. superba stands with no human disturbance were selected (Table 1). We focused on collecting tree rings from large, standing, healthy individuals. For each target tree, two cores were extracted using an increment borer with an inner diameter of 5.12 mm at 1.3 m above ground (breast height). A total of 159 trees from nine stands were collected (Table 1).

2.3. Building of Site-Specific Tree-Ring Width Residual Chronologies

In the laboratory, the cores were air-dried and polished with sandpaper until the boundary of the tree ring was visually distinguishable. The polished cores were placed on the platform of the Lintab system (Frank Rinntech, Heidelberg, Germany), and the width of the tree rings was measured using the TSAP-Win software (Version 4.81c, Frank Rinnthch, Germany) configured on the system at a resolution of 0.001 mm. The COFECHA software (Version 6.06P) was used to cross-date all tree-ring width series of each sampling site, and the measurement and dating results of the tree-ring width series were tested and corrected [30]. Finally, a total of 312 cores were reserved for further analysis.
The tree-ring width residual chronology was created using the “dplR” package of R software (Version 4.1.1, R Core Team, 2021) [31]. First, in order to eliminate the age-related growth trend, a smooth spline function with a 50% frequency cut-off at a wavelength of 0.67 series span was used to de-trend all tree-ring width series. This was performed to obtain a dimensionless tree-ring width index series. Thereafter, to strengthen the climate signal, the fitted autoregressive model was used to eliminate the growth autocorrelation retained in the tree-ring width index series. In order to eliminate the influence of outliers, the bi-weighted robust mean value was calculated for the tree-ring width residual chronology. To robust subsequent bootstrapped correlation analysis between radial growth and climate, we combined the two closely sampled stands in SMT to expand the analysis window. Finally, a total of eight tree-ring width residual chronologies were obtained from the five national nature reserves, including five chronologies in the southern subtropical region and three chronologies in the northern subtropical region. The period of common interval analysis was set from 1988 to 2013. Parameters of chronology, including mean correlation among all series (rbar), explained variances of all the series on the first component (PC1%), signal-to-noise ratio (SNR), expressed population signal (EPS), and subsample signal strength (SSS), were used to evaluate the quality of chronology [31,32].

2.4. Site-Specific Climate Data

Monthly climate data from 726 national meteorological stations from 1960 to 2016 were downloaded from the China Meteorological Data Service Center online database (http://data.cma.cn, accessed on 12 April 2017), including mean temperature (Tmean, °C), mean minimum temperature (Tmin, °C), mean maximum temperature (Tmax, °C), mean total precipitation (Pre, mm), and sunshine time (SunH, h). Because of the distance between the sampled stands and the nearest weather stations, as well as a missing value and insufficient length of records in some weather stations, a kriging interpolation was applied to the original climate dataset month by month to generate spatially explicit climate data for each plot using the gstat package [33] in R software (Version 4.1.1, R Core Team, 2021). A linear semivariogram method was applied to interpolate temperature and sunshine duration, while an exponential semivariogram was used for interpolating precipitation. Through this process, the monthly meteorological data of each sampling stand were obtained.

2.5. Statistical Analysis

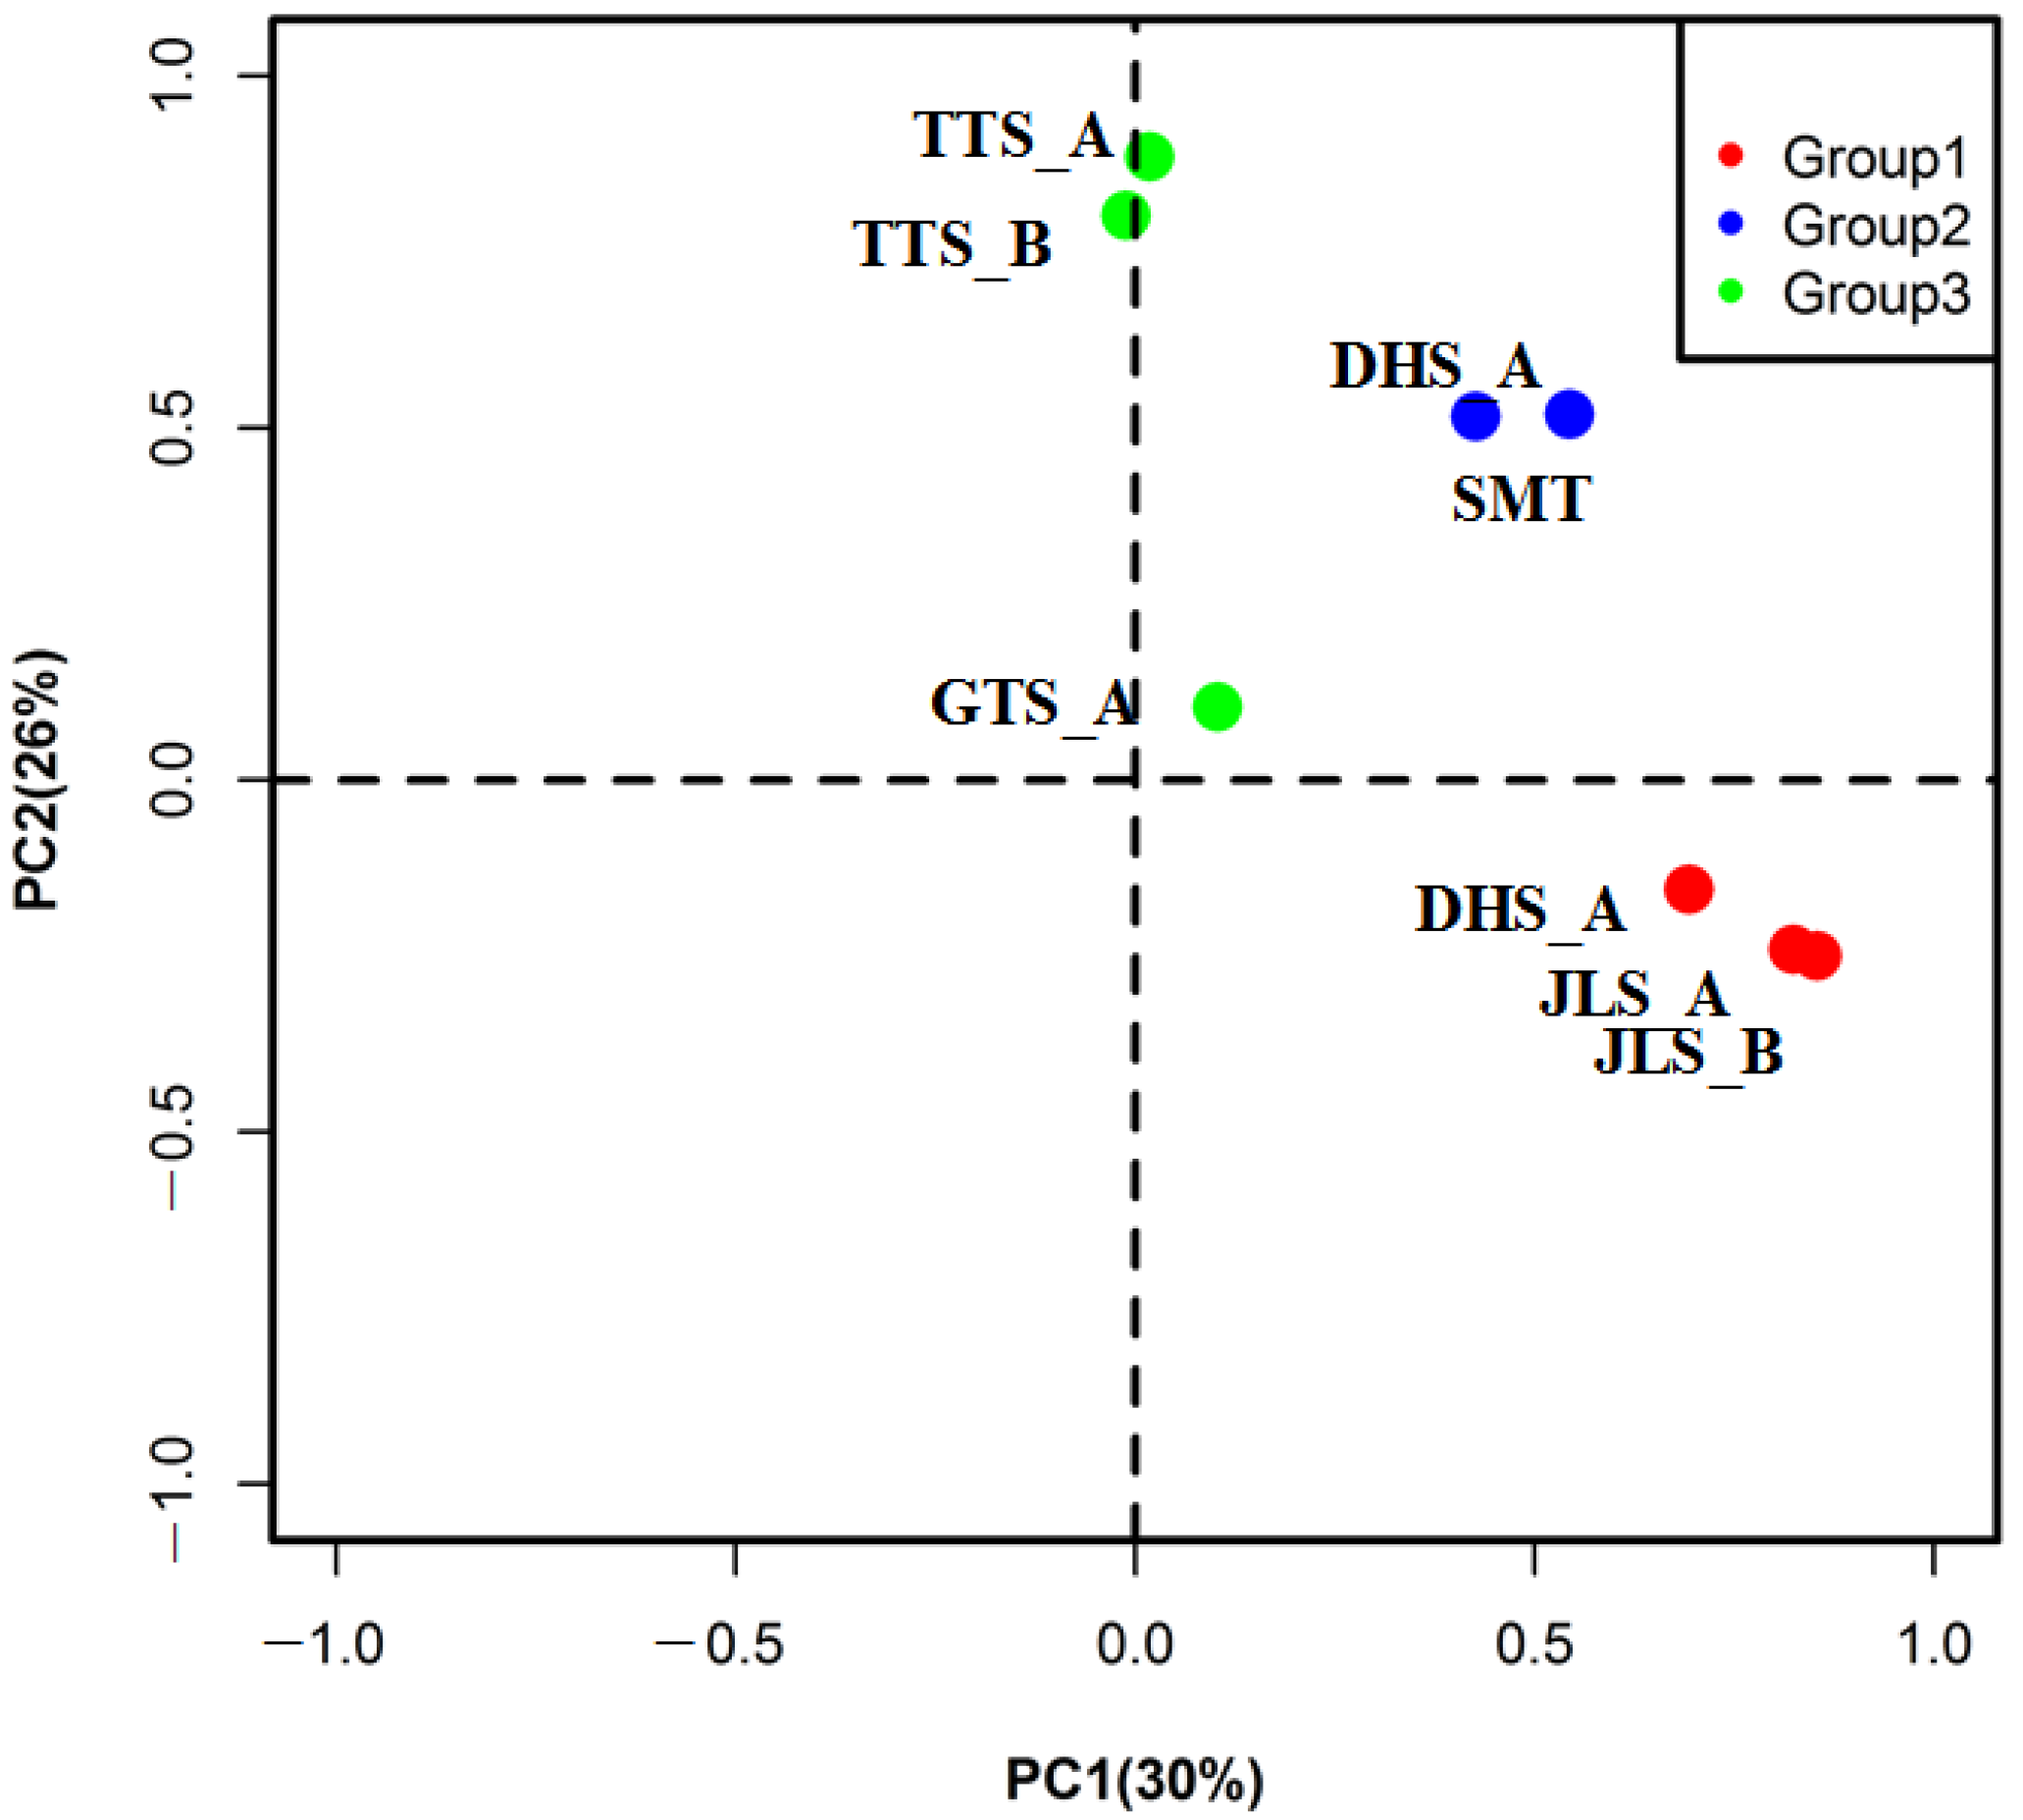
Due to the large spatial range of sampling sites, there may be heterogeneity in radial growth among all sampling stands. As such, we first conducted the principal component analysis on the chronologies of all sampling stands, and the results showed that the eight chronologies could be divided into three groups (Figure 2). By comparing the geographical characteristics of each group, all sampling stands can be divided into the high-elevation stands in the southern margin [Group1, including DHS_B (577 m a.s.l.), JLS_A (490 m a.s.l.) and JLS_B (500 m a.s.l.)], the low-elevation stands in the southern margin [Group2, including DHS_A (77 m a.s.l.), SMT (combined stands at 225 and 244 m a.s.l.)], and the stands in the northern margin (Group3, including TTS_A (83 m a.s.l.), TTS_B (83 m a.s.l.), and GTS_A (471 m a.s.l.) (Table 1, Figure 2).
To find the common climatic factor limiting the tree radial growth of S. superba in each group, we conducted a separate principal component analysis on the chronologies of each group. The scores corresponding to the first component (PC1) were then extracted and treated as the regional chronology of each group. Accordingly, the climate factors were divided into three groups, and a principal component analysis was applied to obtain the regional climate of each group.
The “treeclim” R package [34] was used to conduct a bootstrapped correlation analysis between the regional chronology and regional monthly climate for each of the three groups. The analysis was performed with 1000 sampling times, and a correlation significance level of 0.05 was set. The correlation coefficient was calculated for the period from June of the previous year to December of the current year, and the analysis period spanned from 1988 to 2013.

3. Results

3.1. Statistics of Tree-Ring Width Series and Residual Chronologies

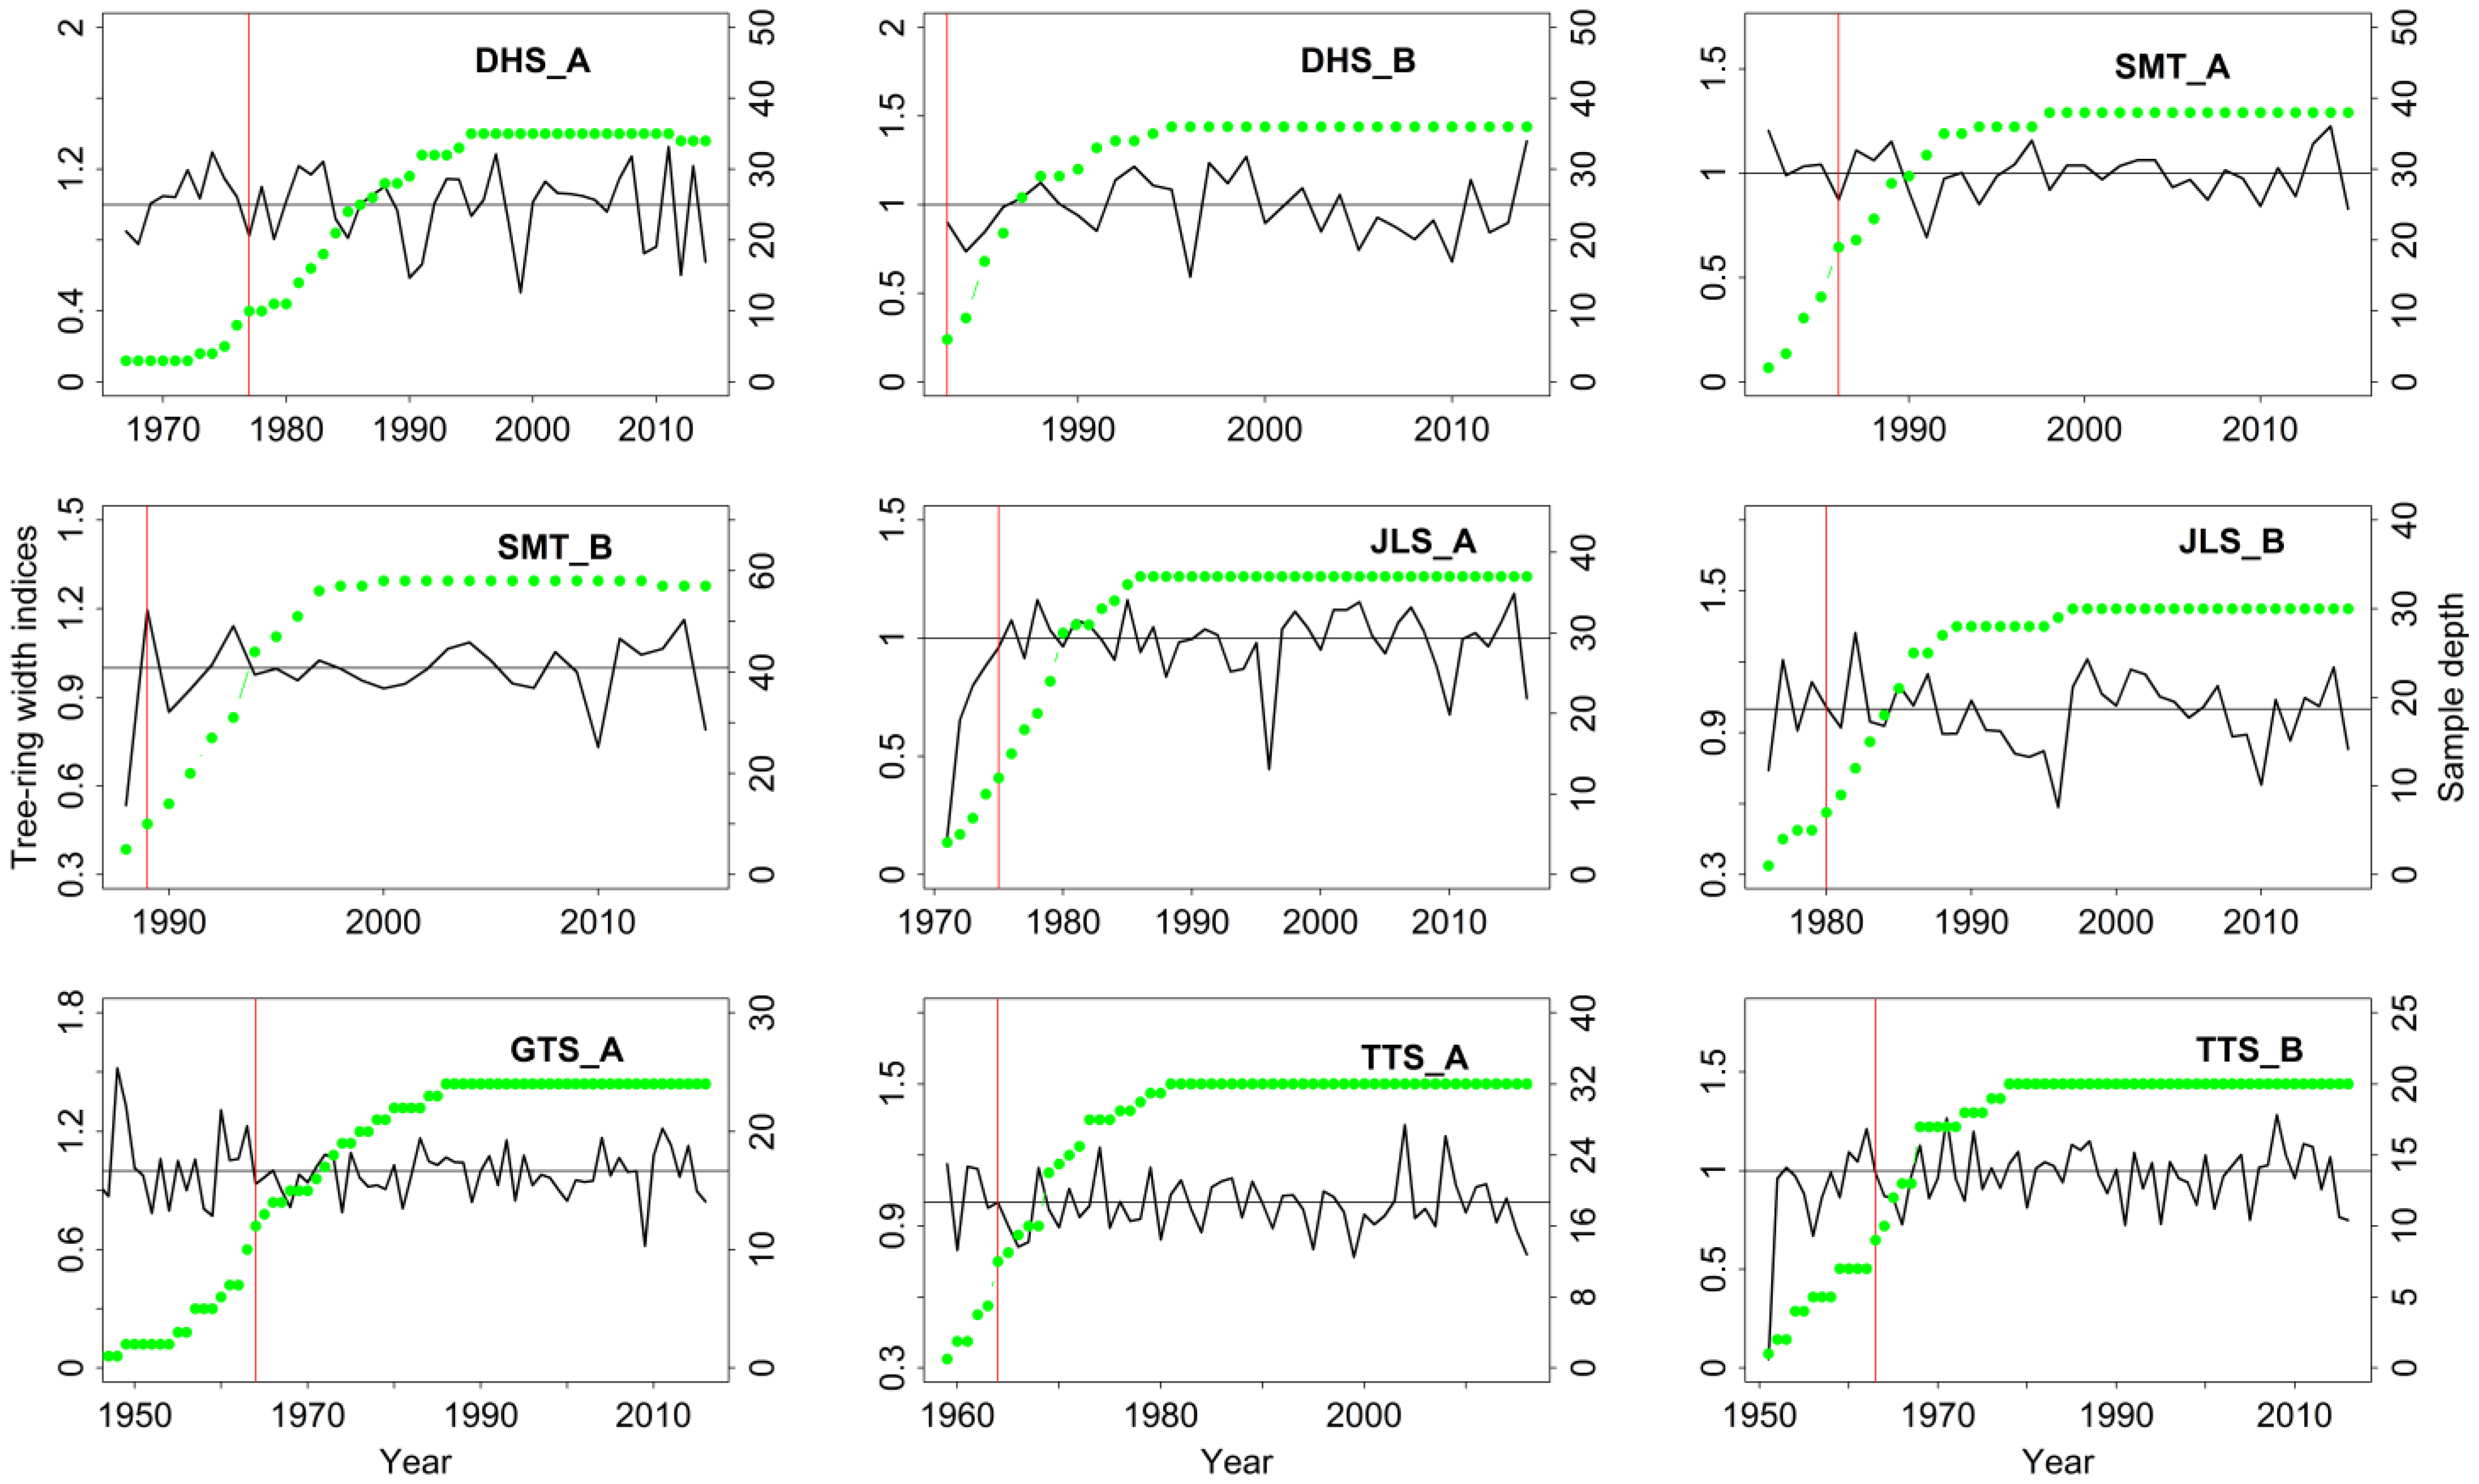
As shown in Table 1, the mean correlation of all tree-ring width series with master series ranges from 0.423 to 0.611, demonstrating the reliability of the cross-dating process. The results of the common interval analysis conducted on all tree-ring width chronologies from 1988 to 2013 revealed that the PC1% ranged from 27.9% to 40.8%; the rbar ranged from 0.236 to 0.351; the SNR ranged from 5.736 to 18.717; the value of EPS was greater than 0.85, and the most recent start year with SSS > 0.85 was 1988, indicating that all chronologies spanning from 1988 to 2013 can be used for radial growth–climate correlation analysis. All chronologies are shown in Figure A1.

3.2. Spatial Difference and Grouping in Radial Growth

As illustrated in Figure 2, the results of the principal component analysis of the eight tree-ring width residual chronologies showed that the first two components account for 30% (PC1) and 26% (PC2) of the variance in radial growth, contributing to cumulative variance of 56%. The loading values of each sampling site on the first two principal components showed that the southern and northern sampling sites are clustered separately. Another noteworthy observation is that the low-elevation and high-elevation sampling sites in the southern margin formed distinct clusters and were separated by PC1, indicating that there were differences in radial growth between high- and low-elevation S. superba stands in the southern margin. Finally, all the sampling stands were divided into three groups: high-elevation stands in the southern margin [Group1, including DHS_B (577 m a.s.l.), JLS_A (490 m a.s.l.) and JLS_B (500 m a.s.l.)]; low-elevation stands in the southern margin [Group2, including DHS_A (77 m a.s.l.) and SMT (combined stands at 225 and 244 m a.s.l.)]; and stands in the northern margin (Group3, including TTS_A (83 m a.s.l.), TTS_B (83 m a.s.l.) and GTS_A (471 m a.s.l.)) (Figure 2).
According to the stand grouping, a principal component analysis was conducted on the tree-ring width chronologies of each group. PC1s of Group1, Group2, and Group3 accounted for 73%, 73%, and 57% of the total variance of tree-ring width chronologies, respectively. Scores corresponding to the first principal component were extracted as regional chronologies for subsequent radial growth–climate correlation analysis. There was no significant correlation between the three regional chronologies (Group1/Group2, r = 0.250, p = 0.22; Group1/Group3, r = −0.135, p = 0.51; Group2/Group3, r = 0.341, p = 0.09), confirming the spatial differences in the radial growth of S. superba.

3.3. Relationship of Radial Growth of High-Elevation Stands in the Southern Margin and Climate

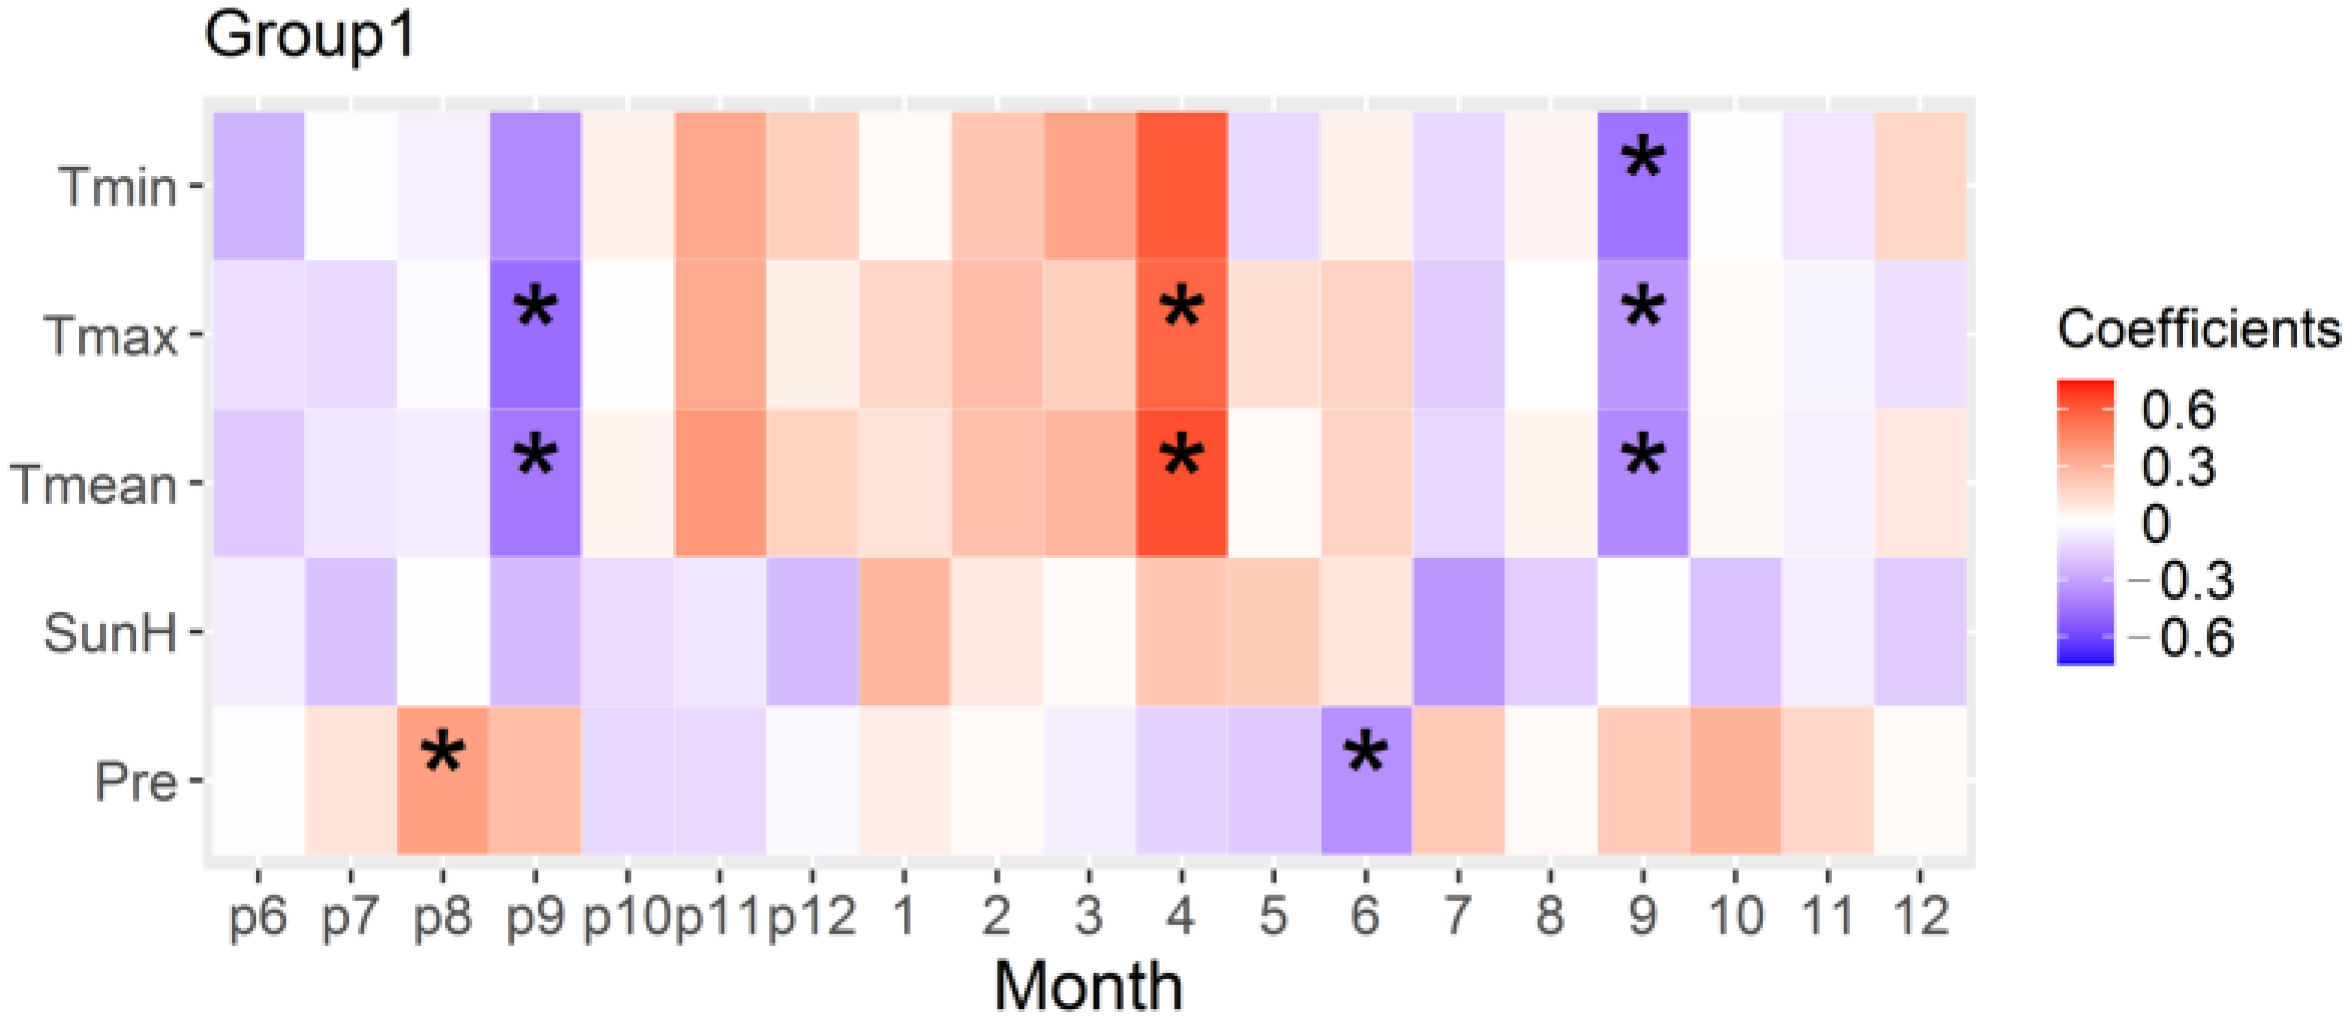
As shown in Figure 3, the results of the bootstrapped correlation analysis between the regional chronology of high-elevation stands in the southern margin and the regional climate revealed a significant positive correlation between the radial growth of S. superba and the mean and maximum temperatures in April of the current year (Tmean_4: r = 0.630, p < 0.05; Tmax_4: r = 0.566, p < 0.05) and the precipitation in August of the previous year (Pre_p8: r = 0.373, p < 0.05). Additionally, it was shown that the radial growth was negatively correlated with the mean and maximum temperatures in September of the previous year, the mean, maximum, and minimum temperatures in September of the current year, and the precipitation in June of the current year (Tmean_p9: r = −0.437, p < 0.05; Tmax_p9: r = −0.475, p < 0.05; Tmean_9: r = −0.383, p < 0.05; Tmax_9: r = −0.338, p < 0.05; Tmin_9: r = −0.456, p < 0.05; Pre_6: r = −0.359, p < 0.05).

3.4. Relationship of Radial Growth of Low-Elevation Stands in the Southern Margin and Climate

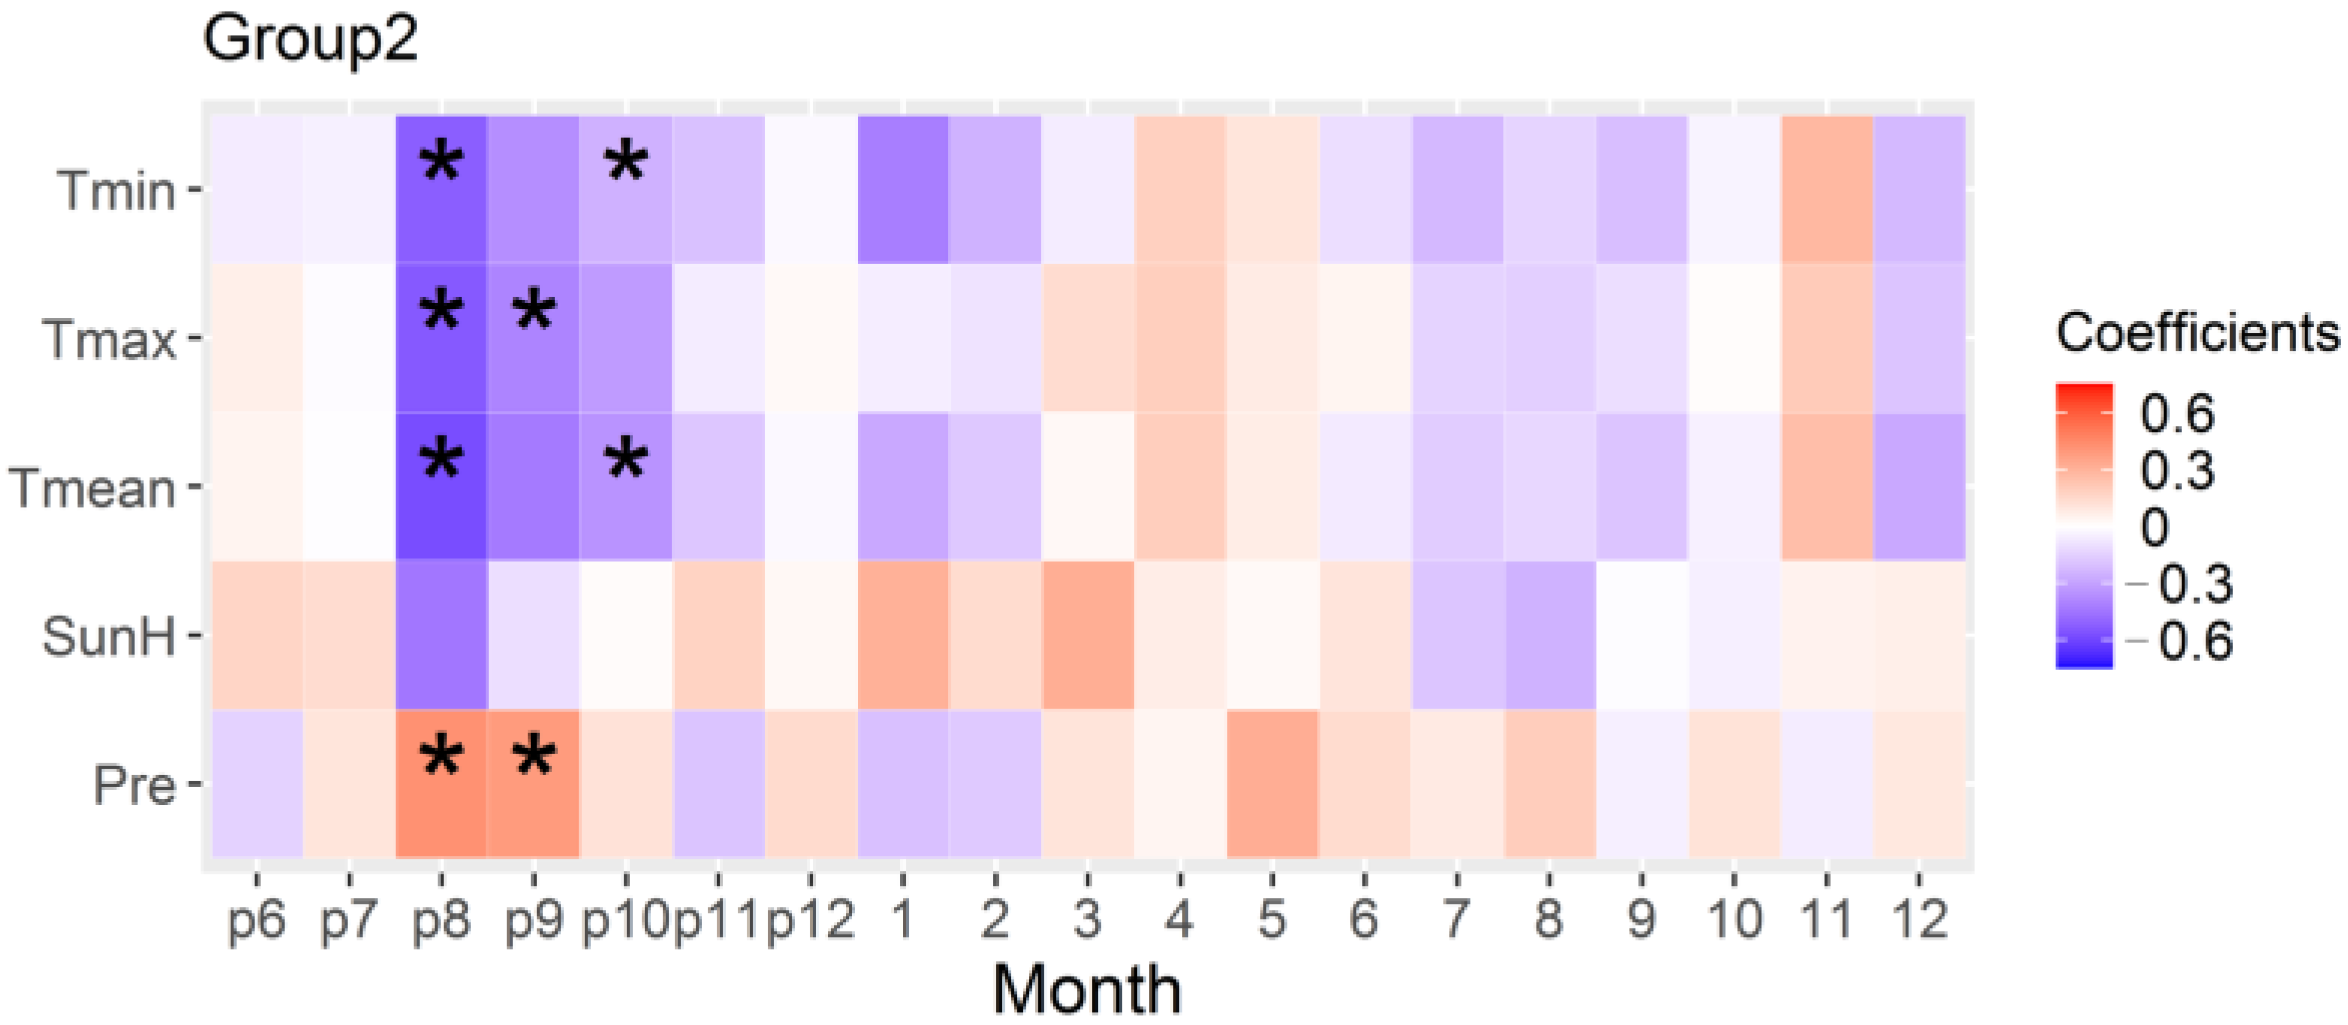
As shown in Figure 4, the results of the bootstrapped correlation analysis between the regional chronology of low-elevation stands in the southern margin, and the regional climate revealed a significant negative correlation between the radial growth of S. superba and the mean and minimum temperatures in August and October of the previous year, and the maximum temperature in August and September of the previous year (Tmean_p8: r = −0.577, p < 0.05; Tmin_p8: r = −0.524, p < 0.05; Tmean_p10: r = −0.348, p < 0.05; Tmin_p10: r = −0.252, p < 0.05; Tmax_p8: r = −0.538, p < 0.05; Tmax_p9: r = −0.397, p < 0.05). Moreover, the radial growth of S. superba has a significant positive correlation with the precipitation in August and September of the previous year (Pre_p8: r = 0.423, p < 0.05; Pre_p9: r = 0.387, p < 0.05).

3.5. Relationship of Radial Growth of Stands in the Northern Margin and Climate

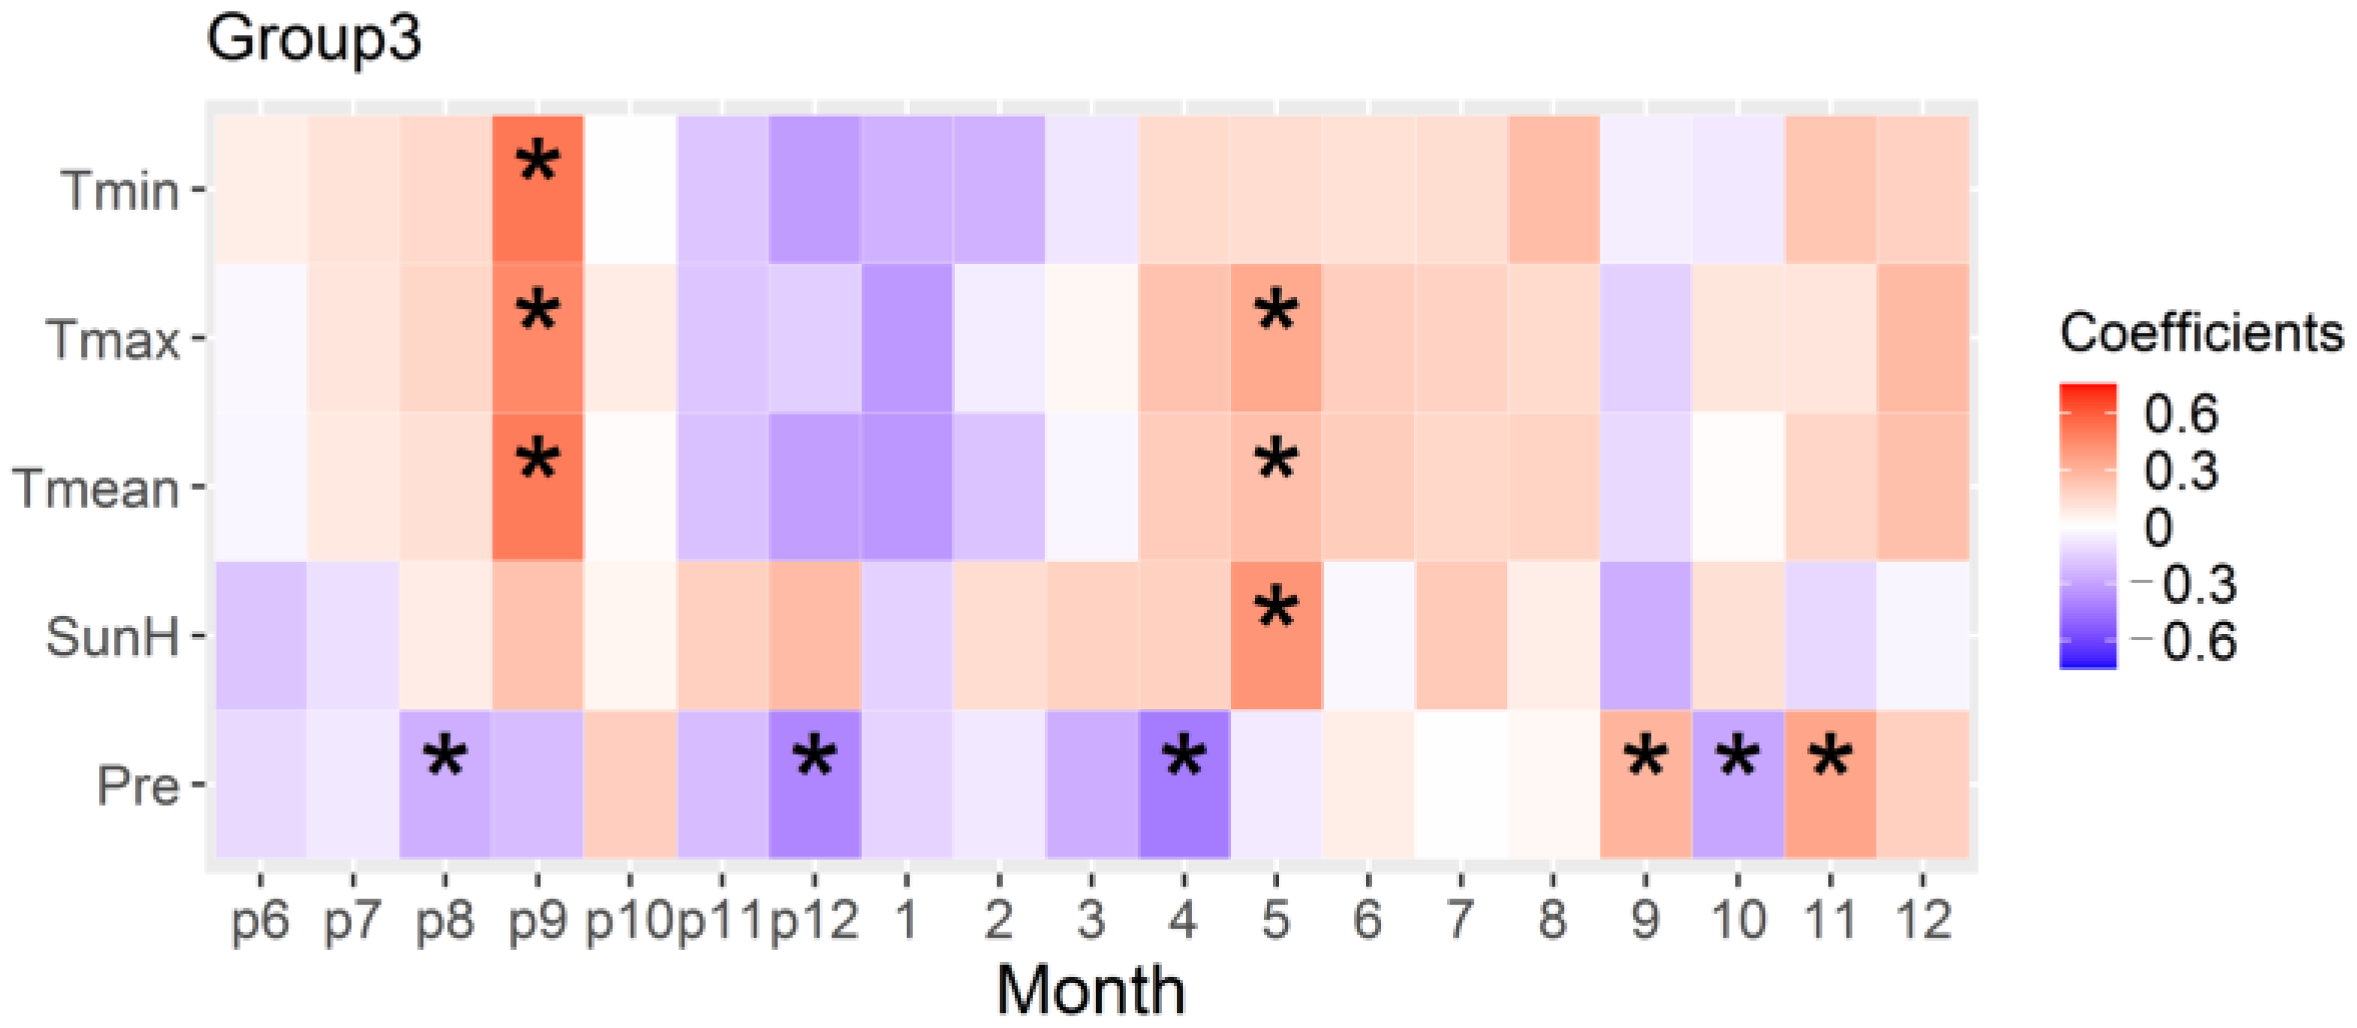
As shown in Figure 5, the results of the bootstrapped correlation analysis between the regional chronology of stands in the northern margin and the regional climate showed a significant positive correlation between the radial growth of S. superba and the mean temperature, maximum temperature and sunshine time in May of the current year, the mean, maximum, and minimum temperatures in September of the previous year and precipitation in September and November of the current year (Tmean_5: r = 0.249, p < 0.05; Tmax_5: r = 0.335, p < 0.05; SunH_5: r = 0.407, p < 0.05; Tmean_p9: r = 0.495, p < 0.05; Tmax_p9: r = 0.450, p < 0.05; Tmin_p9: r = 0.511, p < 0.05; Pre_9: r = 0.288, p < 0.05; Pre_11: r = 0.350, p < 0.05). Additionally, the radial growth was negatively correlated with precipitation in April and October of the current year and in August and December of the previous year (Pre_4: r = −0.429, p < 0.05; Pre_10: r = −0.287, p < 0.05; Pre_p8: r = −0.262, p < 0.05; Pre_p12: r = −0.391, p < 0.05).

4. Discussion

4.1. The Positive Effect of Warm Spring on the Radial Growth of Stands in the Northern Margin and High-Elevation Stands in the Southern Margin

The high temperature in April and May was found to positively influence the radial growth of S. superba from stands in the northern margin, and high-elevation stands in the southern margin, respectively. Similar results for other tree species were found in previous site-specific studies in our study area. For example, several studies have reported a positive correlation between the radial growth of Pinus massoniana stands at a high elevation in the southern subtropical region, and the spring temperature [16,19,20,21]. In addition, many studies have documented a positive response of the radial growth of different tree species in the northern subtropical region to the spring temperature [13,18,35,36].
The positive effect of high temperature may be attributed to the increase in the maximum leaf photosynthetic capacity of S. superba in spring. Li et al. [37,38] transplanted saplings of S. superba from high elevations to low elevations and found that their leaf photosynthetic capacity, stomatal conductance, and radial growth significantly improved under the warm growth environment at low elevations. In April and May, the new leaves of S. superba fully unfolded, and new canopy photosynthesis formed. At this time, high temperatures in spring, along with sufficient water, increase canopy photosynthesis and produce more carbon for radial growth in trunks [39]. The positive effect of sunshine time on radial growth also suggests that the increased photosynthetic production in spring promotes the radial growth of S. superba (Figure 3 and Figure 5).
In another study, the annual radial growth dynamics of xylem cells in trunks of S. superba were monitored at the Shimentai National Nature reserves (SMT, 24°23′53″ N, 113°11′56″ E, 261 m a.s.l.) in the southern margin of our study area. It was reported that the fastest growth period of xylem cells was observed from April to May (Figure A2, unpublished). Therefore, the spring temperature will promote the growth of earlywood. First, the growth of more earlywood leads to an improved plant hydraulic conductivity [40], which will help cope with the increase in water demand and maintain high leaf photosynthesis under high temperatures and transpiration in the late growing season [41,42]. Consequently, it will alleviate the decline in the xylem cell growth rate in the late rainy season (Figure A2) and improve radial growth in the current year [43,44] via more carbon investment. Secondly, the increased plant hydraulic conductivity due to the growth of more earlywood enables individual trees to support more canopy leaf area [45,46,47], thereby promoting radial growth by improving photosynthetic production at the canopy level.
However, the high temperatures in springtime had a weak positive influence on the radial growth of S. superba from low-elevation stands in the southern margin. This may be attributed to the weakened response of leaf maximum photosynthetic capacity of trees under warm growth environments to warming [48,49]. Consequently, there may be no increase in carbon input for xylem cell growth from photosynthetic production. Thus, spring temperatures have no significant positive effect on radial growth. Another possible reason is that water deficiency restricts xylem cell growth; i.e., demand and transpiration consumption in the water in plants are higher in warm growth environments; thus, a high temperature in springtime may lead to water deficit that limits photosynthesis or directly restricts xylem cell growth in spring [50,51].
Our results show that the radial growth of S. superba stands growing in relatively cool growth environments (e.g., northern subtropical region and high-elevation regions) will benefit from warmer springs in the moist subtropical forests in Southeast China.

4.2. The Negative Effect of High Temperatures in the Late Rainy Season on the Radial Growth of Stands in the Southern Margin

High temperatures in the late rainy season were found to negatively influence the radial growth of S. superba in the southern margin. The reason may be due to the dropping water potential and increasing embolization in branches under high temperatures and transpiration during the hottest months [40]. Consequently, this may result in insufficient water supply, decreased stomata conductance of leaves [52,53,54], and even loss of photosynthetic tissue [55]. Further, this may result in a reduction in photosynthetic production and carbon reserves in the late growing season, with negative effects on radial growth in the current and following years [56,57]. Therefore, the cooling of the canopy temperature in the late rainy season is expected to enhance the tree radial growth. This idea was supported by a positive correlation between the radial growth of S. superba and precipitation in the late rainy season. (Figure 3 and Figure 4). This is why a positive influence of temperatures in September of the previous year was observed in stands under relatively cool growth environments at the northern margin (Figure 5). In our study area, the negative effect of high temperatures during summer on the radial growth of some other conifer tree species in the southern subtropical region supported our findings [21,22,58,59].
Our results imply that climate warming would adversely affect the radial growth of S. superba stands growing in relatively warmer environments (southern region of Southeast China) [7], which may aggravate the risk of mortality among large trees in the southern subtropical stands [8] and contribute to the depletion of the stable carbon pool component sequestered in the tree radial growth from the forest ecosystem. Ultimately, it might affect the carbon sink of subtropical forests in Southeast China.

5. Conclusions

Through a comparative analysis of the relationship between climate and radial growth of S. superba in the southern and northern distribution margins in the humid subtropical forests of Southeast China, the results reveal that temperature is the dominant climatic factor affecting radial growth of S. superba and the responses of radial growth to temperature show significant spatial differences. In general, the radial growth of S. superba stands under relatively cold growth environments (e.g., northern and high-elevation regions) and would benefit from the high temperatures in springtime. On the other hand, under relatively warm growth environments (e.g., southern region, especially low-elevation regions), the radial growth of S. superba might be limited by the high temperatures in the late rainy season. Our results suggest that future climate warming may be unfavorable to the radial growth of S. superba in the subtropical forests of Southeast China, especially for stands under warm growth environments in the southern subtropical region. These findings enhance the understanding of the impact of climate change on tree growth and carbon sink potential in subtropical forests of Southeast China.

Author Contributions

Conceptualization and methodology, S.J., H.L. and P.Z.; performed the experiments, S.J. and X.G.; manuscript writing, S.J.; review and editing, S.J. and H.L.; supervision, H.L. and P.Z. All authors have read and agreed to the published version of the manuscript.

Funding

This research was funded by the Xinjiang Regional Collaborative Innovation Project (2022E01045), Zhejiang University (108000*1942222R1), the National Natural Science Foundation of China (41701047, 32201543), the National Key Research Project (2021YFC3100401), and the Guangxi Science and Technology Base and Talent Project (No.2021AC19325).

Data Availability Statement

The datasets generated and analyzed during the current study are not publicly available due to this experiment being a collaborative effort; the trial data do not belong to me alone but are available from the corresponding author on reasonable request.

Acknowledgments

The authors thank Jinye Li for his help in fieldwork.

Conflicts of Interest

The authors declare no conflict of interest.

Appendix A

Figure A1. Tree-ring width residual chronologies constructed for nine S. superba stands in five national natural reserves, including Dinghu Mountain (DHS), Shimentai (SMT), Jiulian Mountain (JLS), Gutian Mountain (GTS), and Tiantong Mountain (TTS). A and B indicate different stands. The green dashed lines indicate the number of tree-ring samples, and the red lines indicate the start year of credible chronologies (SSS > 0.85).
Forests 14 01291 g0a1
Figure A2. Intra-annual pattern of radial growth rate of S. superba at the southern Shimentai National Nature Reserve in Southeast China (SMT, 24°23′53″ N, 113°11′56″ E, 261 m a.s.l.). DOY indicates day of the year. Microcores were sampled from five standing, dominant individuals of S. superba at breast height (1–1.3 m above the ground) each week from February to December 2016 to monitor wood formation. The microcores were 2 mm in diameter and 2 to 3 cm in length and were extracted by Trephor. In the small panel, the Gompertz model was employed to fit the weekly length of newly formed wood, and the first-order derivative was used to character radial growth rate.
Forests 14 01291 g0a2
Table A1. Site-specific annual climate information. The mean values from 1988 to 2013 are shown, including total precipitation (Pre, mm), annual mean temperature (Tmean, °C), annual maximum temperature (Tmax, °C), annual minimum temperature (Tmin, °C), and sunshine time (SunH, hour).
SiteLatitudeLongitudeElevationPreTmeanTmaxTminSunH
DHS_A23.16112.55771653.28 22.15 26.49 19.06 1619.18
DHS_B23.17112.535771649.15 19.13 23.49 16.02 1618.95
SMT_A24.40113.202441775.58 19.59 24.53 16.22 1581.64
SMT_B24.42113.232251769.07 19.69 24.62 16.33 1581.96
JLS-A24.57114.434901666.01 18.46 23.65 14.94 1599.04
JLS_B24.54114.465001674.18 18.45 23.66 14.91 1600.68
GTS_A29.25118.104711802.69 15.27 20.39 11.49 1676.38
TTS_A29.80121.79831432.84 16.92 21.08 13.83 1761.66
TTS_B29.80121.79831432.84 16.92 21.08 13.83 1761.66
Table A2. Site-specific monthly climate information. The mean values from 1988 to 2013 are shown, including annual maximum temperature (Tmax, °C) and annual minimum temperature (Tmin, °C); Numbers 1, 4, 7, and 9 indicate January, April, July, and September, respectively.
SiteLatitudeLongitudeElevationTmaxTminTmean
147914791479
DHS_A23.16112.557717.94 26.01 33.11 31.45 10.77 19.57 25.46 23.97 13.74 22.26 28.61 27.14
DHS_B23.17112.5357714.93 23.01 30.12 28.46 7.73 16.55 22.44 20.93 10.71 19.25 25.59 24.11
SMT_A24.40113.2024414.46 23.97 32.68 30.23 6.77 17.02 24.15 21.50 9.79 19.94 27.60 25.04
SMT_B24.42113.2322514.53 24.07 32.79 30.33 6.85 17.12 24.28 21.61 9.87 20.04 27.73 25.16
JLS_A24.57114.4349014.15 23.17 31.68 29.01 5.59 15.73 22.57 20.23 8.96 18.83 26.25 23.78
JLS_B24.54114.4650014.24 23.18 31.62 28.98 5.59 15.72 22.49 20.19 9.00 18.82 26.18 23.74
GTS_A29.25118.104717.49 20.41 31.79 27.37 0.22 11.12 22.62 18.30 3.21 15.09 26.71 22.16
TTS_A29.80121.79839.38 19.97 32.42 27.83 2.90 11.74 24.94 21.33 5.66 15.27 27.98 24.13
TTS_B29.80121.79839.38 19.97 32.42 27.83 2.90 11.74 24.94 21.33 5.66 15.27 27.98 24.13

References

  1. Pan, Y.; Birdsey, R.A.; Fang, J.; Houghton, R.; Kauppi, P.E.; Kurz, W.A.; Phillips, O.L.; Shvidenko, A.; Lewis, S.L.; Canadell, J.G.; et al. Large and persistent carbon sin in the world’s forests. Science 2011, 333, 988–993. [Google Scholar] [CrossRef] [PubMed] [Green Version]
  2. Van Der Sleen, P.; Groenendijk, P.; Vlam, M.; Anten, N.P.; Boom, A.; Bongers, F.; Pons, T.L.; Terburg, G.; Zuidema, P.A. No growth stimulation of tropical trees by 150 years of CO2 fertilization but water-use efficiency increased. Nat. Geosci. 2015, 8, 24–28. [Google Scholar] [CrossRef]
  3. Groenendijk, P.; van der Sleen, P.; Vlam, M.; Bunyavejchewin, S.; Bongers, F.; Zuidema, P.A. No evidence for consistent long-term growth stimulation of 13 tropical tree species: Results from tree-ring analysis. Glob. Change Biol. 2015, 21, 3762–3776. [Google Scholar] [CrossRef]
  4. Cabon, A.; Kannenberg, S.A.; Arain, A.; Babst, F.; Baldocchi, D.; Belmecheri, S.; Delpierre, N.; Guerrieri, R.; Maxwell, J.T.; McKenzie, S.; et al. Cross-biome synthesis of source versus sink limits to tree growth. Science 2022, 376, 758–761. [Google Scholar] [CrossRef] [PubMed]
  5. Yu, G.; Chen, Z.; Piao, S.; Peng, C.; Ciais, P.; Wang, Q.; Li, X.; Zhu, X. High carbon dioxide uptake by subtropical forest ecosystems in the East Asian monsoon region. Proc. Natl. Acad. Sci. USA 2014, 111, 4910–4915. [Google Scholar] [CrossRef] [Green Version]
  6. Li, Y.; Dong, Z.; Chen, D.; Zhao, S.; Zhou, F.; Cao, X.; Fang, K. Growth decline of Pinus Massoniana in response to warming induced drought and increasing intrinsic water use efficiency in humid subtropical China. Dendrochronologia 2019, 57, 125609. [Google Scholar] [CrossRef]
  7. Wu, G.; Liu, H.; Hua, L.; Luo, Q.; Lin, Y.; He, P.; Feng, S.; Liu, J.; Ye, Q. Differential responses of stomata and photosynthesis to elevated temperature in two co-occurring subtropical forest tree species. Front. Plant Sci. 2018, 9, 467. [Google Scholar] [CrossRef] [PubMed] [Green Version]
  8. Zhou, G.; Peng, C.; Li, Y.; Liu, S.; Zhang, Q.; Tang, X.; Liu, J.; Yan, J.; Zhang, D.; Chu, G. A climate change-induced threat to the ecological resilience of a subtropical monsoon evergreen broad-leaved forest in Southern China. Glob. Change Biol. 2013, 19, 1197–1210. [Google Scholar] [CrossRef]
  9. Zhou, G.; Houlton, B.Z.; Wang, W.; Huang, W.; Xiao, Y.; Zhang, Q.; Liu, S.; Cao, M.; Wang, X.; Wang, S.; et al. Substantial reorganization of China’s tropical and subtropical forests: Based on the permanent plots. Glob. Change Biol. 2014, 20, 240–250. [Google Scholar] [CrossRef]
  10. Shi, J.; Cook, E.R.; Lu, H.; Li, J.; Wright, W.E.; Li, S. Tree-ring based winter temperature reconstruction for the lower reaches of the Yangtze River in southeast China. Clim. Res. 2010, 41, 169–175. [Google Scholar] [CrossRef]
  11. He, D.; Jiang, M.X.; Wei, X.Z. A dendroclimatic investigation of radial growth–climate relationships for the riparian species Cercidiphyllum japonicum in the Shennongjia area, central China. Trees 2012, 26, 503–512. [Google Scholar] [CrossRef]
  12. Zheng, Y.; Shao, X.; Lu, F.; Li, Y. February–May temperature reconstruction based on tree-ring widths of Abies fargesii from the Shennongjia area in central China. Int. J. Biometeorol. 2016, 60, 1175–1181. [Google Scholar] [CrossRef]
  13. Wang, B.; Gao, P. Relationship of tree ring width of Cinnamomum camphora with climate factors in Southern China. Afr. J. Agric. Res. 2012, 7, 2297–2303. [Google Scholar] [CrossRef]
  14. Chen, F.; Yuan, Y.; Wei, W.; Yu, S.; Wang, H. Tree-ring response of subtropical tree species in southeast China on regional climate and sea-surface temperature variations. Trees 2015, 29, 17–24. [Google Scholar] [CrossRef]
  15. Duan, J.; Zhang, Q.B.; Lv, L.; Zhang, C. Regional-scale winter-spring temperature variability and chilling damage dynamics over the past two centuries in southeastern China. Clim. Dynam. 2012, 39, 919–928. [Google Scholar] [CrossRef]
  16. Chen, F.; Yuan, Y.J.; Wei, W.S.; Yu, S.L.; Zhang, T.W. Tree ring-based winter temperature reconstruction for Changting, Fujian, subtropical region of Southeast China, since 1850: Linkages to the Pacific Ocean. Theor. Appl. Climatol. 2012, 109, 141–151. [Google Scholar] [CrossRef]
  17. Chen, F.; Yuan, Y.J.; Yu, S.L.; Zhang, T.W. Influence of climate warming and resin collection on the growth of Masson pine (Pinus massoniana) in a subtropical forest, southern China. Trees 2015, 29, 1423–1430. [Google Scholar] [CrossRef]
  18. Cai, Q.; Liu, Y.; Wang, Y.; Ma, Y.; Liu, H. Recent warming evidence inferred from a tree-ring-based winter-half year minimum temperature reconstruction in northwestern Yichang, South Central China, and its relation to the large-scale circulation anomalies. Int. J. Biometeorol. 2016, 60, 1885–1896. [Google Scholar] [CrossRef]
  19. Yuan, S.; Zheng, Y.; Wu, S.; Xu, P.; Zhang, F.; Kong, F.; Qi, Y.; Wang, D. March SST reconstruction in the South China Sea based on Pinus massoniana tree-ring widths from Changting, Fujian, in Southeast China since 1893 CE. Mar. Micropaleontol. 2018, 145, 21–27. [Google Scholar] [CrossRef]
  20. Wang, L.; Fang, K.; Chen, D.; Dong, Z.; Zhou, F.; Li, Y.; Zhang, P.; Ou, T.; Guo, G.; Cao, X.; et al. Intensified variability of the El Niño-Southern Oscillation enhances its modulations on tree growths in southeastern China over the past 218 years. Int. J. Climatol. 2018, 38, 5293–5304. [Google Scholar] [CrossRef]
  21. Chen, F.; Yuan, Y.J.; Wei, W.S.; Yu, S.L.; Zhang, T.W. Reconstructed temperature for Yong’an, Fujian, Southeast China: Linkages to the Pacific Ocean climate variability. Glob. Planet. Change 2012, 86, 11–19. [Google Scholar] [CrossRef]
  22. Cai, Q.; Liu, Y.; Liu, H.; Sun, C.; Wang, Y. Growing-season precipitation since 1872 in the coastal area of subtropical southeast China reconstructed from tree rings and its relationship with the East Asian summer monsoon system. Ecol. Indic. 2017, 82, 441–450. [Google Scholar] [CrossRef]
  23. Su, H.; Axmacher, J.C.; Yang, B.; Sang, W. Differential radial growth response of three coexisting dominant tree species to local and large-scale climate variability in a subtropical evergreen broad-leaved forest of China. Ecol. Res. 2015, 30, 745–754. [Google Scholar] [CrossRef]
  24. Liang, H.; Huang, J.G.; Ma, Q.; Li, J.; Wang, Z.; Guo, X.; Zhu, H.; Jiang, S.; Zhou, P.; Yu, B.; et al. Contributions of competition and climate on radial growth of Pinus massoniana in subtropics of China. Agric. For. Meteorol. 2019, 274, 7–17. [Google Scholar] [CrossRef]
  25. Wagner, F.; Rossi, V.; Aubry-Kientz, M.; Bonal, D.; Dalitz, H.; Gliniars, R.; Stahl, C.; Trabucco, A.; Hérault, B. Pan-tropical analysis of climate effects on seasonal tree growth. PLoS ONE 2014, 9, e92337. [Google Scholar] [CrossRef]
  26. Vlam, M.; Baker, P.J.; Bunyavejchewin, S.; Zuidema, P.A. Temperature and rainfall strongly drive temporal growth variation in Asian tropical forest trees. Oecologia 2014, 174, 1449–1461. [Google Scholar] [CrossRef]
  27. Rahman, M.; Islam, M.; Braeuning, A. Tree radial growth is projected to decline in South Asian moist forest trees under climate change. Glob. Planet. Change 2018, 170, 106–119. [Google Scholar] [CrossRef]
  28. Rahman, M.; Islam, M.; Gebrekirstos, A.; Bräuning, A. Trends in tree growth and intrinsic water-use efficiency in the tropics under elevated CO2 and climate change. Trees 2019, 33, 623–640. [Google Scholar] [CrossRef]
  29. Li, J.; Huang, J.G.; Tardif, J.C.; Liang, H.; Jiang, S.; Zhu, H.; Zhou, P. Spatially heterogeneous responses of tree radial growth to recent El Niño southern-oscillation variability across East Asia subtropical forests. Agric. For. Meteorol. 2020, 287, 107939. [Google Scholar] [CrossRef]
  30. Holmes, R.L. Computer-assisted quality control in tree-ring dating and measurement. Tree-Ring Bull. 1983, 43, 69–78. [Google Scholar]
  31. Bunn, A.G. A dendrochronology program library in R (dplR). Dendrochronologia 2008, 26, 115–124. [Google Scholar] [CrossRef]
  32. Wigley, T.M.; Briffa, K.R.; Jones, P.D. On the average value of correlated time series, with applications in dendroclimatology and hydrometeorology. J. Appl. Meteorol. Clim. 1984, 23, 201–213. [Google Scholar] [CrossRef]
  33. Pebesma, E.J. Multivariable geostatistics in S: The gstat package. Comput. Geosci. 2004, 30, 683–691. [Google Scholar] [CrossRef]
  34. Zang, C.; Biondi, F. Treeclim: An R package for the numerical calibration of proxy-climate relationships. Ecography 2015, 38, 431–436. [Google Scholar] [CrossRef]
  35. Zeng, A.; Zhou, F.; Li, W.; Bai, Y.; Zeng, C. Tree-ring indicators of winter-spring temperature in Central China over the past 200 years. Dendrochronologia 2019, 58, 125634. [Google Scholar] [CrossRef]
  36. Liu, S.; Gao, P.; Liu, P.; Niu, X.; Wang, B. The Response of Chinese Fir Forest Tree Ring Growth to Climate Change in China’s Dagangshan Region. Pol. J. Environ. Stud. 2019, 28, 2371–2379. [Google Scholar]
  37. Li, Y.; Liu, J.; Zhou, G.; Huang, W.; Duan, H. Warming effects on photosynthesis of subtropical tree species: A translocation experiment along an altitudinal gradient. Sci. Rep. 2016, 6, 24895. [Google Scholar] [CrossRef] [Green Version]
  38. Li, Y.; Xu, Y.; Li, Y.; Wu, T.; Zhou, G.; Liu, S.; Meng, Y.; Wang, J.; Ling, L.; Liu, J. Warming effects on morphological and physiological performances of four subtropical montane tree species. Ann. For. Sci. 2020, 77, 2. [Google Scholar] [CrossRef]
  39. Keel, S.G.; Schädel, C. Expanding leaves of mature deciduous forest trees rapidly become autotrophic. Tree Physiol. 2010, 30, 1253–1259. [Google Scholar] [CrossRef] [Green Version]
  40. Tyree, M.T.; Ewers, F.W. The hydraulic architecture of trees and other woody plants. New Phytol. 1991, 119, 345–360. [Google Scholar] [CrossRef]
  41. Souto-Herrero, M.; Rozas, V.; Garcia-Gonzalez, I. Chronologies of earlywood vessels and latewood width disentangle climate drivers of oak growth in a mild oceanic region. Dendrochronologia 2018, 51, 40–53. [Google Scholar] [CrossRef]
  42. Olson, M.E.; Anfodillo, T.; Rosell, J.A.; Martínez-Méndez, N. Across climates and species, higher vapour pressure deficit is associated with wider vessels for plants of the same height. Plant Cell Environ. 2020, 43, 3068–3080. [Google Scholar] [CrossRef]
  43. Eilmann, B.; Zweifel, R.; Buchmann, N.; Fonti, P.; Rigling, A. Drought-induced adaptation of the xylem in Scots pine and pubescent oak. Tree Physiol. 2009, 29, 1011–1020. [Google Scholar] [CrossRef] [Green Version]
  44. Camarero, J.J.; Collado, E.; Martínez-de-Aragón, J.; De-Miguel, S.; Büntgen, U.; Martinez-Peña, F.; Martín-Pinto, P.; Ohenoja, E.; Romppanen, T.; Salo, K.; et al. Associations between climate and earlywood and latewood width in boreal and Mediterranean Scots pine forests. Trees 2021, 35, 155–169. [Google Scholar] [CrossRef]
  45. Rosas, T.; Mencuccini, M.; Barba, J.; Cochard, H.; Saura-Mas, S.; Martínez-Vilalta, J. Adjustments and coordination of hydraulic, leaf and stem traits along a water availability gradient. New Phytol. 2019, 223, 632–646. [Google Scholar] [CrossRef]
  46. Trugman, A.T.; Anderegg, L.D.L.; Sperry, J.S.; Wang, Y.; Venturas, M.; Anderegg, W.R.L. Leveraging plant hydraulics to yield predictive and dynamic plant leaf allocation in vegetation models with climate change. Glob. Change Biol. 2019, 25, 4008–4021. [Google Scholar] [CrossRef]
  47. Trugman, A.T.; Anderegg, L.D.L.; Wolfe, B.T.; Birami, B.; Ruehr, N.K.; Detto, M.; Bartlett, M.K.; Anderegg, W.R.L. Climate and plant trait strategies determine tree carbon allocation to leaves and mediate future forest productivity. Glob. Change Biol. 2019, 25, 3395–3405. [Google Scholar] [CrossRef] [Green Version]
  48. Way, D.A.; Oren, R. Differential responses to changes in growth temperature between trees from different functional groups and biomes: A review and synthesis of data. Tree Physiol. 2010, 30, 669–688. [Google Scholar] [CrossRef] [Green Version]
  49. Liang, J.; Xia, J.; Liu, L.; Wan, S. Global patterns of the responses of leaf-level photosynthesis and respiration in terrestrial plants to experimental warming. J. Plant Ecol. 2013, 6, 437–447. [Google Scholar] [CrossRef] [Green Version]
  50. Deslauriers, A.; Huang, J.G.; Balducci, L.; Beaulieu, M.; Rossi, S. The contribution of carbon and water in modulating wood formation in black spruce saplings. Plant Physiol. 2016, 170, 2072–2084. [Google Scholar] [CrossRef] [Green Version]
  51. Niez, B.; Dlouha, J.; Moulia, B.; Badel, E. Water-stressed or not, the mechanical acclimation is a priority requirement for trees. Trees 2019, 33, 279–291. [Google Scholar] [CrossRef]
  52. Sperry, J.S.; Alder, N.N.; Eastlack, S.E. The Effect of Reduced Hydraulic Conductance on Stomatal Conductance and Xylem Cavitation. J. Exp. Bot. 1993, 44, 1075–1082. [Google Scholar] [CrossRef] [Green Version]
  53. Nardini, A.; Salleo, S. Limitation of stomatal conductance by hydraulic traits: Sensing or preventing xylem cavitation? Trees 2000, 15, 14–24. [Google Scholar] [CrossRef]
  54. Salleo, S.; Nardini, A.; Pitt, F.; Gullo, M.A.L. Xylem cavitation and hydraulic control of stomatal conductance in Laurel (Laurus nobilis L.). Plant Cell Environ. 2000, 23, 71–79. [Google Scholar] [CrossRef] [Green Version]
  55. Qu, L.; De Boeck, H.J.; Fan, H.; Dong, G.; Chen, J.; Xu, W.; Ge, Z.; Huang, Z.; Shao, C.; Hu, Y. Diverging responses of two subtropical tree species (Schima superba and Cunninghamia lanceolata) to heat waves. Forests 2020, 11, 513. [Google Scholar] [CrossRef]
  56. Keel, S.G.; Siegwolf, R.; Krner, C. Canopy CO2 enrichment permits tracing the fate of recently assimilated carbon in a mature deciduous forest. New Phytol. 2006, 172, 319–329. [Google Scholar] [CrossRef]
  57. Kuptz, D.; Fleischmann, F.; Matyssek, R.; Grams, T.E. Seasonal patterns of carbon allocation to respiratory pools in 60-yr-old deciduous (Fagus sylvatica) and evergreen (Picea abies) trees assessed via whole-tree stable carbon isotope labeling. New Phytol. 2011, 191, 160–172. [Google Scholar] [CrossRef]
  58. Zhao, Z.; Fang, K.; Cao, C.; Chen, D.; Liang, X.; Dong, Z.; Zhang, P. Responses of the radial growth of the endangered species Keteleeria fortunei to climate change in southeastern China. Trees 2019, 33, 977–985. [Google Scholar] [CrossRef]
  59. Zheng, Z.; Fang, K.; Chen, Y.; Dong, Z.; Zhou, F.; Li, Y. Is the Pinus massoniana Lamb. Tree-Ring Latewood Formation Influenced by the Diurnal Temperature Range in Humid Subtropical China? Forests 2022, 13, 1439. [Google Scholar] [CrossRef]
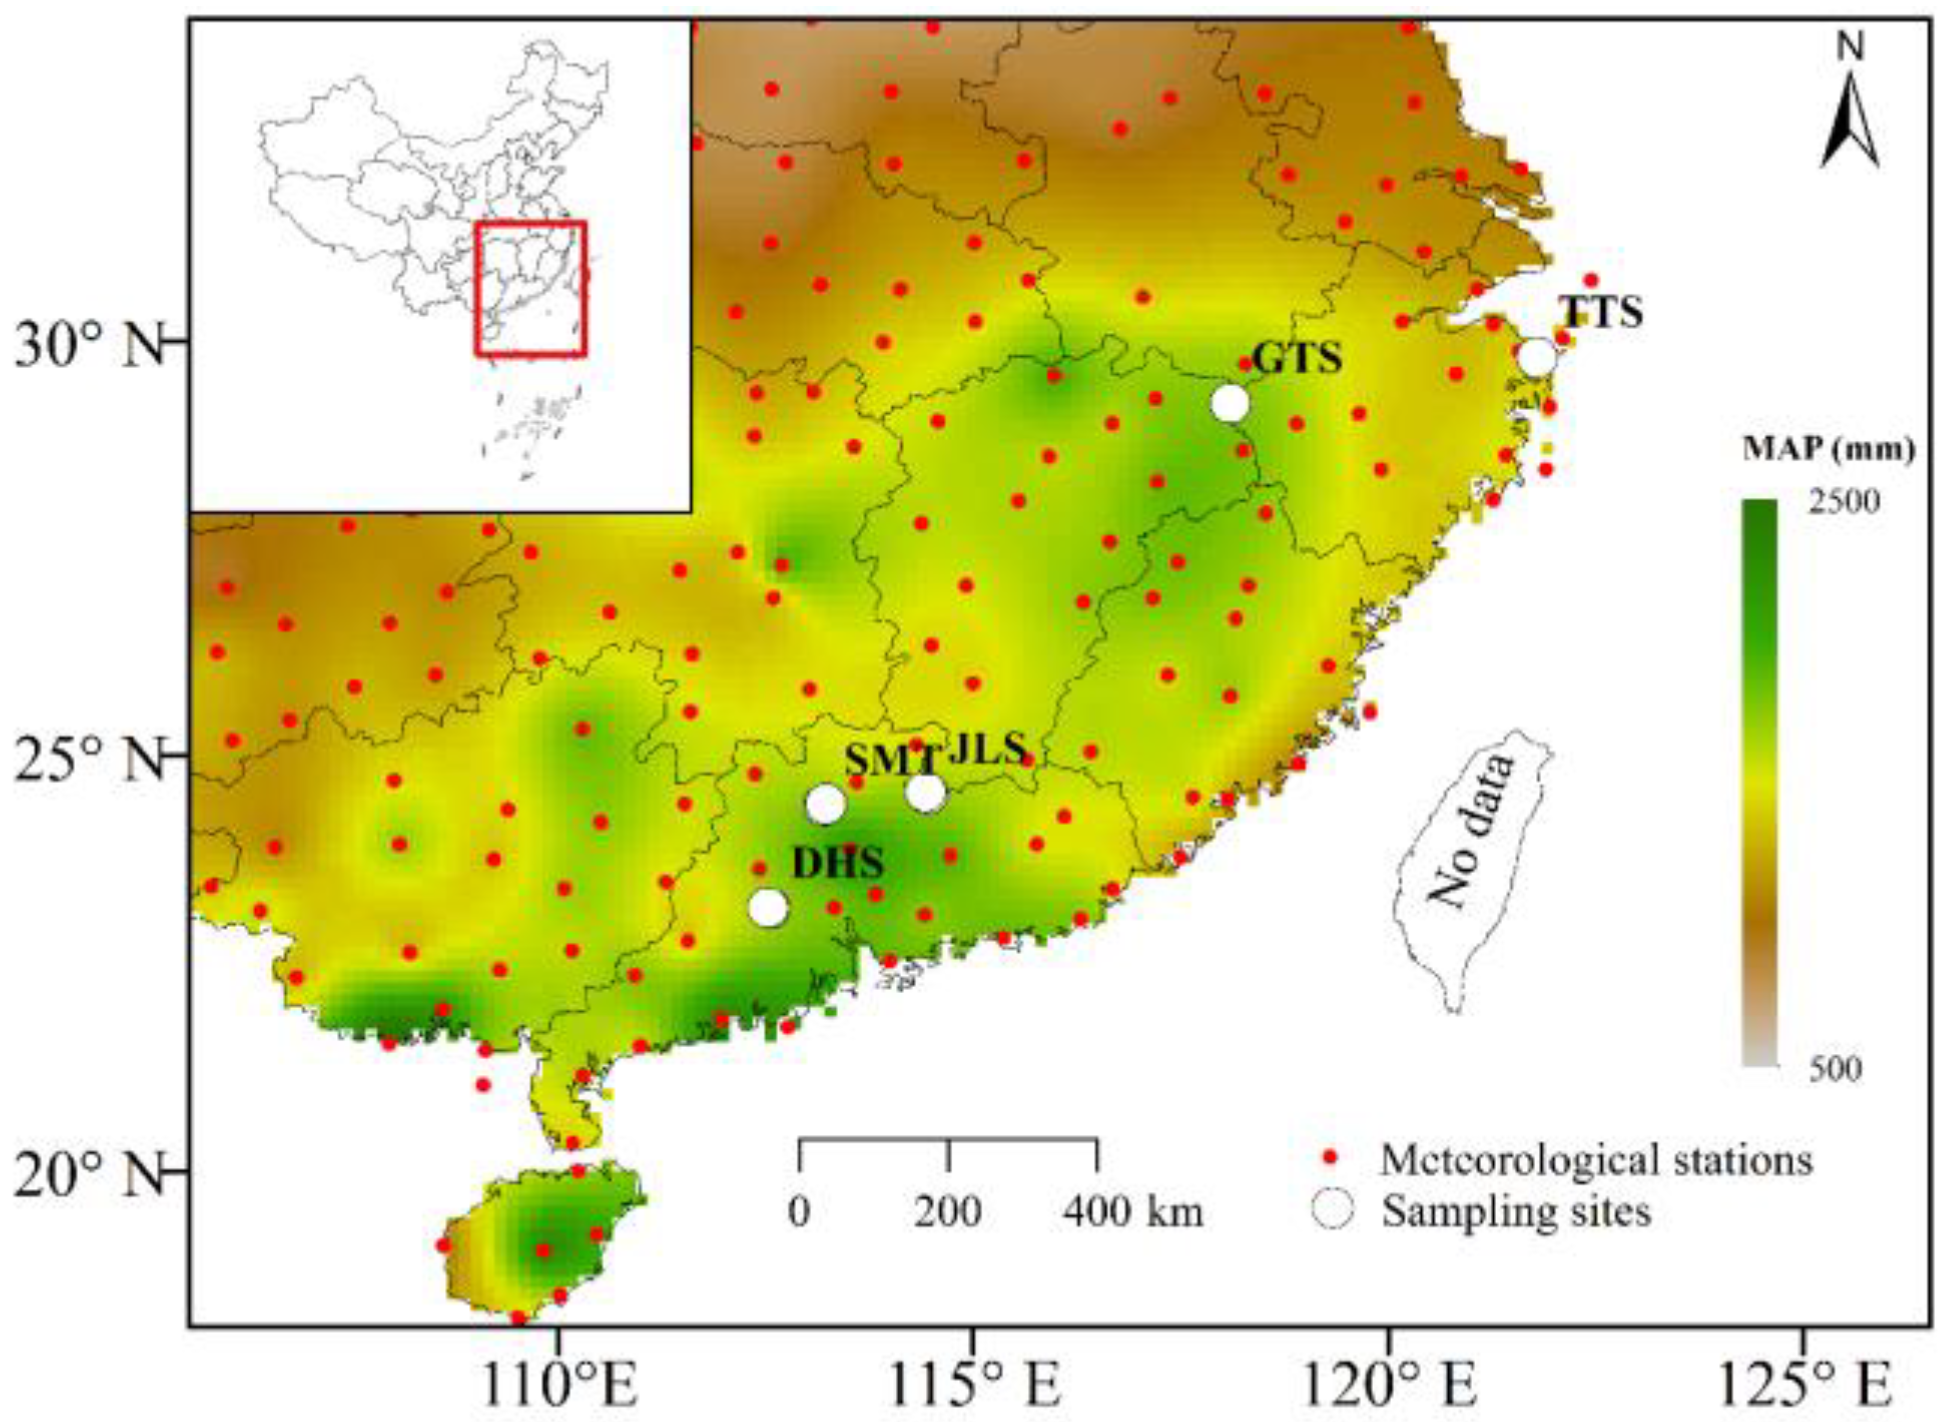
Figure 1. Location of study area. White dots indicate the five national nature reserves, including Dinghu Mountain (DHS), Shimentai (SMT), Jiulian Mountain (JLS), Gutian Mountain (GTS), and Tiantong Mountain (TTS); in each reserve, one or two natural S. superba stands were selected for analysis. MAP indicates mean annual precipitation.
Forests 14 01291 g001
Figure 2. The result of the principal component analysis of eight tree ring-width residual chronologies. Group1, Group2, and Group3 represent the high-elevation stands from the southern subtropical forest, the low-elevation stands from the southern subtropical forest, and stands from the northern subtropical forest, respectively. A and B indicate different stands from five national natural reserves, including Dinghu Mountain (DHS), Shimentai (SMT), and Jiulian Mountain (JLS) in the southern subtropical region, and Gutian Mountain (GTS) and Tiantong Mountain (TTS) in the northern subtropical region.
Forests 14 01291 g002
Figure 3. Bootstrapped correlation between the regional chronology and climate of the high-elevation stands in the southern margin (Group 1) from 1988 to 2013. The asterisk indicates a statistical significance of 0.05. The numbers from 1 to 12 indicate months of the current year, while the prefix “p” indicates months of the previous year. Tmin, Tmax, Tmean, SunH, and Pre represent minimum temperature, maximum temperature, mean temperature, Sunshine time, and total precipitation, respectively.
Forests 14 01291 g003
Figure 4. Bootstrapped correlation between the regional chronology and climate of the low-elevation stands in the southern margin (Group 2) from 1988 to 2013. The asterisk indicates a statistical significance of 0.05. The numbers from 1 to 12 indicate months of the current year, while the prefix “p” indicates months of the previous year. Tmin, Tmax, Tmean, SunH, and Pre represent minimum temperature, maximum temperature, mean temperature, Sunshine time, and total precipitation, respectively.
Forests 14 01291 g004
Figure 5. Bootstrapped correlation between the regional chronology and climate of the stands in the northern margin (Group 3) from 1988 to 2013. The asterisk indicates a statistical significance of 0.05. The numbers from 1 to 12 indicate months of the current year, while the prefix “p” indicates months of the previous year. Tmin, Tmax, Tmean, SunH, and Pre represent minimum temperature, maximum temperature, mean temperature, Sunshine time, and total precipitation, respectively.
Forests 14 01291 g005
Table 1. Statistics of the eight tree-ring width chronologies, with five from the southern distribution margin and three from the northern distribution margin. Parameters of chronology, including SSS, rbar, PC1%, SNR, and EPS, were listed. A and B indicate different stands, while AB indicates combined stands of A and B.
SiteDHSSMTJLSGTSTTS
Sampling StandABABABAAB
LocationSouthern MarginNorthern Margin
Latitude (°N)23.1623.1724.4024.5724.5429.2529.8029.80
Longitude (°E)112.55112.53113.20114.43114.46118.10121.79121.79
Elevation (m)77577225,2444905004718383
Statistics of tree-ring width series
Sample size (trees/core)19/3718/3636/6519/3716/3013/2416/3210/20
Start year with SSS > 0.8519771983198819751980196419641963
End year20132013201520162016201620162016
Mean length of series32.528.525.239.433.352.649.253.3
Correlation with master series0.4980.6110.5340.5730.5670.4400.4790.423
Mean sensitivity0.4630.3270.2460.2640.2660.2280.2240.273
Common period analysis of residual chronology over 1988–2013
Sample size (trees/core)16/2915/2913/1719/3716/2713/2416/3210/19
PC1%36.340.8323932.527.932.528.2
rbar0.2780.3510.2520.3360.2740.2080.2700.236
SNR11.14715.6895.73618.71710.2086.30111.8306.185
EPS0.9180.9400.8520.9490.9110.8630.9220.861
Disclaimer/Publisher’s Note: The statements, opinions and data contained in all publications are solely those of the individual author(s) and contributor(s) and not of MDPI and/or the editor(s). MDPI and/or the editor(s) disclaim responsibility for any injury to people or property resulting from any ideas, methods, instructions or products referred to in the content.