Abstract
Continuous and extensive monitoring of forest height is essential for estimating forest above-ground biomass and predicting the ability of forests to absorb CO2. In particular, forest height at the national scale is an important indicator reflecting the national forestry economic construction, environmental governance, and ecological balance. However, the lack of inventory data restricts large-scale monitoring of forest height to some extent. Conducting manual surveys of forest height for large-scale areas would be labor-intensive and time-consuming. The successful launch of the new generation of spaceborne light detection and ranging (LiDAR) (The Ice, Cloud, and Land Elevation Satellite-2/the Advanced Topographic Laser Altimeter System, ICESat-2/ATLAS) has brought new opportunities for national-scale forestry resource surveys. This paper explores a method to survey national forest canopy height from the new generation of ICESat-2/ATLAS data. In view of the sparse sampling and little overlap between repeated spaceborne LiDAR data, a strategy for assessing the overall change of canopy height for large scales is provided. Some spatially continuous ancillary data were used to assist ICESat-2/ATLAS data to generate a wall-to-wall (spatially continuous) forest canopy height map in China by using the machine learning approach and then quantifying the analysis of forest canopy height in various provinces. The results show that there is a good correlation between the model forest height and the verification data, with a root mean squared error (RMSE) of 3.30 m and a coefficient of determination (R2) of 0.87. This indicates that the method for retrieving national forest canopy height is reliable. There are some limitations in areas with lower vegetation coverage or complex topography which need additional filtering or terrain correction to achieve higher accuracy in measuring forest canopy height. Our analysis suggests that ICESat-2/ATLAS data can achieve the retrieval of national forest height at an overall level, and it would be feasible to use ICESAT-2/ATLAS products to estimate forest canopy height change for large-scale areas.
1. Introduction
The forest ecosystem has the largest distribution area and richest biodiversity on land, and it plays an important role in climate regulation as well as water and soil conservation [1]. Forest canopy height is an important indicator of the forest’s ecological structure, which is used to evaluate forest productivity and estimate forest above-ground biomass and biodiversity [2,3]. As forest canopy height is constantly affected by natural disturbances and human activities, consistent large-scale monitoring of forest height is essential [4]. Therefore, the national forest canopy height survey plays a vital role in the national forestry economic construction and uncovered environmental science issues. Today, with the increasing development of remote sensing technologies, the kind of data required to conduct a national-scale forest height survey has become a popular research topic.
Traditionally, field inventory is the most common way to achieve a national forest canopy heights survey, which samples forest heights on a national scale by setting forestry subcompartments. It can achieve high accuracy in forest height. However, this approach is labor-extensive and time-consuming. Advances in remote sensing enable the potential to monitor forest height across landscapes. Optical remote sensing, synthetic aperture radar (SAR), and light detection and ranging (LiDAR) data have been widely used in national forestry surveying [5]. Particularly, LiDAR can directly obtain the vertical structure of the forest, which has an incomparable advantage in forest canopy height surveying [6].
A number of studies have estimated forest canopy height by multitemporal airborne LiDAR data, due to its high accuracy [7,8]. These studies all achieved high accuracy in the retrieval of forest canopy heights. However, regardless of any methods, most of the studies focus on assessing the forest height at the single-tree level [9] or local-area level [10], which is limited by the relatively high cost and small spatial coverage. To infer large-scale forest structure by scaled measurement data is difficult and may lead to errors due to the spatial variability of forest structure. For forest canopy heights surveying at a national scale, although airborne LiDAR technology has considerable observation accuracy, it is not suitable to use airborne LiDAR technology to achieve this huge goal.
The spaceborne LiDAR, which was designed for measuring the Earth’s surface characteristics globally, provides an opportunity to assess forest height on a national scale [11,12,13]. The Ice, Cloud, and Land Elevation Satellite/Geoscience Laser Altimeter System (ICESat/GLAS) was launched in 2003, and it was in orbit from 2003 to 2009. Sun attempted to investigate the forest canopy height using ICESat/GLAS data at the footprint level in Hebei province, China [14]. Yang et al. used the forest height parameters extracted from GLAS data, combined with the Advanced Spaceborne Thermal Emission and Reflection Radiometer Global Digital Elevation Model (ASTER GDEM) data, vegetation classification data, and Moderate-resolution Imaging Spectroradiometer (MODIS) data to establish a national-scale tree height inversion model through neural network training, and applied it to generate a continuous distribution map of the average forest height in China [15]. However, due to the sparse sampling of ICESat data, it has limitations in forest canopy height retrieval. In addition, ICESat/GLAS stopped working in 2009, making it impossible to use ICESat/GLAS data in subsequent years. The successful launch of ICESat-2 complements the spaceborne LiDAR data source. ICESat-2 has high observation accuracy and spatial sampling rate. Therefore, ICESat-2/ATLAS has become the latest control data for national-scale forest height surveys.
Li et al. verified the ICESat-2 terrain and forest canopy height product ATL08 at different window scales using airborne LiDAR data. This study showed that, when the window scale was 250 m, the ATL08 forest canopy height had the highest accuracy, with an RMSE of 1.95 m and a correlation of 0.82 [2]. On this basis, the forest heights with a resolution of 30 m in Northeast China were inverted by using ATL08 forest canopy height product combined with Sentinel data [2]. Liu et al. conducted a map of forest canopy height on a national scale by fusing ICESat-2 ATLAS, the Global Ecosystem Dynamics Investigation (GEDI), and Sentinel-2 images. The map of forest canopy height has a resolution of 30 m, and it achieved an RMSE of 4.93 m [16]. These two studies revealed that ICESat-2/ATLAS data has the ability to produce a continuous distribution map of forest canopy heights on a national scale with some auxiliary data. However, the purpose of the national forestry resources survey (including forest canopy height) is to understand the general situation of forestry resources (including forest canopy height) in each province or ecological area. Although the above two studies can obtain high-resolution and high-precision forest height maps on a national scale, they used large data sets and the algorithm operation was very complicated. This undoubtedly increases the difficulty of forestry surveys in algorithm and data versatility.
To achieve a rapid and easy-to-use way of forest height surveying on a national scale, we combined the ICESat-2/ATLAS data and a few parameters generated from auxiliary data to survey forest canopy heights with a resolution of 1 km on a national scale. The used parameters are easy to obtain from auxiliary data. To assess the forest canopy heights, we also classified forest canopy heights into a province scale. The main objective of this research is to assess the capability of spaceborne LiDAR in surveying forest canopy heights on a national scale.
2. Materials and Methods
2.1. Data
2.1.1. ICESat-2/ATLAS Data
ICESat-2/ATLAS is a photon-counting LiDAR system launched in September 2018, with a footprint diameter of about 17 m. ICESat-2 provides 21 products describing the surface characteristics. The data can be downloaded from the National Ice and Snow Data Center (https://nsidc.org/data/ICESat-2/ (accessed on 10 June 2021)). We used the ICESAT-2 ATL08 land and vegetation height product covering the whole of China acquired in June–September 2019. The ATL08 forest canopy height estimate was generated from geolocated photon cloud data based on the Differential, Regressive, and Gaussian Adaptive Nearest Neighbor (DRAGANN) method [17], which is one of 21 of NASA’s official products. The ATL08 forest canopy height estimate not only contains the vegetation height, but also provides the relative height percentiles for investigating the forest vertical structure [17].
2.1.2. Climate Data
Climate data have been widely used to reproduce the known patterns of vegetation distribution [12]. We used the WorldClim dataset (version 2.1) with a spatial resolution of 30 s. This dataset was calculated from the temperature and precipitation values during the years 1970–2000. In order to capture the characteristics of climate change, we selected the following variables: annual mean temperature, annual mean precipitation, temperature seasonality (standard deviation × 100), precipitation seasonality (coefficient of variation), and extreme climatic characteristics (max temperature of warmest month, min temperature of coldest month, precipitation of wettest month and driest month) (Table 1). Although there is an interval between the acquisition time of WorldClim and ICESat data, the WorldClim data, which are the average for 30 years, can reflect the climate trends over a long period of time. Actually, the impact of climate on forest structure is the result of long-term accumulation.

Table 1.
Ancillary variables used for training.
2.1.3. MODIS VCF
The Vegetation Continuous Fields (VCF) data (MOD44B) are the level 3 product with a spatial resolution of 250 m. It mainly includes layers such as the percentage of tree cover (Percent_Tree_Cover), the non-vegetated percentage (Percent_NonTree_Vegetation), cloud cover, and quality indicators. We obtained the VCF products in 2019, and replaced the pixels with cloud cover and low-quality index by the values from adjacent years.
2.1.4. TanDEM-X DEM/SRTM DEM
Elevation, slope, and other terrestrial factors are important biogeographical parameters which partially control the vegetation distribution and growth. We extracted the elevations and slopes from the 90 m resolution Digital Elevation Model (DEM) data from TerraSAR-X add-on for Digital Elevation Measurement (TanDEM-X), which was collected in 2015, as the auxiliary data of the ICESat-2/ATLAS training model. But this version of the product has null or invalid data in some missing areas, so we filled those areas with the DEM data from Shuttle Radar Topography Mission (SRTM).
2.2. Methods
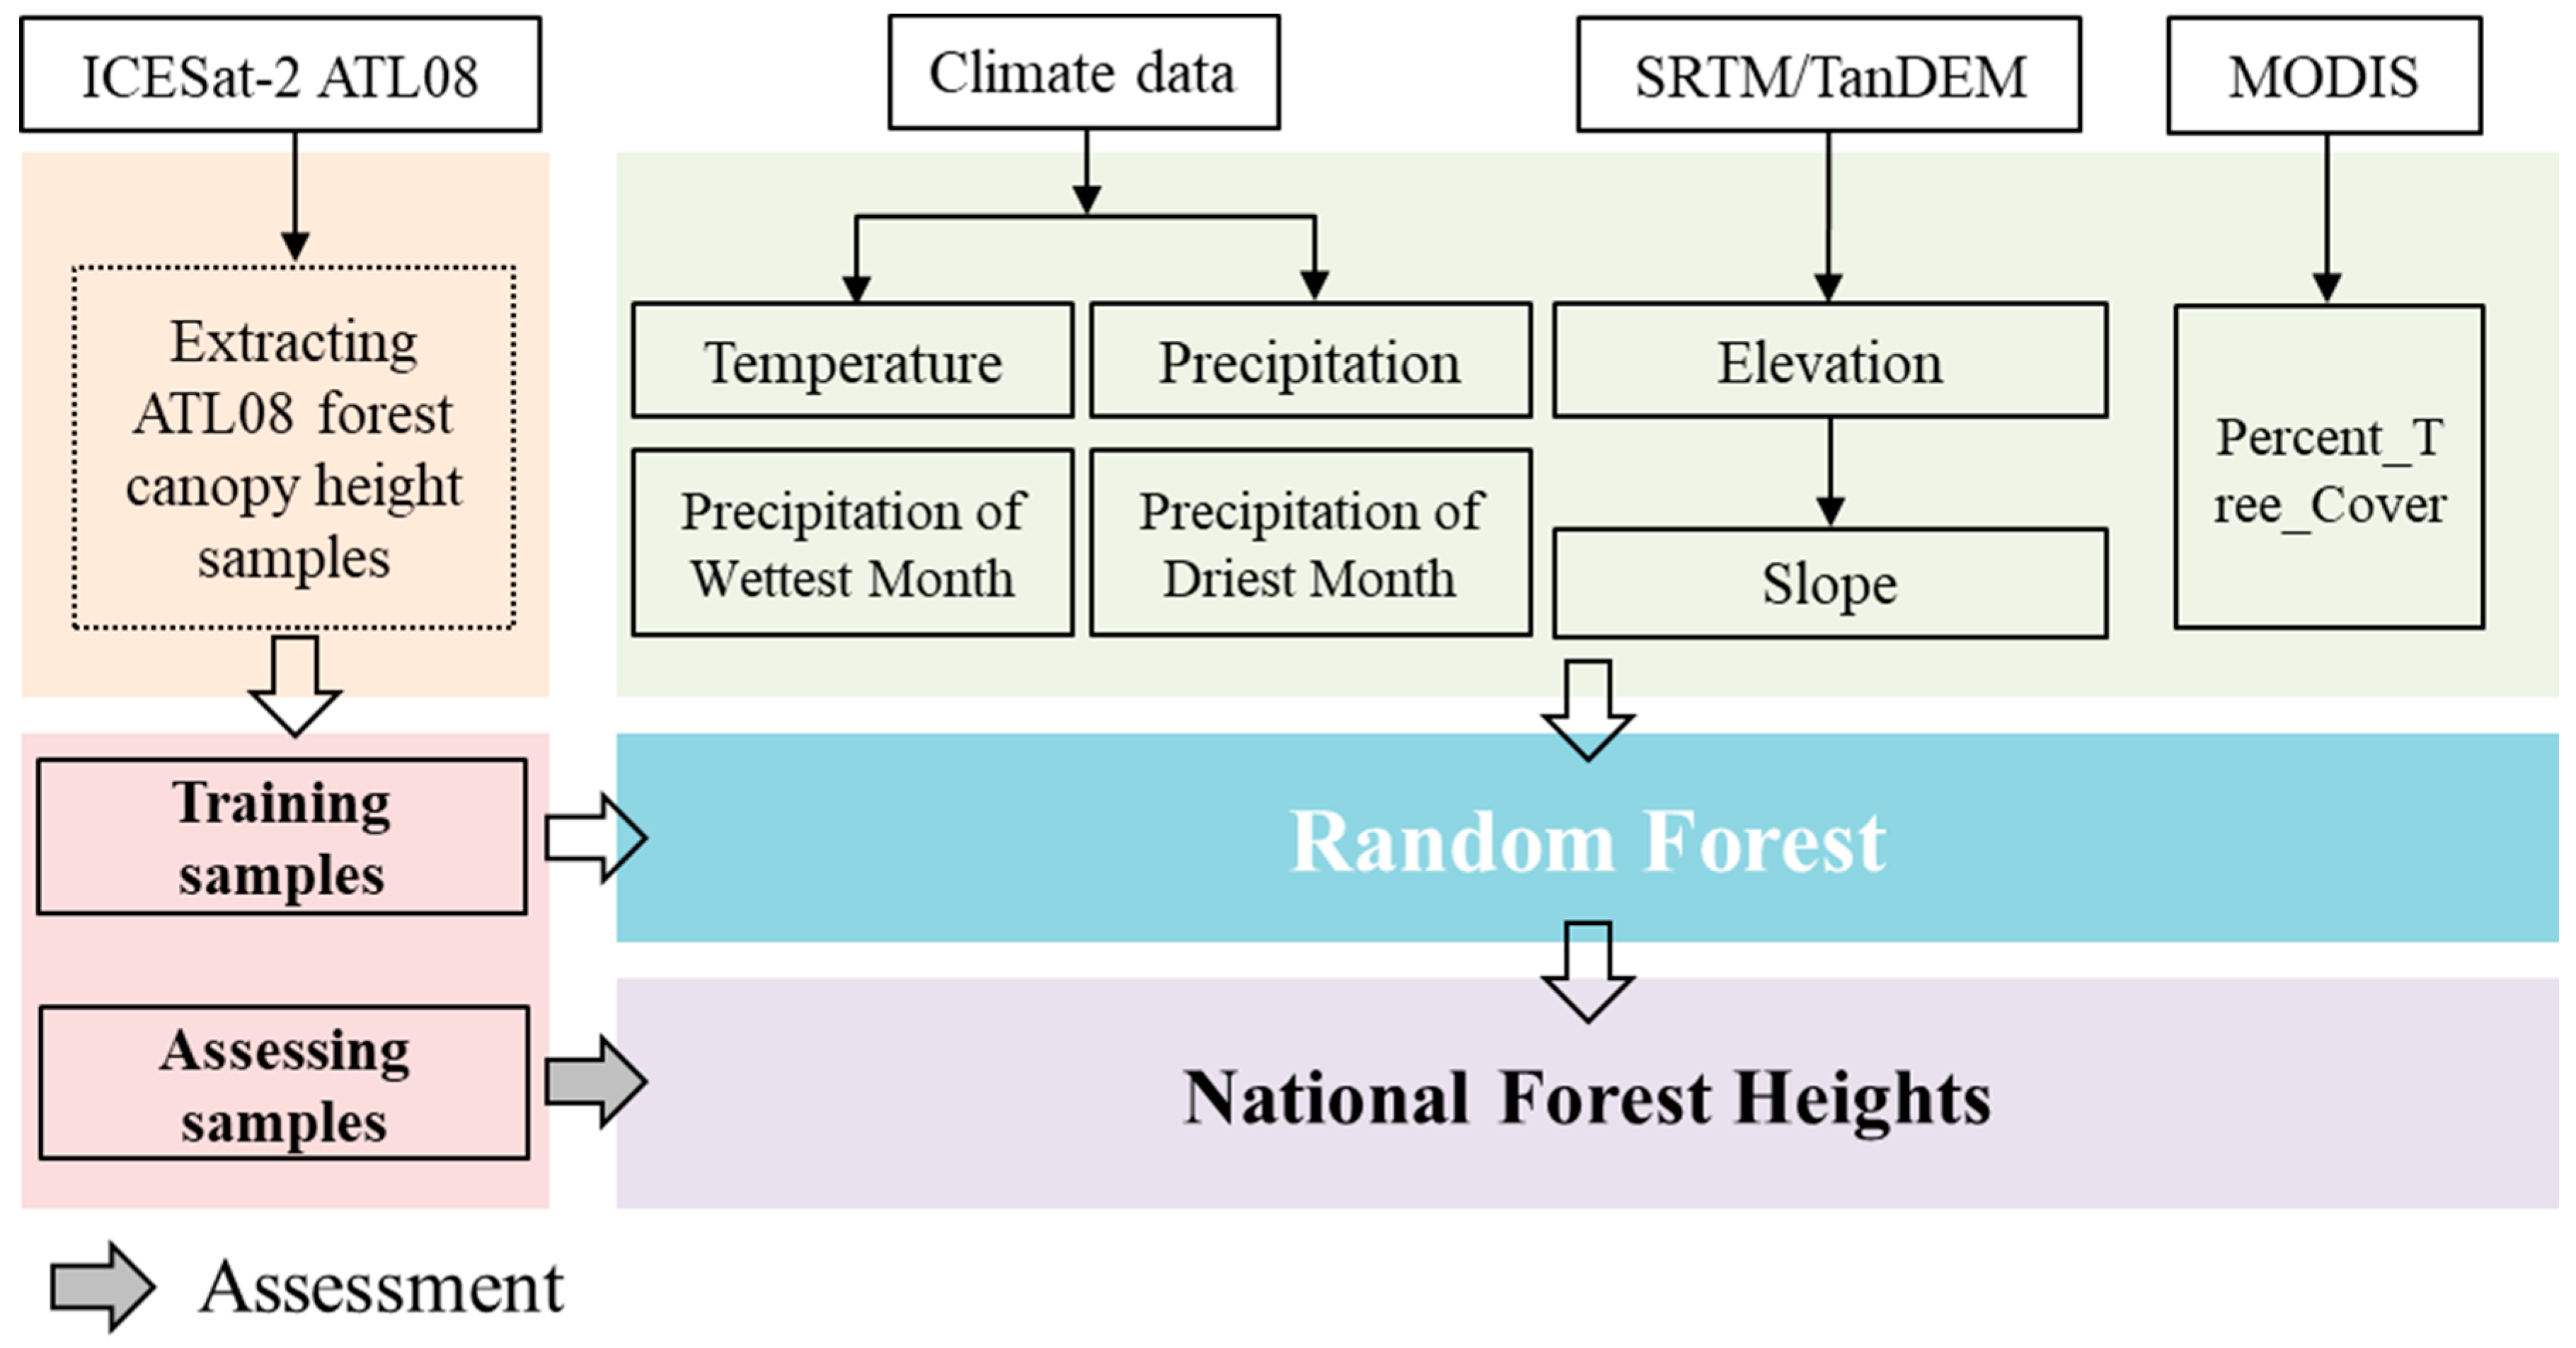
The workflow of the method adopted in this paper is shown in Figure 1. First, we extracted high-accuracy ICESat-2 ATL08 forest canopy height samples for the model construction of national forest canopy height surveying and the assessment of the retrieved wall-to-wall forest canopy heights, respectively. Second, we calculated the canopy height relative parameters from the given auxiliary data, including climate data, SRTM/TanDEM data, and MODIS data. Finally, we assessed the retrieved national forest canopy heights.
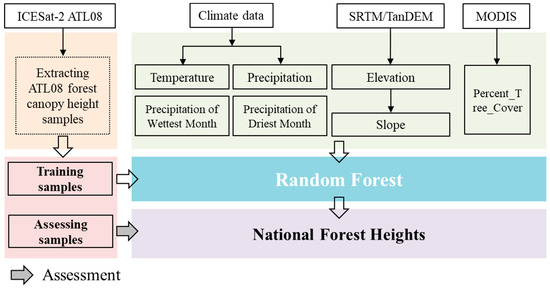
Figure 1.
Workflow of the proposed method.
2.2.1. Extracting the Forest Height from ICESat-2/ATLAS
For ICESAT-2, the 98th percentile of the maximum canopy height is recommended owing to the signal-to-noise uncertainty at the top of the canopy [17]. The signals of the photon-counting LiDAR have strong background noise, so they should be filtered by the following steps to obtain high-quality signal photons:
(1) MODIS VCF product was used to filter ICESAT-2 ATL08 to select the points with a vegetation coverage between 5% and 90% because in too dense vegetation areas (canopy closure > 90%) only a small amount of ground photons can be obtained, and in too sparse vegetation areas (canopy closure < 5%), canopy signal photons are difficult to distinguish from the solar background noise, resulting in many errors in the extracted vegetation height [18].
(2) The ATL08 data were filtered by the night_flag indicator, cloud indicator (cloud_flag_asr), and vegetation indicator (canopy_flag), as the background noise during night acquisition is significantly smaller than that during day acquisition.
(3) The ICESat-2 ATL08 forest canopy height samples in the areas with large slopes (>20°) were removed because the ICESAT-2 data are still affected by topographical fluctuations, even though the footprint diameter is small.
2.2.2. Mapping Wall-to-Wall Forest Height by Random Forest
Because ICESat-2 data is not continuous in space, it is necessary to generate national-scale forest heights under the framework of machine learning with the help of auxiliary data. Previous studies [19] have shown that the canopy height extracted by LiDAR is highly correlated with ancillary variables that control forest growth such as forest type, forest coverage, elevation, and climate. Therefore, we selected 11 parameters as ancillary variables using the method proposed by Simard [12] (as listed in Table 1). Then, we used the random forest algorithm to model the relationships between the ICESat-2/ATLAS-derived canopy heights and the ancillary variables of the corresponding year. The relationship was used to extrapolate LiDAR data to the whole country to generate the wall-to-wall forest canopy height map of China in 2019. All auxiliary data were resampled to 1 km using the majority rule (for categorical variables) or bilinear interpolation (for continuous variables) [12]. Many existing studies have shown the availability of ICESat-2 forest canopy height [20]. To validate the wall-to-wall forest canopy height map, we do not have field survey data during this period, so we randomly selected 80% of the data from ICESat-2 as the training data, and the remaining 20% as the validation data.
2.2.3. Assessment
We randomly selected 80% of the data from ICESat-2 as the training data and the remaining 20% as the validation data to assess the predicted wall-to-wall national forest canopy heights. The residuals between ICESat-2/ATL08 forest canopy heights and the predicted wall-to-wall national forest canopy heights were generated, which were used to show the performance of the predicted wall-to-wall national forest canopy heights. In addition, we also compared the mean forest canopy height and the forest height with a resolution of 30 m derived by Liu [20] in each province.
The assessment indicators, RMSE and R2, were introduced to assess the accuracy of the national forest canopy height results, as shown in Equations (1) and (2):
where N is the number of the 20% samples for assessment. and are the ATL08 forest canopy height and the predicted forest canopy height of sample i, respectively. is the mean forest canopy height of all ATL08 samples for assessment.
3. Results and Discussion
3.1. National Forest Height Map and Accuracy Assessment
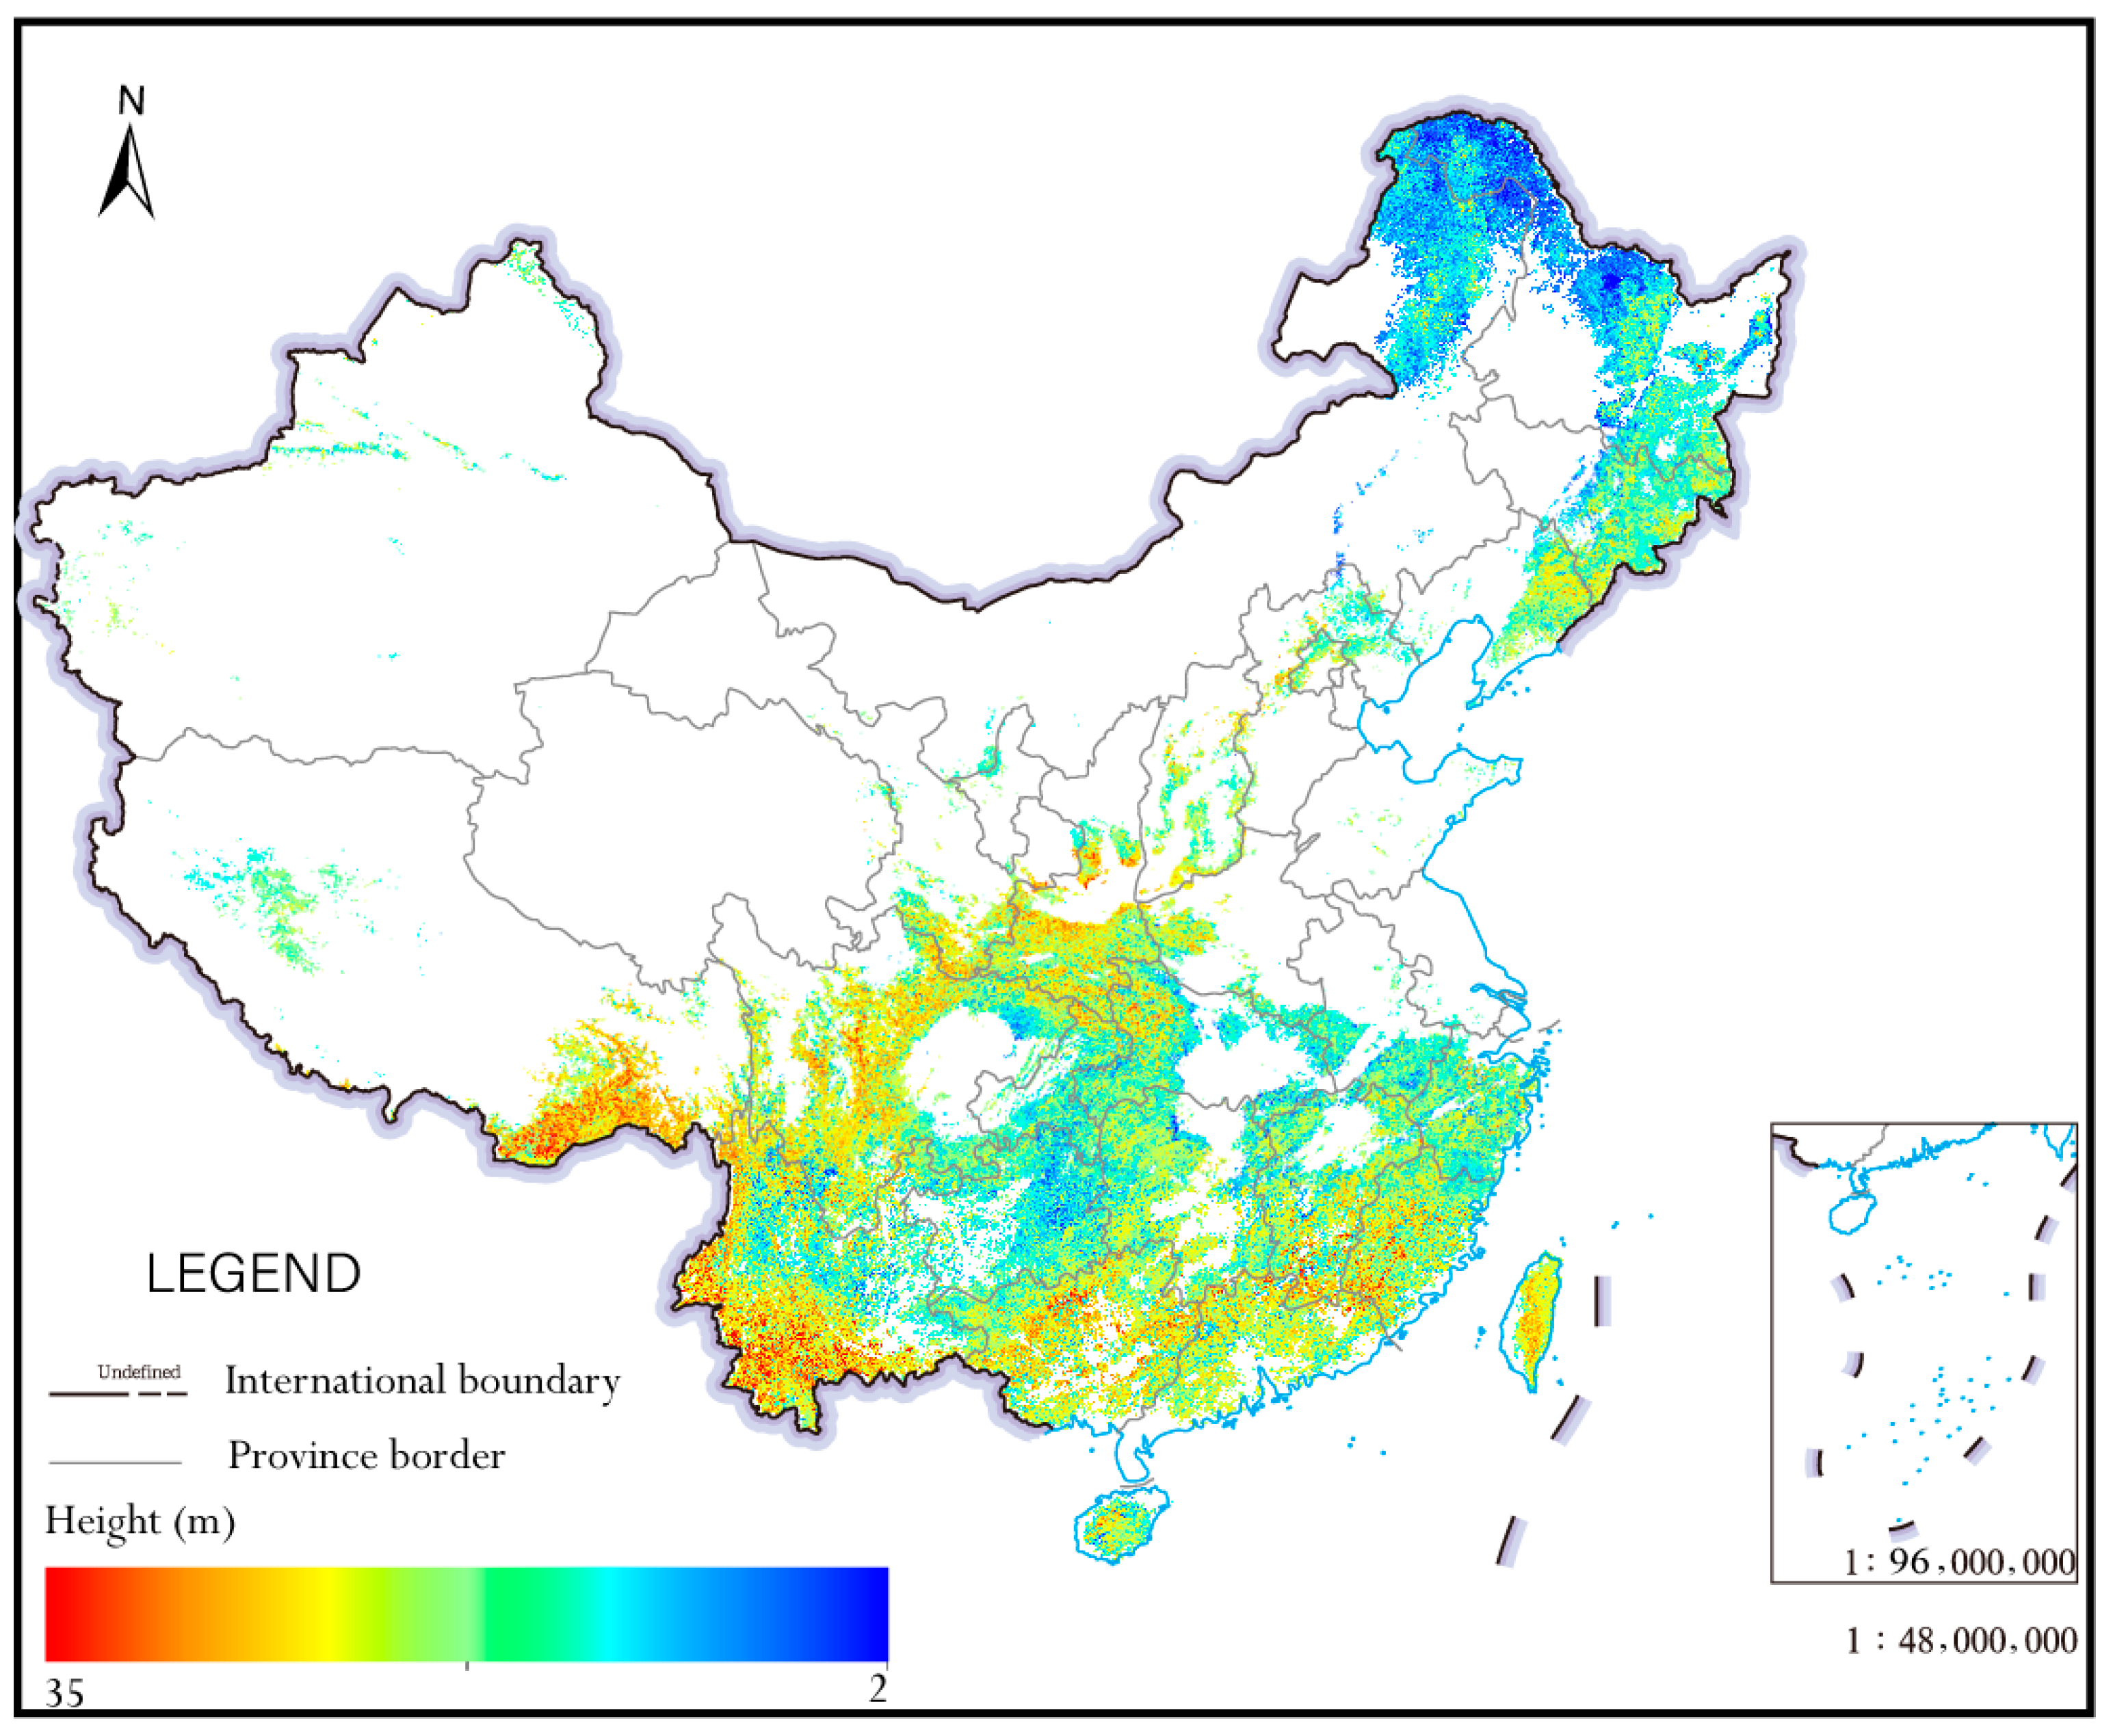
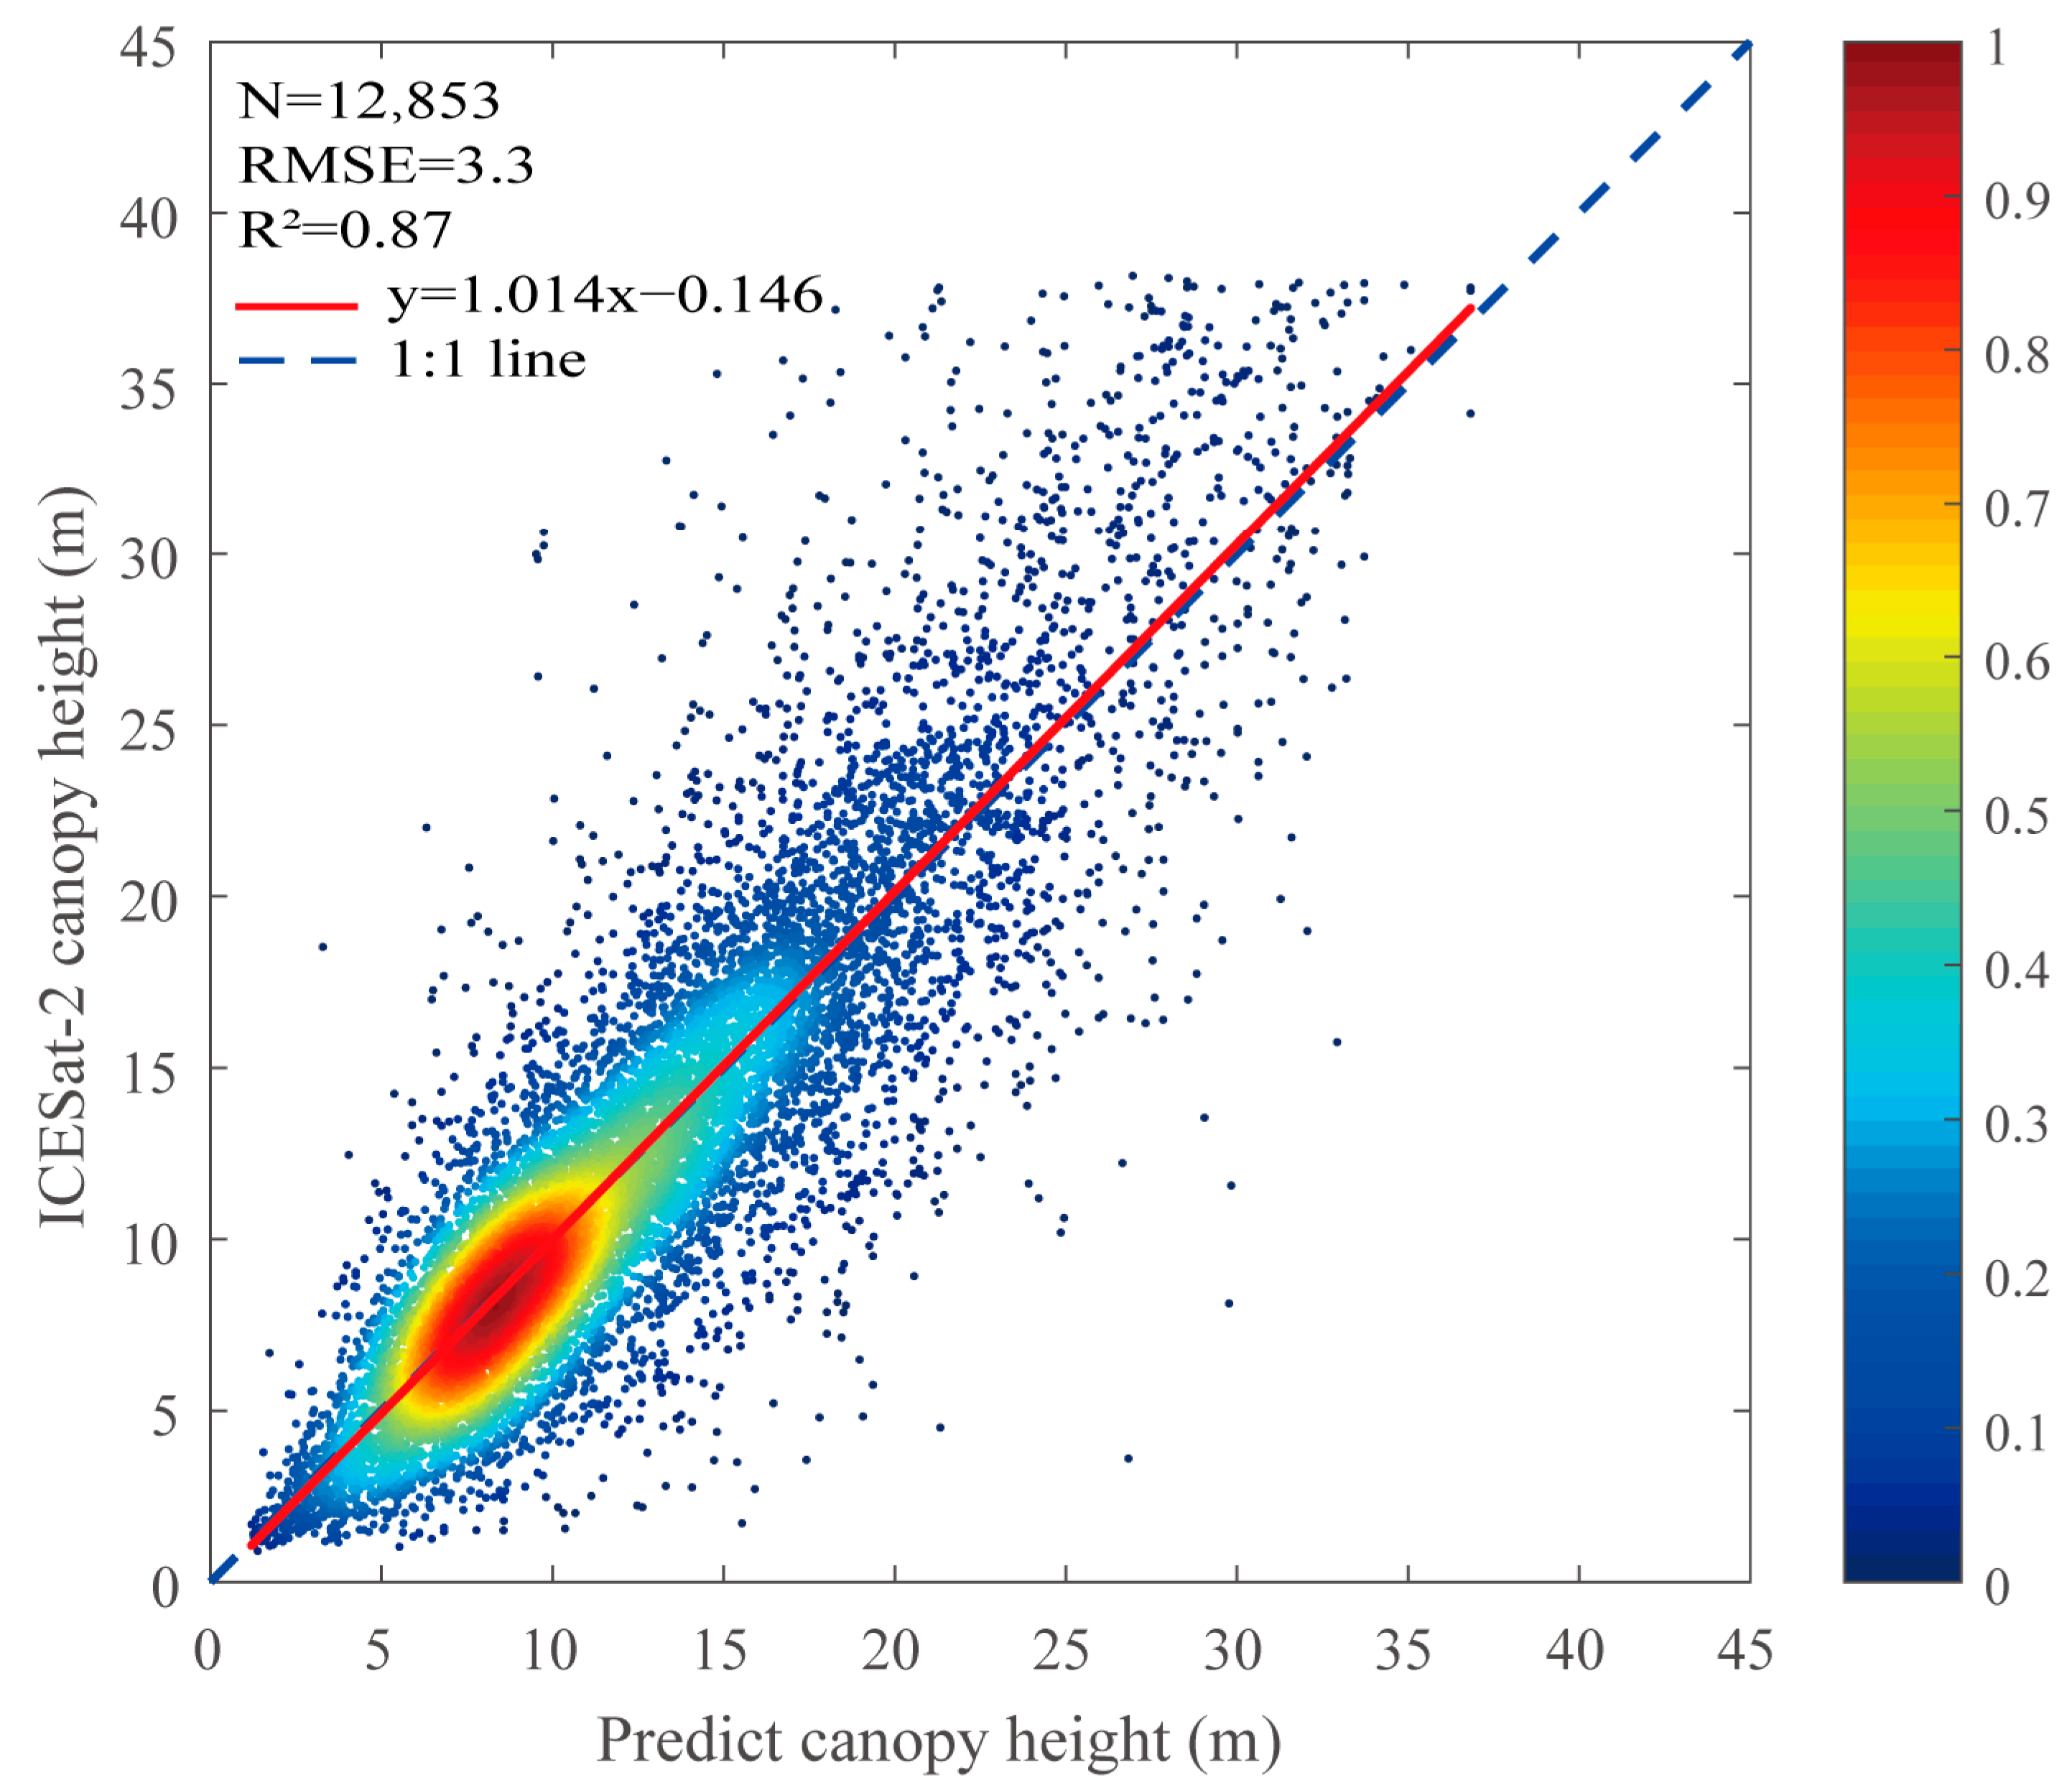
Figure 2 shows the forest height map in China in 2019, with a spatial resolution of 1 km. Non-forest areas of the map have been masked with the MCD12Q1 land cover product of the corresponding year. The scatterplot is shown in Figure 3. The model forest heights in 2019 show a good linear correlation with verification data, with the root mean square error, and the coefficient of determination of 3.30 m and 0.87, respectively. The range of forest canopy height in 2019 was 1.55–34.58 m, and the average height was 16.85 m. In addition, it can be found that the regression equation of scatterplots is y = 1.014x − 0.146, with the intercept of −0.146 that is close to 0, and the slope of 1.014 that is close to 1. Therefore, we believe that the systematic bias in our results would be slight. The areas with higher forest heights are distributed in Tibet, Yunnan, Sichuan, Taiwan, etc., while the area with lower forest heights is in Inner Mongolia, which is consistent with some existing works. The RMSE and R2 illustrate that the national forest height map generated from the used materials and the proposed method is acceptable.
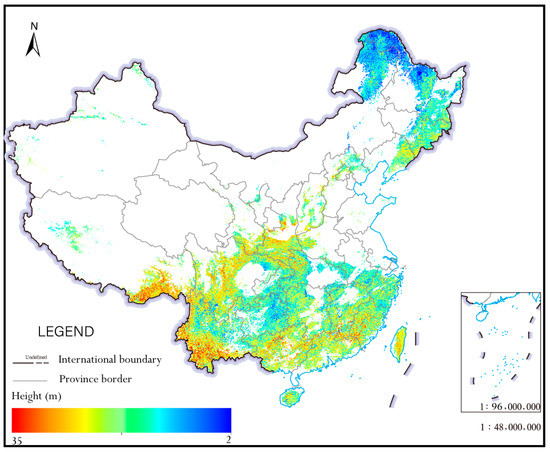
Figure 2.
National forest canopy heights survey from the ICESat-2/ATLAS data in 2019.
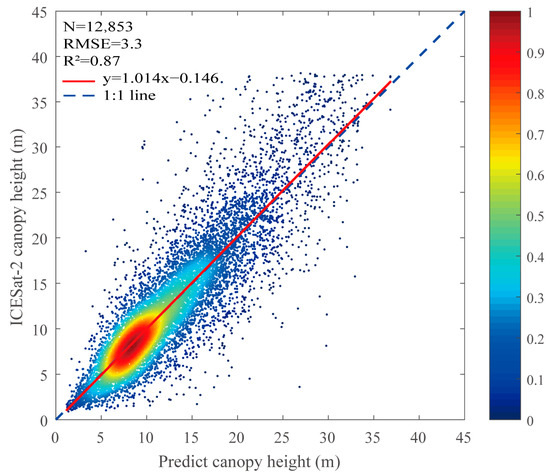
Figure 3.
Scatterplot of the ICESat-2-observed canopy height against the model retrieved canopy height.
3.2. Forest Heights on a Province Scale
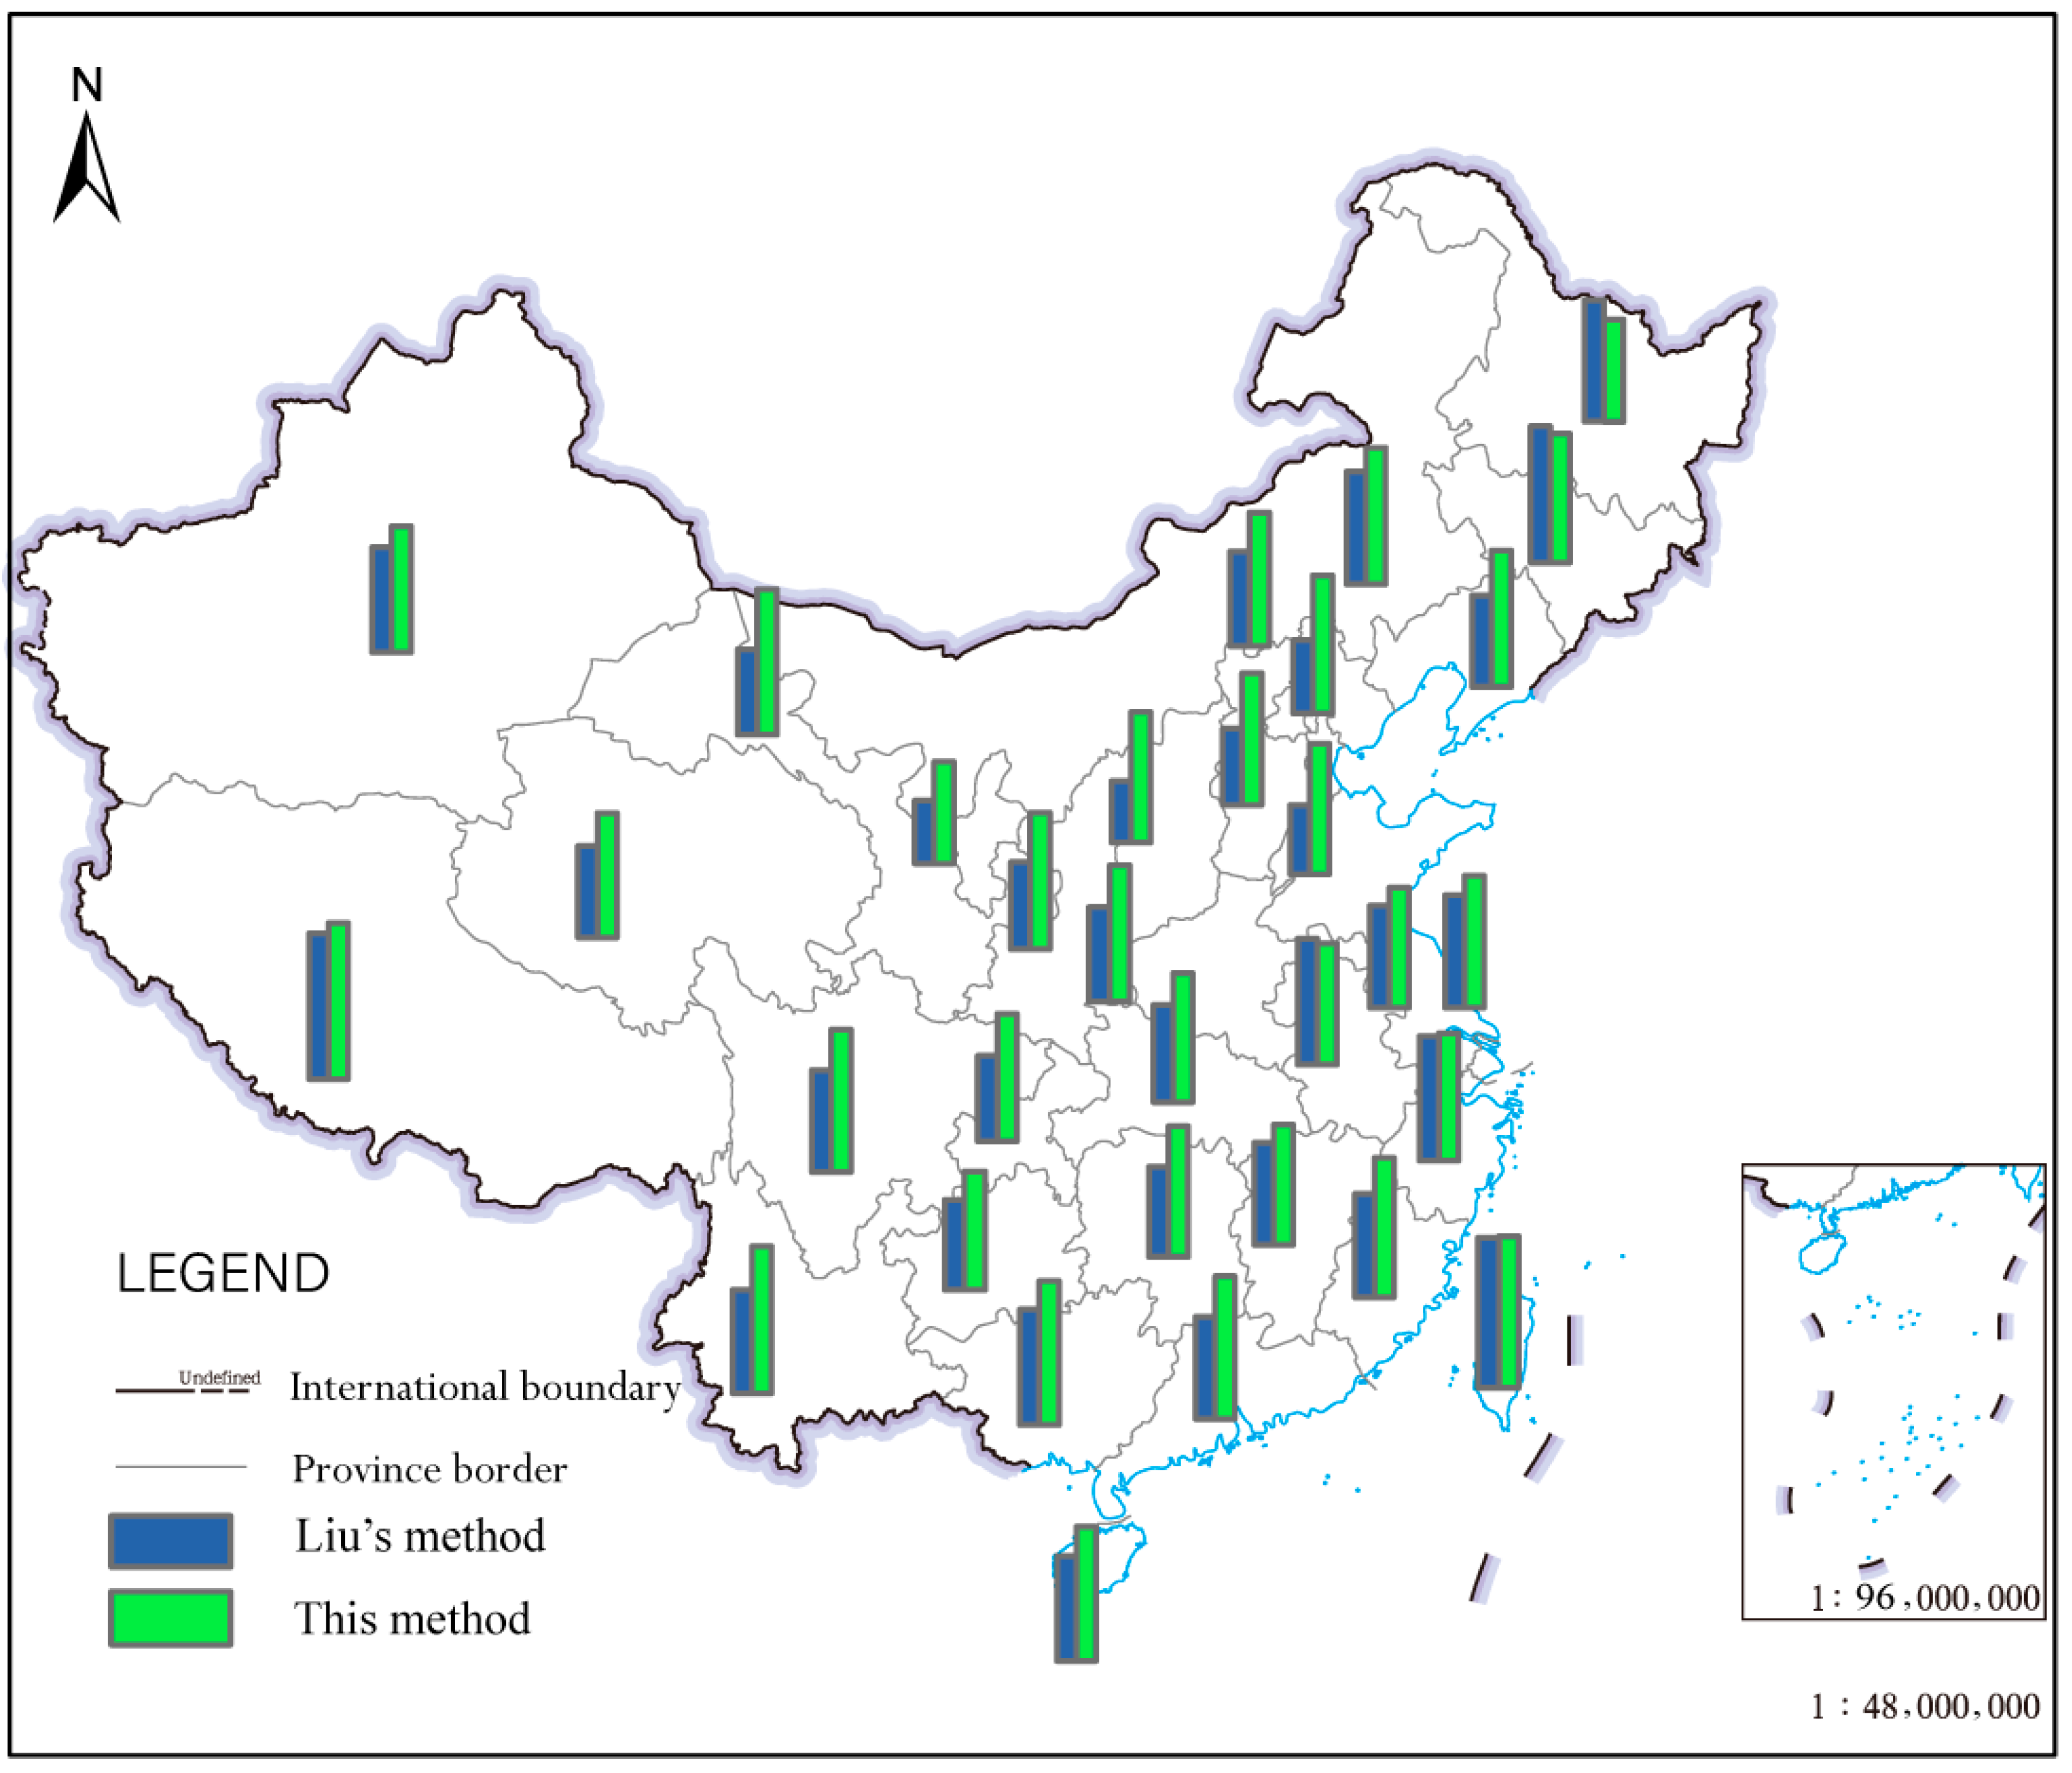
To illustrate the reliability of the national forest height survey map, we compared the average forest height in each province with the existing method [16], as shown in Figure 4. The RMSE of average forest height results between our approach and the reference is 4.8 m, which is acceptable. The average forest height results of our approach and the reference exhibit similar trends. The average forest height in most provinces is higher than that of the reference, which can be contributed to the ATL08 forest height selection. We would select some ATL08 forest heights with high errors for surveying national forest heights. Although the forest heights obtained by the reference are more realistic than that of our approach, the reference is complicated to operate that requires a large amount of data and a complex processing method to support its high accuracy. For the national forest height survey, we can conduct the national-scale forest height survey task economically and quickly with fewer data input and simpler methods than that of the reference. To achieve a similar accuracy of the forest height generated by the reference, we should pay attention to the following two points in future research: (1) screening reliable ATL08 forest heights and (2) generating accurate auxiliary data.
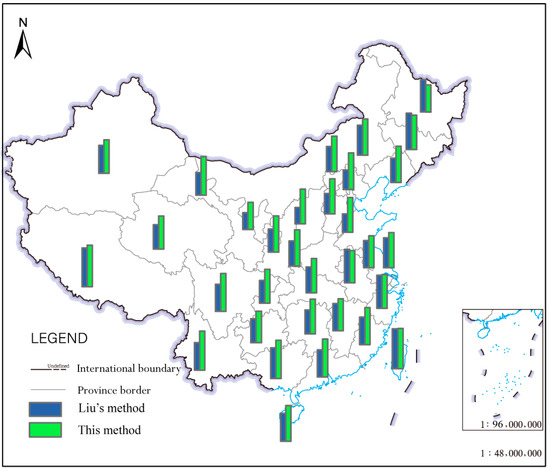
Figure 4.
Comparison of the mean forest canopy height between this method and Liu’s method in each province.
3.3. Limitations
It can be seen from the results shown in Figure 4 and Table 2 that the mean forest heights in some provinces, such as Heilongjiang, Liaoning, Jilin, Tibet, Xinjiang, Taiwan, Zhejiang, Anhui, Henan, Jiangxi, Inner Mongolia, and Jiangsu etc., are consist with Liu’s results. However, there is a significant ‘positive’ bias in the mean forest heights of other provinces such as Hunan, Sichuan, Yunnan, Guangxi, Chongqing, Gansu, Shanxi, Shaanxi, Qinghai, and Ningxia etc. As we know, Gansu, Shanxi, Shaanxi, Qinghai, and Ningxia provinces have lower vegetation cover, resulting in fewer ATL08 samples in these provinces. Meanwhile, the steep and complex topographies of provinces such as Hunan, Sichuan, Yunnan, Guangxi, and Chongqing provinces resulted in filtering out many ATL08 samples in these provinces. Therefore, it can be concluded that ATL08 samples are very sparse in provinces with sparse vegetation and complex terrain after the filter step, which leads to an obvious overestimation in these provinces compared with Liu’s method. In future research, the number of ATL08 samples is increasing over time, thus ensuring the accuracy of ATL08 samples. Meanwhile, our training process could be more detailed, such as dividing China into multiple intervals for training.

Table 2.
Mean canopy height in each province.
The vertical accuracy and the consistency of forest height measurements are crucial for surveying national forest heights and their applications, and any small error may cause huge deviations in the estimation results. Many methods have been developed to reduce the errors. Although the forest heights estimated by the proposed method on the national scale were generally robust, there are several factors leading to the uncertainty in the results. First, the LiDAR data are discrete sampling points. In order to facilitate the evaluation, the forest height values within the footprints are interpolated by the random forest method to generate a continuous forest height map with a spatial resolution of 1 km × 1 km. In this process, some mapping errors may be introduced. Second, there are some errors in the auxiliary data. The introduction of auxiliary data with errors will reduce the accuracy of national forest height. Furthermore, due to the characteristics of ICESat-2 photon counting, the ground signal points obtained in densely vegetated areas are sparse, and the top of the canopy may not be captured in sparsely vegetated areas, resulting in errors in the derived canopy height. However, it is difficult to quantify the errors directly because we do not have field survey data during this period.
4. Conclusions
The new generation of spaceborne LiDAR data (ICESat-2 ATLAS) can obtain the vertical structure of the forest globally, which is crucial for continuous and extensive monitoring of forest height on a national scale. For the national forest canopy height survey, in this study we used the ICESat-2 ATLAS data and investigated their potential for national forest canopy height surveying. For this, the ICESat-2/ATLAS data were used to generate the wall-to-wall continuous forest height map of China in 2019. Moreover, we analyzed the forest canopy height on a provincial scale. The results show that there is a good correlation between the model forest height and the verification data, with an RMSE of 3.30 m and a coefficient of determination (R2) of 0.87. This means that the method of national forest canopy height retrieval is acceptable. In addition, the national forest canopy heights in 2019 ranged from 1.35 m to 34.58 m, with an average height of 16.85 m. The results indicate that the spaceborne LiDAR can achieve good performance in the national forest canopy heights survey. It can be inferred that the results would reveal the changing trend of large-scale forest heights, thus evaluating the effects of China’s ecological projects. Overall, the method presented here provides a possibility to survey forest canopy heights on a national scale. We believe that, with the launch of GEDI and other spaceborne LiDAR satellites, forest monitoring results will be accurate.
However, the analyses also indicate some limitations in areas with lower vegetation coverage or complex topography which need additional filtering or terrain correction to achieve higher-accuracy forest canopy height. In addition, forest canopy height varies with regions and forest types, so ecozones and forest types should be taken into consideration for more detailed change monitoring in the future. Moreover, other spaceborne LiDAR data, such as GEDI, can be integrated into the method, and the fusion of multisource data will be conducive to more accurate monitoring of forest canopy height.
Author Contributions
Conceptualization, H.F.; methodology, H.F. and S.G.; validation, S.G.; investigation, S.G.; writing—review and editing, S.G.; supervision, J.Z. and H.F.; funding acquisition, J.Z. and H.F. All authors have read and agreed to the published version of the manuscript.
Funding
This research was funded in part by the National Natural Science Foundation of China, under Grant 62207032 and Grant 41820104005; in part by the Changsha Municipal Natural Science Foundation Grant No. kq2202111; and in part by the Research Foundation of the Department of Natural Resources of Hunan Province Grant No. 20230101DZ.
Data Availability Statement
The data presented in this study are available on request from the corresponding author.
Conflicts of Interest
The authors declare no conflict of interest.
References
- Zhu, X.X.; Wang, C.; Nie, S.; Pan, F.F.; Xi, X.H.; Hu, Z.Y. Mapping forest height using photon-counting LiDAR data and Landsat 8 OLI data: A case study in Virginia and North Carolina, USA. Remote Sens. Environ. 2020, 114, 106287. [Google Scholar] [CrossRef]
- Li, W.; Niu, Z.; Shang, R.; Qin, Y.C.; Wang, L.; Chen, H.Y. High-resolution mapping of forest canopy height using machine learning by coupling ICESat-2 LiDAR with Sentinel-1, Sentinel-2 and Landsat-8 data. Int. J. Appl. Earth Obs. Geoinf. 2020, 92, 102163. [Google Scholar] [CrossRef]
- Huang, H.B.; Liu, C.X.; Wang, X.Y. Constructing a Finer-Resolution Forest Height in China Using ICESat/GLAS, Landsat and ALOS PALSAR Data and Height Patterns of Natural Forests and Plantations. Remote Sens. 2019, 11, 1740. [Google Scholar] [CrossRef]
- Francini, S.; D’AMICO, G.; Vangi, E.; Borghi, C.; Chirici, G. Integrating GEDI and Landsat: Spaceborne lidar and four decades of optical imagery for the analysis of forest disturbances and biomass changes in Italy. Sensors 2022, 22, 2015. [Google Scholar] [PubMed]
- Mohamed, M.; Gulab, S. Improving Forest Above-Ground Biomass Retrieval Using Multi-Sensor L- and C- Band SAR Data and Multi-Temporal Spaceborne LiDAR Data. Front. For. Glob. Chang. 2022, 5, 822704. [Google Scholar]
- Duncanson, L.; Dubayah, R. Monitoring individual tree-based change with airborne lidar. Ecol. Evol. 2018, 8, 5079–5089. [Google Scholar] [CrossRef] [PubMed]
- Lefsky, M.A. A global forest canopy height map from the moderate resolution imaging Spectroradiometer and the geoscience laser altimeter system. Geophys. Res. Lett. 2010, 37, L15401. [Google Scholar] [CrossRef]
- Wang, Y.Y.; Li, G.C.; Ding, H.H.; Guo, Z.D.; Tang, S.H.; Wang, C.; Huang, Q.N.; Liu, R.G.; Chen, J.M. A combined GLAS and MODIS estimation of the global distribution of mean forest canopy height. Remote Sens. Environ. 2016, 174, 24–43. [Google Scholar] [CrossRef]
- Vauhkonen, J.; Ene, L.; Gupta, S.; Heinzel, J.; Holmgren, J.; Pitkanen, J.; Solberg, S.; Wang, Y.S.; Weinacker, H.; Hauglini, K.M.; et al. Comparative testing of single-tree detection algorithms under different types of forest. Forestry 2012, 85, 27–40. [Google Scholar] [CrossRef]
- Bollandsas, O.M.; Gregoire, T.G.; Nasset, E.; Oyen, B.H. Detection of biomass change in a Norwegian mountain forest area using small footprint airborne laser scanner data. Stat. Methods Appl. 2013, 22, 113–129. [Google Scholar] [CrossRef]
- Potapov, P.; Li, X.Y.; Hernandez-serna, A.; Tyukavina, A.; Hansen, M.C.; Kommareddy, A.; Pickens, A.; Turubanova, S.; Tang, H.; Silva, C.E. Mapping global forest canopy height through integration of GEDI and Landsat data. Remote Sens. Environ. 2021, 253, 112165. [Google Scholar] [CrossRef]
- Simard, M.; Pinto, N.; Fisher, J.B.; Baccini, A. Mapping forest canopy height globally with spaceborne lidar. J. Geophys. Res.-Biogeosci. 2011, 116, 4021. [Google Scholar] [CrossRef]
- Popescu, S.C.; Zhou, T.; Nelson, R.; Neuenschwander, A.; Sheridan, R.; Narine, L.; Walsh, K.M. Photon counting LiDAR: An adaptive ground and canopy height retrieval algorithm for ICESat-2 data. Remote Sens. Environ. 2018, 208, 154–170. [Google Scholar] [CrossRef]
- Sun, T.; Qi, J.B.; Huang, H.G. Discovering forest height changes based on spaceborne lidar data of ICESat-1 in 2005 and ICESat-2 in 2019: A case study in the Beijing-Tianjin-Hebei region of China. For. Ecosyst. 2020, 7, 53. [Google Scholar] [CrossRef]
- Yang, T.; Wang, C.; Li, G.C.; Luo, S.Z.; Xi, X.H.; Gao, S.; Zeng, H.C. Forest canopy height mapping over China using GLAS and MODIS data. Sci. China Earth Sci. 2014, 44, 2487–2498. [Google Scholar]
- Liu, X.Q.; Su, Y.J.; Hu, T.Y.; Yang, Q.L.; Liu, B.B.; Deng, Y.F.; Tang, H.; Tang, Z.Y.; Fang, J.Y.; Guo, Q.H. Neural network guided interpolation for mapping canopy height of China’s forests by integrating GEDI and ICESat-2 data. Remote Sens. Environ. 2022, 269, 112844. [Google Scholar] [CrossRef]
- Neuenschwander, A.; Pitts, K. The ATL08 land and vegetation product for the ICESat-2 Mission. Remote Sens. Environ. 2019, 221, 247–259. [Google Scholar] [CrossRef]
- Neuenschwander, A.L.; Magruder, L.A. The potential impact of vertical sampling uncertainty on ICESat-2/ATLAS terrain and canopy height retrievals for multiple ecosystems. Remote Sens. 2016, 8, 1039. [Google Scholar] [CrossRef]
- Huang, H.; Liu, C.; Wang, X.; Biging, G.S.; Chen, Y.; Yang, J.; Gong, P. Mapping vegetation heights in China using slope correction ICESat data, SRTM, MODIS-derived and climate data. ISPRS J. Photogramm. Remote Sens. 2017, 129, 189–199. [Google Scholar] [CrossRef]
- Liu, A.B.; Cheng, X.; Chen, Z.Q. Performance evaluation of GEDI and ICESat-2 laser altimeter data for terrain and canopy height retrievals. Remote Sens. Environ. 2021, 264, 112571. [Google Scholar] [CrossRef]
Disclaimer/Publisher’s Note: The statements, opinions and data contained in all publications are solely those of the individual author(s) and contributor(s) and not of MDPI and/or the editor(s). MDPI and/or the editor(s) disclaim responsibility for any injury to people or property resulting from any ideas, methods, instructions or products referred to in the content. |
© 2023 by the authors. Licensee MDPI, Basel, Switzerland. This article is an open access article distributed under the terms and conditions of the Creative Commons Attribution (CC BY) license (https://creativecommons.org/licenses/by/4.0/).

