Abstract
Forest height and vertical structure profile functions can be estimated using polarimetric interferometric synthetic aperture radar (PolInSAR) data based on the random volume over ground (RVoG) model and polarization coherence tomography (PCT) theory, respectively. For each resolution cell, considering different forest vertical scattering structure functions to solve the corresponding forest height, the accuracy of PolInSAR forest height inversion will be improved. In this study, a forest vertical structure profile function and forest height inversion algorithm based on PCT technology was developed by using dual-baseline PolInSAR data. Then the deviation of forest height was corrected according to the inverted forest vertical structure. Finally, the LiDAR and PolInSAR data were employed to verify the proposed method. The experimental results show that the accuracy of the proposed method (tropical forest: RMSE = 5.96 m, boreal forest: RMSE = 3.11 m) is 25.5% and 30.43% higher than that of the dual-baseline RVoG model algorithm (tropical forest: RMSE = 8 m, boreal forest: RMSE = 4.47 m).
1. Introduction
The three-dimensional structure of forests, such as vertical profile and tree height, is an important factor in describing the morphological characteristics of the forest. This structure not only directly reflects the growth and development of the forest but also serves as an important input for estimating forest resources, such as aboveground biomass and growing stock [1,2,3]. Polarimetric Interferometric Synthetic Aperture Radar (PolInSAR) can detect three-dimensional structure parameters of vegetation due to its altimetry capability [4,5] and has an important role in the remote measurement of vegetation area characteristics, such as forest height and aboveground biomass [6,7]. The technology has been successfully applied to different radar bands, including the X-, C-, L-, and P-bands [8,9,10]. Among them, the X-band achieves a good performance in the acquisition of vegetation layer height but requires the corresponding ground digital terrain model (DTM) [11]. Therefore, the L- and P-bands will have broader application prospects in the future because of their strong penetration capabilities, and it is easier to obtain parameters such as the vertical backscatter profile of the vegetation layer and the height of the forest’s underlying surface.
The emergence of polarimetric interferometric SAR makes it possible to quantitatively obtain vegetation structure parameters. In the widest application, the random volume over ground (RVoG) model is utilized to estimate a small number of layer parameters in the forest, including forest height and understory structure [12,13]. This model treats the forest as a single medium layer that contains randomly uniform particles and does not take into account the vertical heterogeneity of the forest [14]. Under high-frequency radar wave observations, the forest scatterer satisfies the homogeneity assumption of the model, because the radar wave interaction occurs in the upper forest layer, where there are smaller scattering structures, such as branches and leaves. However, in low-frequency radar (e.g., L-band and P-band) observations, the interaction between radar waves and vegetation layers may occur at lower positions in the vegetation layer. The observed scatterers are mainly trunks and branches, and the signal contains ground scattering, which is no longer satisfied with the assumption of the RVoG model [15].
To solve this problem, a dual-baseline solution method is proposed in the scheme, which can take into account the influence of the ground scattering component on the forest height under the framework of the RVoG model [16]. In addition, some researchers have built many models that combine forest vertical structural heterogeneity and PolInSAR data [15,17,18,19]. Garestier and Le Toan proposed representing the RVoG model by considering the vertical variation in the extinction coefficient of the forest and established an interferometric coherence expression related to the profile of the truncated Gaussian backscatter to invert the forest height [17,18]. However, this method of modeling the forest scene as a single vertical structure model cannot take into account all the differences in the vertical structure of the forest, nor can it extract the forest vertical reflection information; only the forest height can be obtained.
Due to the complexity of the vertical structure of a forest, it is difficult to accurately express the scattering process of the SAR signal with a specific function. To solve this problem, tomographic synthetic aperture radar (TomoSAR) technology is widely used to estimate the three-dimensional structure inversion of scatterers such as forest vegetation layers without relying on any models [20]. However, to ensure good inversion performance, numerous SAR images with uniformly distributed baselines are needed, which severely limits the application scenarios of this technique. In addition, Cloude developed polarization coherence tomography (PCT) techniques to estimate forest vertical backscatter profiles using PolInSAR data [21,22,23]. The PCT technique takes the tree height as an input parameter and uses a set of orthogonal Legendre polynomials to approximate the vertical structure function, which is difficult to mathematically model. Cloude used single-baseline PolInSAR data to verify the PCT technique in 2006, showed the feasibility of inversion of forest vertical profiles, and discussed the framework and problems of multi-baseline PCT technique inversion [21]. Cloude used the dual-baseline method to invert the vertical structure with higher accuracy in 2007 and used singular value decomposition to solve the matrix ill-conditioned problem in the inversion process [22]. However, with this framework, only the vertical structure profile of the forest can be inverted, and the forest height cannot be matched with the vertical structurefunction. Zhang used an iterative method to solve the forest height and vertical structure model [24]. Based on these, we find that the PCT model has the potential to simultaneously retrieve forest height and vertical structure parameters. Therefore, we propose a dual-baseline forest height estimation method, which establishes different scattering models for each resolution cell, and simultaneously solves forest height and vertical structure parameters at the resolution cell level, rather than considering that the scattering models of different forests are the same.
The purpose of this work is to use PolInSAR data to simultaneously invert forest height and vertical structure profiles based on PCT technology so that the vertical structure function can correspond to different forest scattering scenes under different resolution cells. Due to the poor robustness of the multi-baseline iterative solution methods, we propose a geometric dual-baseline forest height and vertical structure solution method. This dual-baseline method limits the range of parameters to be solved by using a look-up table, and finally selects a set of forest height and vertical structure parameter solutions that satisfy both baseline PolInSAR observations. In the solution results, we found that the peak height of canopy scattering is more consistent with the forest height of LiDAR than the retrieved forest height. Therefore, the canopy scattering peak height can be corrected by using a small amount of LiDAR data products to improve the accuracy of PolInSAR forest height. Finally, this dual-baseline solution method uses the PCT model to extend the PolInSAR forest height estimation to the vertical structure profile function and forest height estimation.
2. Study Site and Data
2.1. Tropical Forest Area at Lope
In 2015 and 2016, the AfriSAR campaign was carried out as a collaborative effort among international space and National Park agencies (ESA, NASA, ONERA, DLR, ANPN and AGEOS) in support of the upcoming ESA BIOMASS, NASA-ISRO Synthetic Aperture Radar (NISAR) and NASA Global Ecosystem Dynamics Initiative (GEDI) missions [25]. As part of the 2016 AfriSAR campaign, NASA conducted data collection in the rainforests of Africa using L-band Unmanned Aerial Vehicle Synthetic Aperture Radar (UAVSAR) and the Land, Vegetation, and Ice Sensor (LVIS) LiDAR systems. The UVASAR data are available from https://uavsar.jpl.nasa.gov/ (accessed on 7 April 2021). The LVIS LiDAR data are available from https://lvis.gsfc.nasa.gov/ (accessed on 7 April 2021). Both UAVSAR and LVIS LiDAR are airborne sensor systems, and the data can be used to explore models and algorithms that can be applied to the upcoming space satellite SAR system. The LVIS LiDAR forest height product (RH100) obtained by NASA in this campaign was selected for accuracy verification. The resolution of the LVIS forest height product is 25 m × 25 m.
This paper uses the polarization SAR data obtained in the rainforest of Lope National Park, Gabon. The location of the Lope test area is shown in Figure 1a. As a super test site for the AfriSAR campaign, Lope has a complex terrain environment and forest height distribution. The forest height range is 3 m to 60 m, and the average forest height is approximately 35 m, which is challenging for the inversion of forest height [25,26]. In this area, UAVSAR data were obtained through repeated observations at different orbital heights. In this paper, four interferometric pairs with different baseline lengths were selected for experiments. For each interferometric pair, multilook processing and polarimetric interferometry were conducted. The phase diversity optimization method was then applied to estimate the polarimetric coherences. The original PolSAR image has a resolution of 0.6 m in azimuth and 1.67 m in slant range. We performed multilook processing using a rectangular window with a size of 16 pixels in azimuth and 4 pixels in slant range, producing multilooked images with a pixel spacing of 9.6 m in azimuth and 6.66 m in slant range.
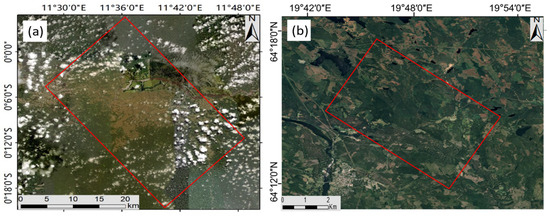
Figure 1.
The optical image of the test site (copyright Google Earth) and the corresponding SAR data location (red box). (a,b) are the Lope and Krycklan test areas, respectively.
2.2. Boreal Forest Area at Krycklan
The PolInSAR data of the boreal forest area were collected by the European Space Agency (ESA) in the BioSAR2008 campaign in order to investigate the strong topographic effects on biomass retrieval (http://eopi.esa.int, accessed on 13 November 2020). The L-band quad-polarization data of the E-SAR airborne SAR system provided by the BioSAR 2008 campaign were employed as the test for experimental verification [17,27]. The data includes two types of datasets: radar geometry image products and geocoded terrain correction products. The SAR data of forest area obtained by the BioSAR 2008 campaign are mainly used for the inversion of forest height and biomass. In addition, as a part of the BioSAR2008 campaign, LiDAR measurements were performed by the Swedish Defense Research Agency (FOI). The derived forest height will be regarded as the reference to evaluate the performance of the proposed method in forest height inversion. The experimental area of the campaign is located in the Krycklan River area of Vindeln city in northern Sweden (see Figure 1b). This area exhibits typical northern forest characteristics. The forest type is mainly coniferous and broad-leaved mixed forest.
The main tree species are coniferous forests dominated by Pinus sylvestris, Picea abies, and a small number of Betula. The average forest height is approximately 18 m, and the maximum forest height is 30 m [17,24,27]. The forest type of the experimental area and the band of data acquisition are different from those of the Lope test site, which can better verify the effectiveness of the algorithm. Four interferometric pairs with different baseline lengths were selected for the experiments. For each interferometric pair, a series of PolInSAR preprocessing steps were conducted, including image coregistration, flat-earth removal, multilook processing and polarimetric interferometry. The phase diversity optimization method was then applied to estimate the polarimetric coherences. The original PolSAR image has a resolution of 1.2 m in azimuth and 2.12 m in slant range. We performed multilook processing using a rectangular window with a size of 2 pixels in azimuth, producing multilooked images with a pixel spacing of 2.4 m in azimuth and 2.12 m in slant range. The configuration parameters of the airborne SAR interferometric pairs for the two test sites are shown in Table 1.

Table 1.
Configuration of airborne SAR in the experimental area.
3. Methodology
3.1. Random Volume over Ground Model
In forest applications, the scattering model of vegetation is widely used. To connect PolInSAR observations with forest scene parameters, Treuhaft proposed the RVoG model in 1996. This model describes the forest vegetation scene as a two-layer structure composed of a vegetation layer and a surface layer [28]. The upper layer is a uniform block composed of randomly distributed and anisotropic scattering particles covered in an impenetrable surface layer. Considering only the effect of volume decorrelation caused by the vegetation layer, the complex interferometric coherence 𝛾(w) depends on the integral of the scattering intensity in the vertical direction [6,12,28]:
where and are the complex scattered signals received by the radar antenna, is the vertical wavenumber of the interferometry, and . The phase is related to the ground topography phase. is the incident angle of the radar antenna, is the observation angle difference, is the vertical baseline length, and R is the slant distance from the antenna to the observation target. The distribution of contains forest vertical scattering information, and w is the polarization vector.
In low-frequency observations, the vegetation scattering model needs to consider the interaction between the vegetation layer and the ground surface. Vegetation can be regarded as a single-layer scattering model with thickness which contains scatterers with scattering intensity . The scattering characteristics are expressed by the average extinction coefficient and its thickness , which are exponentially distributed. represents the ground layer, and its scattering intensity is . The vertical structure of the exponential distribution is applied to the RVoG model, which assumes that the scattering contribution received by the sensor consists of ground scattering and canopy scattering [4,28]:
where is the ground scattering function. Substituting Formula (2) into Formula (1), the formula can be simplified as:
where w is the polarization vector; the phase is related to the ground topography under the vegetation layer; represents the ground-to-volume ratio (GVR), which changes with the polarization channel; and is the volume decorrelation caused by the vegetation layer. Formula (3) represents a straight line in the complex plane. The RVoG model uses the volume decorrelation as a bridge to relate observations to forest height, and the volume decorrelation is expressed in the form of the following equation:
where represents the volume-only decorrelation coefficient, which is independent of the polarization channel of the radar wave. is the volume thickness in the scattering model, and represents the wave extinction coefficient of the vegetation layer.
3.2. Polarization Coherence Tomography Model
The forest reflectance function is defined as in Formula (1), which represents the continuous change in the scattered energy of the forest layer. With a certain polarization channel w, the reflectance function as a function of height z is expanded by the Legendre series:
where is the undetermined real coefficient, which determines the shape of the vertical structure function. The main idea of polarization coherence tomography is to use a set of orthogonal Legendre coefficients to approximate the vertical structure function and then to use the observed complex coherence coefficient to estimate the undetermined coefficient . denotes a set of standard Legendre polynomials expressed as [21,22]:
By combining Formulas (5) and (6), the relation between the complex coherence coefficient and the unknown Legendre coefficient is obtained by Fourier expansion Formula (1):
where and . For polarization interferometry, contains only one unknown variable forest height . is a weight factor, the odd term of is a real number, the even term is an imaginary number, and is a function of . The expression of is obtained by performing an integral operation:
It can be noted that with the higher-order expansion of Fourier-Legendre, it can more accurately represent the change of coherence coefficient caused by scattering process. However, in higher-order expressions, this effect is small and can be disregarded. The expansion values of and higher are basically near zero, so in the solution of the vertical structure profile function in this paper, we assume that these terms are zero.
3.3. Forest Height and Vertical Structure Estimation Based on PCT Technology
For the solution of the forest vertical structure profile function, there is a complex coherence coefficient on the left side of Formula (7) which represents the two observations (coherence and phase of polarimetric interferometry). Cloude employed dual-baseline PolInSAR data to solve coefficients . In this process, the singular value decomposition method is used to solve the matrix ill-conditioned problem and to obtain a relatively reliable vertical structure function [16,22]. However, this vertical structure inversion method needs to provide prior forest height information, which limits the development of forest scattering models that are consistent with forest height and vertical profile structure.
According to Formula (8), the fourth term in the Fourier–Legendre expansion is much smaller than the third term and nearly zero, which is negligible in the inversion process of this paper. Therefore, for Formula (7), when the forest height is known, the parameters to be solved only contain three vertical structure parameters. However, in the dual-baseline observation, there are four observations on the left of Formula (7). This extra observation information provides an opportunity for us to simultaneously determine the forest height. Therefore, in this paper, when the influence of the higher-order terms of the Fourier-Legendre expansion are disregarded, the simple expression of Formula (7) is written as:
where is a function of and . Note that varies for different baseline interferometers because of . In summary, the core principle of PCT, which is to use a set of standard Legendre polynomials to fit and approximate the relative reflectance function that is difficult to mathematically model, is shown in Figure 2. Therefore, for the dual-baseline PolInSAR solution in this paper, the reconstruction of the vertical structure function is expressed by a third-order polynomial in the form of:
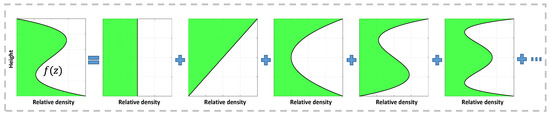
Figure 2.
PCT vertical structure function reconstruction. The right side of the equal sign is a set of standard Legendre functions, which can be combined with the coefficient to construct the forest vertical scattering function (left side of the equal sign).
For Formula (7), when the forest height is known, the Fourier-Legendre expansion term is the known term, and is the unknown parameter to be estimated. In this case, the problem to be solved is a linear solution problem, and the parameter to be solved can be directly obtained [21]. However, when the corresponding forest height and vertical structure are to be simultaneously solved, and are the items to be estimated, and the solution problem of Formula (9) is a nonlinear problem. The solution cannot be directly performed and is a complex process.
To solve the parameters to be estimated, and in this case, this paper uses the dual-baseline lookup table (LUT) method to obtain accurate forest height and vertical structure parameters. As shown in Figure 3, we built two two-dimensional lookup tables. The first two-dimensional lookup table consists of two parameters, and , and the second lookup table consists of and . For each resolution unit, each table element in the first lookup table was sequentially combined with all elements in LUT 2 to form a set of candidate parameter solutions. For each element in LUT 1, and are fixed, so the first baseline observation information can be utilized to obtain an optimal and as the correspondence in LUT 2. A series of optimal solution spaces for the first baseline are obtained according to the following formula. The value is written as:
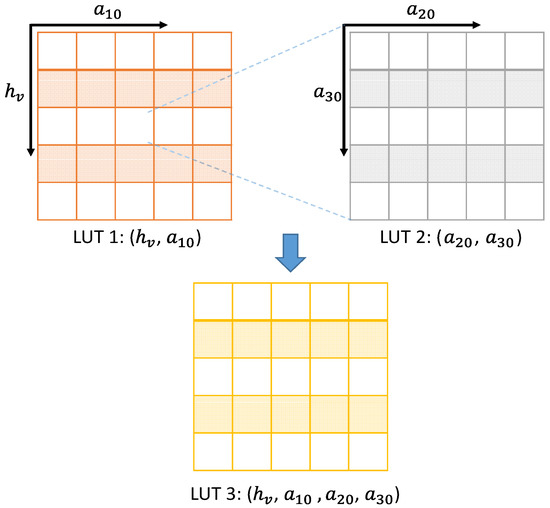
Figure 3.
Dual-baseline PCT forest height and vertical structure parameter selection process.
By traversing each table element of lookup Table 1, we obtain a solution space combination of forest height and vertical structure parameters equal to the number of elements in lookup Table 1, which is displayed in LUT 3 . It can be noted that lookup Table 1 and LUT 3 are equal in size, whereas the size of LUT 2 is generally different. This difference is essentially due to the different value ranges of parameters. Influenced by , the Fourier-Legendre expansion term of different baselines is also different. The second baseline observation value is used to filter the solution space LUT 3, and the final solution is expressed as follows:
3.4. Vegetation Layer Scattering Waveform Peak Height Correction
Under PolInSAR observation, it can be assumed that the wave peak height of the vertical profile function is equal in the area where the difference between tree species and tree height is small. Due to the penetration ability of PolInSAR, the peak height of vegetation scattering has a difference from the forest height [29,30]. According to Formula (10), we can obtain the distribution shape of vertical scattering energy of vegetation scatterers, so as to further obtain the height of canopy scattering peak. According to the height of the scattering peak and its difference from the forest height, we can obtain the corresponding forest height.
For LiDAR forest height products, due to the measurement method of its spot, the product coverage is limited, but it has higher accuracy than PolInSAR forest height products [30]. Therefore, the canopy peak height of the energy spectrum obtained by PCT technology and LiDAR products can be combined to correct the overall peak height to obtain a more accurate forest height. The relationship between the canopy peak height of the energy spectrum and forest height h is shown in Figure 4.
where and represent the LiDAR forest height and the corresponding peak height in the area covered by the LiDAR forest height product, is the peak height correction error, and h is the corrected height.
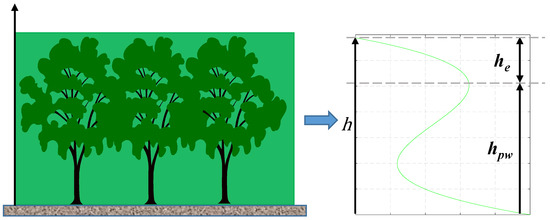
Figure 4.
The relationship between canopy peak height and forest height.
For pixels with different forest heights, the correction values of canopy peak height and forest height are different. Therefore, the peak height should be divided into multiple intervals for correction. In this paper, the peak height is divided into three intervals with equal spacing for correction. An accurate peak height is crucial for forest height estimation, so we next explore the vertical structure profile parameters.
We use Formula (7) to explore the effect of different undetermined coefficient values on the coherence coefficient on the complex plane circle. As shown in Figure 5a–c show the changes of on the complex plane when only considering the value changes of , and , respectively. We use red to represent the coverage area of the coherence coefficient on the complex plane circle when the value is positive, blue to represent the area covered when the value is negative, and a black curve to represent the corresponding curve when the value is 0. On this complex plane circle, the following three points are noted:
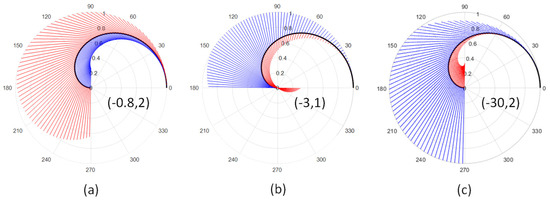
Figure 5.
The value of the coherence coefficient changes with the value of the undetermined coefficient . The red area represents the area covered by the coherence coefficient when the coefficient is positive; the blue area represents the area covered when is negative; and the black curve represents the corresponding curve when is 0. (a) is the area occupied by when the value is −0.8 to 2; (b) is the area occupied by when the value is −3 to 1; and (c) is the area occupied by when the value is −30 to 2.
- The value range of the undetermined coefficients , and is limited. When this range is exceeded, the coherence coefficient will exceed the range of the complex plane circle, which is impossible. According to Figure 5, the value range of is −0.8 to 2, the value range of is −3 to 1, and the value range of is −30 to 2. These ranges allow us to determine the scope of the lookup table.
- As the Fourier–Legendre expansion term increases, the magnitude of decreases, and the value range of the undetermined coefficient rapidly increases. The value range of is much larger than that of . For higher-order terms, small differences in undetermined coefficients do not change the results much.
- Figure 5 shows that the larger coverage area for is positive and that the larger coverage area for is negative. It can be inferred that when estimating the undetermined coefficients, the values for most resolution cells are ≥ 0 and ≤ 0, which is also confirmed in the inversion results. These results are equivalent to the results of Cloude’s derivation of the second-order expression [1,2,6], which shows that the maximum scattering region in the forest scatterer is generally located in the upper part of the vegetation layer.
4. Experiments and Results
4.1. Tropical Forest Height and Vertical Structure Profile Function at Lope
The proposed algorithm was tested using airborne quad-polarization datasets to obtain PolInSAR forest height and vertical structure profile functions. In this section, we show the PolInSAR forest height and vertical structure retrieved by the dual-baseline combination (20 m−60 m) in the tropical forest. According to Formula (10) and the forest vertical structure parameters , and obtained based on the dual-baseline PCT model solution method, we obtained the vertical structure profile for each resolution cell. Figure 6 shows the normalized vertical structure function value corresponding to the red line in the yellow rectangle (slant range direction (Column): 600, azimuth direction (Row): 2500:3000) in Figure 7c. The upper panel in Figure 6 shows the polarization tomograms of all the pixels in the rectangle. Even in the tropical rainforest area, the scattered energy from the surface cannot be disregarded, and volume scattering at canopy locations and dihedral scattering at near-surface regions are the main sources of scattering. Less surface scattering can be explained, because the lower layer of tropical forest vegetation has a complex ecological environment, and shrubs and tall and thick grass stems are more abundant, so the scattering signal shows more dihedral scattering rather than surface scattering.
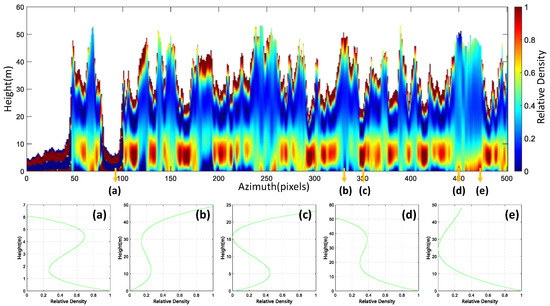
Figure 6.
Inversion results of vertical profiles of tropical forests using dual-baseline PolInSAR data based on the PCT model. The top panel shows the vertical structural polarization tomogram of the area covered by the red line in the yellow rectangular box in Figure 7c and (a–e) represent the profile functions of the 90th, 31st, 350th, 450th, and 470th pixels, respectively, in the above polarization tomogram.
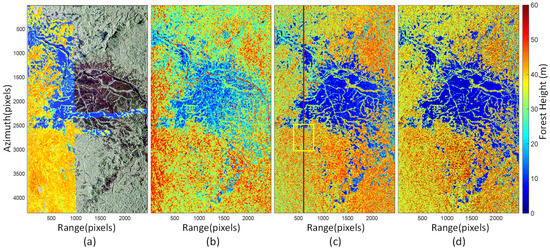
Figure 7.
PolInSAR forest height retrieval results for tropical forest at Lope. (a) The LVIS LiDAR forest height product is overlaid on the Pauli RGB composite map; (b) dual-baseline PolInSAR forest height inversion results based on the RVoG model; (c) dual-baseline PolInSAR forest height inversion results based on the PCT model; (d) dual-baseline PolInSAR forest height obtained by correcting the height of canopy scattering peak.
The lower panels (a) to (e) in Figure 6 represent the vertical structure scattering profile functions for five pixels (90th, 331st, 350th, 450th, and 470th pixels along the azimuth direction (row)) randomly picked from the above polarization tomogram. Based on this structure scattering function, the peak height of vegetation canopy scattering can be obtained. In addition, the vertical structure profile functions of (a) to (e) are basically different: they have different heights and different scattering structures. This also proves that the structure of tropical forests is complex, and that the scattering structure function that only assumes an exponential distribution in the vertical direction is not consistent with the vertical scattering of tropical forests.
Figure 7a shows the LiDAR forest height, Figure 7 (b) to (d) are the PolInSAR forest height, and Figure 7d is the forest height obtained by correcting the height of the canopy scattering peak. The canopy scattering peak height is divided into three intervals: 0–20 m, 20 m–40 m, and 40 m–60 m. According to Formula (13), a small amount of LiDAR forest height products (slant range direction (Column) 550:650) and its corresponding canopy scattering peak height are used to obtain the peak height correction error . Then the peak height in the three intervals is corrected to obtain the forest height.
By comparing the LiDAR forest height products in Figure 7a, the dual-baseline estimation method based on the RVoG model is overestimated in low-vegetation areas. On the one hand, this is due to the increased penetration ability under low-frequency observations, and PolInSAR observations contain a large amount of ground scattering, resulting in an overestimation of low vegetation. On the other hand, since the RVoG model considers that the effective scatterers are located in the upper forest layer, rather than the lower forest layer. With low-frequency observations, the effective scatterers become larger and are located at a lower position in the forest structure, contrary to the RVoG model assumption. In this case, the exponentially structured vertical scattering profile function assumption is no longer valid, resulting in the overestimation of low vegetation. Compared with the forest height inversion method based on the RVoG model, the dual-baseline solution method based on the PCT model eliminates the overestimation of low vegetation caused by model inconsistencies due to considering this non-exponential vertical scattering situation. For the peak correction forest height, due to the overall correction, the forest estimation result is closer to the LiDAR forest height.
Figure 8 shows the scatterplot of the accuracy validation between the retrieved dual-baseline PolInSAR forest height and the LiDAR forest height. The size of pixels (260 m 260 m) in the PolInSAR forest height result serves as a forest window for accuracy verification, and the average filtering was performed in this window. The experimental results were compared with the LVIS forest height products of the same resolution. The root mean square error (RMSE) and coefficient of determination (R2) were selected as evaluation indicators for comparison. For the tropical forest area at Lope, a total of 154,319 plots were counted, of which a height of less than 3 m was considered to be grassland and was masked.
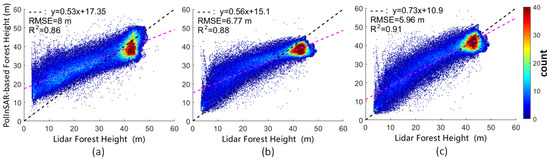
Figure 8.
Statistical results of tropical forest height estimation. Red indicates dense scatter, and blue indicates sparse scatter. (a) Dual-baseline PolInSAR forest height inversion results based on the RVoG model; (b) dual-baseline PolInSAR forest height inversion results based on the PCT model; (c) dual-baseline PolInSAR forest height obtained by correcting the height of canopy scattering peak.
For the dual-baseline estimation method product based on the RVoG model (RMSE = 8 m; R2 = 0.86), its forest height has the same trend as the LiDAR forest height. Compared with this result, the solution method based on the PCT model (RMSE = 6.77 m; R2 = 0.88) was improved by 15.38% in RMSE, and the deviation from the real forest scene was smaller. The forest height based on the PCT model for peak correction (RMSE = 5.96 m; R2 = 0.91) was more consistent with LiDAR forest height products. Compared with the RVoG model forest height product, RMSE increased by 25.5%. Therefore, the proposed method reflects the distribution of forest height and improves the estimation bias of vegetation.
4.2. Boreal Forest Height and Vertical Structure Profile Function at Krycklan
In this section, the algorithm proposed in this paper is verified in the L-band coniferous forest area, considering the inversion effect of stronger penetration ability and more near-surface scattering for coniferous forest scenes with relatively simple forest composition. According to Formula (10), we obtained the vertical structure profile for each resolution cell. Figure 9 shows the normalized vertical structure function value corresponding to the red line (slant range direction (Column): 400, azimuth direction (Row): 5500:6000) in the yellow rectangle in Figure 10c. The top panel in Figure 9 shows the polarization tomogram of all the cells in the rectangle. In the coniferous forest area, volume scattering and surface scattering are the main sources of scattering in the vegetation cover area. In contrast to the tropical forest area, the scattered signal at near-surface locations is surface scattering rather than dihedral scattering. In tropical forest sites, the near-surface area under the vegetation is covered with dense small vegetation stems. As a result, the reflected signal often contains a large amount of dihedral scattering located at a position slightly above the surface height. For the coniferous forest in the low-frequency observation scene, due to the sparse vegetation of the boreal forest, there is minimal vegetation with stems under the coniferous forest, with the exception of tall trees, and the low-frequency signal appears as surface scattering near the surface.
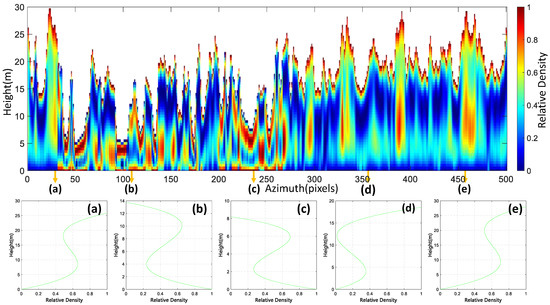
Figure 9.
Inversion results of vertical profiles of boreal forests using dual-baseline PolInSAR data based on the PCT model. The top panel shows the vertical structural polarization tomogram of the area covered by the red line in the yellow rectangular box in Figure 10c, and (a–e) represent the profile functions of the 30th, 110th, 235th, 355th, and 460th pixels, respectively, in the above polarization tomogram.
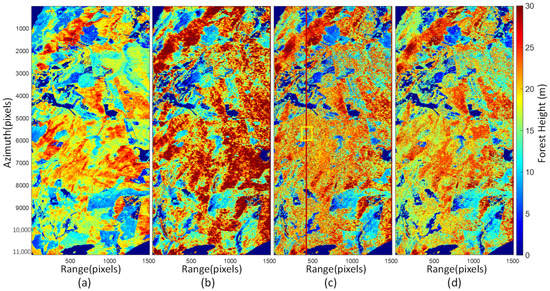
Figure 10.
PolInSAR forest height retrieval results for boreal forest at Krycklan. (a) LiDAR forest height product, (b) dual-baseline PolInSAR forest height inversion results based on the RVoG model, and (c) dual-baseline PolInSAR forest height inversion results based on the PCT model; (d) dual-baseline PolInSAR forest height obtained by correcting the height of canopy scattering peak.
Figure 9 (a) to (e) represent the vertical structure scattering profile functions of five pixels (30th, 110th, 235th, 355th, and 460th pixels, respectively, along the azimuth (row)) randomly selected from the above polarization tomogram. The structures have different heights and scattering structures, which can estimate the height of canopy scattering peaks. The structures of Figure 9 (a), (d), and (e) of the five pixels are similar, and the structures of Figure 9 (b) and (c) are similar. For the tropical rainforest area, the vertical structure functions of Figure 9 (a) to (e) are different. This finding proves that the coniferous forest region has a simpler composition of forest scatterers than the diversity of the vertical scatter structure of the tropical rainforest.
At the Krycklan test site, we also show the results of forest height inversion for a dual-baseline combination (12 m–24 m), as shown in Figure 10. Figure 10a is the LiDAR forest height product, Figure 10 (b) and (c) are the PolInSAR forest height retrieval products based on the RVoG model and PCT model, respectively, and Figure 10d is the dual-baseline PolInSAR forest height obtained by correcting the height of the canopy scattering peak. The canopy scattering peak height is divided into three intervals to correct: 0–10 m, 10 m–20 m, and 20 m–30 m. According to Formula (13), a small amount of LiDAR forest height products (slant range direction (Column) 350:450) and its corresponding canopy scattering peak height are used to obtain the peak height correction error .
To evaluate the accuracy of forest height estimation, pixels (80 m 80 m) in the PolInSAR forest height results served as a forest statistical window in the accuracy assessment. The experimental results were compared with the LiDAR forest product of the same resolution and size. For the entire image test site, a total of 3259 statistical windows were counted. Figure 11 shows the scatterplot between the LiDAR and PolInSAR forest height products inverted by the dual-baseline RVoG and PCT models. The dual-baseline forest height estimation method based on the RVoG model (RMSE = 4.47 m, R2 = 0.75) and the dual-baseline forest height estimation method based on the PCT model (RMSE = 3.39 m, R2 = 0.76) can retrieve the forest height. The RMSE of canopy peak correction forest height (RMSE = 3.11 m, R2 = 0.79) improved by 30.43% compared to the forest height retrieved by the RVoG model. For the boreal forest, the tree species are relatively simple, and the simple exponential attenuation model can also fit the scattering structure distribution. The PCT uses more parameters to describe the scattering process in the vertical direction, so the forest height corrected by the canopy peak has a smaller RMSE. However, there is almost no difference in RMSE between the corrected canopy peak height and the forest height retrieved by PCT. This means that for a simple vegetation vertical scattering function, the forest height and canopy peak height retrieved by the PCT model are the same in most forest areas.
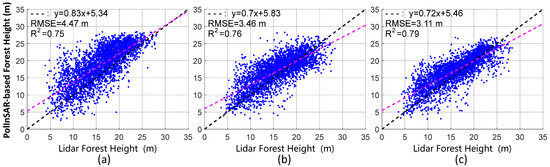
Figure 11.
Statistical results of boreal forest height estimation. (a) Dual-baseline PolInSAR forest height inversion results based on the RVoG model; (b) dual-baseline PolInSAR forest height inversion results based on the PCT model; (c) dual-baseline PolInSAR forest height obtained by correcting the height of canopy scattering peak.
5. Discussion
The dual-baseline PCT solution method proposed in this paper was tested using the SAR data of the airborne tropical forest and boreal forest sites, and the corresponding forest height and vertical scatterer density distribution functions were obtained. These forest vertical feature images reflect the difference in vegetation scatterer density between tropical rainforest and coniferous forest areas. In tropical forests, the scattering echo signal is stronger. In addition to canopy scattering, the dihedral scattering of the interaction between understory vegetation and the ground is more than that of the boreal forest site, which may be due to the fact that tropical forests grow more understory vegetation. This detailed information can also be used as basic data to describe the distribution of forest stock through further regression.
By comparing the PolInSAR forest height obtained by the algorithm proposed in this paper with the LiDAR forest height, it can be noted that in tropical forests, the RMSE of forest height estimation is 17.03% of the average forest height, and in the boreal forest test site, the error is 17.28%, which can meet the needs of large-scale forest biomass estimation. The RMSE of the forest height estimated in two different test sites is the same, indicating that the proposed algorithm considers different vertical structure functions in both complex tropical rainforests and simple coniferous forests. The final scattering model fits the real vertical distribution scene of forest scatterers. For the coefficient of determination, due to the different sources of SAR data and the different resolution of the statistical window (the tropical forest data comes from NASA ‘s UAVSAR equipment and the statistical window is 260 m × 260 m, while the boreal forest data comes from the ESA’s F-SAR equipment and the statistical window is 80 m × 80 m), the coefficient of determination of the tropical forest test site is better than that of the boreal forest test site. Due to this statistical window difference, the comparison of the coefficient of determination is not applicable to different data sets in PolInSAR forest height estimation of airborne data. In addition, the accuracy is compared with the existing dual-baseline forest height solution method based on RVoG model. It is proved that the dual baseline PolInSAR forest height estimation based on PCT technology is feasible. As the forest vertical profile function is related to the forest height solution, the validity of the forest height solution also proves the reliability of the forest vertical profile function.
By summarizing the work of Cloude et al. and the experimental results of this paper, it is further revealed that in sparse forests, the actual forest scene is quite different from the RVoG model assumption. Even if the effect of the ground-to-volume ratio is considered in the dual-baseline inversion, the forest height inversion still has a large deviation. This change in vertical structure should be considered for forest resource surveys and forest biomass estimates. For forest areas, the vertical distribution functions of vegetation scatterers are diverse, and the effective scatterer may be located in the trunk and understory vegetation rather than the upper forest canopy. This situation can occur in sparse forest environments, with more or less distinct differences in the underlying structure of the vegetation layer, or in low-frequency observations, where the effective scatterers become larger and therefore located lower in the forest structure. In this case, exponential structural attenuation is no longer effective, leading to an overestimation of low vegetation. Although the PCT model is used to approximate the scattering structure, there are still some forest height estimation biases in lower and higher vegetation estimations. In view of this situation, the segmented correction of the canopy scattering peak height in the vertical structure profile can correct this systematic deviation problem.
For the solution of the vertical profile function, the original PCT solution framework needs to calculate the forest height in advance as the input parameter. The solution of the forest height is still obtained using the RVoG model. It is unreasonable to separately calculate the forest height and vertical structure profile parameters under different vertical structure model assumptions. Using the dual-baseline PCT algorithm, the forest height and vertical structure can be placed in a solution framework, which solves the problem of the previous forest height solution model not matching the vertical structure solution model. However, the solution framework of this proposed method is in dual-baseline mode. This limits the solution of more baselines for higher-order forest vertical structures.
6. Conclusions
This paper demonstrates the unequivocal potential of dual-baseline L-band PolInSAR systems for forest height and vertical structure profile estimation in tropical and boreal forest test sites using simple polarimetric interferometric tomography. The study retrieved PolInSAR forest height and vertical structure profile products for different forest types using a dual-baseline quad-polarization dataset based on polarimetric coherence tomography theory. For the forest parameter estimation model, the RVoG model, its exponential attenuation of the forest structure in the vertical direction of the integral model is not applicable to all resolution cells of interferometry. To overcome these limitations, considering the complexity of forest vertical structure in different resolution cells, a pixel-level forest vertical structure profile and forest height inversion model were established. Due to the lack of single-baseline observation information, it was not possible to solve all the parameters. The introduction of multi-baseline data and analysis based on the model itself demonstrated that the parameters of the dual-baseline solution provide a better PolInSAR inversion product. These dual-baseline PolInSAR forest height and vertical structure inversion results can be used to estimate forest aboveground biomass and monitor forest growth. In future research, more baseline interferometry data, rather than only dual-baseline data, should be considered for the solution of the PCT model.
Author Contributions
Conceptualization, S.C., R.Z. and J.Z.; methodology, S.C.; software, R.Z. and J.Z.; validation, S.C., J.Z., L.F., Y.X. and T.Z.; formal analysis, S.C., J.Z., Y.X. and L.F.; investigation, H.F.; resources, J.Z.; data curation, J.Z. and H.F.; writing—original draft preparation, R.Z. and S.C.; writing—review and editing, S.C., H.F. and J.Z.; supervision, J.Z.; project administration, H.F. and J.Z.; funding acquisition, H.F. and J.Z. All authors have read and agreed to the published version of the manuscript.
Funding
This research was funded in part by the National Natural Science Foundation of China under Grant 41820104005, Grant 42104016, Grant 41904004, and Grant 42030112; in part by the Open Topic of Hunan Key Laboratory of Remote Sensing of Ecological Environment in Dongting Lake Area, NO. DTH Key Lab.2021-012; and in part by the introduction of talent research start-up fund of Central South University of Forestry and Technology Grant No.2021YJ010.
Institutional Review Board Statement
Not applicable.
Informed Consent Statement
Not applicable.
Data Availability Statement
The data presented in this study are available on request from the corresponding author. The data are not publicly available due to their size.
Acknowledgments
The authors would like to thank the National Aeronautics and Space Administration (NASA) for providing the AfriSAR 2016 campaign polarimetric synthetic aperture radar interferometry (PolInSAR) data and Land, Vegetation, and Ice Sensor (LVIS) LiDAR data of the test site and the European Space Agency for providing the BioSAR2008 campaign dataset.
Conflicts of Interest
The authors declare no conflict of interest.
References
- Chave, J.; Andalo, C.; Brown, S.; Cairns, M.A.; Chambers, J.Q.; Eamus, D.; Fölster, H.; Fromard, F.; Higuchi, N.; Kira, T.; et al. Tree Allometry and Improved Estimation of Carbon Stocks and Balance in Tropical Forests. Oecologia 2005, 145, 87–99. [Google Scholar] [CrossRef]
- Aghababaei, H.; Ferraioli, G.; Ferro-Famil, L.; Huang, Y.; Mariotti D’Alessandro, M.; Pascazio, V.; Schirinzi, G.; Tebaldini, S. Forest SAR Tomography: Principles and Applications. IEEE Geosci. Remote Sens. Mag. 2020, 8, 30–45. [Google Scholar] [CrossRef]
- Houghton, R.A.; Hall, F.; Goetz, S.J. Importance of biomass in the global carbon cycle. J. Geophys. Res. 2009, 114, G00E03. [Google Scholar] [CrossRef]
- Cloude, S.R.; Papathanassiou, K.P. Polarimetric SAR Interferometry. IEEE Trans. Geosci. Remote Sens. 1998, 36, 1551–1565. [Google Scholar] [CrossRef]
- Zimble, D.A.; Evans, D.L.; Carlson, G.C.; Parker, R.C.; Grado, S.C.; Gerard, P.D. Characterizing vertical forest structure using small-footprint airborne LiDAR. Remote Sens. Environ. 2003, 87, 171–182. [Google Scholar] [CrossRef]
- Papathanassiou, K.P.; Cloude, S.R. Single-Baseline Polarimetric SAR Interferometry. IEEE Trans. Geosci. Remote Sens. 2001, 39, 2352–2363. [Google Scholar] [CrossRef]
- Mette, T.; Papathanassiou, K.P.; Hajnsek, I.; Pretzsch, H.; Biber, P. Applying a common allometric equation to convert forest height from Pol-InSAR data to forest biomass. In Proceedings of the IEEE International Geoscience & Remote Sensing Symposium, Anchorage, AK, USA, 20–24 September 2004; p. 1. [Google Scholar]
- Garestier, F.; Dubois-Fernandez, P.C.; Papathanassiou, K.P. Pine forest height inversion using single-pass X-band PolInSAR data. IEEE Trans. Geosci. Remote Sens. 2007, 46, 59–68. [Google Scholar] [CrossRef]
- Hajnsek, I.; Kugler, F.; Lee, S.K.; Papathanassiou, K.P. Tropical-Forest-Parameter Estimation by Means of Pol-InSAR: The INDREX-II Campaign. IEEE Trans. Geosci. Remote Sens. 2009, 47, 481–493. [Google Scholar] [CrossRef]
- Unmesh, K.; Gulab, S.; Shashi, K. Potential of Space-Borne PolInSAR for Forest Canopy Height Estimation Over India-A Case Study Using Fully Polarimetric L-, C-, and X-Band SAR Data. IEEE J. Sel. Top. Appl. Earth Obs. Remote Sens. 2018, 11, 2406–2416. [Google Scholar]
- Shiroma, G.H.X.; de Macedo, K.A.C.; Wimmer, C.; Moreira, J.R.; Fernandes, D. The Dual-Band PolInSAR Method for Forest Parametrization. IEEE J. Sel. Top. Appl. Earth Obs. Remote Sens. 2016, 9, 3189–3201. [Google Scholar] [CrossRef]
- Cloude, S.R.; Papathanassiou, K.P. Three-stage inversion process for polarimetric SAR interferometry. IEE Proc.-Radar Sonar Navig. 2003, 150, 125–134. [Google Scholar] [CrossRef]
- Papathanassiou, K.P.; Cloude, S.R.; Liseno, A.; Mette, T.; Pretzsch, H. Forest height estimation by means of polarimetric SAR interferometry: Actual status and perspectives. In Proceedings of the 2nd ESA POLInSAR Workshop, Frascati, Italy, 17–21 January 2005. [Google Scholar]
- Fu, W.; Guo, H.; Song, P.; Tian, B.; Li, X.; Sun, Z. Combination of PolInSAR and LiDAR Techniques for Forest Height Estimation. IEEE Geosci. Remote Sens. Lett. 2017, 14, 1218–1222. [Google Scholar] [CrossRef]
- Neumann, M.; Ferro-Famil, L.; Reigber, A. Estimation of Forest Structure, Ground, and Canopy Layer Characteristics From Multibaseline Polarimetric Interferometric SAR Data. IEEE Trans. Geosci. Remote Sens. 2010, 48, 1086–1104. [Google Scholar] [CrossRef]
- Cloude, S.R.; Williams, M.L. A coherent EM scattering model for dual baseline POLInSAR. In Proceedings of the Geoscience and Remote Sensing Symposium, IGARSS ’03, Toulouse, France, 21–25 July 2003. [Google Scholar]
- Garestier, F.; Toan, T.L. Estimation of the Backscatter Vertical Profile of a Pine Forest Using Single Baseline P-Band (Pol-)InSAR Data. IEEE Trans. Geosci. Remote Sens. 2010, 48, 3340–3348. [Google Scholar] [CrossRef]
- Garestier, F.; Toan, T.L. Forest Modeling For Height Inversion Using Single-Baseline InSAR/Pol-InSAR Data. IEEE Trans. Geosci. Remote Sens. 2009, 48, 1528–1539. [Google Scholar] [CrossRef]
- Tebaldini, S.; Rocca, F. Multibaseline Polarimetric SAR Tomography of a Boreal Forest at P- and L-Bands. IEEE Trans. Geosci. Remote Sens. 2012, 50, 232–246. [Google Scholar] [CrossRef]
- Nannini, M.; Scheiber, R.; Moreira, A. Estimation of the Minimum Number of Tracks for SAR Tomography. IEEE Trans. Geosci. Remote Sens. 2009, 47, 531–543. [Google Scholar] [CrossRef]
- Cloude, S.R. Polarization coherence tomography. Radio Sci. 2006, 41, 1–27. [Google Scholar] [CrossRef]
- Cloude, S.R. Dual-Baseline Coherence Tomography. IEEE Geosci. Remote Sens. Lett. 2007, 4, 127–131. [Google Scholar] [CrossRef]
- Kugler, F.; Lee, S.K.; Papathanassiou, K.P. Estimation of forest vertical sructure parameter by means of multi-baseline Pol-InSAR. In Proceedings of the IEEE International Geoscience & Remote Sensing Symposium, Cape Town, South Africa, 12–17 July 2009; p. 4. [Google Scholar]
- Zhang, B.; Fu, H.; Zhu, J.; Peng, X.; Xie, Q.; Lin, D.; Liu, Z. A Multibaseline PolInSAR Forest Height Inversion Model Based on Fourier–Legendre Polynomials. IEEE Geosci. Remote Sens. Lett. 2020, 18, 687–691. [Google Scholar] [CrossRef]
- Fatoyinbo, T.; Armston, J.; Simard, M.; Saatchi, S.; Denbina, M.; Lavalle, M.; Hofton, H.; Tang, H.; Marselis, S.; Pinto, N.; et al. The NASA AfriSAR campaign: Airborne SAR and LiDAR measurements of tropical forest structure and biomass in support of current and future space missions. Remote Sens. Environ. 2021, 264, 112533. [Google Scholar] [CrossRef]
- Denbina, M.; Simard, M.; Hawkins, B. Forest height estimation using multibaseline PolInSAR and sparse LiDAR data fusion. IEEE J. Sel. Top. Appl. Earth Obs. Remote Sens. 2018, 11, 3415–3433. [Google Scholar] [CrossRef]
- Shi, Y.; He, B.; Liao, Z. An improved dual-baseline PolInSAR method for forest height inversion. Int. J. Appl. Earth Obs. 2021, 103, 102483. [Google Scholar] [CrossRef]
- Treuhaft, R.N.; Madsen, S.N.; Moghaddam, M.; Zyl, J. Vegetation characteristics and underlying topography from interferometric radar. Radio Sci. 1996, 31, 1449–1485. [Google Scholar] [CrossRef]
- Zhang, H.; Ma, P.; Wang, C. A New Function Expansion for Polarization Coherence Tomography. IEEE Geosci. Remote Sens. Lett. 2012, 9, 891–895. [Google Scholar] [CrossRef]
- Schlund, M.; Baron, D.; Magdon, P.; Erasmi, S. Canopy penetration depth estimation with TanDEM-X and its compensation in temperate forests. ISPRS J. Photogramm. Remote Sens. 2019, 147, 232–241. [Google Scholar] [CrossRef]
Disclaimer/Publisher’s Note: The statements, opinions and data contained in all publications are solely those of the individual author(s) and contributor(s) and not of MDPI and/or the editor(s). MDPI and/or the editor(s) disclaim responsibility for any injury to people or property resulting from any ideas, methods, instructions or products referred to in the content. |
© 2023 by the authors. Licensee MDPI, Basel, Switzerland. This article is an open access article distributed under the terms and conditions of the Creative Commons Attribution (CC BY) license (https://creativecommons.org/licenses/by/4.0/).