Article

Constructing Coupling Model of Generalized B-Spline Curve and Crown (CMGBCC) to Explore the 3D Modeling of Chinese Fir Polymorphism

1
Institute of Forest Resource Information Techniques, Chinese Academy of Forestry, Beijing 100091, China
2
Key Laboratory of Forest Management and Growth Modelling, NFGA, Beijing 100091, China
3
National Long Term Scientific Research Base of Huangfengqiao Forest Monitoring and Simulation in Hunan Province, Beijing 100091, China
*
Author to whom correspondence should be addressed.
Forests 2023, 14(6), 1267; https://doi.org/10.3390/f14061267
Submission received: 16 January 2023 / Revised: 9 May 2023 / Accepted: 11 June 2023 / Published: 19 June 2023

Abstract

:
Crown simulation based on basis spline (b-spline) interpolation is a compatible method to simulate tree polymorphism at present. However, there are two problems when it simulates the crown: the first problem is that the derivative value at the top point needs to be given manually, and the second is that the type of value point needs to be collected equidistantly. To solve the above problems and realize convenient and accurate tree polymorphism simulation, this study took Chinese fir as the study object, set the crown morphological feature as the model value point, and constructed a coupling model of generalized B-spline curve and crown (CMGBCC) as the constraint condition of the crown shape to simulate the polymorphism in the process of a tree three-dimensional (3D) model. The position and size of the distribution on the 3D model of the branches were constrained by the curve, and the 3D modeling of a Chinese fir polymorphism was constructed. According to the collection of Chinese fir-type value points in the sample plot, the study realized the detailed types of value points’ precise simulation for three polymorphisms of the Chinese fir crown, including natural pruning, crown displacement, and crown shape difference. At the same time, the different withered existence states of the branches were considered preliminarily. Compared to the 3D model with the field survey data, indicating that constructed models could simulate the difference in tree crown morphology precisely, the branch models were separated by convenience to simulate the process of Chinese fir growth. In the process of construction, CMGBCC did not need to add the derivative value in a manual way and could collect the type of value points according to the characteristics of the crown morphological changes completely. Compared to the results of the crown curve constructed, which were based on generalized B-spline (GB-spline) interpolation and b-spline interpolation, it showed that the number of crown value points collected by the GB-spline interpolation method decreased by 18% on average. The precision of the crown shape constraint was improved by 7.63% compared to b-spline interpolation. The 3D modeling of tree polymorphism was combined with the relationship between tree morphology and environment. At the same time, it was convenient to simulate the behavior of forest management measures, such as pruning.

1. Introduction

The three-dimensional (3D) modeling of trees is the 3D construction process for tree morphological structures. In general, the morphological structure of trees with the same species follows a common feature. However, for each individual, the influences from the surrounding environment are different: the morphology of the individual has different manifestations, such as natural pruning [1,2], crown displacement [3,4], and crown shape difference: these are important manifestations of a tree 3D model polymorphism. Meanwhile, in the process of 3D modeling, the expression of the interaction between the morphological structure and environment is limited by tree polymorphism.
Relevant studies have shown that spatial factors such as stand density and space competition have a direct impact on tree crown morphology [1,5]. Air pollution has an inhibitory effect on growth, thereby affecting the morphological structure [6]. Climatic factors such as light, drought, and temperature also influence the morphological structure by interfering with the growth rate further [7,8,9]. In addition, other factors such as topography and altitude can influence the growth and change the tree morphology through differences in soil water content [10]. In summary, the tree’s morphological structure is influenced by various environmental stress factors. The mechanisms of these various factors overlap and intersect with each other. The spatial structure can comprehensively reflect the effects of various environmental factors, such as spatial competition, light, and terrain, on the crown’s morphological structure [11,12,13,14]. Therefore, this study combined the spatial structure to explore the performance of tree polymorphism.
At present, for the 3D modeling research of tree polymorphism, Ma et al. used to age and spatial structure parameters as variables to construct an under branch height (UBH) model, simulating the occurrence process of natural pruning through the tree growth visual simulation and constrained crown contour based on basis spline (b-spline) interpolation [15]. Subsequently, researchers constructed a UBH model based on spatial structure parameters and tree heights to simulate natural pruning with the influence of different spatial structures [16,17]. For the whole crown shape, current research has mainly utilized the crown curve for constraint simulation [18,19], including the crown curve power function (POW) [20] and spline interpolation [15]. The shape value points were substituted into those two functions to fit the crown’s outer contour shape. In addition, the effect of space resource competition on the tree branch growth, branch distribution, and crown shape was considered, and environmental factors were applied to express tree polymorphism [21]. Additionally, Palubicki et al. combined the lighting and plant growth mechanism to construct a 3D tree model [22]. These studies explored tree polymorphism and polymorphism modeling from different perspectives.
Indeed, evidence exists that Chinese fir is a uniaxially branched conifer species, and its crown morphology exhibits different characteristics at different ages. The number of branches, length, angle, and distribution structure of branches all follow certain rules [23]. This morphological structure is affected by the environment, showing an irregular diversity, which is suitable for polymorphism 3D modeling research. With the introduction of a generalized B-spline (GB-spline) curve, the accuracy of Chinese fir’s crown shape simulation was improved; b-spline interpolation is one of the most popular methods, which must input an equal distance of type value points.
The main objective of this study was twofold: (1) To construct a 3D Chinese fir polymorphism model (3D-CFPM) to predict tree morphological structures using detailed shape point data (tree height, crown width, UBH, height at the maximum crown width (HMCW) and other crown shape mutation points) of the sample plot survey; (2) to explore a GB-spline curve when constructing a coupling model of a generalized B-spline curve and crown (CMGBCC), and simulating the different Chinese fir crown shape polymorphisms under natural pruning, crown displacement, and crown shape differences. These results were validated by the existing b-spline curve and instrument field measurement to verify the effectiveness of CMGBCC when constraining the Chinese fir crown shape.

2. Materials and Methods
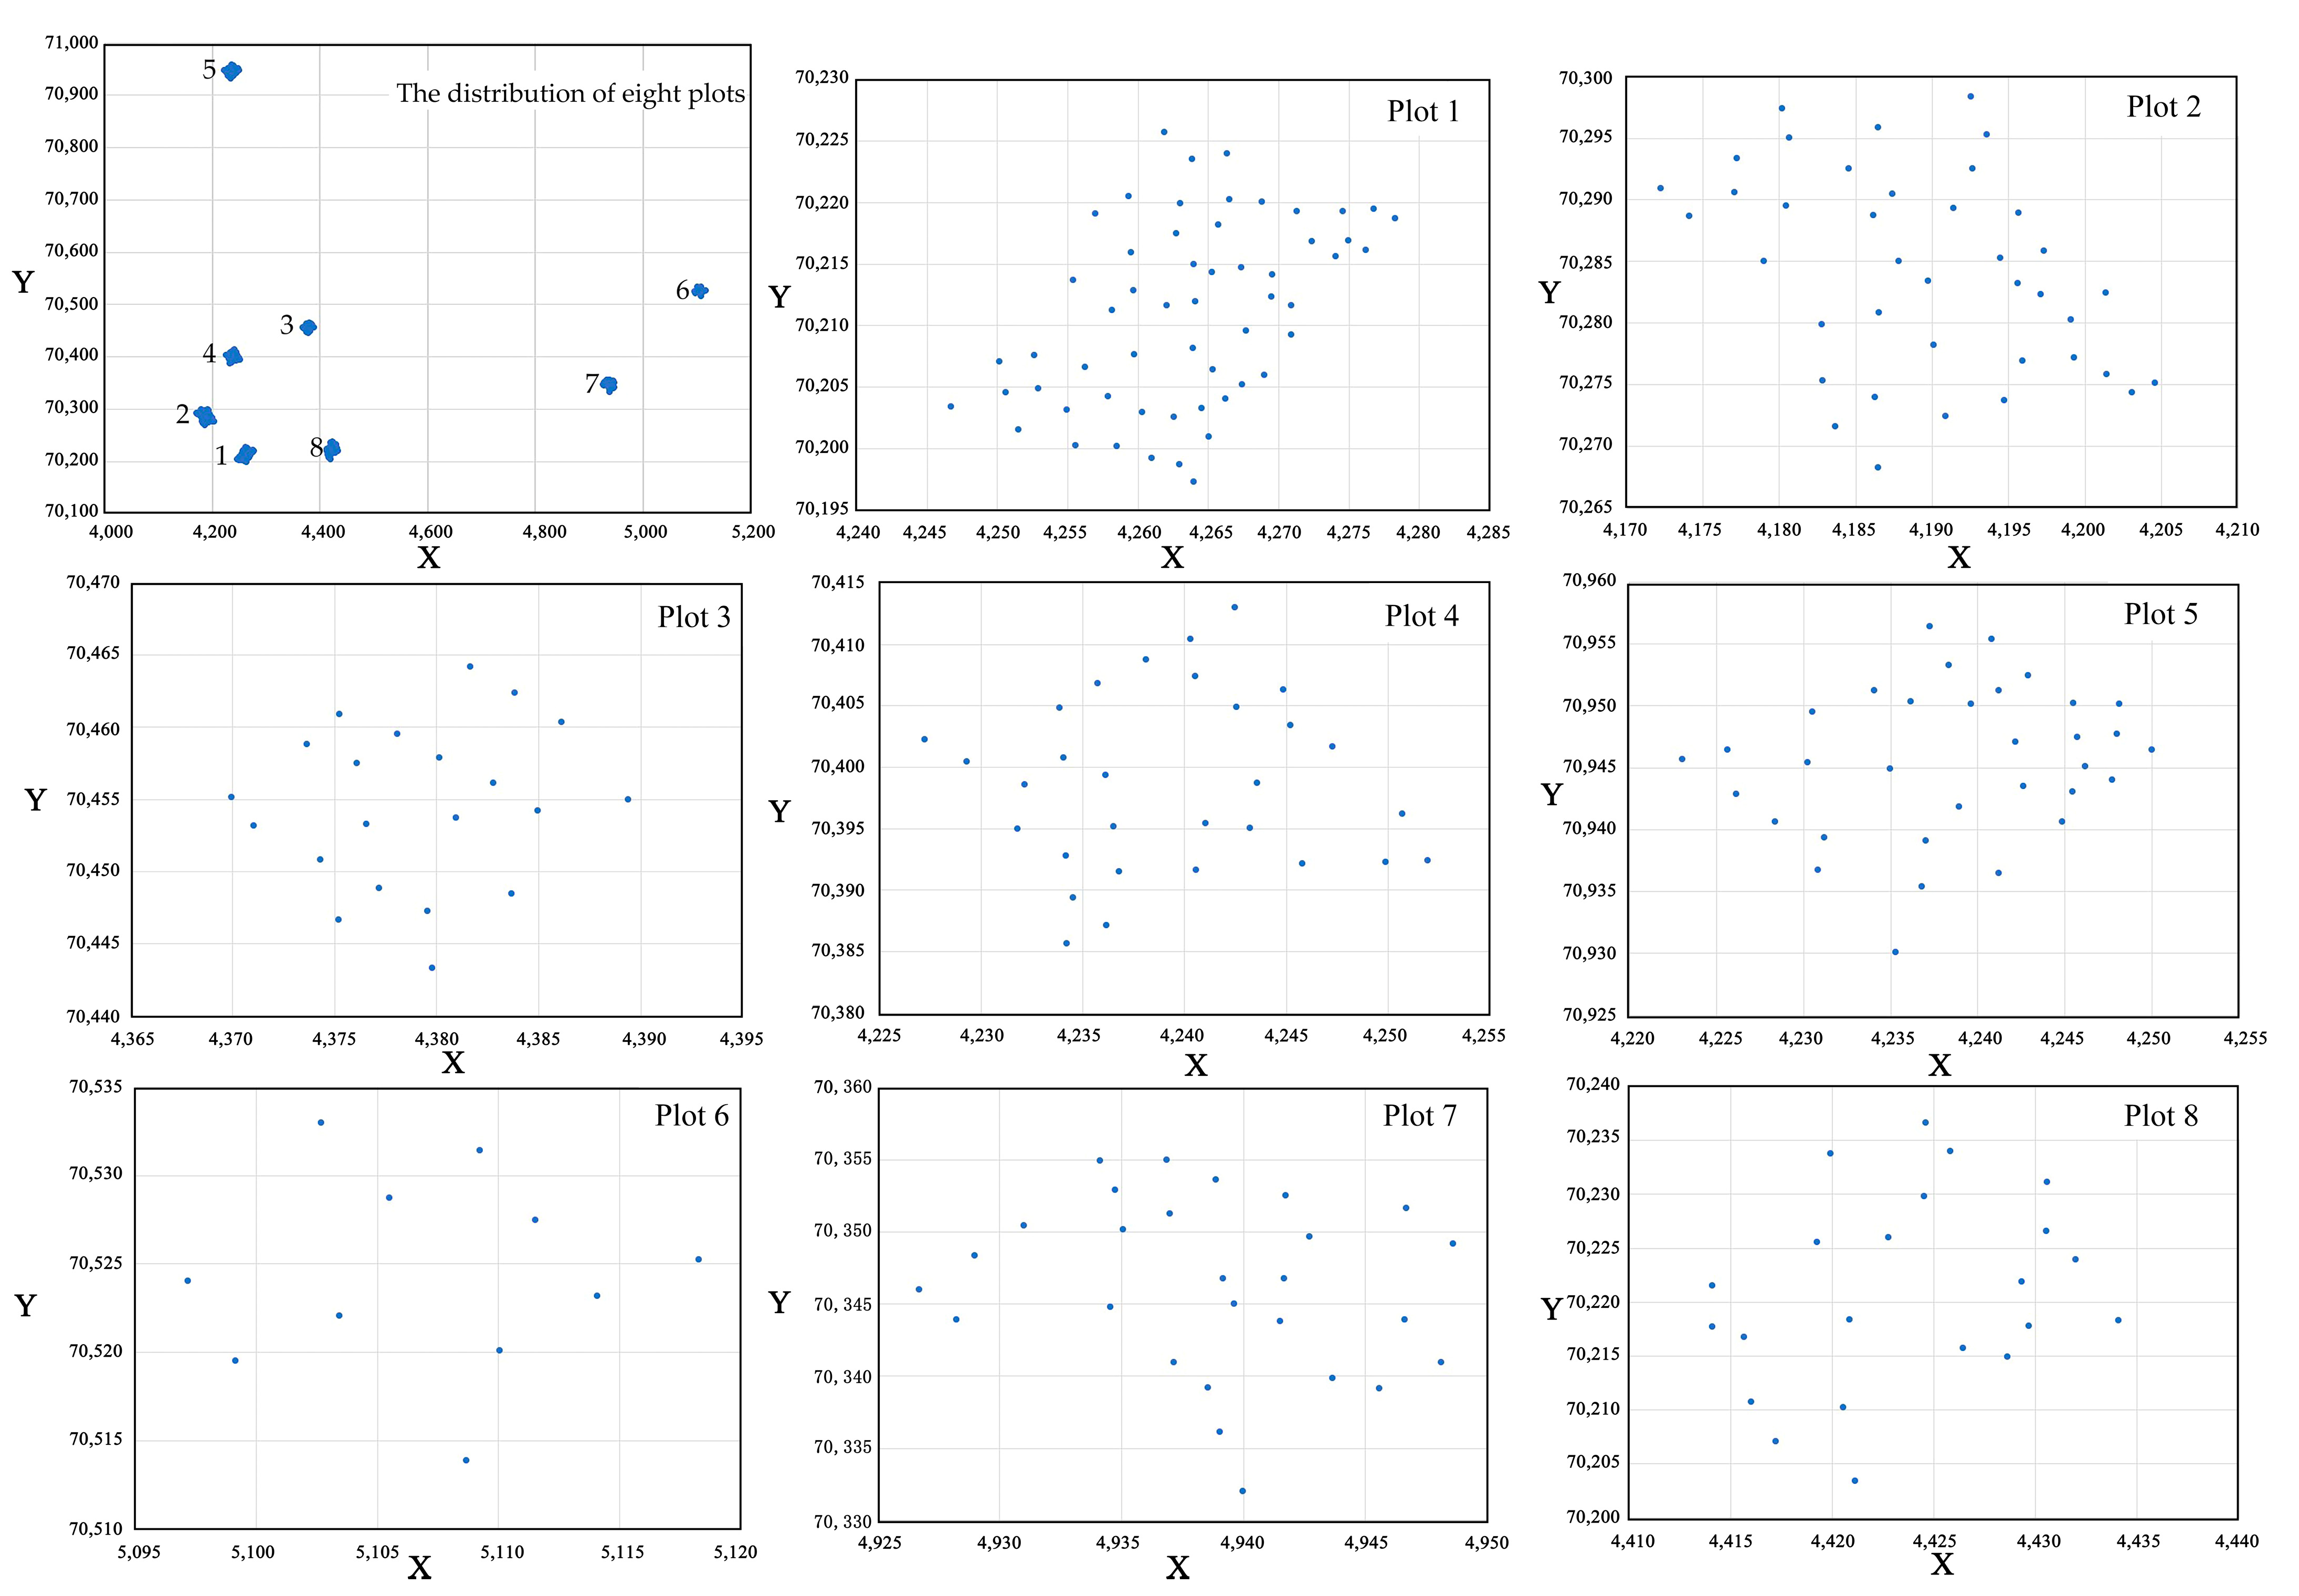
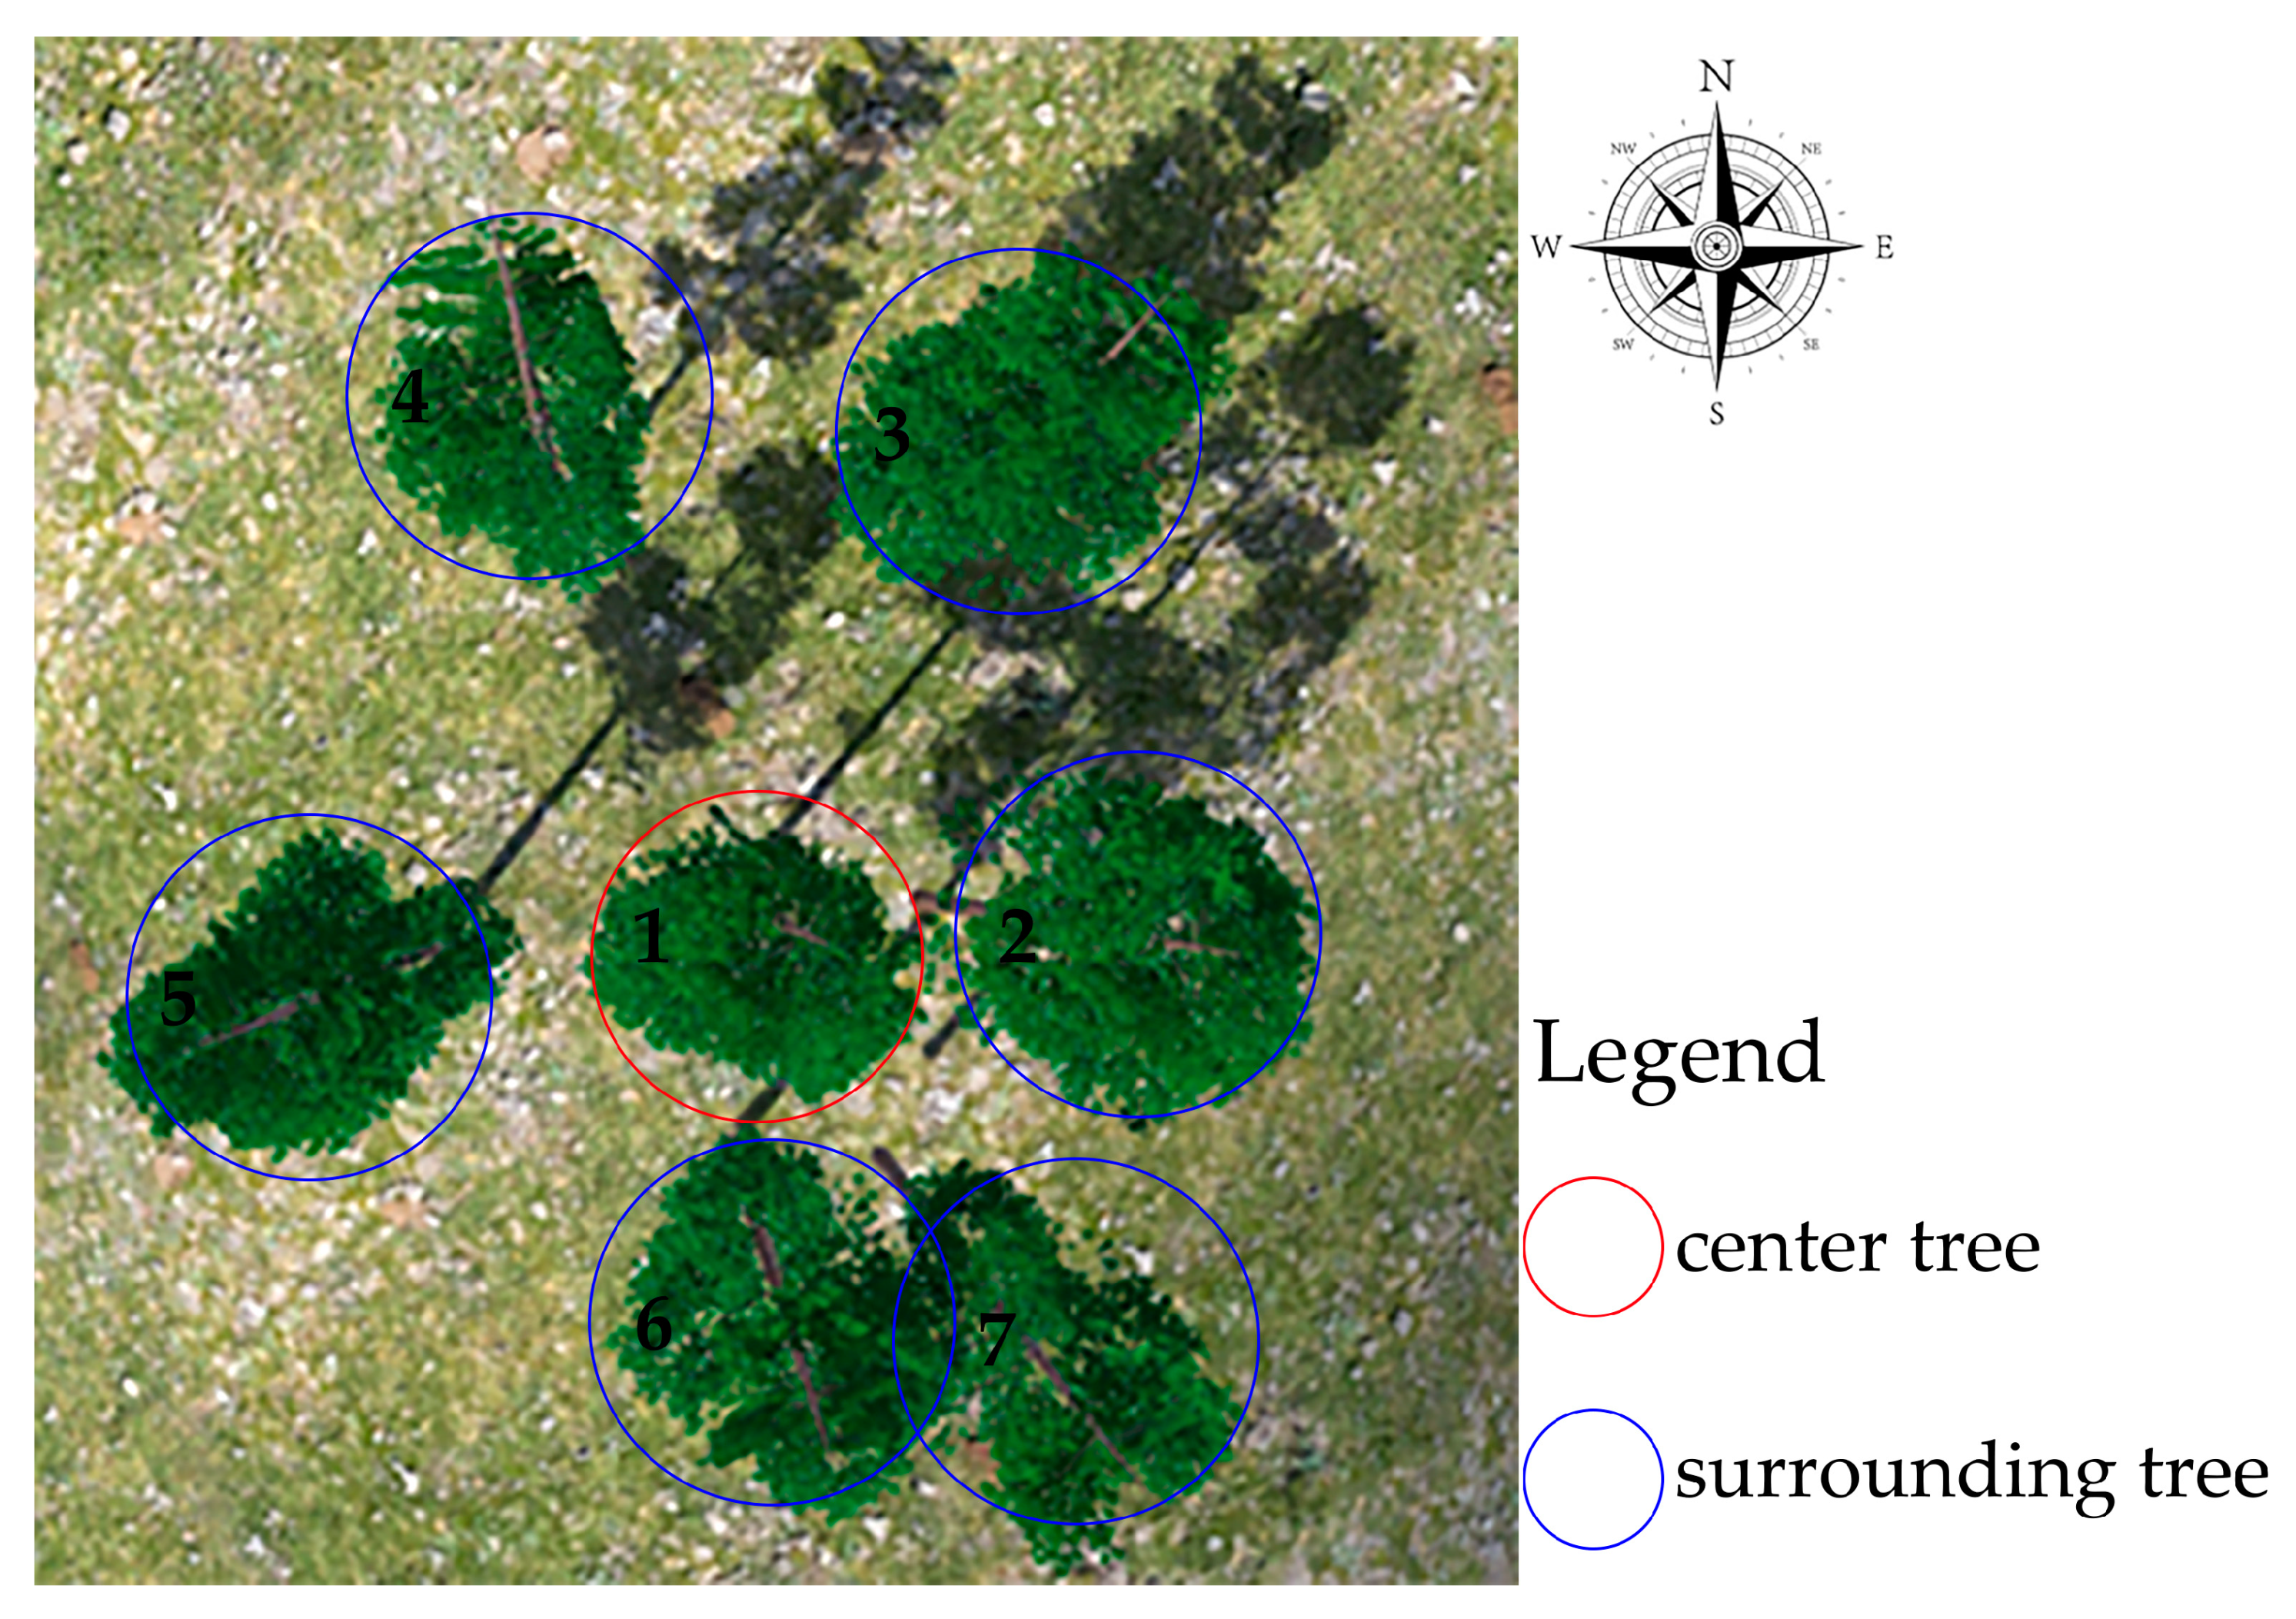
2.1. Data

All fieldwork was conducted at the Chinese fir plantation area in the Shanxia Forest Farm of the Subtropical Forestry Experiment Center, Jiangxi Province, China (114°37′~114°41′ E, 27°43′~27°46′ N, 85~300 m altitude). It belongs to the terrain of the low hill, with an average annual temperature of about 17.5 °C and an annual rainfall of 1100–1700 mm, belonging to a subtropical monsoon humid climate. Considering the influence of spatial structure and age on the trees’ morphological structure, a total of 239 Chinese firs in 8 plots of 20 m × 20 m were selected for data collection. The selected range had an age span of 12–30 years and different stand densities. The relative position of each Chinese fir was measured in the sample plot to analyze its spatial structure; the basic type of value points was measured for each tree, including tree height, diameter at breast height (DBH), and crown width in different directions (include four directions: east, west, south, north), UBH, and HMCW. Additionally, based on the measurement of the crown morphological mutation points of each tree, detailed type value points were obtained. The distribution of eight plots and the distribution of trees in each plot were as shown in Figure 1.
The data statistics of the basic type of value points for trees in the sample plot are shown in Table 1. Number 1–8 are eight plots’ reference which are measured.

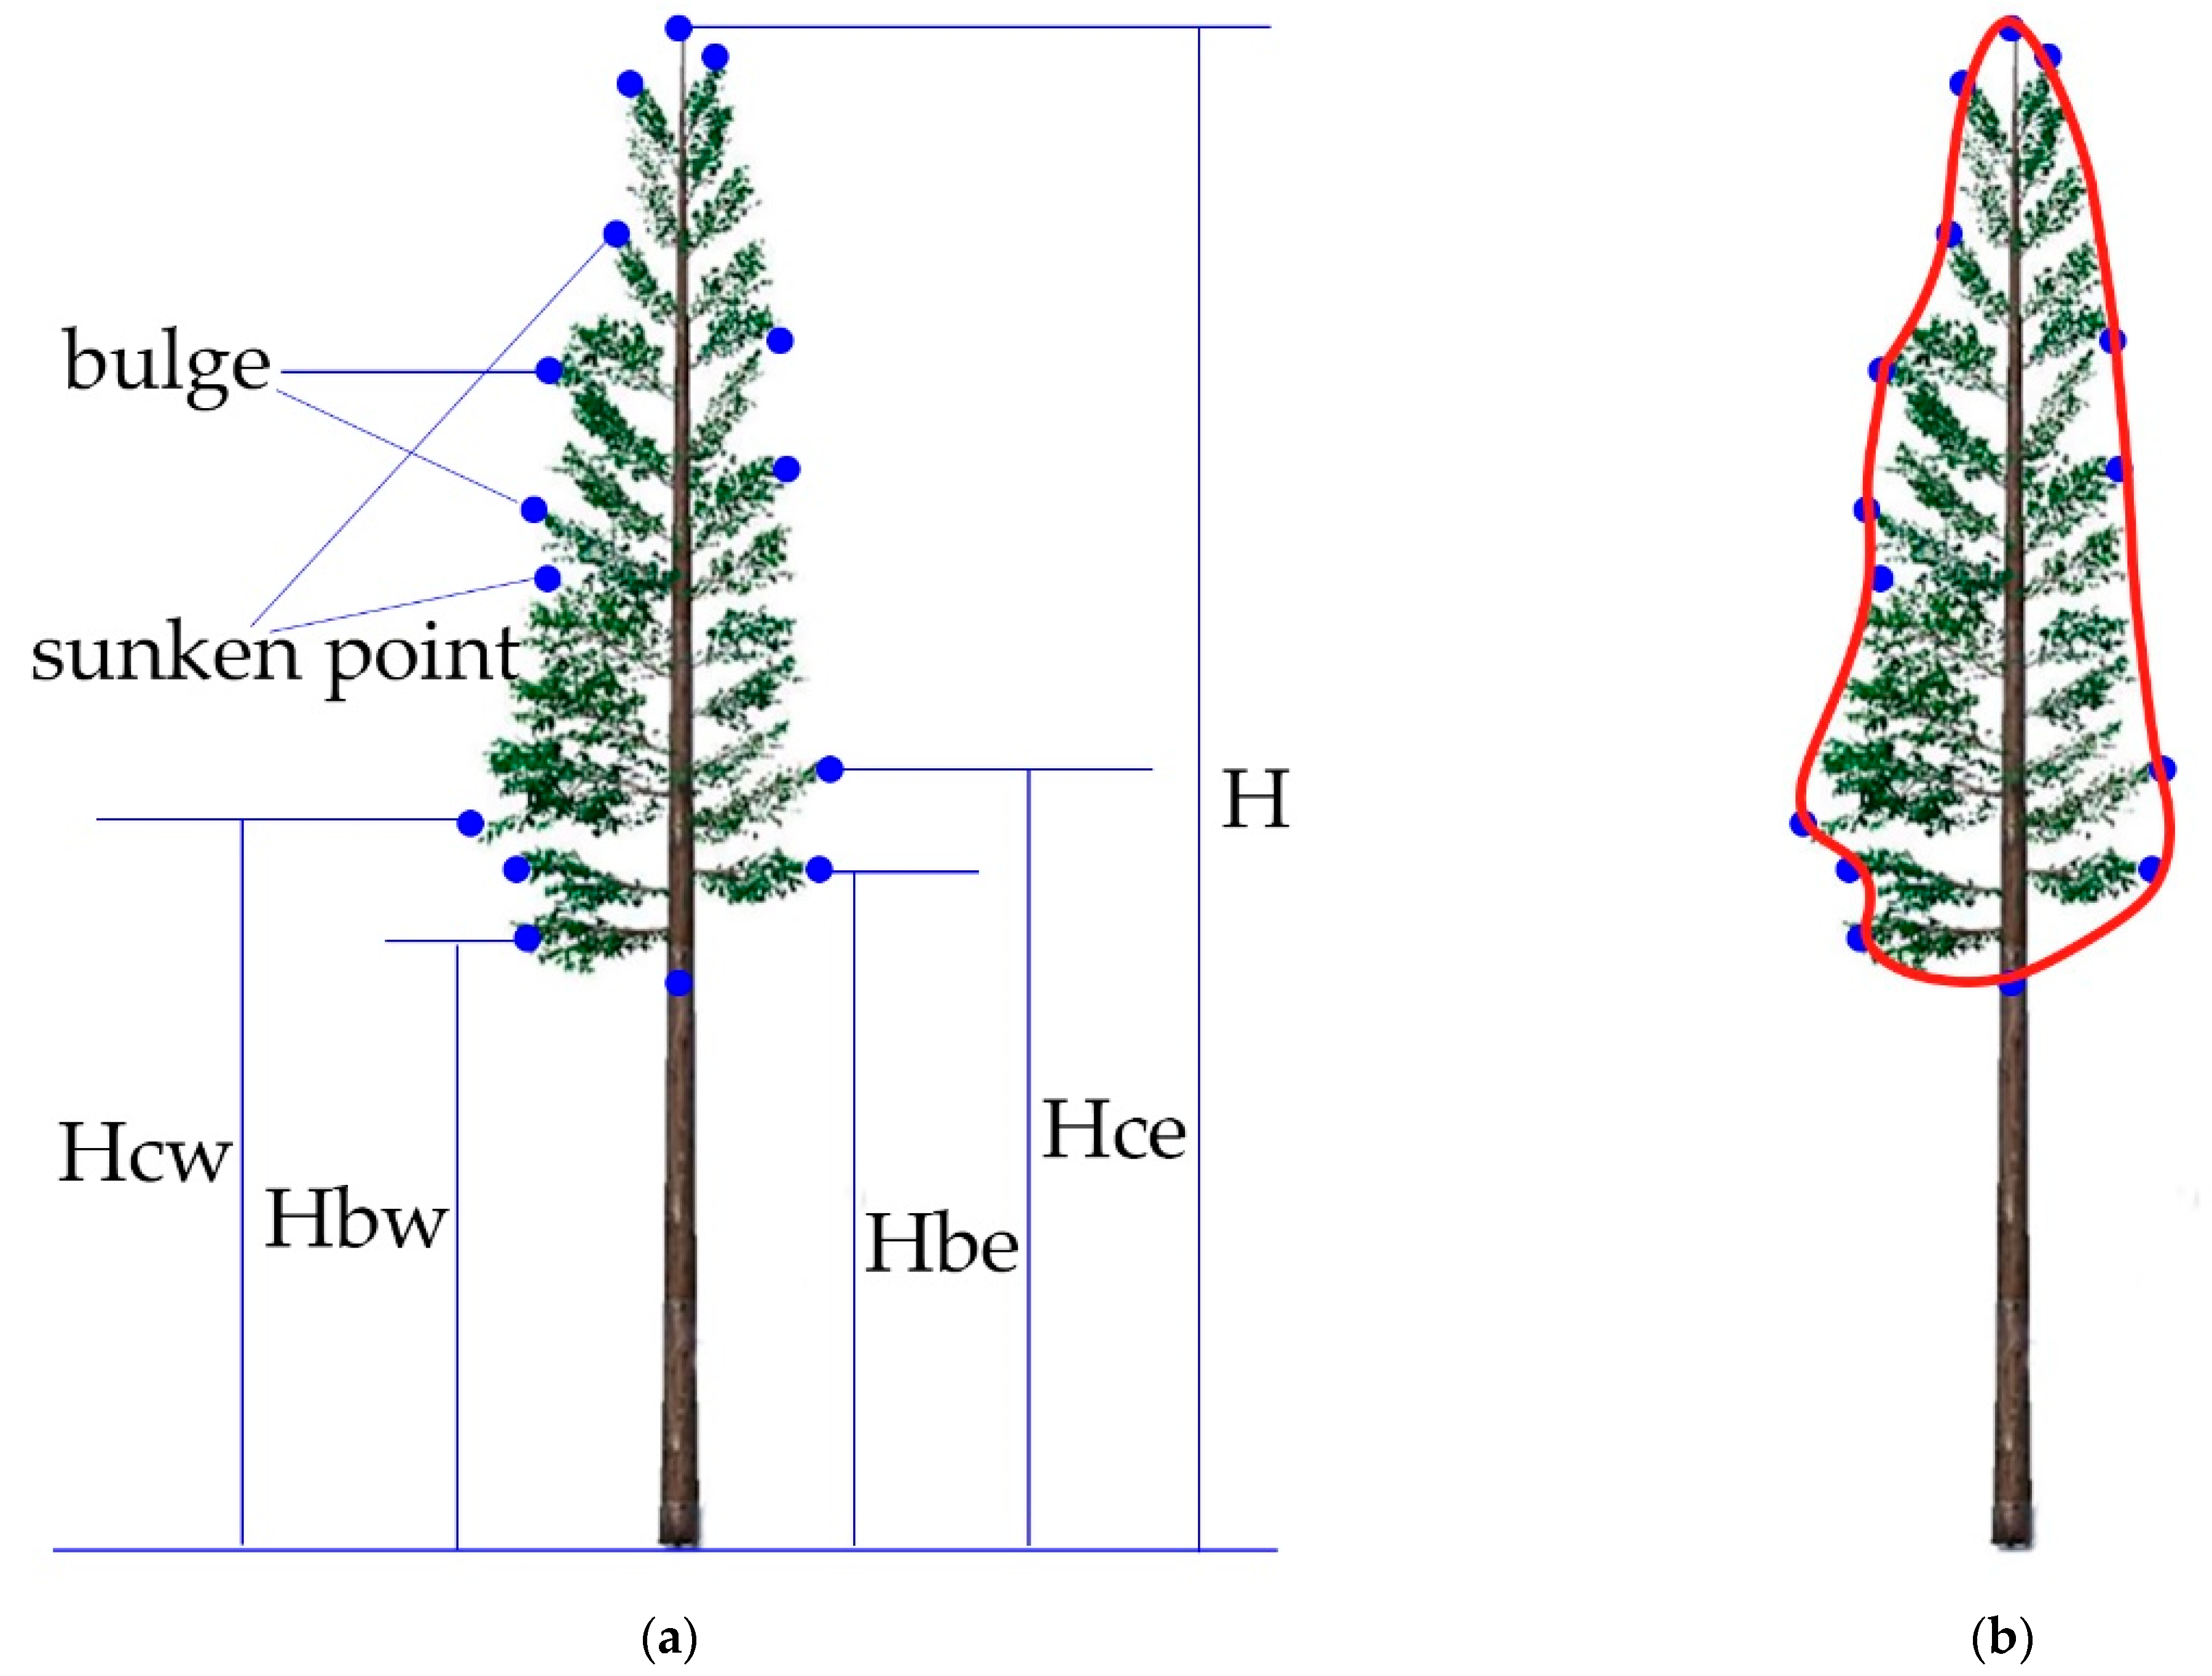
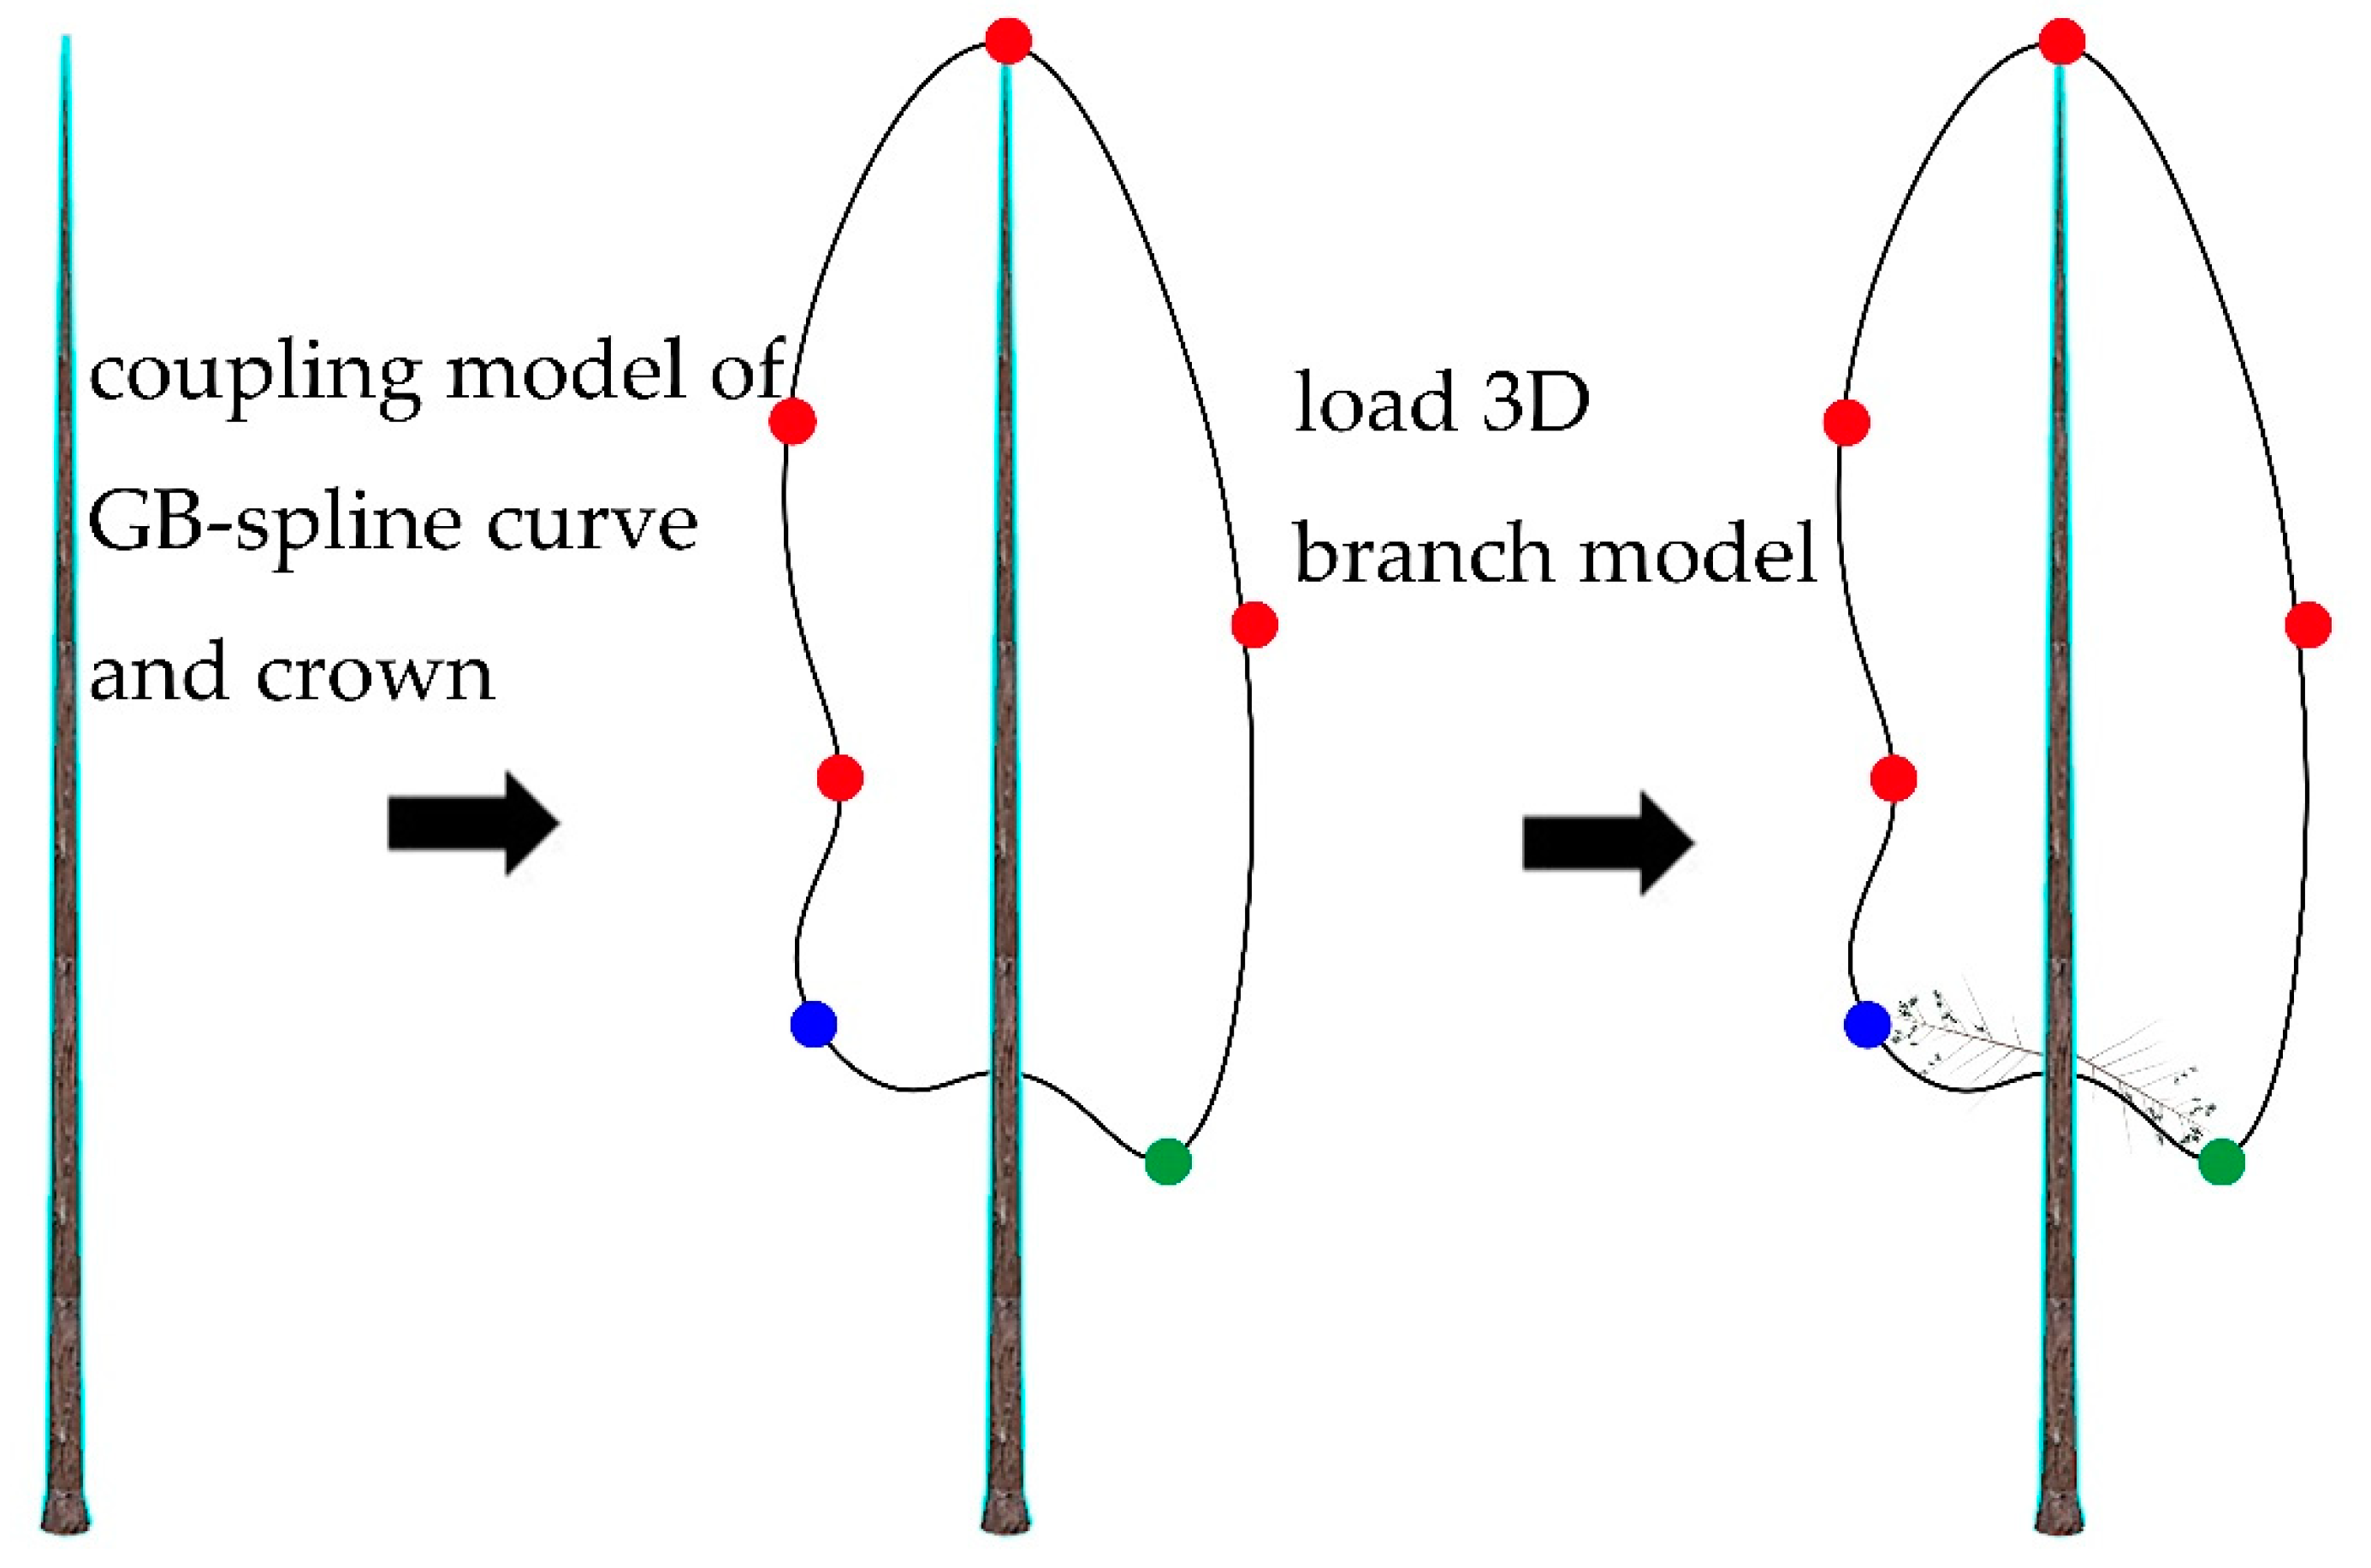
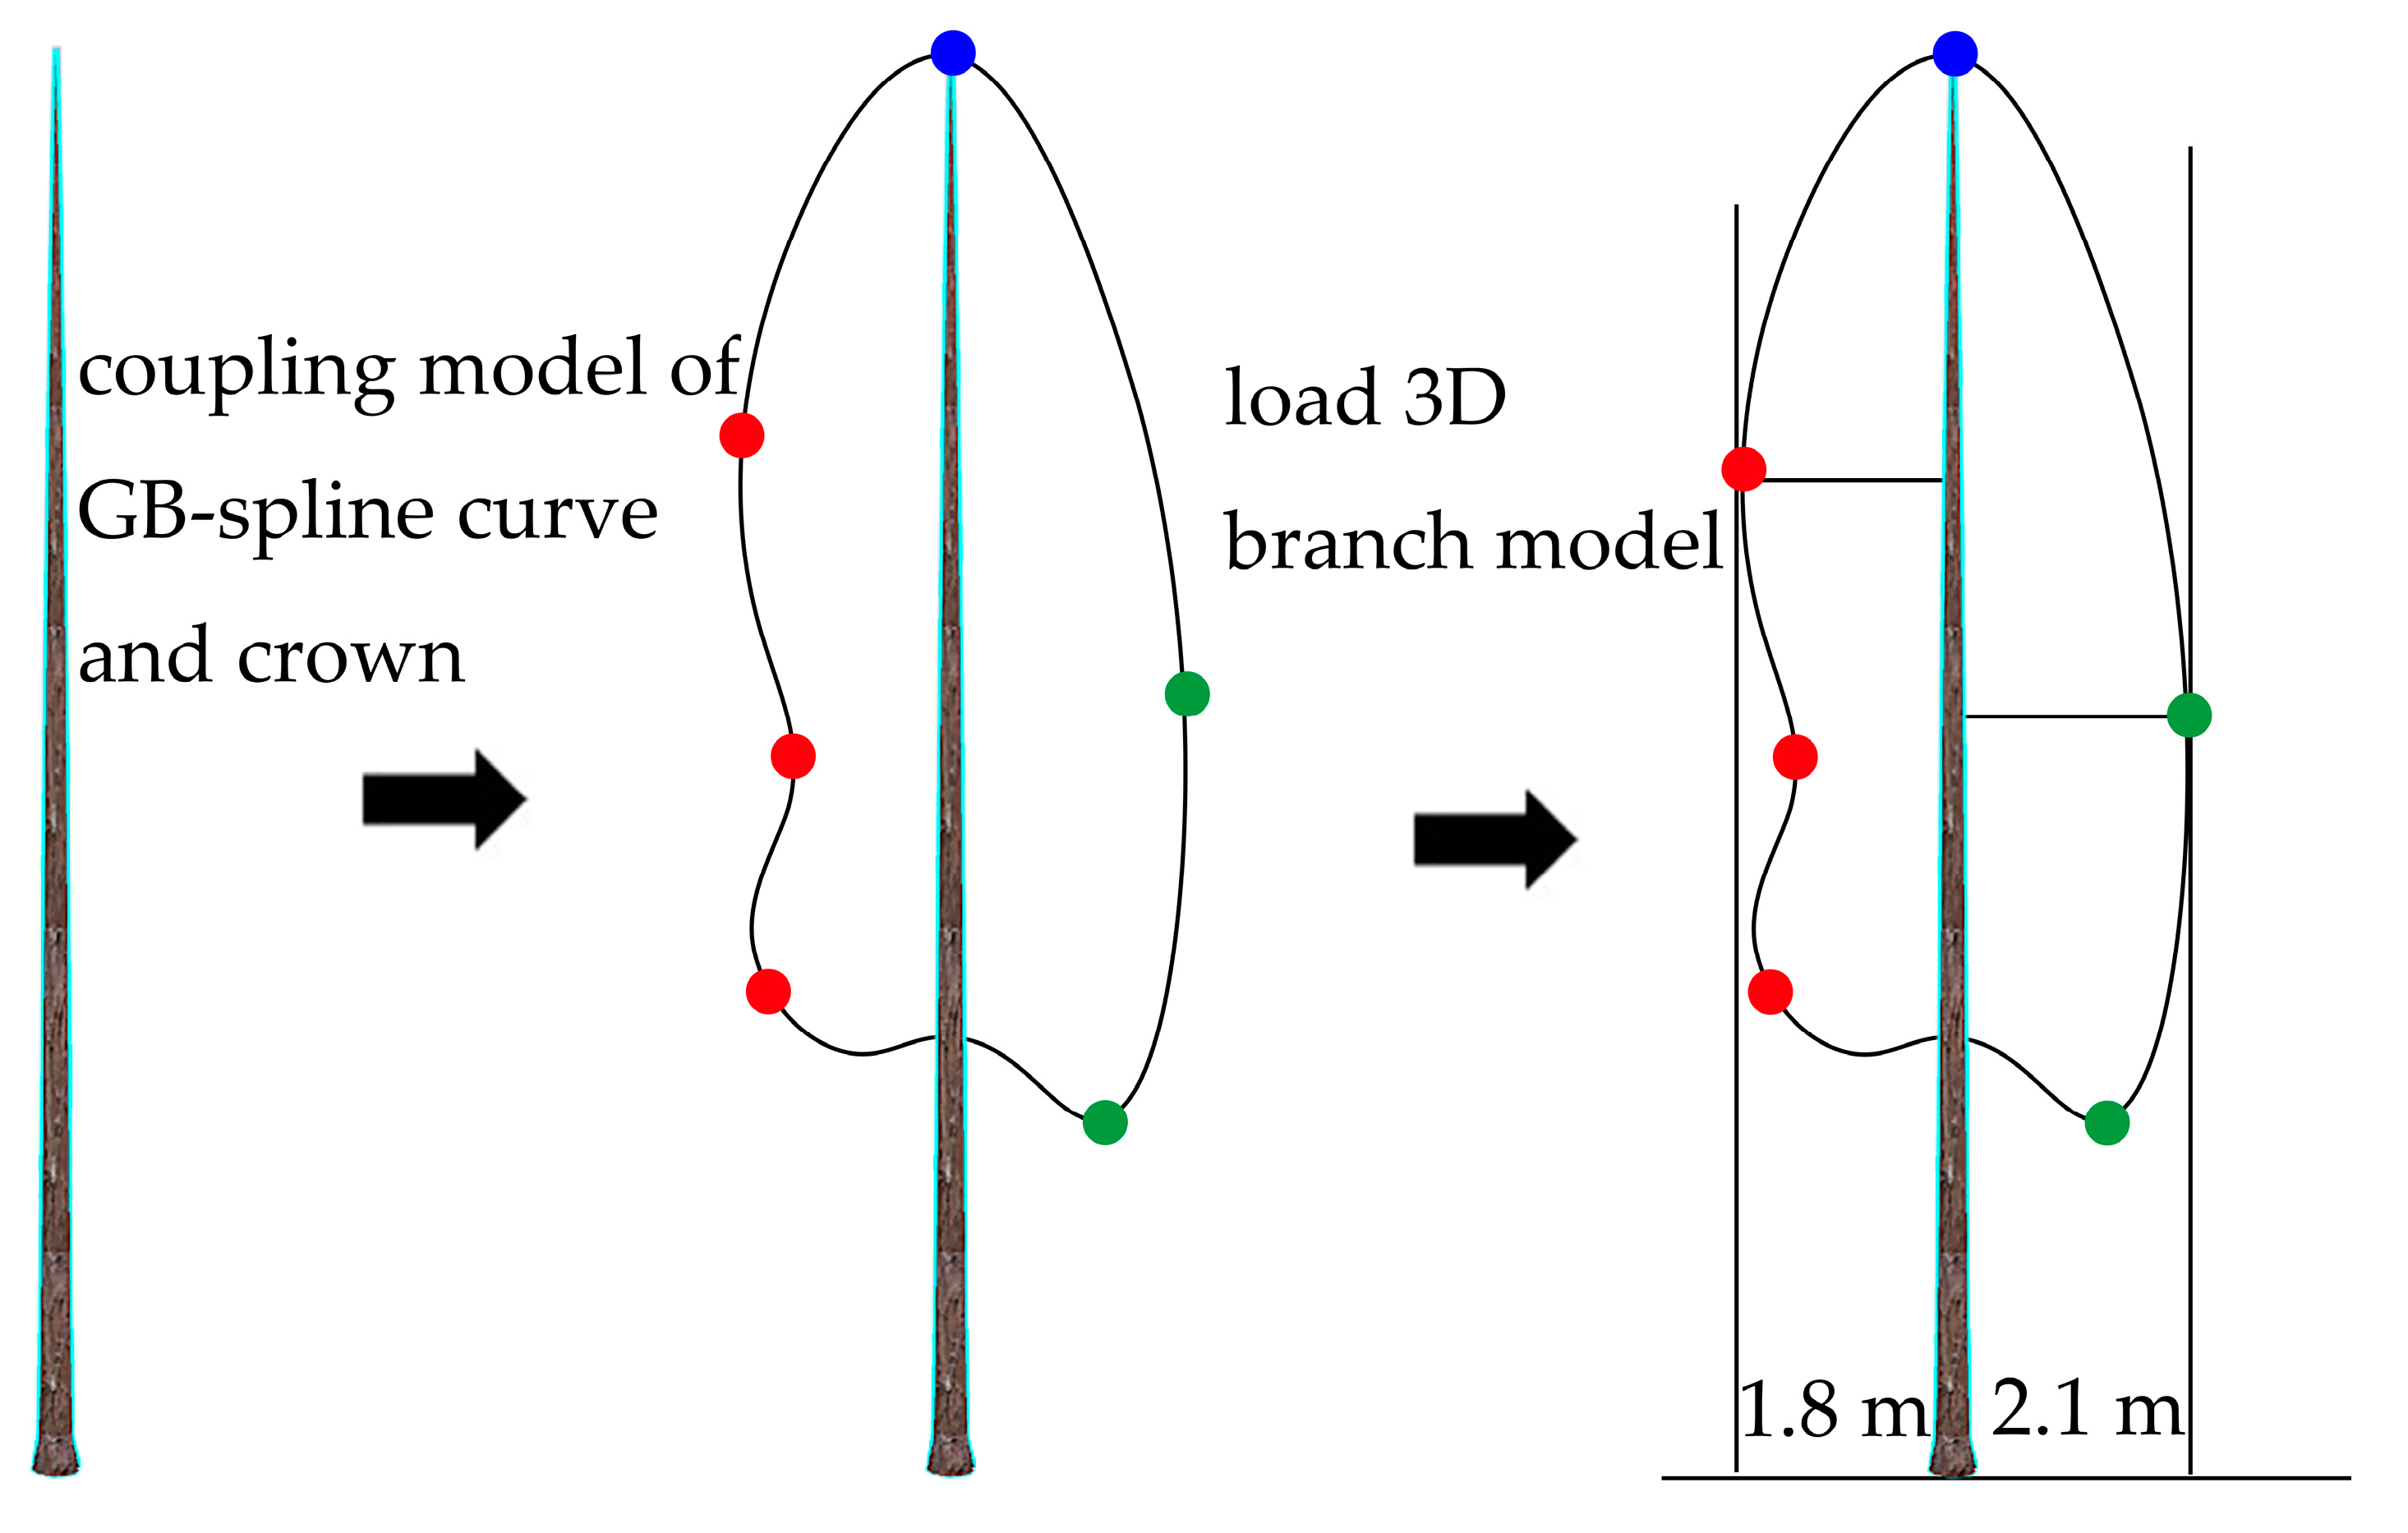
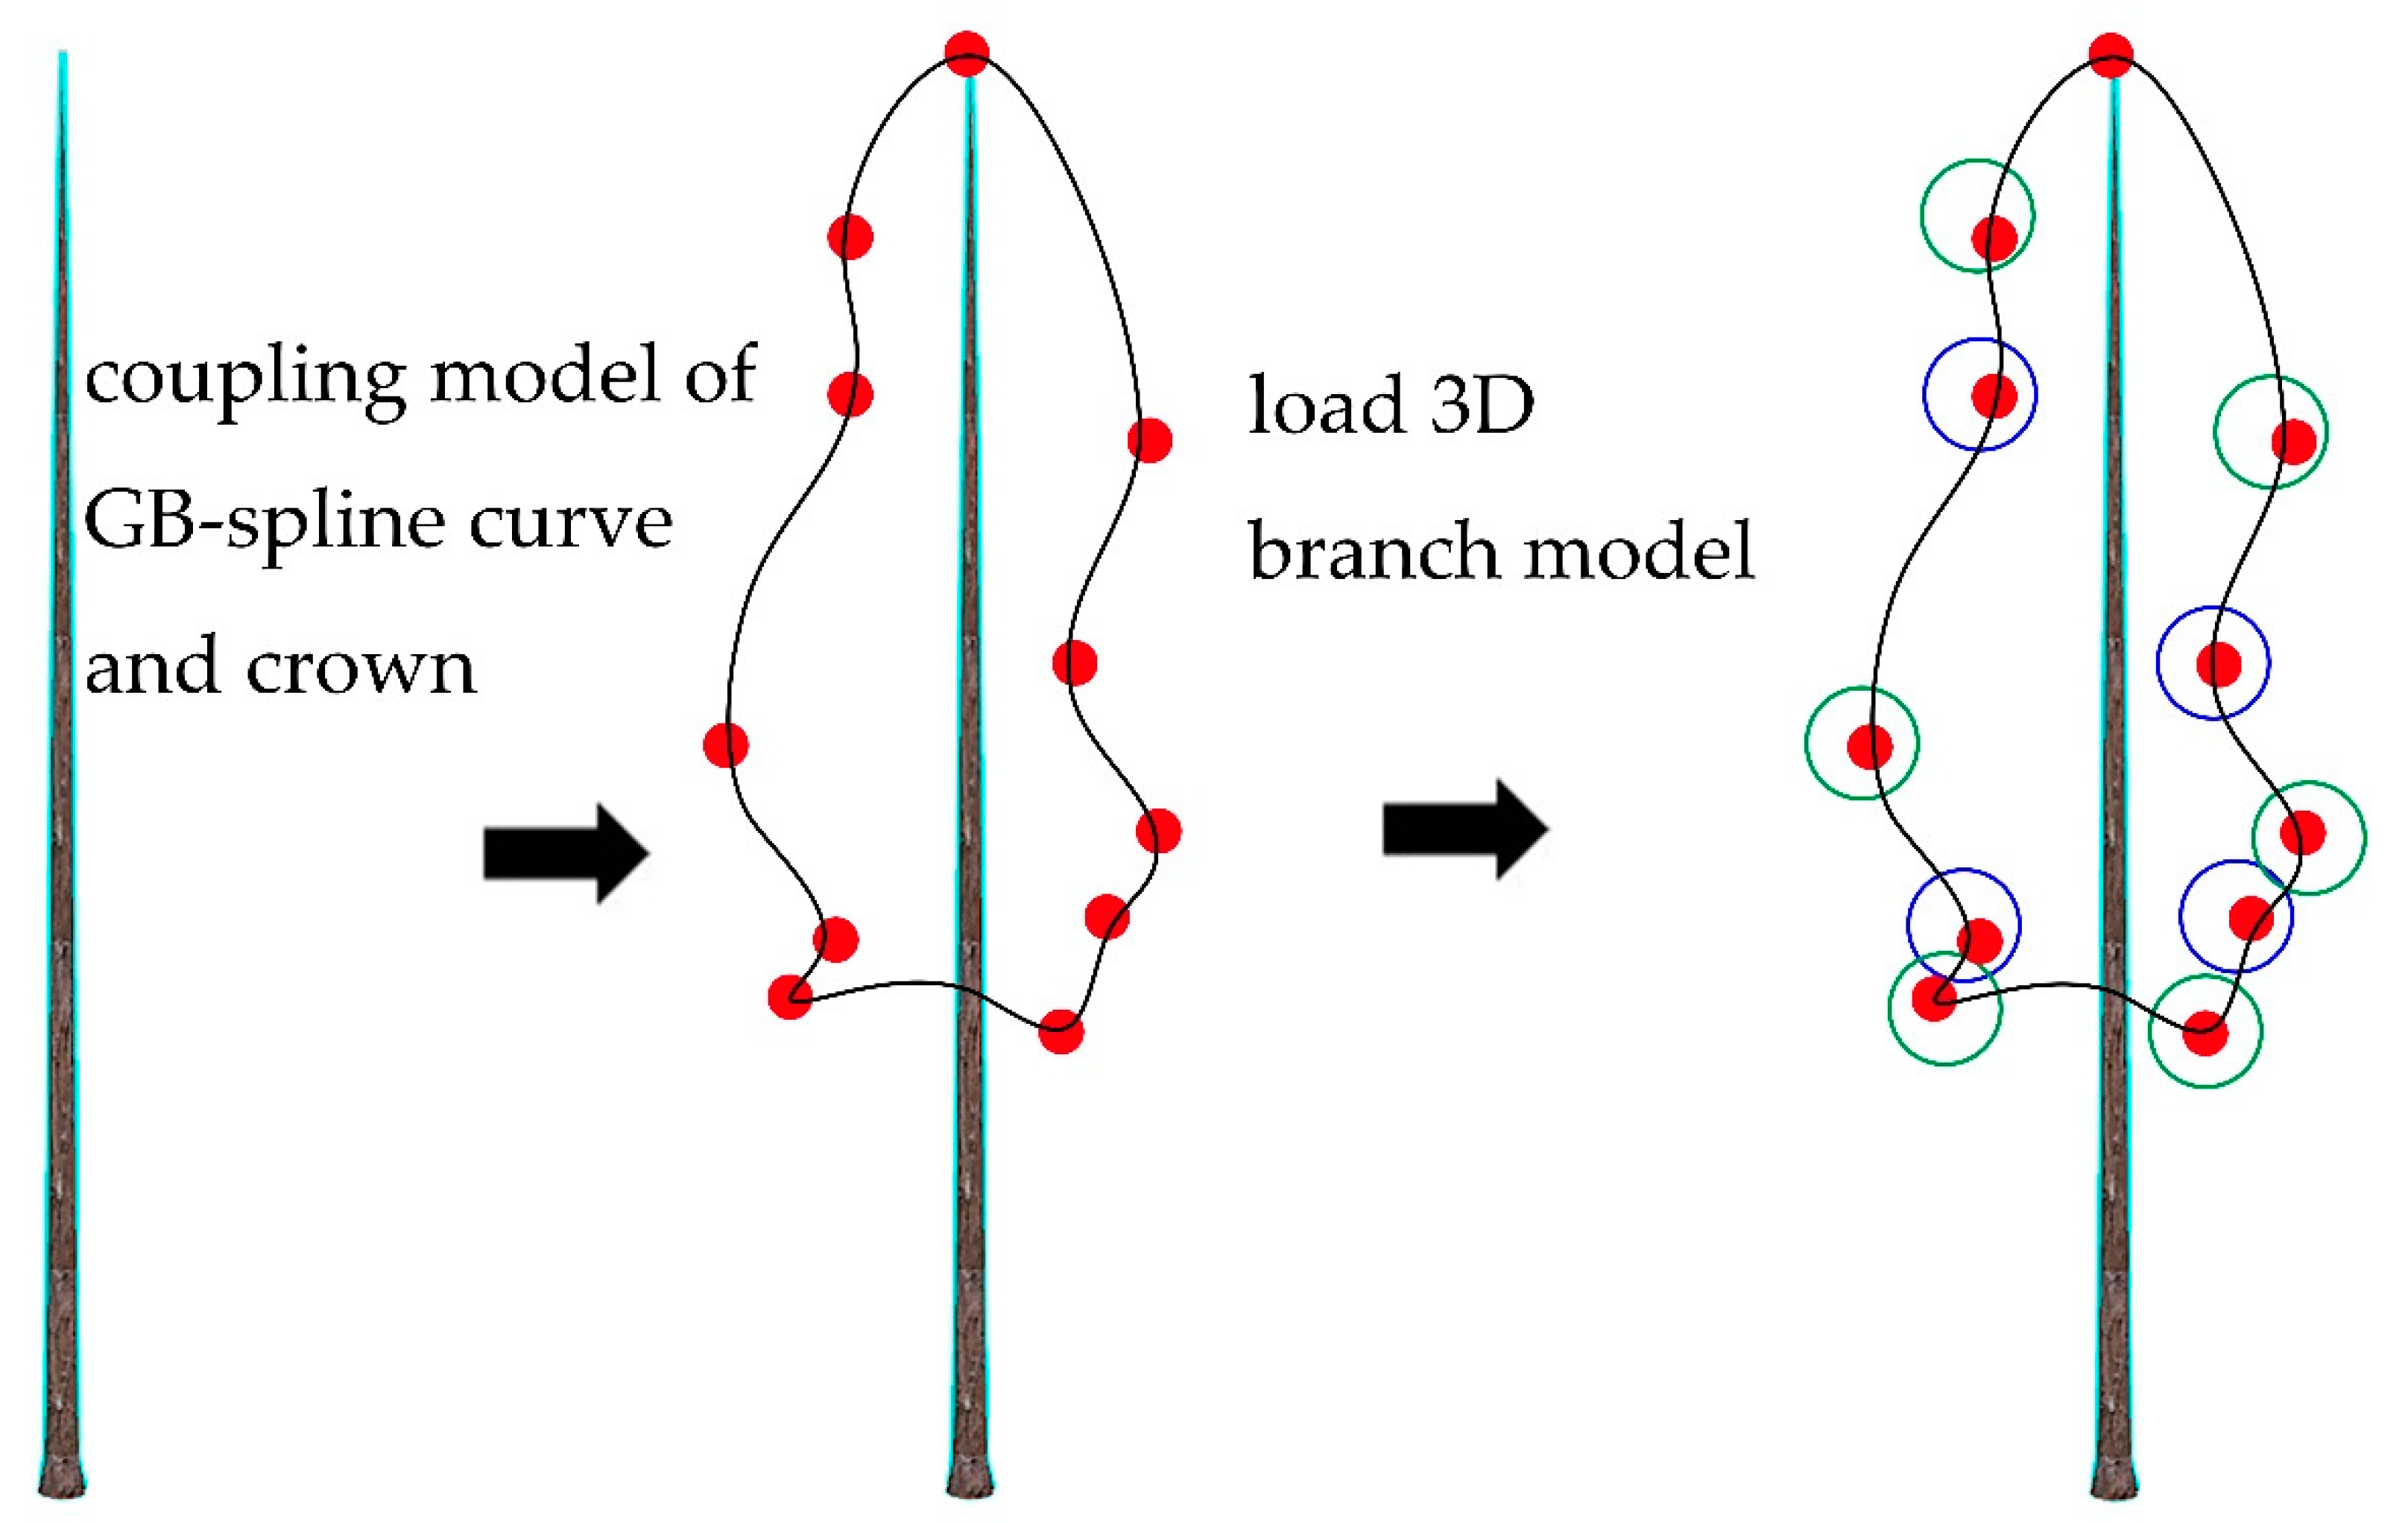
2.2. Constructing CMGBCC

B-spline interpolation is a commonly used interpolation function for fitting the shape and outline of objects [24,25,26,27], which has good local controllability. The crown curve is a function curve that describes the outer contour of the tree crown. Ma built the crown curve of the Chinese fir based on b-spline interpolation in the B-spline interpolation. Compared with the interpolation methods such as POW, it was suitable for expressing the irregularity of the crown [15]. However, the b-spline interpolation to construct the crown curve has certain defects; these include the fact that the derivative value at the top point of the tree is unknown, and the crown value point collection needs to meet the equidistant collection during fitting. Regarding these two defects, the former causes the need to increase the artificial input parameter values in the process of constructing the crown curve, which cannot effectively confirm the rationality of the parameter values; while the equidistant collection type value points greatly limit the record, the position of the crown shape changes, which may cause the simulation results to under-represent the crown’s morphology. Therefore, based on the b-spline interpolation to construct the crown curve, this study introduced the periodic basis spline (pb-spline) and GB-spline interpolation into the study of crown curve construction to solve the current shortcomings gradually.
Owing to the fact that the envelope range of the crown curve was the outer contour of the longitudinal section of the tree crown, the endpoints at the top of the tree were continuous and closed. In the actual measurement, the slope at the top point of the tree was difficult to obtain accurately, and b-spline interpolation fitting could only be based on derivative values given empirically. The pb-spline interpolation did not need to provide this value; therefore, this study introduced pb-spline interpolation on the basis of b-spline.
Since the top point of the crown curve was closed and continuous, according to the characteristics of the continuous curve function, we could define the value of point a where the left curve approached the vertex as f(a), and the value of point b where the right curve approached the vertex as f(b). The curve function f(x) was assumed as follows:
{ f ( a )   =   f ( b ) f ( a )   =   f ( b ) f ( a )   =   f ( b ) ,
The expression of the cubic polynomial: gk(t) of the k-th interpolation only related to the base point t and was expressed as:
g k ( t )   =   φ ( t t k h ) ,
where h is the max value of the interpolation of ti+1 and ti which are two adjacent points and φ(t) is the cubic b-spline system, the for which expression was:
φ ( t ) = 1 6 { ( t + 2 ) 3 t [ 2 , 1 ] 1 + 3 ( t + 1 ) + 3   ( t + 1 ) 2 3 ( t + 1 ) 3 t [ 1 , 0 ] 1 + 3 ( 1 t ) + 3 ( 1 t ) 2 3   ( 1 t ) 3 t [ 0 , 1 ] , 2 ( 2 t ) 3 t [ 1 , 2 ] 0 t     2
By combining the values of gi(t), g′i(t), and g″i(t) at each base point in Equation (1), the following conclusions could be drawn:
{ a 0 + 4 a 1 + a 2 = a n + 4 a n + 1 + a n + 2 a 0 a 2 = a n a n + 2 a 0 2 a 1 + a 2 = a n 2 a n + 1 + a n + 2 ,
where a0, a1, and a2 presented the three points on the left curve that approached the vertex. Additionally, an, an+1, and an+2 were three points on the right curve that approached the vertex.
Simultaneously, the three equations of Equation (4) could be solved:
{ a 0   =   a n a 1   =   a n + 1 a 2   =   a n + 2 ,
At this time, there were n unknown parameters of the b-spline and n linear equations:
[ 4 1 1 1 4 1 1 4 1 1 4 1 1 1 4 ] [ a 1 a 2 a 3 & a n 1 a n ] = 6 [ f 1 f 2 f 3 & f n 1 f n ] ,
Since the coefficient matrix of the equation system was a strongly dominant diagonal matrix, according to the relevant theorem of numerical calculation, the linear equation system had a unique solution. However, the coefficient matrix of this equation system did not satisfy the tridiagonal; therefore, the improved chasing method was used to solve it [28].
The introduction of pb-spline interpolation solved the problem of manually inputting the derivative value at the top point but did not solve the critical issue of the equidistant collection of type value points. Therefore, on this basis, the interpolation function was further improved to GB-spline interpolation, constructing CMGBCC.
For GB-spline interpolation, there was the Cox-de Boor recurrence formula [29,30]:
B i , 0 ( t ) = { 1 t [ t i , t i + 1 ] 0 otherwise B i , k ( t ) = t t i t i + k t i B i , k 1 ( t ) + t i + k + 1 t t i + k + t i + 1 B i + 1 , k 1 ( t ) ,
When k = 3, the cubic GB-spline curve could be expressed as:
B i , 3 ( t )   =   { ( t t i 2 ) 3 ( t i + 1 t i 2 ) ( t i t i 2 ) ( t i 1 t i 2 )   t     [ t i 2 , t i 1 ] t t i 2 2 ( t i t ) ( t i + 1 t i 2 ) ( t i t i 1 ) ( t i t i 2 ) + ( t t i 2 ) ( t t i 1 ) ( t i + 1 t ) ( t i + 1 t i 2 ) ( t i + 1 t i 1 ) ( t i t i 1 ) + ( t i + 2 t ) t t i 1 2 ( t i + 2 t i 1 ) ( t i + 1 t i 1 ) ( t i t i 1 )   t     [ t i 1 , t i ] t i + 2 t 2 ( t t i ) ( t i + 2 t i 1 ) ( t i + 2 t i ) ( t i + 1 t i ) + ( t t i + 2 ) ( t t i + 1 ) ( t t i 1 ) ( t i + 2 t i 1 ) ( t i + 1 t i ) ( t i + 1 t i 1 ) , + ( t t i 2 ) t i + 1 t 2 ( t i + 1 t i ) ( t i + 1 t i 1 ) ( t i + 1 t i 2 )   t     [ t i , t i + 1 ] ( t i + 2 t ) 3 ( t i + 2 t i + 1 ) ( t i + 2 t i ) ( t i + 2 t i 1 )   t     [ t i + 1 , t i + 2 ] 0   otherwise
Bi,3(t) was calculated and the value at each point was:
B i , 3 ( t j )   =   { ( t i 1 t i 2 ) 2 ( t i + 1 t i 2 ) ( t i t i 2 )   j   =   i     1 ( t i t i 2 ) ( t i + 1 t i ) ( t i + 1 t i 1 ) ( t i + 1 t i 2 ) + ( t i t i 1 ) ( t i + 2 t i ) ( t i + 1 t i 1 ) ( t i + 2 t i 1 )   j   =   i , ( t i + 2 t i + 1 ) 2 ( t i + 2 t i ) ( t i + 2 t i 1 )   j   =   i   +   1 0   otherwise
The shape value points obtained by the field measurement were brought into the calculation, and the crown curve of the tree could, therefore, be obtained. When the mutation position of the crown shape was recorded in more detail. The detailed shape points is shown in Figure 2a, and the simulation of CMGBCC is shown in Figure 2b.
In Figure 2a, we have shown some characteristic points of tree crown morphology. H is the height of the tree, Hcw is the HMCW on the west side, Hbw is the UBH on the west side, Hce is the HMCW on the east side, and Hbe is the UBH on the east side. These five parameters are the basic value points of the tree crown in the viewing angle of one side. The bulge is the outwardly bulging part of the crown, and the sunken point is the inwardly concave part of the crown. In Figure 2b, we showed the result of CMGBCC. The red lines represent the crown curve simulated by CMGBCC.

2.3. Constructing Coupling Model of 3D Chinese Fir Trunk, Branches Model and Withered State

The composition structure of Chinese fir could be decomposed into the trunk, the first-level branches, second-level branches, leaves, and so on. The crown morphology would directly influence the tree morphology; the morphological structure of the first-level branches and the position distribution on the trunk were the direct factors that influenced the crown morphology. At the same time, the amount of calculation on the subsequent loading model was considered, and this study dissected the Chinese fir model as the trunk model and first-level branch model.
SpeedTree is currently a more professional and complete tree 3D modeling software [31]. The trunk of the Chinese fir is straight; therefore, the Chinese fir shaving equation could be taken for the 3D model of the trunk as the outer contour constraint [32,33,34]. Then, the skeleton of the 3D trunk model was constructed in the speed tree, and the Chinese fir bark texture map was added.
The theoretical basis for the construction of a first-level branch model was the morphological and structural characteristics of the first-level branch. Because the overall morphological structure of the Chinese fir conformed to the fractal theory and demonstrated self-similarity, the morphological structure of the first-level branch was similar to the overall morphological structure of the tree. The distribution characteristics of the second-level branch were the basis of the first-level branch. The elevation angle of the second-level branch on the Chinese fir basically conformed to normal distribution; this was mainly concentrated in the range of 50°~100°, and the azimuth angle was mainly concentrated at an interval of 135°~225° and 315°~45°, which was distributed in the horizontal direction. The leaves were arranged approximately symmetrically on the branches [35].
Because the first-level branch was the most direct unit to determine the shape of the tree crown, considering the amount of model loading and rendering, models in the model library were composed of first-level branches.
At the same time, the tree grew all the time. with branches and leaves growing new and dying with age [36]. Therefore, the construction of the branch model considered the influence of growth and designed branches with different withered states.
The rules considered in the modeling process are shown in Table 2.
Then, the different types of first-level branch models by these rules were constructed. The withered states were controlled by the number of leaves on the branches, which included the branch that had no leaves, the branch that had limited leaves, the branch that had 50% leaves, and the branch that had whole leaves. The first-level branch’s elevation angle was controlled by the elevation angle of the branch on the trunk. The branch length was controlled by the branch matching point and branch point. The base diameter was controlled by the age of the branch.
The bark and leaf texture maps of the Chinese fir are shown in Figure 3a,b.
Figure 3a is the bark texture map of Chinese fir, Figure 3b is the leaf texture map of Chinese fir

2.4. Simulations of Three Types of the Tree Polymorphism

Three types of tree polymorphisms, including natural pruning, crown displacement, and crown shape difference, were simulated and expressed in the 3D model by the distribution of branches and the constraints of the crown curves.
Natural pruning was the result of the dead branches on trees causing the UBH to move upward; therefore, natural pruning could be simulated by the combination of the UBH model [16,17,37] and the loading of the 3D branch models. Due to the different strengths of the crown affected by space competition in different directions, the corresponding UBHs were also different. Therefore, the UBHs in various directions were calculated by the UBH models of the Chinese fir in different directions [17], and the obtained parameters were transferred to the branch models for loading. The loading positions of the branches in different directions were adjusted in this module, and the simulation of natural pruning was realized.
Hb = H ( 1 + e 0 . 047 + 0 . 003 DBH 0 . 044 PH     0 . 206 PV ) ,
In the formula, Hb represented the UBH in a single direction, PH was the horizontal spatial structure parameter in a single direction, and PV was the vertical spatial structure parameter in a single direction.
Natural pruning represents the distribution of the lowest living branches in different directions, while the dead branches below them were the result of historical natural pruning, which also has an important impact on tree morphology. Therefore, the loading position of dead branch models in the corresponding direction was taken from the position of the lowest living branches as the reference. According to the research on the dead branches and leaves of Chinese fir, the dead branch models were loaded down randomly for about three rounds to simulate the survival state of the branches to the current natural pruning result state.
The simulation process of natural pruning is shown in Figure 4.
In Figure 4, the blue point and green point are the lowest positions of the living branches in different directions, while the red points are other living branches’ positions.
Crown displacement is the phenomenon that the crown shape is asymmetric, concave, or convex to one side when the tree crown in different directions is affected by different environments [3,4,38,39]. It is a common polymorphic form in the crown of the stand. The crown displacement phenomenon was simulated based on the crown curve’s constraints on the outer contour shape of the tree crown.
Since the result of the crown displacement phenomenon was that the crown shifted to one side as a whole, it could be simulated by the crown curve and fitted by the basic value points. The basic value point data parameters obtained by measurements and calculations were transferred to the crown curve building module; the tree crown shape was constrained by the outer contour, and the 3D branch models were loaded. When the widths of the tree crowns in the corresponding east–west and north–south directions were quite different, the model could simulate the crown displacement phenomenon. The simulation process is shown in Figure 5.
In Figure 5, the red points were left-type value points, the green points were right-type value points, and the blue point was the top point in the tree. The widest left crown was 1.8 m, and the widest right crown was 2.2 m.
The crown shape difference refers to the interaction of the tree crown with the environment. Based on the basic crown shape law of these tree species, it presented irregular bumps [39]. Compared with the crown displacement, it showed the details of the crown shape at length. Therefore, the simulation of the crown shape difference was based on the simulation of crown displacement, and this simulation was realized by fitting the crown curves to the detailed shape value points. This process is shown in Figure 6.
In Figure 6, the red points are type value points, the blue circles are the sunken positions on the crown shape difference, and the green circles are the bulge positions on the crown shape difference.

3. Results

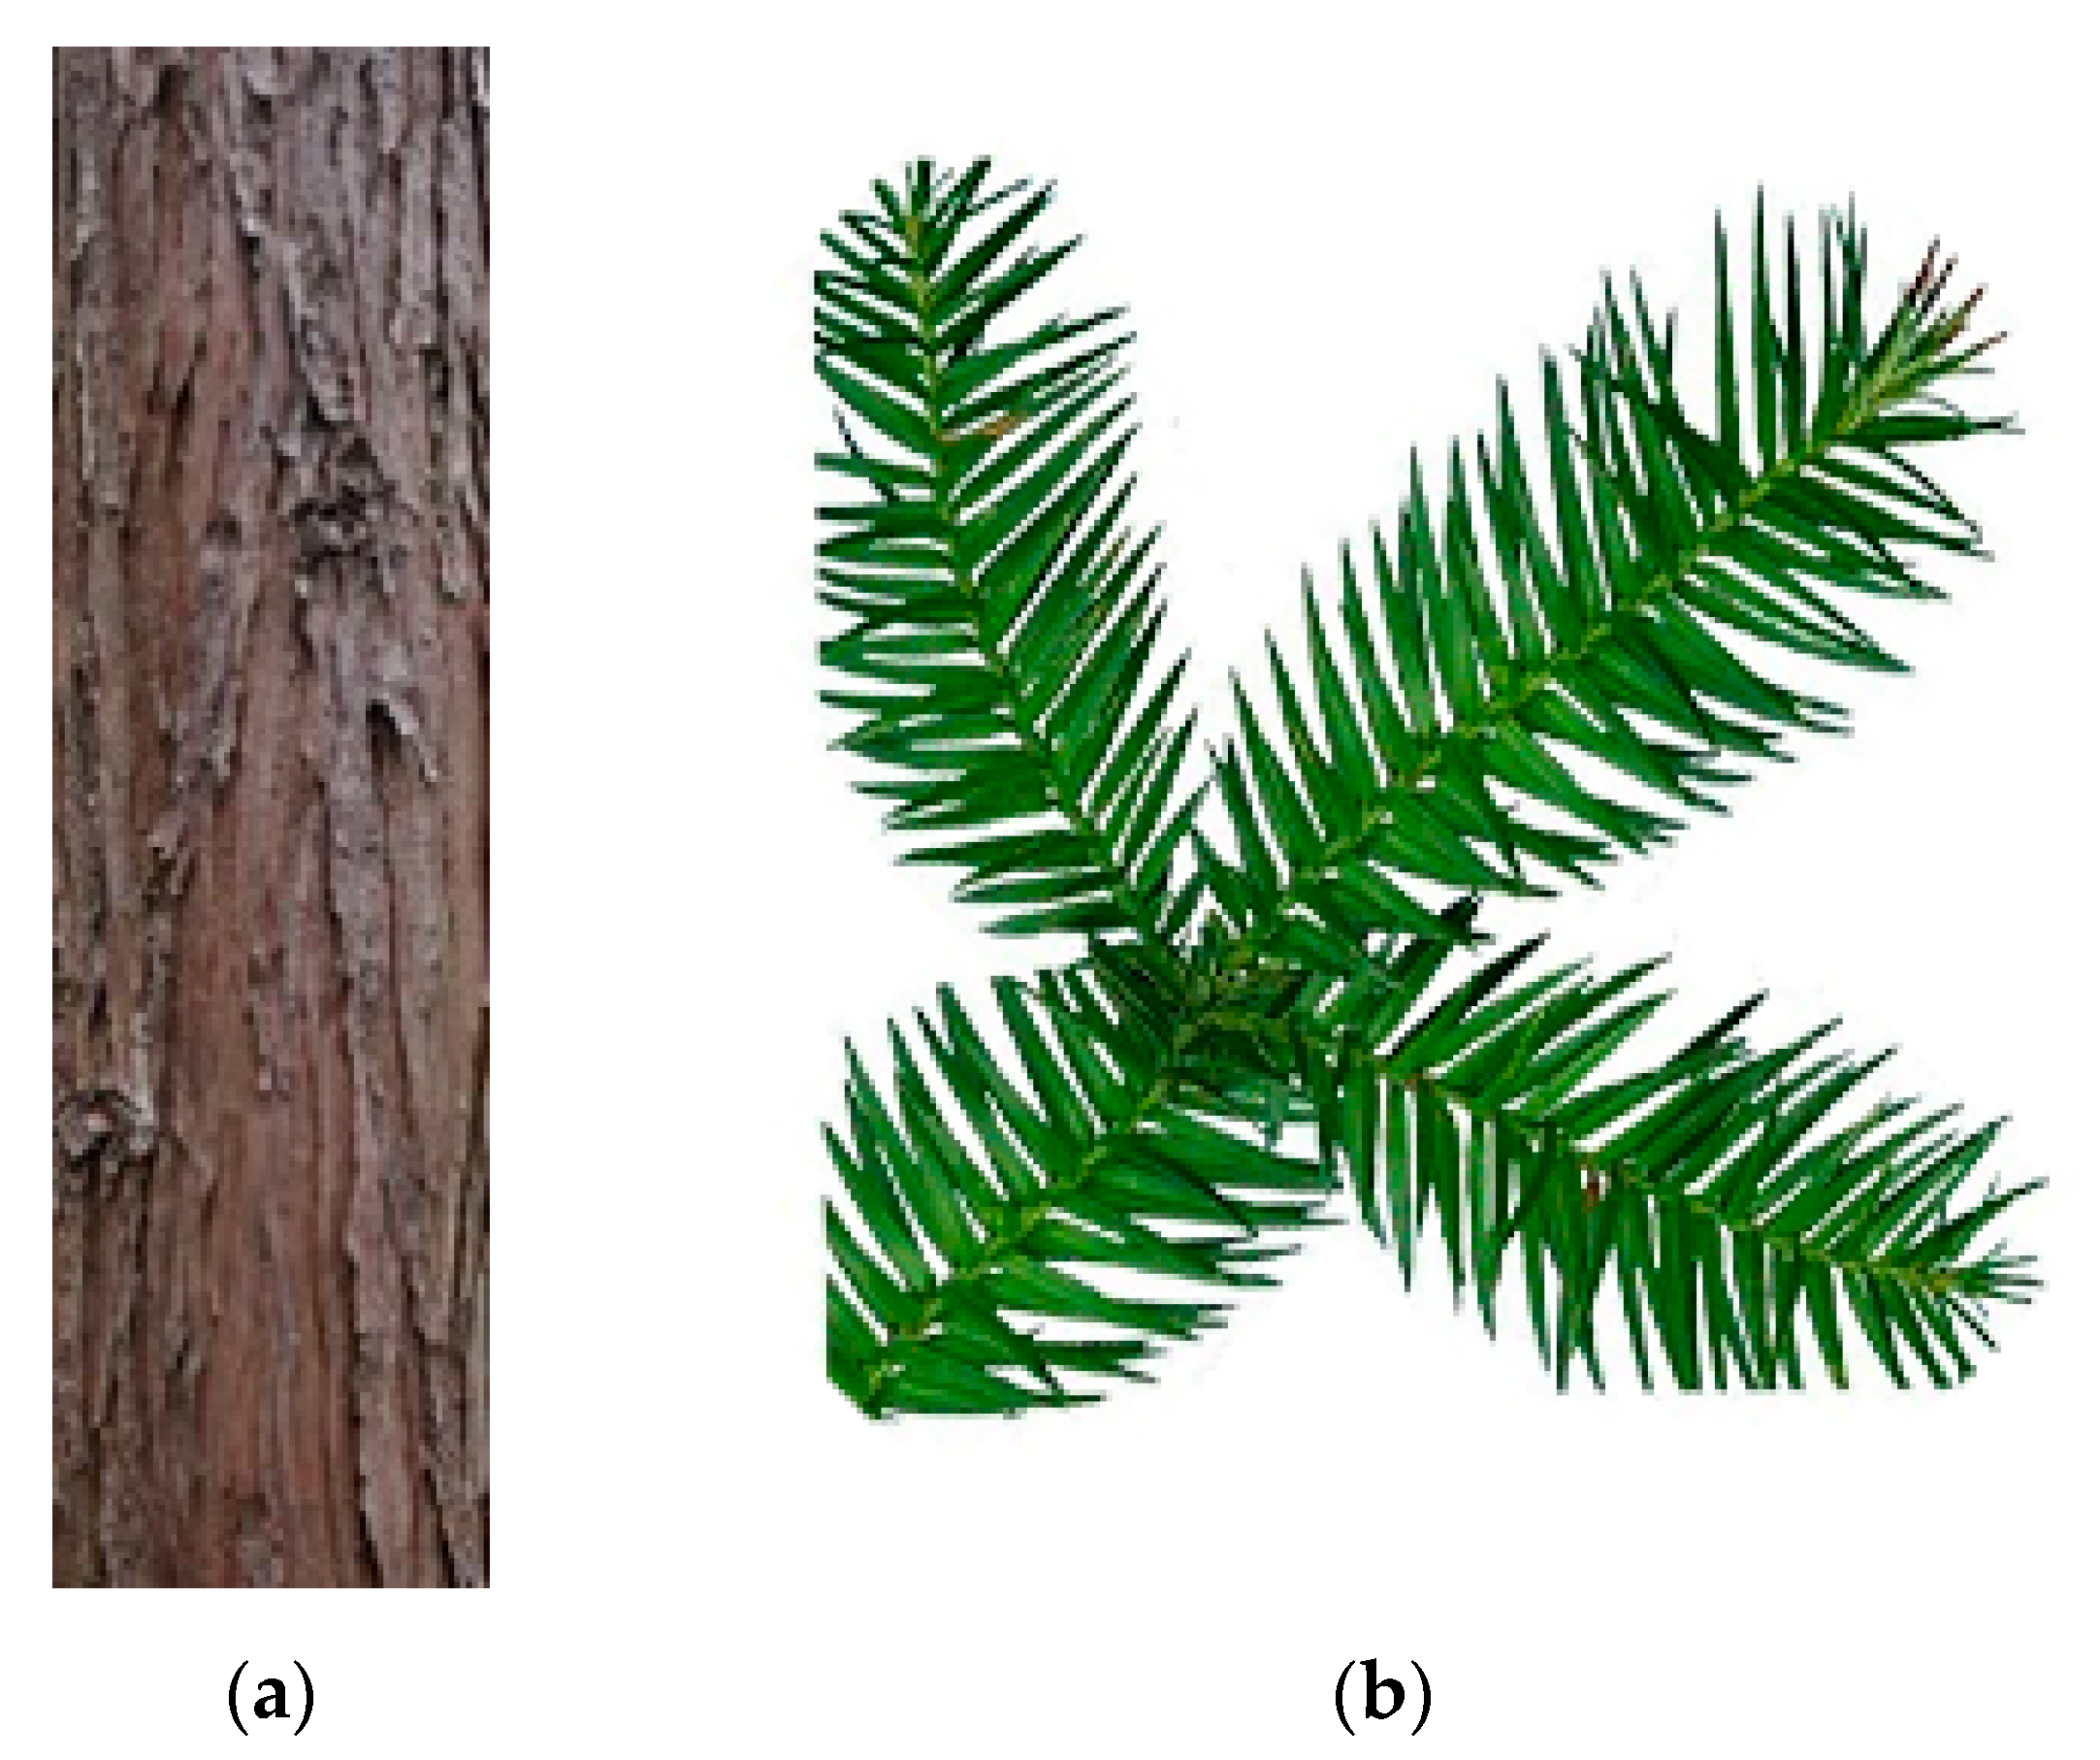
3.1. 3D Models of Chinese Fir Trunk and Branch

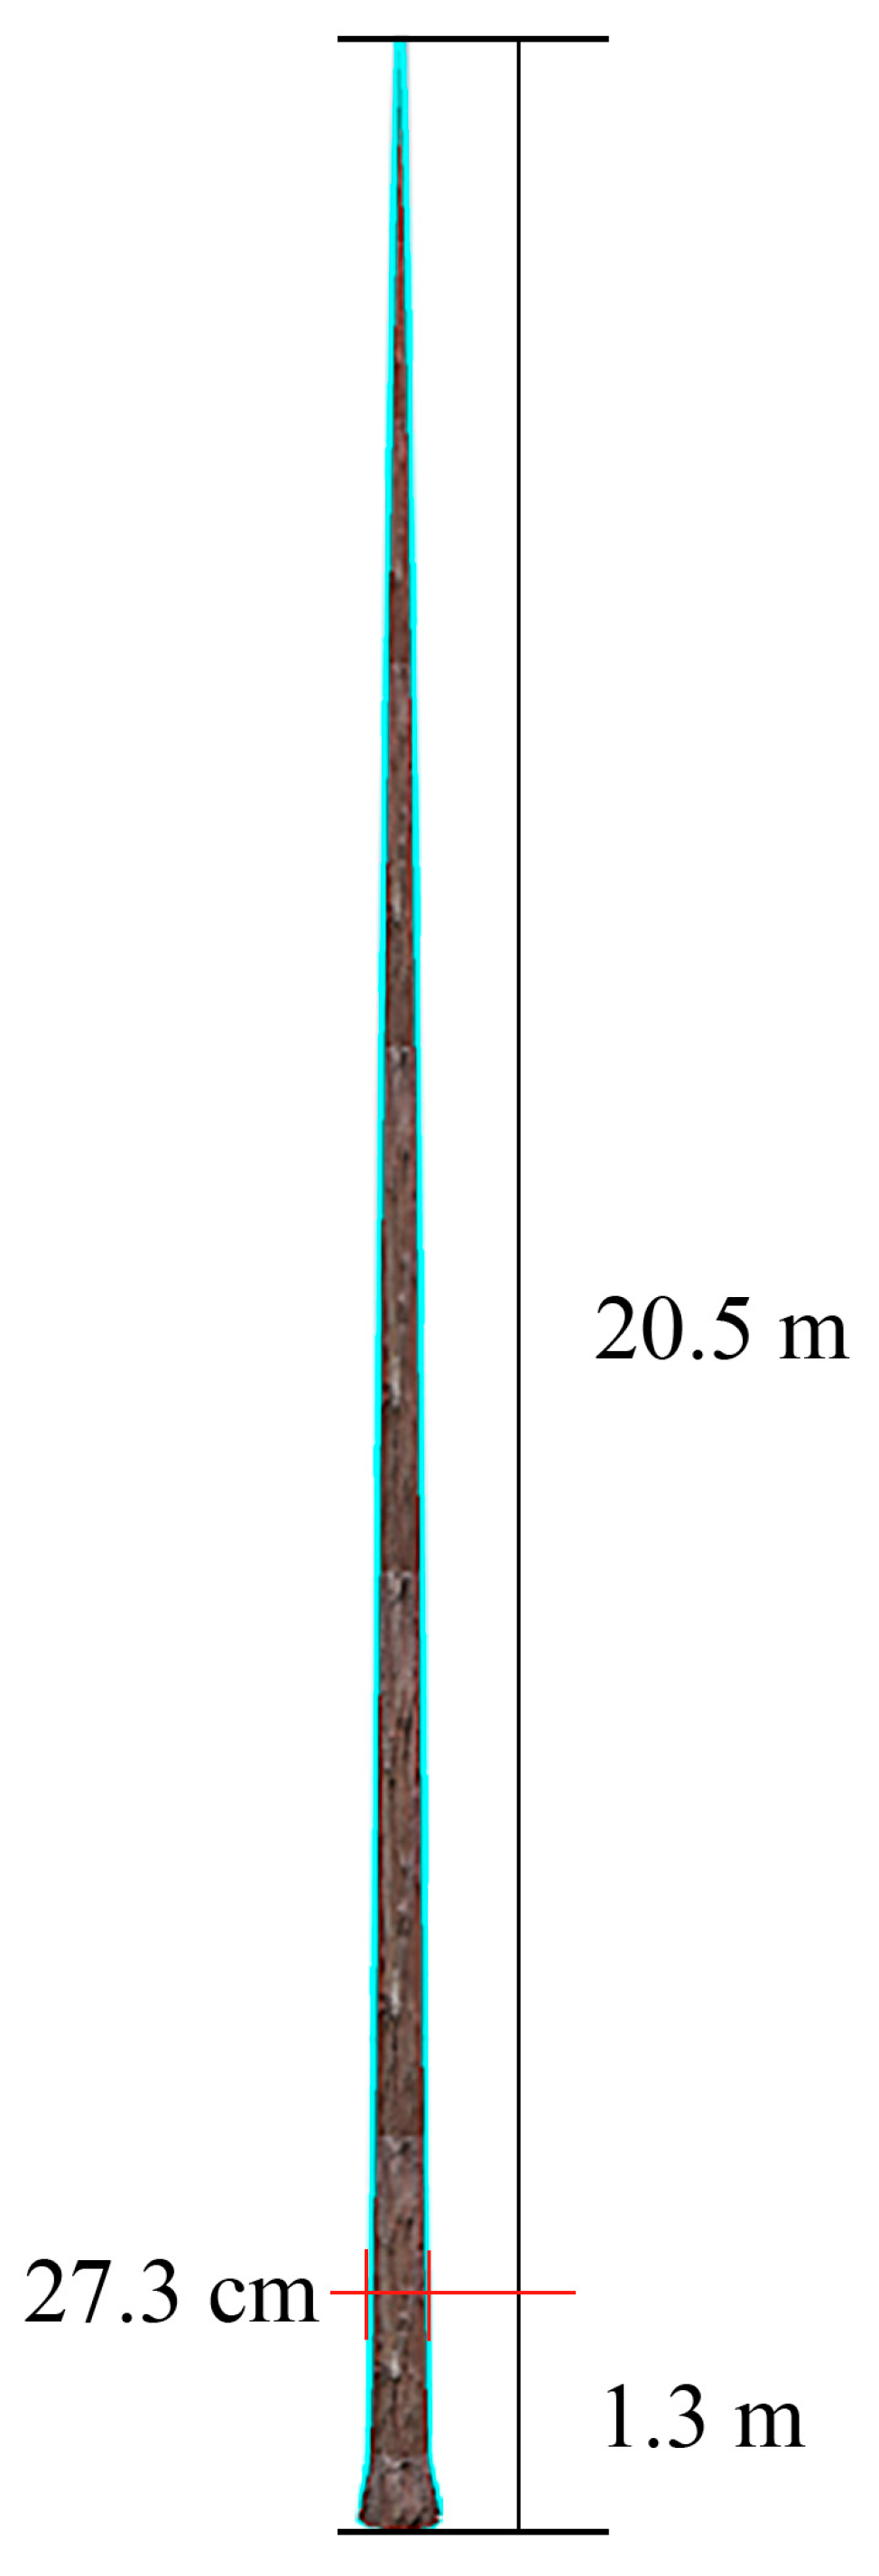
3.1.1. 3D Models of Chinese Fir Trunk

The trunk of the Chinese fir is straight, and the shape of the trunk varies a little between different ages. Therefore, based on the experimental data, the tree height’s distribution range in the experimental area was between 8.8 and 30.4 m, with an interval of 5 m, and the closest interval median was taken. At the tree height value, the initial trunk model was constructed at each interval. The model properties are shown in Table 3.
Taking the tree height of 20.5 m as an example, the constructed 3D model of the trunk is shown in Figure 7.

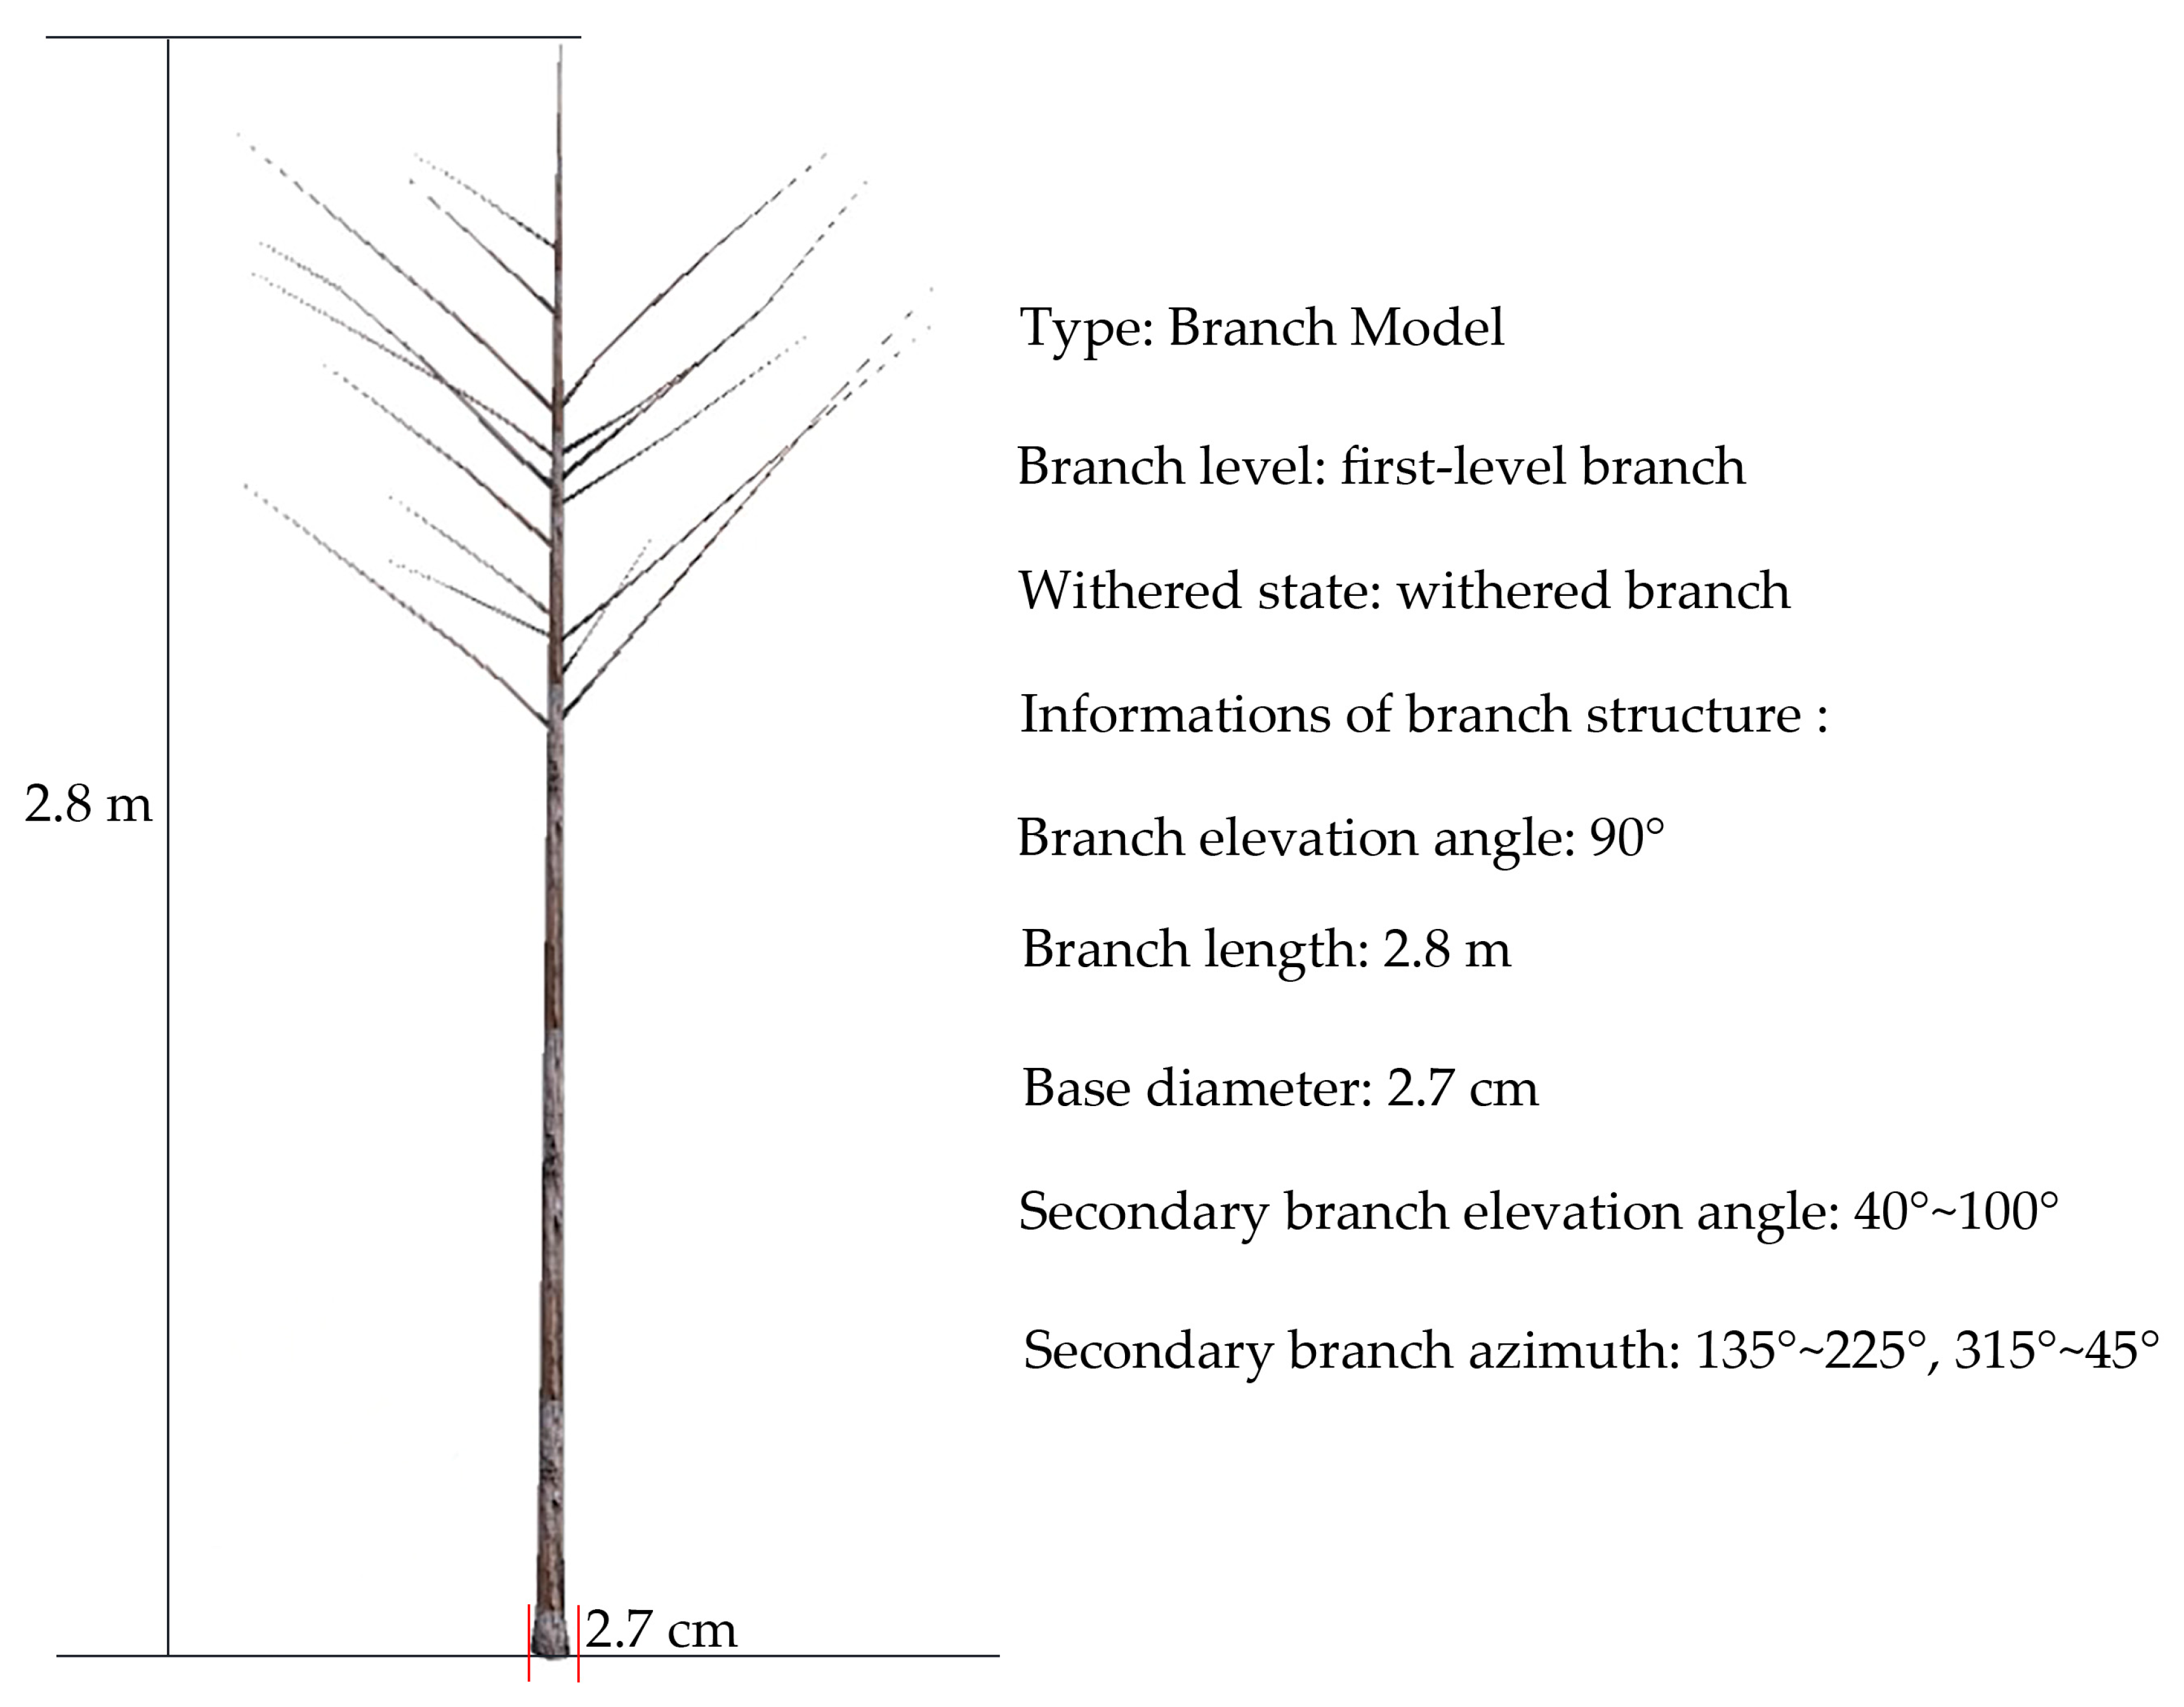
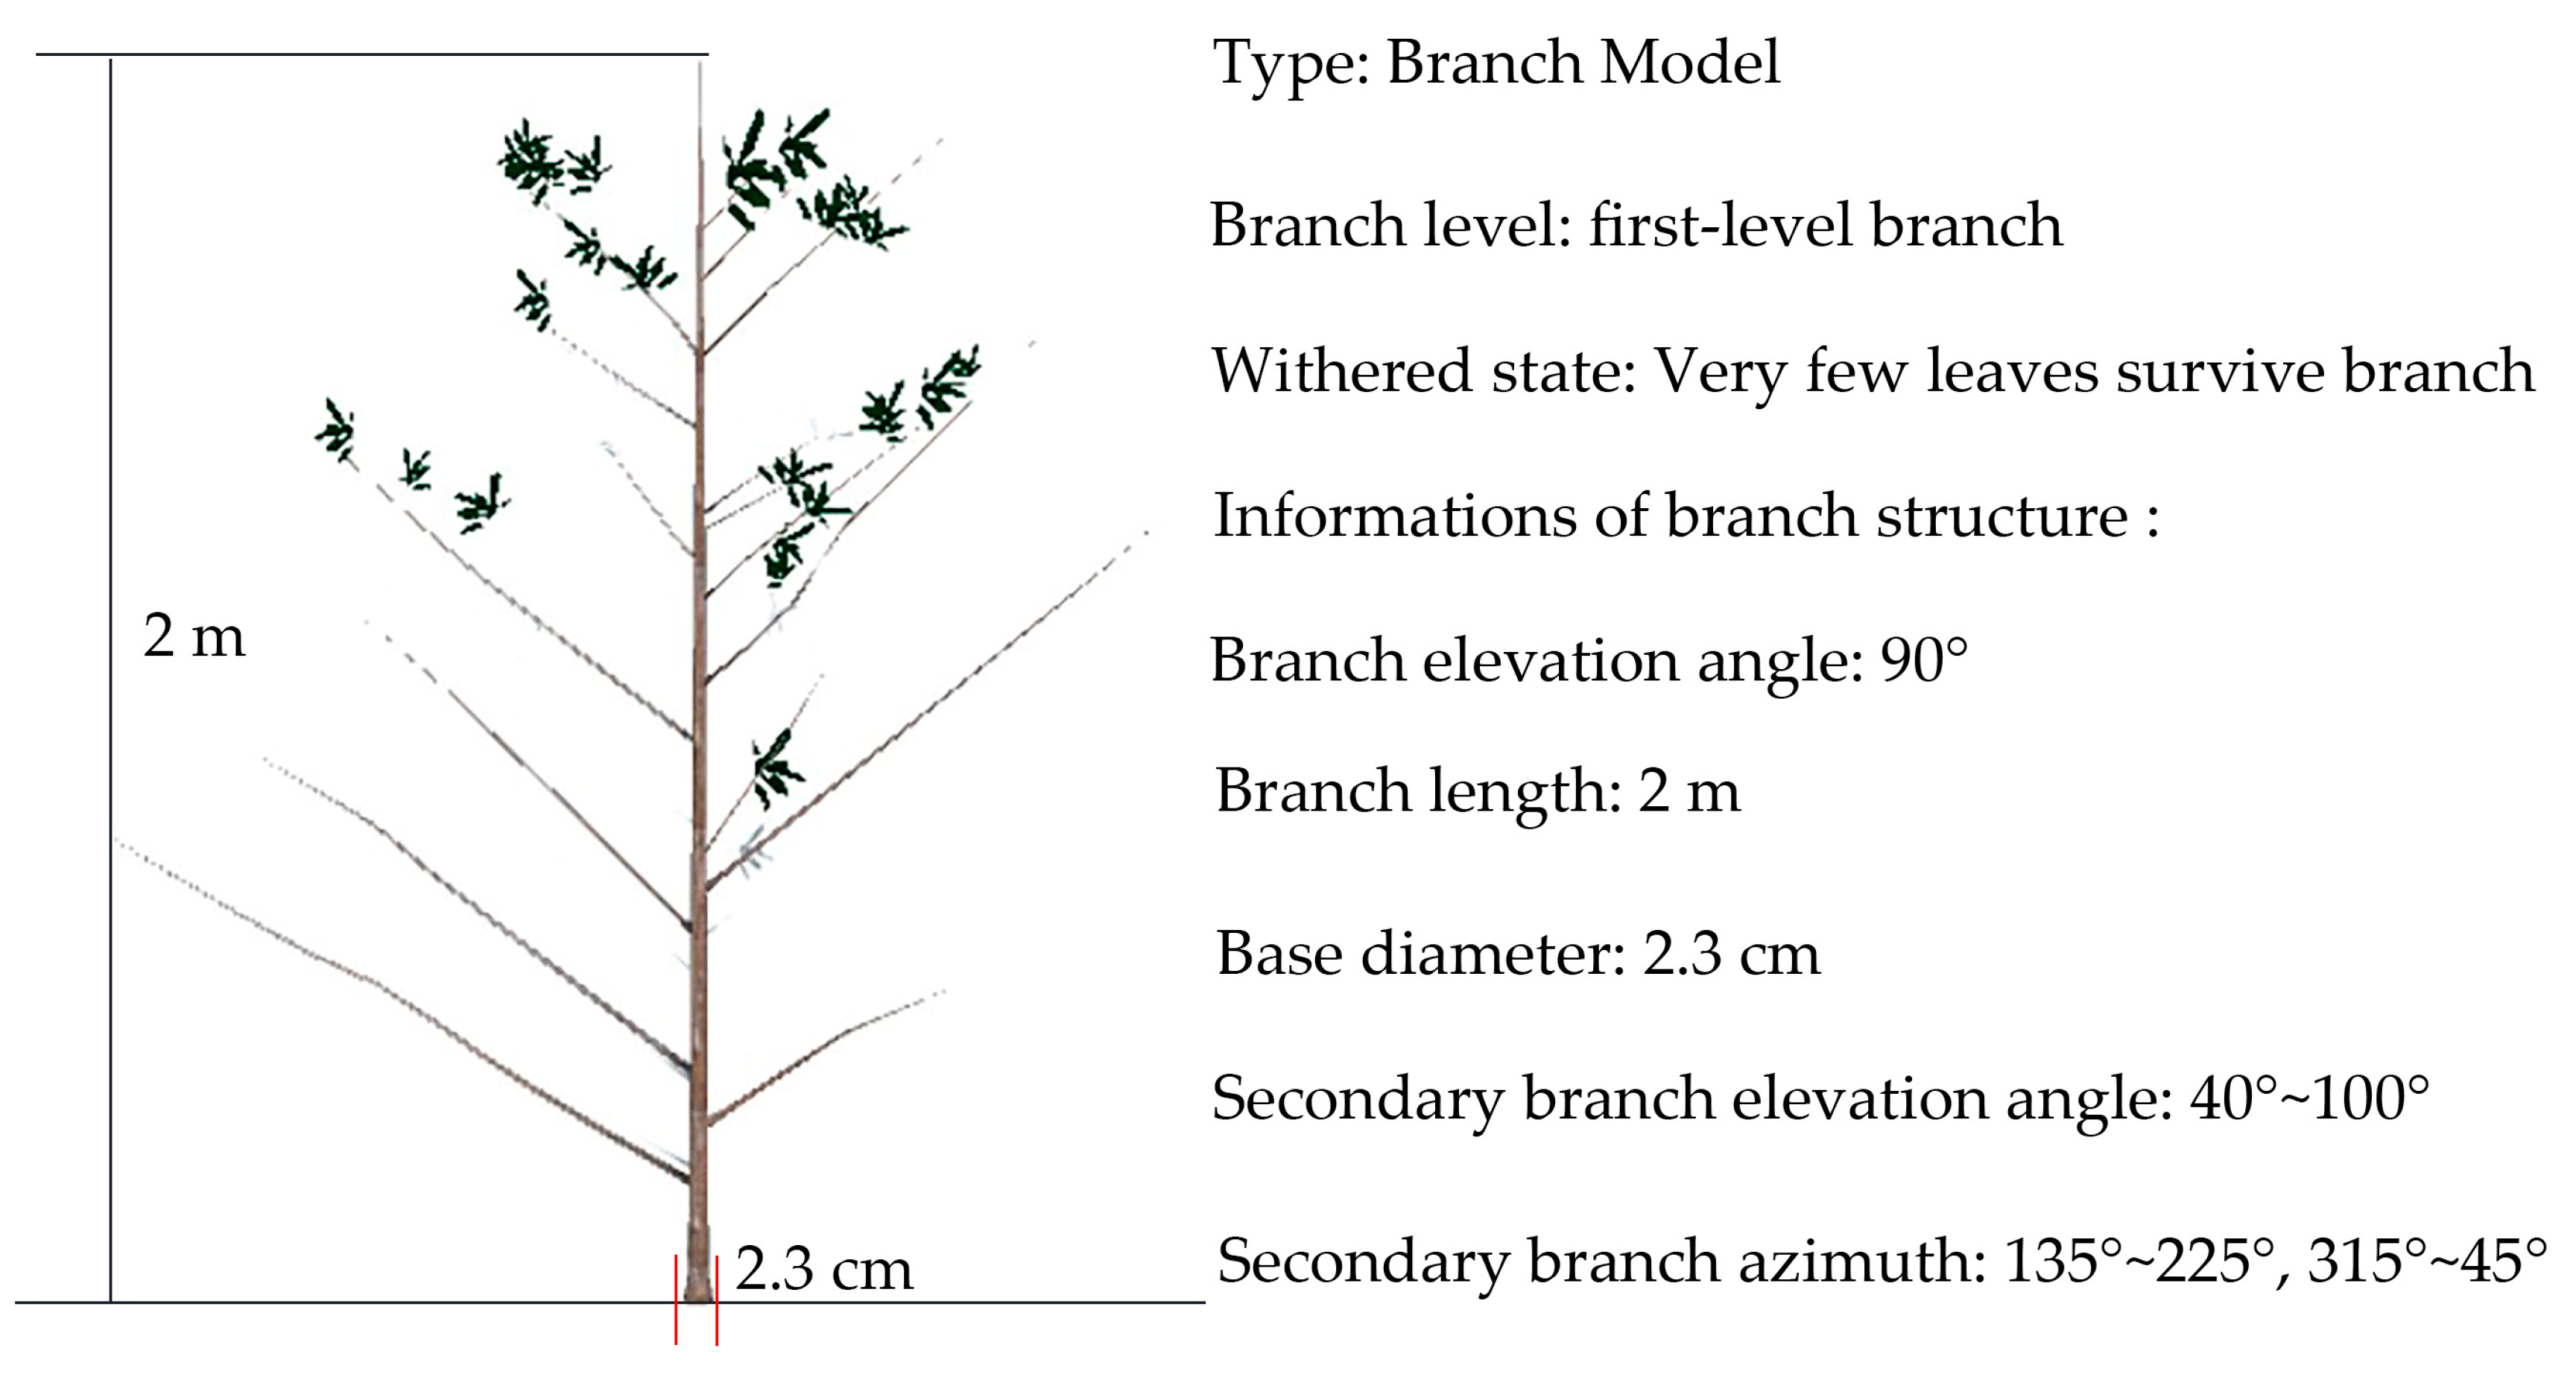
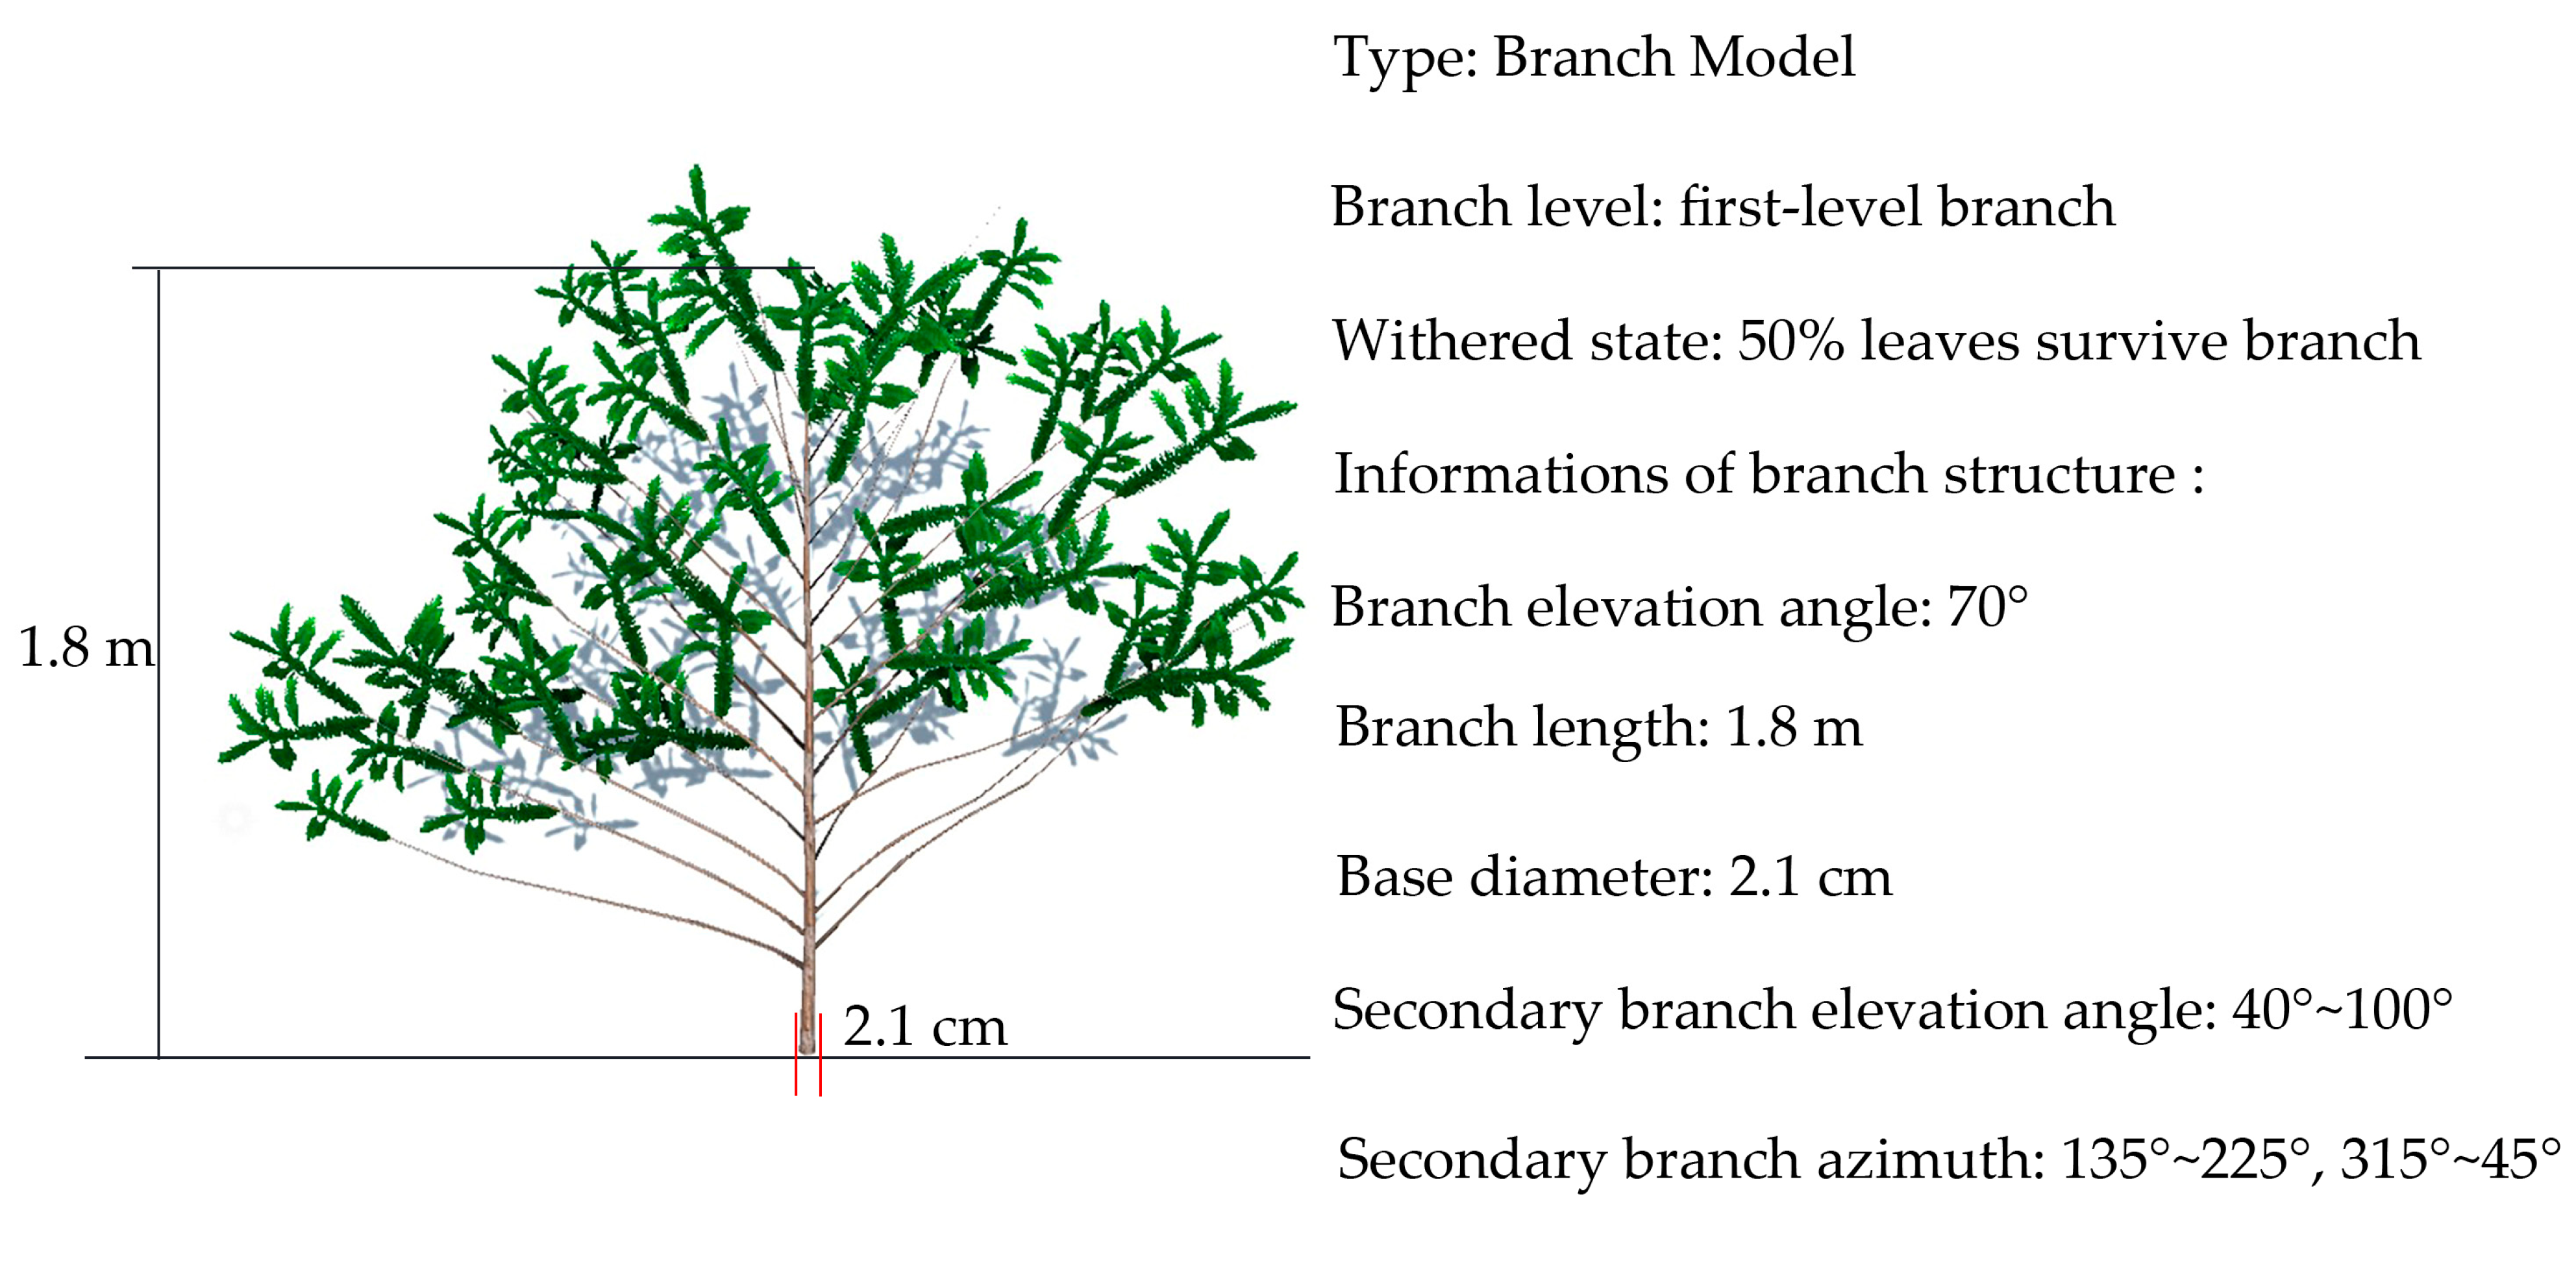
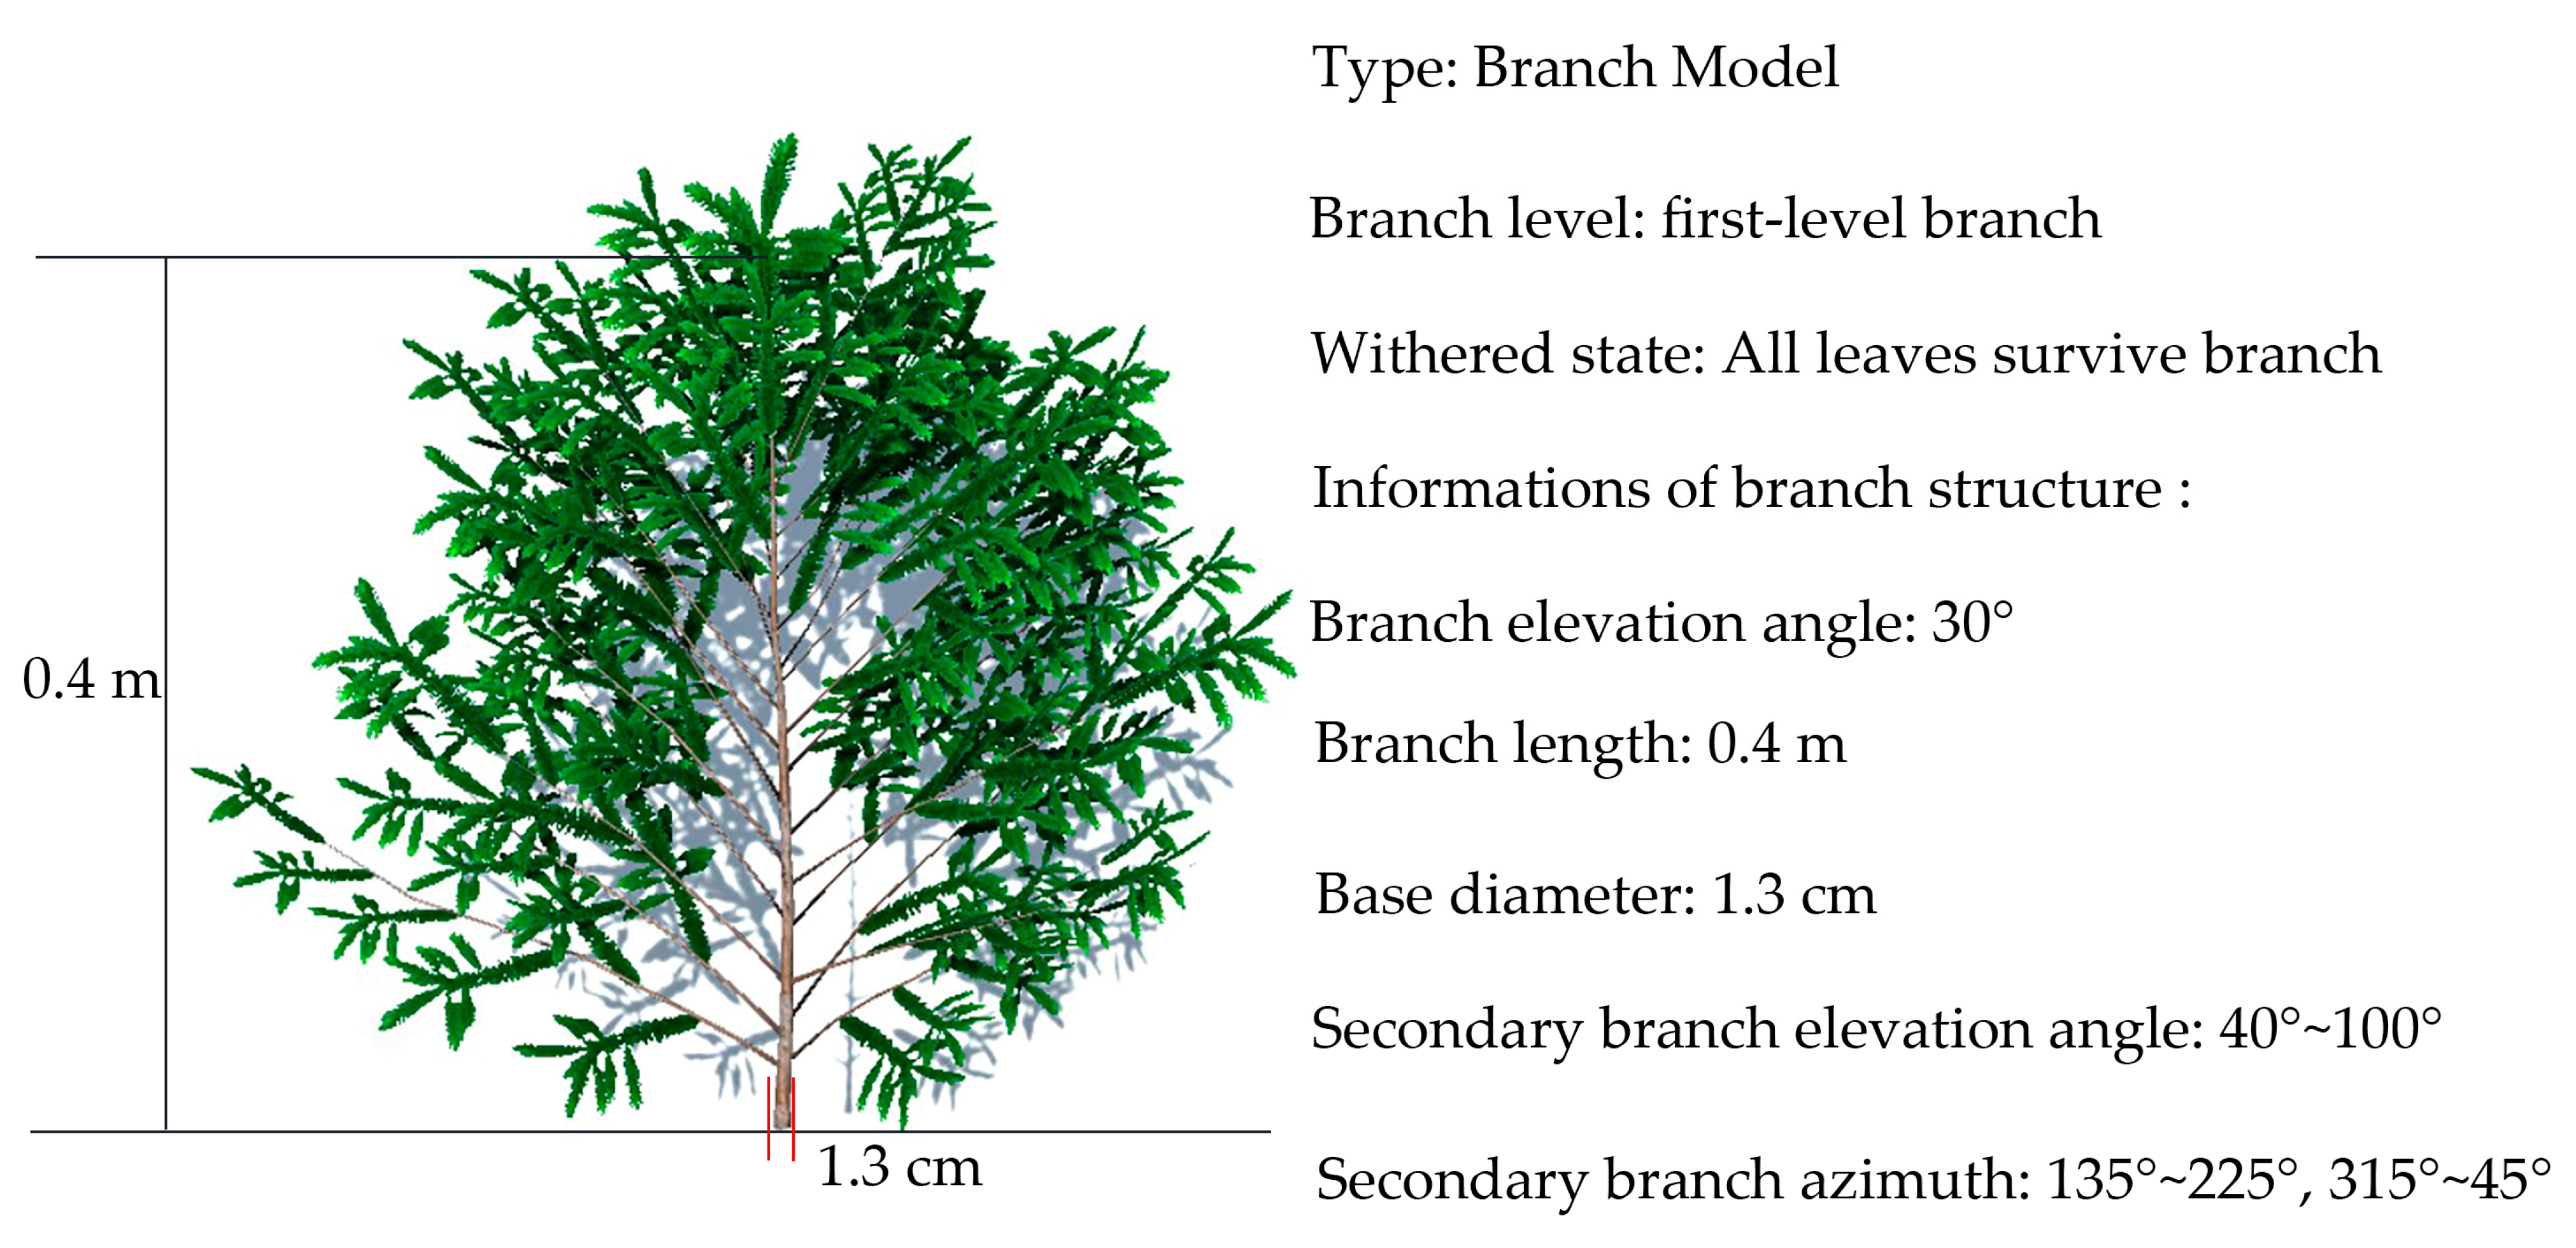
3.1.2. 3D Models of Chinese Fir Branch

Since the first-level branch directly influenced the overall shape of the Chinese fir, the branch model in the model library only included the first-level branch model. From the research on the Chinese fir branch morphology and structure, it could be seen that the Chinese fir crown could be divided into three layers according to the elevation angle of the branches and arranged from low to high positions, while the number of leaves on the constructed branch model ranged from less to more. In this study, considering that dead branches had a certain influence on tree polymorphism, the modeling was carried out according to the index parameters in Table 2.
According to these indexes, the models were constructed at an interval of 10°, and the elevation angle of the primary branch was between 40° and 100°. Among them, the first-level branch accounted for 80% to 85% of all branches between 60° and 90°. Since the dead branches generally followed the bottom-up law, the elevation angle distribution law of the Chinese fir branches generally decreased from the bottom to the top. The new branches at the top of the tree were mainly distributed between 40° and 60°, which were constructed to cover all the leaves; between 90° and 100°, mainly dead first-level branches with very few leaves survived.
The branch models and model properties for different withered states are shown below. Figure 8 shows the dead first-level branch model, Figure 9 shows the branch model with a very small number of leaves surviving, Figure 10 shows the branch model with 50% dead leaves, and Figure 11 shows the branch model without dead and dropped leaves.

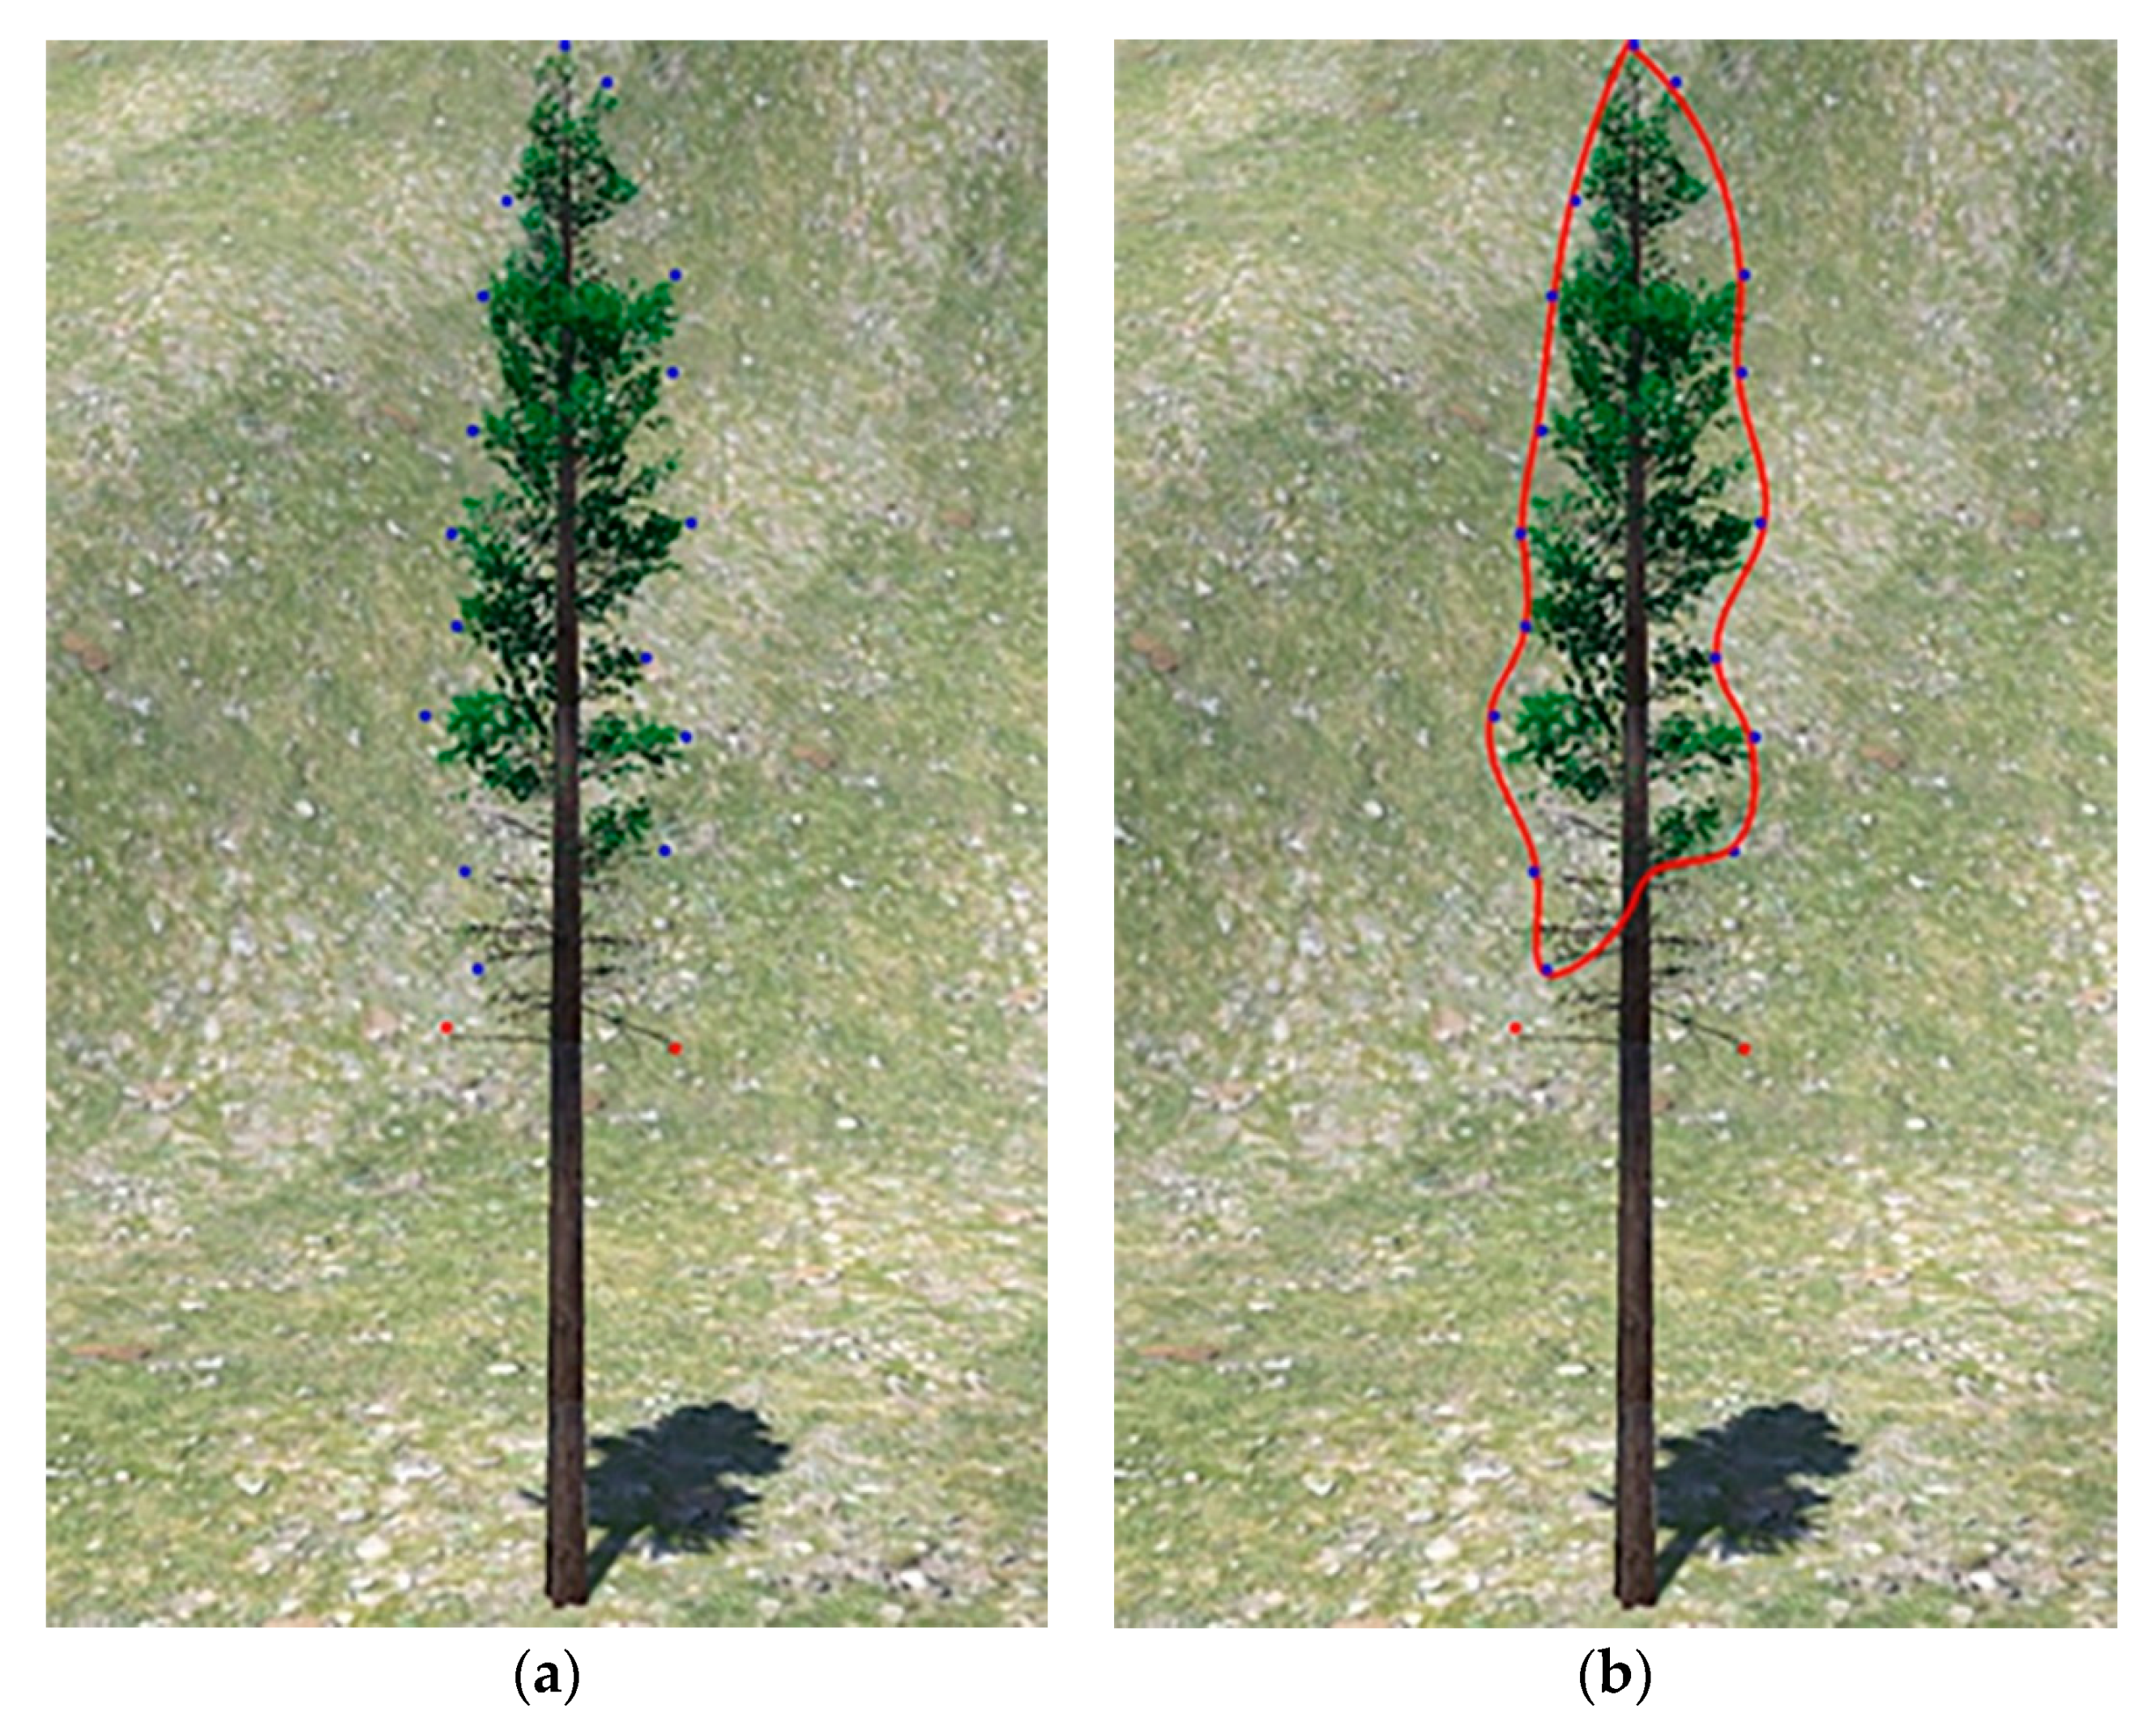
3.2. The Result of CMGBCC

The 3D-CFPM was obtained by CMGBCC according to the distribution structure of Chinese fir branches and the constraints of the fitted crown curve. Taking a spatial structure unit as an example, the 3D-CFPM in the spatial structure unit is shown in Figure 12.
Number 1 to 7 are seven trees in a spatial structure unit. The red circle No. 1 is the center tree, the blue circle No. 2 is the surrounding tree on the east side, the blue circles No. 3 and No. 4 are the surrounding tree on the north side, the blue circle No. 5 is the surrounding tree on the west side, and the blue circles No. 6 and No. 7 represent the surrounding tree on the south side.
The 3D model of the central Chinese fir was constructed in the spatial structure unit, the value of the crown shape is shown in Figure 13a, and the result of CMGBCC is shown in Figure 13b.
In Figure 13a, the west is on the left, and the east is on the right. The bottom blue point is the position under the high branch, the red point is the lowest dead branch position, and the red line is the constructed crown curve. It can be seen from the figure that the space competition on the left side was less than right; therefore, the natural pruning on the left was less than that on the right side, which then caused the UBH to be lower on the left; at the same time, due to the less competition on the left side, the branch growth conditions were better than the right side, and the tree crown presented a phenomenon of crown displacement to the left. On the right side, due to competition reasons, there was a concave in the upper part of the UBH, which resulted in a special crown shape, showing the difference in crown shape. The natural pruning, crown displacement, and crown shape differences were simulated on Chinese fir in the figure. In Figure 13b, we visualized the shape of the tree crown.
The method with b-spline interpolation could constrain the crown shape too. In the this it needed to set a derivative value at the top point and isometric acquisition type value points. However, in this method, the derivative value at the top point did not need to be set, the influence of human error on the model was reduced, and the efficiency of the model fitting was improved. In addition, the type of value points collection was more flexible, which could be collected according to the actual situation of the crown shape. Only a small amount of collection was required in the case of no mutation, and more collection was required in the case of severe morphological changes. However, the tree morphology usually followed a rule, and morphological changes that did not conform to the rule only took place at the location of environmental interaction; therefore, most of the time, there was no mutation. This not only reduced the collection amount of type value points in general but also made CMGBCC more consistent with the actual situation. The comparison of the two methods is shown in Table 4.

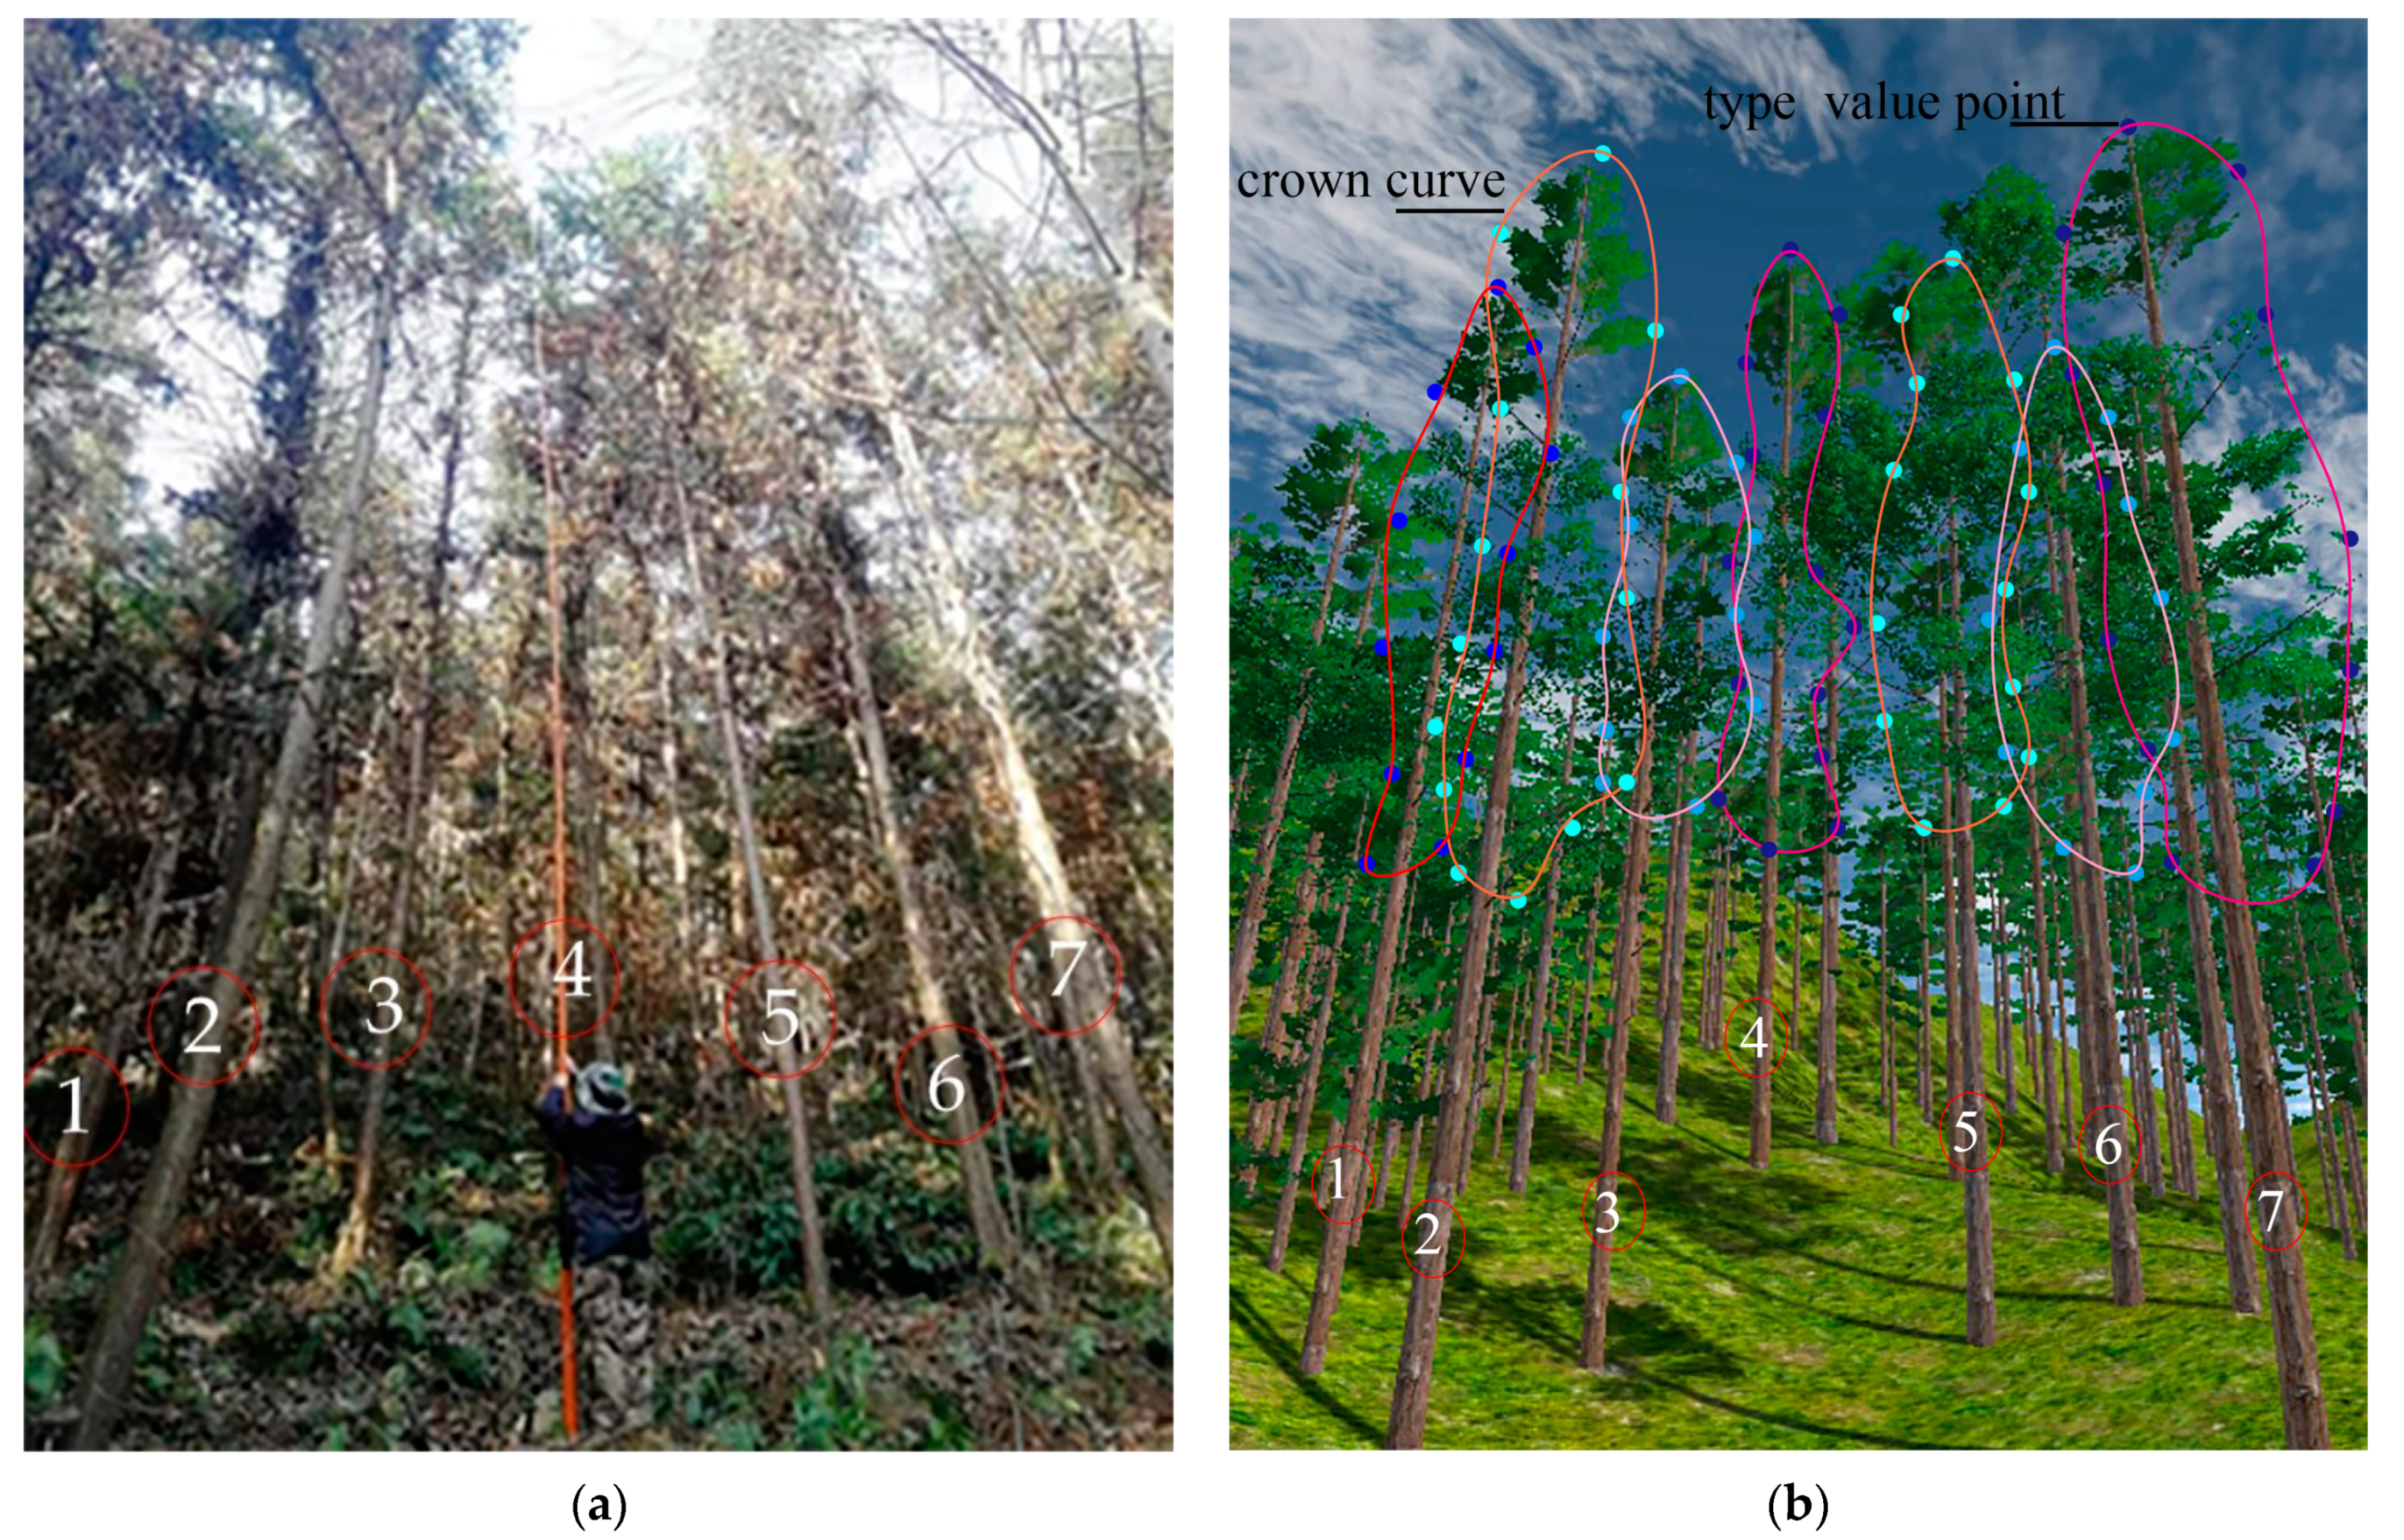
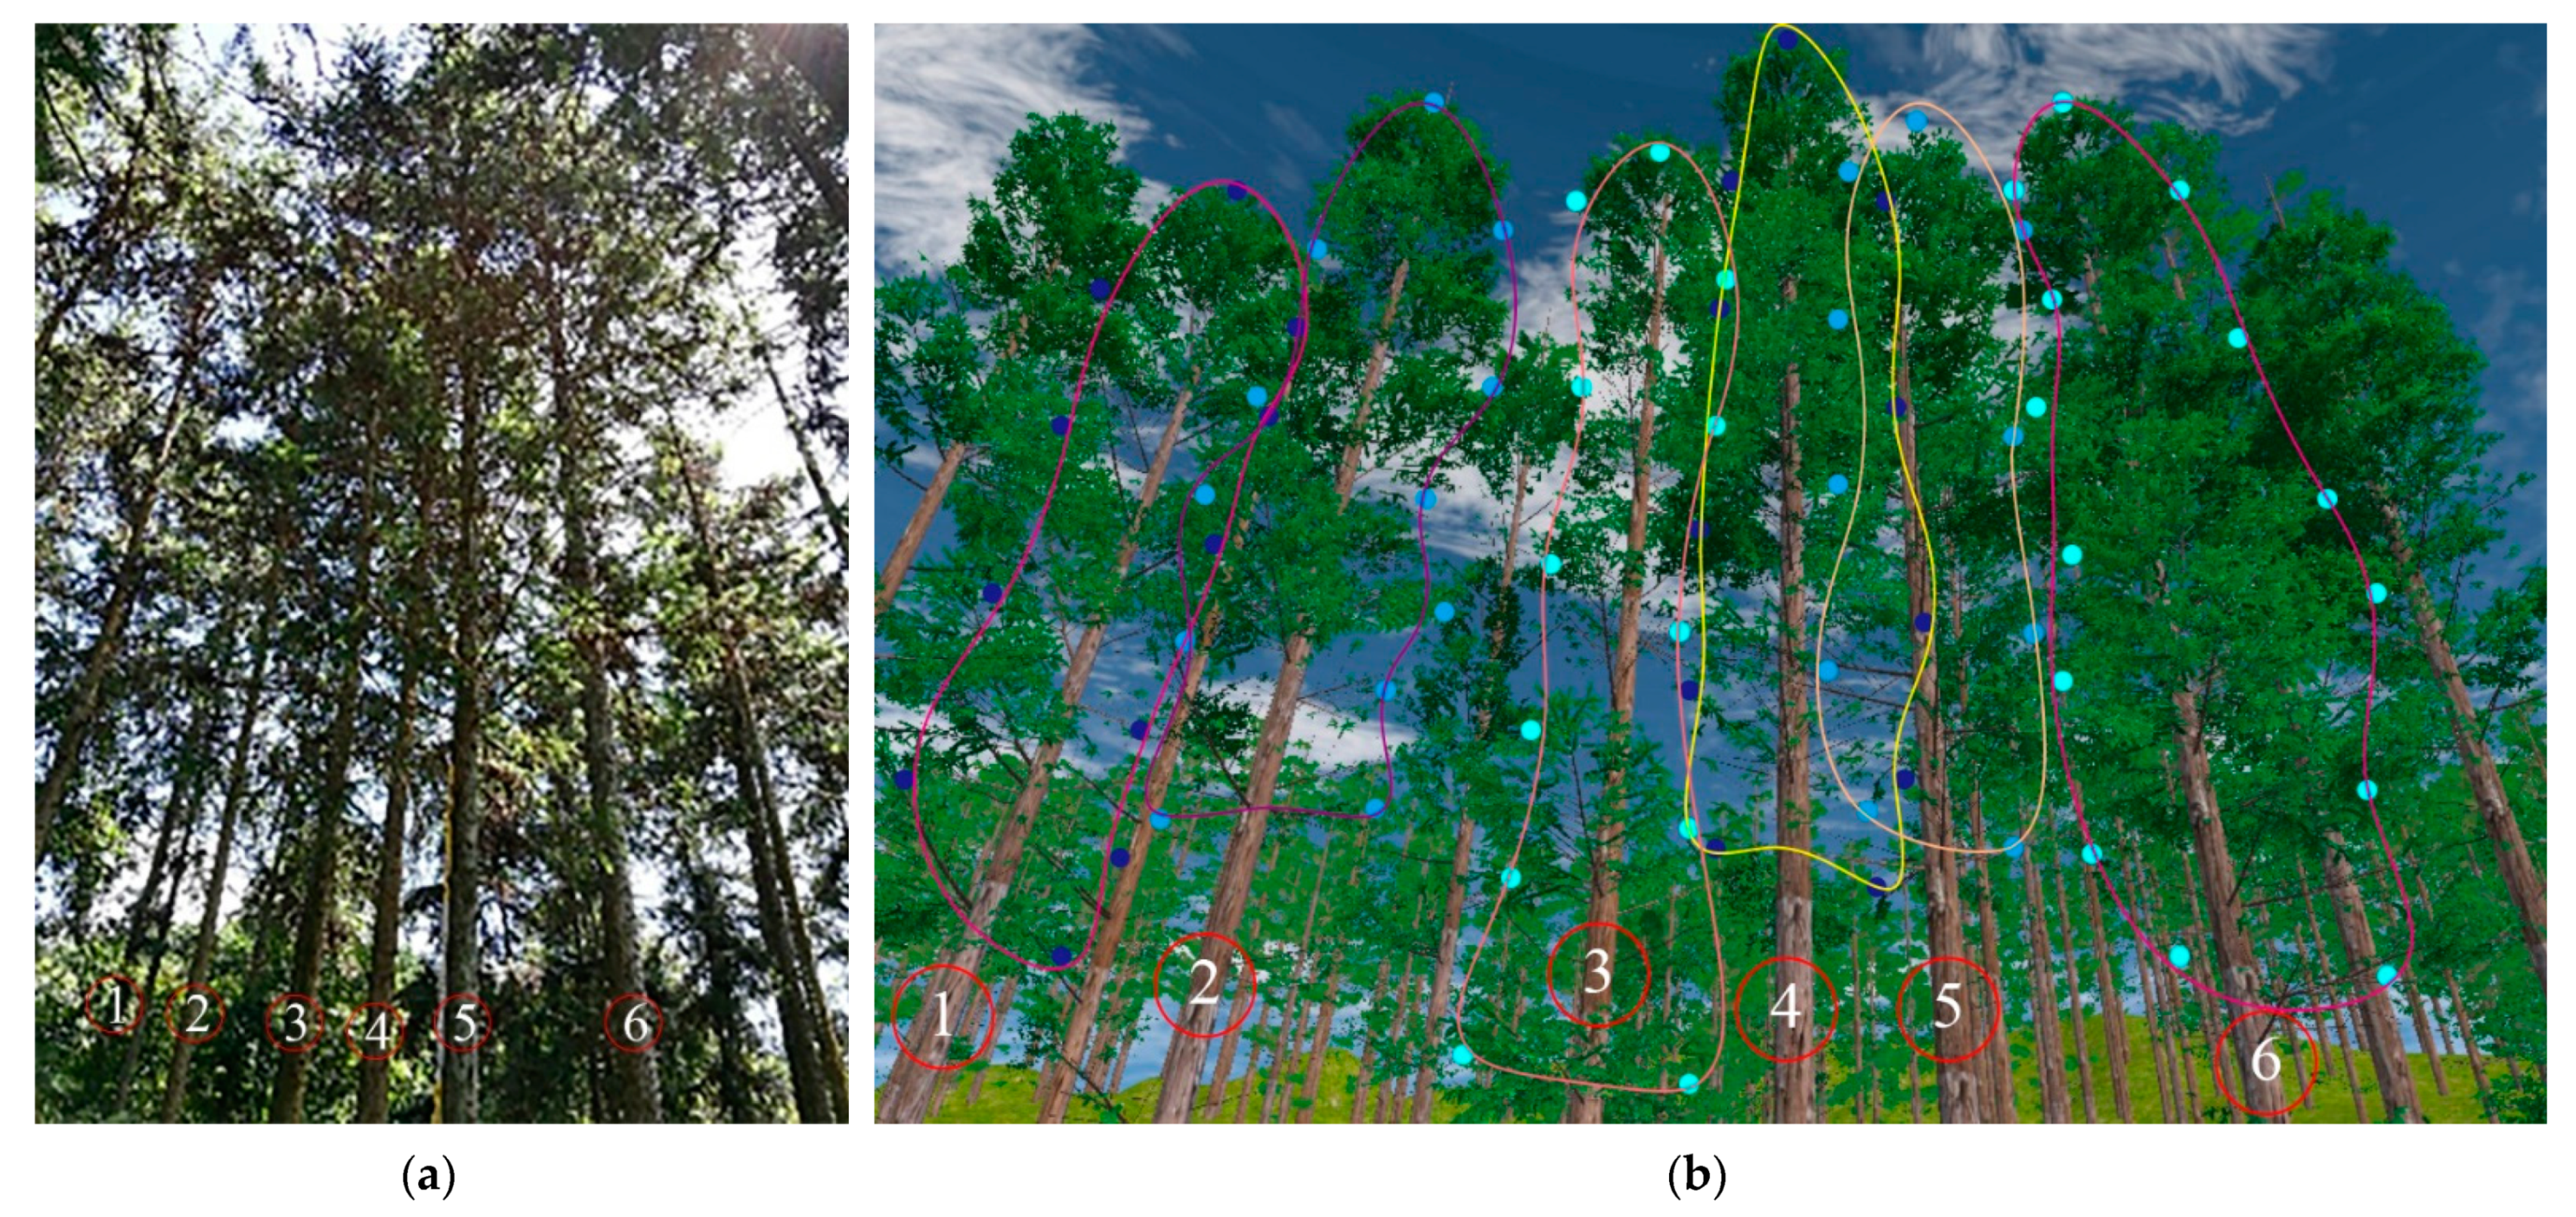
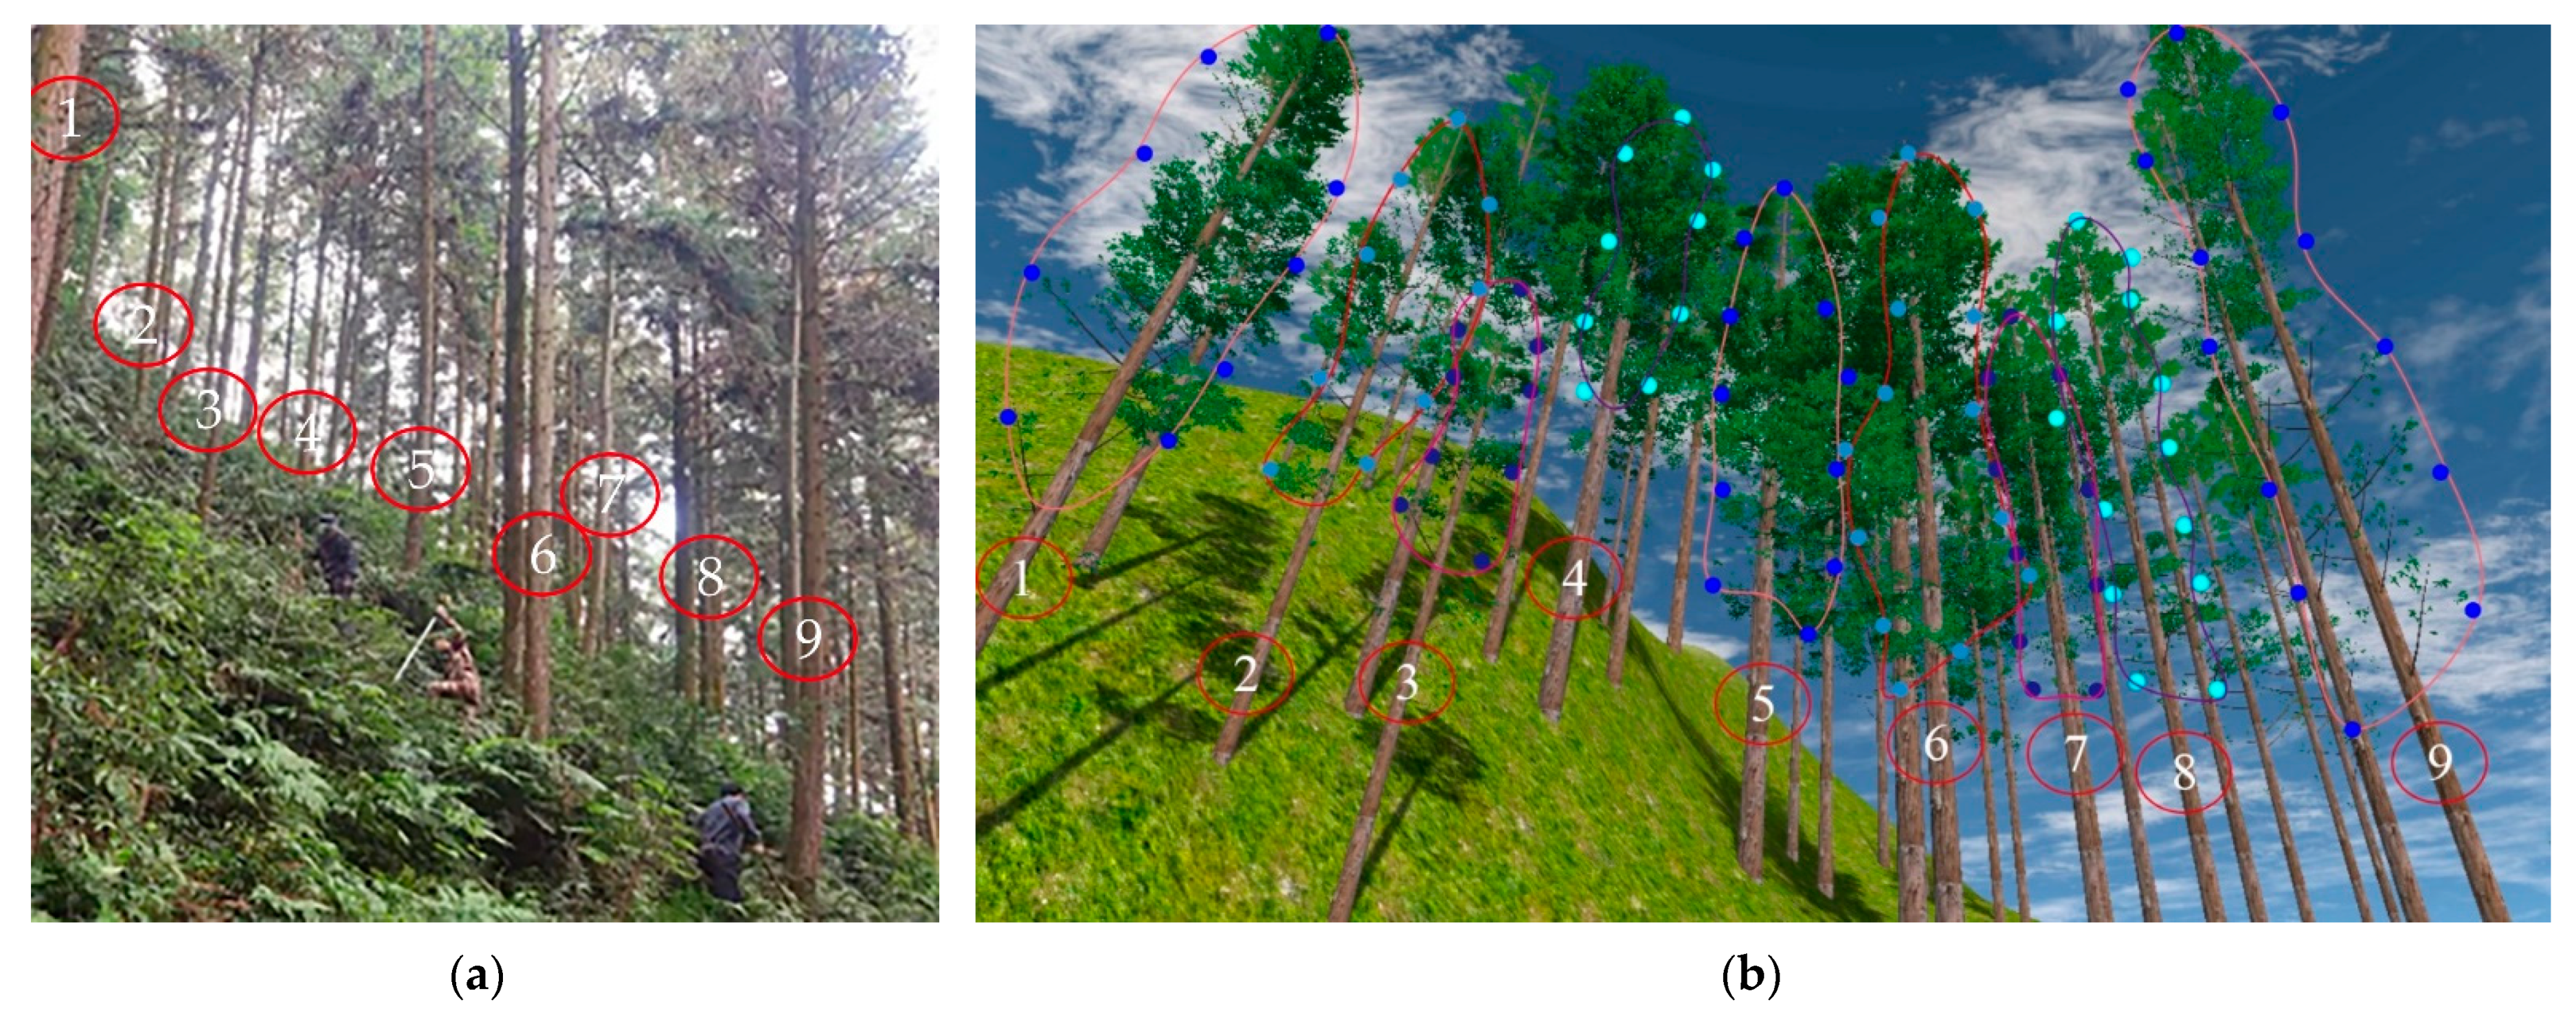
3.3. 3D Modeling and Verification of Chinese Fir Polymorphism

The three polymorphisms of the Chinese fir were simulated by CMGBCC constraints and branch model loading, and the 3D-CFPM was also constructed.
Taking plot 1 as an example, there were 56 Chinese firs in plot 1, and this basic type of value data for the Chinese fir are shown in Table 5.
According to the detailed type of value point data that were obtained by combining the basic type of value point data and the crown shape mutation point data, the Chinese firs in plot 1 were simulated, and the positions of the Chinese fir were distributed according to the relative positions obtained by measurements. The real photo was taken at observation point 1, as shown in Figure 14a, and the simulation results and the visualization of the crown curve are shown in Figure 14b.
The crown curve of the front row of the Chinese firs was visualized and expressed. There were seven Chinese firs in the front row. It could be seen that the UBH of each tree varied with the influence of the surrounding competition. These different results were simulated and expressed for the natural pruning situation. The visualization results of the crown curve directly showed the crown displacement phenomenon and crown shape difference phenomenon in the Chinese fir crown, both of which were related to the spatial structure and expressed the crown deviation in the direction of greater competition and less competition in the same tree. This more clearly simulated the crown displacement phenomenon. At the same time, the mutation points of the crown shape were expressed, and the crown shape difference was simulated.
Figure 14a is photos of Chinese fir morphology collected during field measurements, Figure 14b is the simulation results of Chinese fir morphology at this angle. Number 1 to 7 are seven Chinese firs in the front row, they are numbered from left to right. It’s same for Figure 15 and Figure 16.
The simulation results of observation positions 2 and 3 in sample plot 1 were compared with the real situation, as shown in Figure 15 and Figure 16.
From Figure 15 and Figure 16, it can also be seen that the six trees in the front row of observation point 2 and the nine trees in the front row of observation point 3 had polymorphisms in their crown morphology due to different environmental influences in different directions. This study achieved a good simulation of the polymorphism of the Chinese fir.
The number of crown-type value points collected by CMGBCC was compared with the method based on b-spline interpolation. In this study, 3713 type value points were collected on 239 Chinese firs, while 4528 points were collected in the same trees by the previous method, which was collected every 1 m, reducing the number by 18%. The crown curves constructed by these two methods were compared. The crown curve regions constructed by the two methods were subjected to the operation of an intersection inversion. The obtained region was part of the crown curve whose range was wrongly divided and where there was less missing when divided based on the b-spline interpolation. Compared with the previous methods, the average result of the verified result showed that the error area that was missing or more than the true crown curve was reduced by 7.63%.

4. Discussion

The most obvious innovation in this study was to construct the CMGBCC model. In mathematics, at the progress of simulating GB-spline interpolation, the CMGBCC model has two advantages: (1) it has simplified steps for assigning the derivative value at the top point, and (2) there is no requirement for the equidistant collection of type value points. First, the GB-spline interpolation was suitable for the crown shape fitting as it could provide precise simulation results for the crown shape features. Compared with the b-spline interpolation, the number of type value points required in GB-spline interpolation decreased by 18%, and the accuracy of the crown shape constraint increased by 7.63%. Second, after fitting the crown shape curve, polymorphisms such as natural pruning, crown displacement, and crown shape difference could be better expressed. Third, adding different states of the withered branch to coincide with the real tree branch growth helped to improve the performance of the tree polymorphism. Therefore, the CMGBCC model improved the b-spline interpolation to construct the crown curve from a basic principle, which raised the crown curve fitting degree with true shape and optimized the crown curve construction process simultaneously. From the early 3D tree modeling to the current 3D tree polymorphism modeling [40,41], related research has considered the influence of environmental interactions and has added environmental factors to the 3D tree modeling process gradually. In the forest stand, the development of the tree’s polymorphism was influenced by the environment widely. It is an important reason that makes it difficult to restore a real tree’s morphology, and most 3D tree models cannot express the forest growth effectively. Based on the above points, CMGBCC provided a good solution. This study could be applied to other tree species, and the crown shape could be simulated by CMGBCC based on simply collecting corresponding type value points.
The 3D tree polymorphism model is the basis for the visual simulation of forest growth and management [42,43], and it is also the direct object of related research. For the simulation of forest growth and management visualization, it is necessary to represent the relationship between tree growth, environmental factors, and the tree growth allometric results caused by environmental factors to simulate reality. At the same time, the process of tree growth is accompanied by the new branches’ occurrence and the old branches’ death. Currently, related 3D tree modeling research has not considered withered branches and has not been represented in the simulation of tree growth visualization. In the 3D-CFPM, we considered the deficiencies of the 3D tree polymorphism model in simulating the branch withered status. In addition, for the forest management visual simulation, calculating the management indicators needs to use morphological and structural parameters. The 3D tree polymorphic model can provide relatively reliable basic parameters with morphological changes, which could make forest management visual simulation results closer to the real management situation.
In the future, we aim to combine the model with a constructed underlying algorithm, generate a large number of models in real-time to fill the model library and continue to explore the branch withered process to quantify the branches’ withered state at different heights to further improve the tree polymorphism simulation performance.

5. Conclusions

In this study, we proposed a 3D modeling method of the Chinese fir polymorphism, which, based on the analysis of the shortcomings of the 3D tree polymorphism simulation, constructed CMGBCC and considered the withered branch state effects of the tree morphology in the modeling process. This model improved the simulation of tree morphology, which is conducive to optimizing the basic model of tree growth and forest management visual simulation in forestry practice; therefore, simulation can be more in line with forestry laws.
The following are the highlights of this study:
  • Constructing CMGBCC improved the fitting function for the crown curve.
  • We considered the influence of different withered state branches on the whole shape in 3D tree modeling.
  • We simulated three types of polymorphisms, including natural pruning, crown displacement, and crown shape difference.

Author Contributions

Conceptualization, Z.C. and H.Z.; methodology, Z.C.; software, Z.C. and Y.L.; validation, Z.C., Y.L. and J.Z.; formal analysis, Z.C., T.Y. and K.L.; investigation, Z.C., Y.Z. and K.L.; resources, H.Z.; data curation, Z.C. and Y.L.; writing—original draft preparation, Z.C.; writing—review and editing, Z.C., Y.L., H.Z., J.Z. and T.Y.; visualization, Z.C. and Y.Z.; supervision, H.Z.; project administration, H.Z.; funding acquisition, H.Z. All authors have read and agreed to the published version of the manuscript.

Funding

This research was funded by the National Natural Science Foundation of China, grant number 32071681 and the Foundation Research Funds of IFRIT, grant number CAFYBB2021ZE005-2.

Data Availability Statement

Not applicable.

Acknowledgments

We are grateful to Huacong Zhang at the Experimental Center of Subtropical Forestry and Linlong Wang at the Research Institute of Forestry Policy and Information Techniques Chinese Academy of Forestry for help with data collection.

Conflicts of Interest

The authors declare no conflict of interest.

References

  1. Ogawa, K. Size Dependence of Leaf Area and the Mass of Component Organs during a Course of Self-Thinning in a Hinoki (Chamaecyparis obtusa) Seedling Population. Ecol. Res. 2003, 18, 611–618. [Google Scholar] [CrossRef]
  2. Wang, C.S.; Tang, C.; Hein, S.; Guo, J.J.; Zhao, Z.G.; Zeng, J. Branch Development of Five-Year-Old Betula Alnoides Plantations in Response to Planting Density. Forests 2018, 9, 42. [Google Scholar] [CrossRef] [Green Version]
  3. Busing, R.T. Disturbance and the Population Dynamics of Liriodendron Tulipifera: Simulations with a Spatial Model of Forest Succession. J. Ecol. 1995, 83, 45. [Google Scholar] [CrossRef] [Green Version]
  4. Fleck, S.; Mölder, I.; Jacob, M.; Gebauer, T.; Jungkunst, H.F.; Leuschner, C. Comparison of Conventional Eight-Point Crown Projections with LIDAR-Based Virtual Crown Projections in a Temperate Old-Growth Forest. Ann. For. Sci. 2011, 68, 1173–1185. [Google Scholar] [CrossRef] [Green Version]
  5. Mizunaga, H.; Umeki, T. The Relationships between Tree Size and Spatial Distribution of Foliage-Mass within Crowns of Japanese Cedars (Cryptomeria japonica) in Young Plantations. For. Ecol. Manag. 2001, 149, 129–140. [Google Scholar] [CrossRef]
  6. Locosselli, G.M.; de Camargo, E.P.; Moreira, T.C.L.; Todesco, E.; Andrade, M.d.F.; de André, C.D.S.; de André, P.A.; Singer, J.M.; Ferreira, L.S.; Saldiva, P.H.N.; et al. The Role of Air Pollution and Climate on the Growth of Urban Trees. Sci. Total Environ. 2019, 666, 652–661. [Google Scholar] [CrossRef] [PubMed]
  7. Petritan, A.M.; von Lüpke, B.; Petritan, I.C. Influence of Light Availability on Growth, Leaf Morphology and Plant Architecture of Beech (Fagus sylvatica L.), Maple (Acer pseudoplatanus L.) and Ash (Fraxinus excelsior L.) Saplings. Eur. J. For. Res. 2009, 128, 61–74. [Google Scholar] [CrossRef] [Green Version]
  8. Fang, K.; Chen, D.; Gou, X.; D’Arrigo, R.; Davi, N. Influence of Non-Climatic Factors on the Relationships between Tree Growth and Climate over the Chinese Loess Plateau. Glob. Planet. Change 2015, 132, 54–63. [Google Scholar] [CrossRef]
  9. Buechling, A.; Martin, P.; Canham, C. Climate and competition effects on tree growth in Rocky Mountain forests. J. Ecol. 2017, 105, 1636–1647. [Google Scholar] [CrossRef] [Green Version]
  10. Coomes, D.A.; Allen, R.B. Effects of Size, Competition and Altitude on Tree Growth. J. Ecol. 2007, 95, 1084–1097. [Google Scholar] [CrossRef]
  11. Tucker, G.F.; Lassoie, J.P.; Fahey, T.J. Crown Architecture of Stand-Grown Sugar Maple (Acer saccharum Marsh.) in the Adirondack Mountains. Tree Physiol. 1993, 13, 297–310. [Google Scholar] [CrossRef]
  12. Turkington, R.; Goldberg, D.E.; Olsvig-Whittaker, L.; Dyer, A.R. Effects of Density on Timing of Emergence and Its Consequences for Survival and Growth in Two Communities of Annual Plants. J. Arid Environ. 2005, 61, 377–396. [Google Scholar] [CrossRef] [Green Version]
  13. Davies, O.; Pommerening, A. The Contribution of Structural Indices to the Modelling of Sitka Spruce (Picea sitchensis) and Birch (Betula Spp.) Crowns. For. Ecol. Manag. 2008, 256, 68–77. [Google Scholar] [CrossRef]
  14. Marozau, A.; Kotszan, U.; Nowakowska, J.; Berezovska, D.; Moser, W.K.; Hsiang, T.; Oszako, T. The Influence of the Provenance and Spatial Structure on the Growth of European Silver Fir (Abies alba Mill.) of Autochthonous Origin in a Forest Plantation in the Białowieża Forest. Forests 2022, 13, 831. [Google Scholar] [CrossRef]
  15. Ma, Z.; Zhang, H.; Li, Y.; Yang, T.; Chen, Z.; Li, S. Visual Simulation of Chinese Fir Crown Growth Based on Spatial Structure. For. Res. 2018, 13, 150–157. (In Chinese) [Google Scholar] [CrossRef]
  16. Zhu, N.; Zhang, H.; Cui, Z.; Yang, T.; Li, Y.; Liu, H. Visual Simulation of Chinese Fir under Branch Height in Consideration of Spatial Structure. J. Nanjing For. Univ. Nat. Sci. Ed. 2022, 46, 51–57. (In Chinese) [Google Scholar] [CrossRef]
  17. Cui, Z.; Zhang, H.; Zuo, Y.; Yang, T.; Liu, Y.; Zhang, J.; Wang, L. The Distribution of under Branch Heights in Various Directions of the Three-Dimensional Chinese Fir Model. J. Nanjing For. Univ. Natural Sci. Ed. 2022, 46, 81–87. (In Chinese) [Google Scholar] [CrossRef]
  18. Crecente-Campo, F.; Marshall, P.; LeMay, V.; Diéguez-Aranda, U. A Crown Profile Model for Pinus Radiata D. Don in Northwestern Spain. For. Ecol. Manag. 2009, 257, 2370–2379. [Google Scholar] [CrossRef]
  19. Chen, Y.; Dong, C.; Wu, B. Crown Profile Modeling and Prediction Based on Ensemble Learning. Forests 2022, 13, 410. [Google Scholar] [CrossRef]
  20. Liu, M.; Zhang, H.Q.; Lu, K.N. Research on Three-Dimensional Simulation of Tree’s Morphology Based on Tree-Crown Growth Model. In Proceedings of the 2010 International Conference on Computational Intelligence and Software Engineering, Wuhan, China, 10–12 December 2010; IEEE: New York, NY, USA, 2010. [Google Scholar] [CrossRef]
  21. Runions, A.; Lane, B.; Prusinkiewicz, P. Modeling Trees with a Space Colonization Algorithm. Nat. Phenom. 2007, 6, 63–70. [Google Scholar]
  22. Palubicki, W.; Horel, K.; Longay, S.; Runions, A.; Lane, B.; Měch, R.; Prusinkiewicz, P. Self-Organizing Tree Models for Image Synthesis. ACM Trans. Graph. 2009, 28, 1–10. [Google Scholar] [CrossRef] [Green Version]
  23. Suzuki, T.; Ohsaki, K.; Sato, H. A representation method for todo-fir shapes using computer graphics. J. Jpn. For. Soc. 1992, 74, 504–508. (In Japanese) [Google Scholar]
  24. Eilers, P.H.C.; Marx, B.D. Flexible Smoothing with B-Splines and Penalties. Stat. Sci. 1996, 11, 89–102. [Google Scholar] [CrossRef]
  25. Wu, Z.; Zhou, M.; Wang, X. Interactive Modeling of 3D Tree with Ball B-Spline Curves. Int. J. Virtual Real. 2009, 8, 101–107. [Google Scholar] [CrossRef] [Green Version]
  26. Liu, X.; Wang, X.; Wu, Z.; Zhang, D.; Liu, X. Extending Ball B-Spline by B-Spline. Comput. Aided Geom. Des. 2020, 82, 101926. [Google Scholar] [CrossRef]
  27. Harmening, C.; Hobmaier, C.; Neuner, H. Laser Scanner–Based Deformation Analysis Using Approximating B-Spline Surfaces. Remote Sens. 2021, 18, 3551. [Google Scholar] [CrossRef]
  28. Sun, Y. Existence of Triple Positive Solutions for a Third-Order Three-Point Boundary Value Problem. J. Comput. Appl. Math. 2008, 221, 194–201. [Google Scholar] [CrossRef] [Green Version]
  29. Böhm, W. Generating the Bézier Points of B-Spline Curves and Surfaces. Comput. Des. 1981, 13, 365–366. [Google Scholar] [CrossRef]
  30. Beccari, C.V.; Casciola, G. A Cox-de Boor-Type Recurrence Relation for C1 Multi-Degree Splines. Comput. Aided Geom. Des. 2019, 75, 101784. [Google Scholar] [CrossRef]
  31. Fritsch, D.; Kada, M. Visualisation Using Game Engines. Geo-Informations-Systeme 2004, 2004, 32–36. [Google Scholar]
  32. Tang, X.; Pérez-Cruzado, C.; Fehrmann, L.; Álvarez-González, J.G.; Lu, Y.; Kleinn, C. Development of a Compatible Taper Function and Stand-Level Merchantable Volume Model for Chinese Fir Plantations. PLoS ONE 2016, 11, e0147610. [Google Scholar] [CrossRef] [Green Version]
  33. Zhang, S.; Sun, J.; Duan, A.; Zhang, J. Variable-Exponent Taper Equation Based on Multilevel Nonlinear Mixed Effect for Chinese Fir in China. Forests 2021, 12, 126. [Google Scholar] [CrossRef]
  34. Duan, A.; Zhang, S.; Zhang, X.; Zhang, J. Development of a Stem Taper Equation and Modelling the Effect of Stand Density on Taper for Chinese Fir Plantations in Southern China. PeerJ 2016, 2016, e1929. [Google Scholar] [CrossRef] [PubMed] [Green Version]
  35. Lu, K.; Zhang, H.; Liu, M. Study on Plant Architecture of Cunningham ia lanceolata Based on Measured Data. For. Res. 2011, 24, 132–136. (In Chinese) [Google Scholar] [CrossRef]
  36. Sun, H.; Zhang, J.; Duan, A.; He, C. Estimation of the Self-Thinning Boundary Line within Even-Aged Chinese Fir (Cunninghamia lanceolata (Lamb.) Hook.) Stands: Onset of Self-Thinning. For. Ecol. Manag. 2011, 261, 1010–1015. [Google Scholar] [CrossRef]
  37. Zhu, W.; Liu, Z.; Jia, W.; Li, D. Modelling the Tree Height, Crown Base Height, and Effective Crown Height of Pinus Koraiensis Plantations Based on Knot Analysis. Forests 2021, 12, 1778. [Google Scholar] [CrossRef]
  38. Vovides, A.G.; Berger, U.; Grueters, U.; Guevara, R.; Pommerening, A.; Lara-Domínguez, A.L.; López-Portillo, J. Change in Drivers of Mangrove Crown Displacement along a Salinity Stress Gradient. Funct. Ecol. 2018, 32, 2753–2765. [Google Scholar] [CrossRef] [Green Version]
  39. Longuetaud, F.; Piboule, A.; Wernsdörfer, H.; Collet, C. Crown Plasticity Reduces Inter-Tree Competition in a Mixed Broadleaved Forest. Eur. J. For. Res. 2013, 132, 621–634. [Google Scholar] [CrossRef]
  40. Tanveer, M.; Thomas, A.; Wu, X.; Zhu, H. Simulate forest trees by integrating l-system and 3d cad files. In Proceedings of the 2020 3rd International Conference on Information and Computer Technologies (ICICT), San Jose, CA, USA, 9–12 March 2020. [Google Scholar] [CrossRef]
  41. Wang, Z. Cloud Theory and Fractal Application in Virtual Plants. Int. J. Intell. Syst. Appl. 2011, 3, 17–23. [Google Scholar] [CrossRef]
  42. Tohru, N.; Tohru, N.; Mitsuo, M. Visualization of Optimized Solution Space Using a Simulation System for the Development of Local Forest Management Planning. Ann. For. Res. 2016, 59, 117–128. [Google Scholar] [CrossRef] [Green Version]
  43. Peng, F.; Zheng, H.; Lu, S.; Shi, Z.; Liu, X.; Li, L. Growth Model and Visualization of a Virtual Jujube Tree. Comput. Electron. Agric. 2019, 157, 146–153. [Google Scholar] [CrossRef]
Figure 1. The distribution of eight plots and the distribution of trees in each plot.
Forests 14 01267 g001
Figure 2. The simulation of CMGBCC.
Forests 14 01267 g002
Figure 3. The bark and leaf texture maps of Chinese fir.
Forests 14 01267 g003
Figure 4. The simulation process of natural pruning.
Forests 14 01267 g004
Figure 5. The simulation process of crown displacement.
Forests 14 01267 g005
Figure 6. The simulation process of crown shape difference.
Forests 14 01267 g006
Figure 7. The 3D model of the Chinese fir trunk.
Forests 14 01267 g007
Figure 8. The dead first-level branch model.
Forests 14 01267 g008
Figure 9. The branch model with a very small number of surviving leaves.
Forests 14 01267 g009
Figure 10. The branch model with 50% dead leaves.
Forests 14 01267 g010
Figure 11. The branch model without dead and dropped leaves.
Forests 14 01267 g011
Figure 12. 3D-CFPM in spatial structure unit.
Forests 14 01267 g012
Figure 13. The result of CMGBCC.
Forests 14 01267 g013
Figure 14. Comparison of real photos and simulation results of observation point 1 in sample plot 1.
Forests 14 01267 g014
Figure 15. Comparison of real photos and simulation results of observation point 2 in sample plot 1.
Forests 14 01267 g015
Figure 16. Comparison of real photos and simulation results of observation point 3 in sample plot 1.
Forests 14 01267 g016
Table 1. Statistics of the basic type of value points of trees in the sample plot.
TypeHeight/mDBH/cmUBH/mHMCW/mCrown Width/mAge/a
Max30.436.514.618.14.030
Min8.88.34.57.20.412
Average17.823.68.013.91.724
Table 2. The rules of constructing branch models.
The Level of BranchIndexDescription
first-level branchwithered stateamount of needle cover on branches
first-level branchelevation anglethe angle between the branch and the vertical direction of the trunk
first-level branchbranch lengthlength of branch
first-level branchbase diameterbranch base diameter
second-level branchelevation anglethe angle between the branch and the vertical direction of the primary branch
second-level branchazimuththe angle between the branches in the horizontal direction of the primary branch
second-level branchundershootlength between the branch point and base
Table 3. The trunk model properties.
Tree Height RangeModel Height/mDBH/cm
8.0~9.08.813.5
14.0~15.014.520
20.0~21.020.527.3
26.0~27.026.429.7
30.0~31.030.431.2
Table 4. The comparison of the two methods.
Indexb-Spline InterpolationCMGBCC
Derivative value at the top pointAdd manually and uncontrollable factors of the modelIt does not need to manually input the derivative value at the top point, simplifying the model construction process and reducing the error caused by humans
Collection rules of type value pointsEqual distance acquisitionIt can be collected according to the crown shape change rules
Collection interval of type value pointsEqual distance acquisitionAcquisition at any distance
Model complexityThe model form is relatively simpleThe model form is relatively complex
Table 5. Statistics of forest trees in sample plot 1.
TypeHeight/mDBH/cmUBH/mHMCW/mCrown Width/m
Max28.334.214.217.03.8
Min9.69.34.98.60.4
Average17.020.48.313.11.9
Disclaimer/Publisher’s Note: The statements, opinions and data contained in all publications are solely those of the individual author(s) and contributor(s) and not of MDPI and/or the editor(s). MDPI and/or the editor(s) disclaim responsibility for any injury to people or property resulting from any ideas, methods, instructions or products referred to in the content.

