Abstract
Soil organic carbon (SOC) forms the largest terrestrial organic carbon (C) pool, which is regulated by complex connections between exogenous C input, microbial activity, and SOC conversion. Few studies have examined the changes in natural abundance C due to microbial activity after exogenous C inputs in karst lime soils in China. In this research, the 13C isotope tracer technique was employed to investigate the priming effect of SOC on typical lime soil (0~20 cm) of 13C_litter and 13C_calcium carbonate (CaCO3) through a mineralization incubation experiment. Samples were collected at 5, 10, 20, 40, 60, and 80 days of incubation and analyzed for SOC mineralization, SOC distribution across fractions (>250 μm, 53~250 μm, and <53 μm), and soil microbial diversity. A control consisting of no exogenous C addition was included. SOC mineralization and SOC priming were considerably higher (15.48% and 61.00%, respectively) after litter addition compared to CaCO3. The addition of either litter or CaCO3 reduced the total organic C (TOC) and macroaggregate (>250 μm) and microaggregate (53~250 μm) C fractions by 2150.13, 2229.06, and 1575.06 mg C kg−1 Cbulk on average and increased the mineral particulate C fraction (<53 μm) by 1653.98 mg C kg−1 Cbulk. As the incubation time extended, a significantly positive correlation was apparent between SOC priming and soil fungal diversity, as well as between the mineral particulate C fraction and soil bacterial diversity. The effect of soil fungal diversity on SOC priming (R = 0.40, p = 0.003) significantly exceeded that of bacterial diversity on SOC sequestration (R = 0.27, p = 0.02). Our results reveal that after adding litter or CaCO3, soil fungi stimulate SOC mineralization and decomposition and soil bacteria enhance SOC sequestration, with the effects of fungi being more pronounced. These findings can provide a theoretical basis for understanding C sequestration and emission reduction in karst lime soils.
1. Introduction
China’s terrestrial ecosystems have a carbon stock of approximately 350 billion tons of carbon dioxide (CO2), of which vegetation and soils account for approximately 50 and 300 billion tons, respectively. Hence, soil organic carbon pools constitute a biologically important component of the global C cycle [1]. Forest SOC pools harbor about 40% of organic C in the 0–1 m soil layers and play an irreplaceable role in maintaining the global climate system, regulating the global C balance, and slowing the rise of greenhouse gas concentrations in the atmosphere [2,3].
As an important process in the C cycle, SOC mineralization has a direct impact on SOC stability [4,5]. Extensive research has found that SOC mineralization is predominantly affected by exogenous matter [6,7]. When added to soil, exogenous C first activates soil microbial activity. This phenomenon is referred to as “microbial activation”. New organic matter (OM) that enters the soil provides sufficient C and energy for microbes, thereby rapidly promoting microbial metabolism and biomass growth [8,9]. Bacteria and fungi are the two main taxa of microbial decomposer communities capable of decomposing OM and directly involved in SOC conversion [7,10].
The addition of C substrate often modifies the rate of soil organic matter (SOM) decomposition. This is known as the priming effect [11]. Recent advances in C cycle modeling suggest that soil C priming is a major factor for global C distribution prediction as it plays a crucial role in determining C exchange between soils and the atmosphere [12,13]. However, adding exogenous C can either promote or inhibit organic C mineralization through its impact on microbial activities, giving rise to a positive or negative priming effect and, thus, enhancing or reducing soil C sequestration [14,15,16,17,18]. Kuzyakov et al. [8] found that fresh OM (e.g., litter) input accelerated microbial biomass turnover in the short term, with a significant positive priming effect, whereas adding active C decreased microbial biomass turnover, leading to a significant negative effect. Zheng et al. [19] found that adding substrates such as glucose and cellulose resulted in a negative C balance and reduced soil C content, becoming a negative priming effect. In contrast, a meta-analysis by Liang et al. [20] concludes that, even when adding glucose could lead to a negative priming effect, the net soil C content may increase if the C released from the added C substrate exceeds the priming-induced C loss. Zhang et al. [21] also found that adding fresh organic C can be beneficial by stimulating specific microbial populations and increasing organic C decomposition. Conversely, the negative effect of soil priming due to a decreased efficiency in the microbial substrates’ use has been reported recently [22]. The microbial community structure and activity play a substantial role in SOC mineralization [23]. At the early stages of the mineralization process, exogenous C can provide sufficient energy and C for microbes, increasing their activity and thus stimulating C turnover. However, as the mineralization process proceeds, the microbial nutrient supply becomes insufficient, reducing the C turnover rate [24].
In southwestern China, carbonatite forms the core of the East Asian karst region, one of the world’s three major concentrated karst regions [25]. Guizhou Province represents about 25.8% of China’s karst area [26]; this is a specific, subtropical, non-zonal region characterized by slow soil formation, the presence of calcium-rich and alkaline soils, and a distinct soil C cycle [27], differing markedly from the features of non-karst regions.
Litter and calcium carbonate (CaCO3) are the principal sources of C in karst forests [28]. Some studies have concluded that adding litter or CaCO3 can stimulate soil C mineralization, mainly because these substances increase soil microbial activity and thus affect the soil CO2 respiration rate [29,30]. Moreover, the continuous addition of litter and CaCO3 to soils was reported to improve soil fertility within a short period and enhance their C sink capacity [31]. Previous studies have shown that adding rice straw generally alters the composition of soil microbial communities and increases the SOC mineralization rate [21,32]. Nevertheless, little is known about the effects of adding litter and CaCO3 on C mineralization in karst forest soils in southern China, as well as the role of microbes in the C mineralization process [31,33].
As is known to all, exogenous C addition affects the composition of bacterial and fungal communities and thus affects the mineralization decomposition of soil C [34]. This research investigated the effects of adding litter or CaCO3 to typical lime soil through a 13C-isotope mineralization incubation experiment. This article primarily examines the effects of adding litter or CaCO3 to lime soil in three key areas: (1) the SOC priming effect; (2) SOC content and distribution across size fractions; and (3) effects of bacteria and fungi on soil C priming and sequestration after the addition of these C sources.
2. Materials and Methods
2.1. Study Site and Soil Sampling
The experimental soil was collected at the end of 2019 from a shrub forest in the Dashahe Nature Reserve (DNR) in the southern Chinese province of Guizhou. The DNR is in the transition zone between subtropical and temperate regions, encompassing a total area of 270 km2 at 564–1940 m above sea level (average: 1252 m). This natural area is under a humid monsoon climate and has an average annual temperature of 12.1 °C, an annual precipitation of 1194 mm, and an annual sunshine duration of 1134 h. Featuring a karst landscape on soluble carbonate rock formations, the DNR is extremely abundant in biological resources. With 3594 plant species (belonging to 1082 genera and 296 families) and 208 species of macrofungi (distributed in 95 genera and 47 families), the DNR constitutes one of the most precious gene pools of biological species in China’s central subtropical region. Table 1 summarizes the basic information on the study area.

Table 1.
Basic information of the environmental background of sample point.
Eight soil cores were collected at depths of 0~20 cm using a soil auger (10 cm diameter) and mixed to form one composite sample (about 5.5 kg). After removing large roots, wood, and litter, the soil was distributed in aseptic plastic bags, sealed, and transported to the laboratory. Samples weighing 3.5 kg were sieved (<2 mm), mixed completely, and stored at 4 °C for the subsequent incubation experiments. The remaining samples were air-dried and used for the soil’s physical and chemical characterization, as summarized in Table 2.
Table 2.
Selected properties of the experimental soil. BD: soil bulk density, SOC: soil organic carbon, TN: total nitrogen, TP: total phosphorus, Lci: litter carbon input, Ca: exchangeable calcium, Ur: soil urease, Npa: neutral phosphatase, Sa: soil sucrose.
2.2. Preparation of 13C-Labeled Litter and Application of Labeled 13C Sources to Soil
Labeled litter was obtained by labeling with 13C potted Koelreuteria paniculata (a major tree species in karst forests) seedlings over the period of August–October 2020 using the pulse-labeling method. Ten pots containing K. paniculate seedlings were placed in a special hermetically sealed Plexiglas growth chamber, into which 13CO2 produced by the reaction between NaH13CO3 and HCl (NaH13CO3 + HCl = NaCl + H2O + 13CO2) was injected periodically to allow 13C to become introduced into K. paniculate tissues through photosynthesis (Figure 1①). This procedure was performed every half-month. Each time, 5.0 g of NaH13CO3 and 0.1 M of HCl were injected into the chamber to allow them to react fully with each other, producing 1.31 L of 13CO2. Three months later, after 6 injections, K. paniculate stems and leaves were harvested. The collected samples were dried, crushed, and sieved through a 5 mm sieve to produce an enriched 13C_labeled litter for subsequent use. NaH13CO3 (cat number: IR-33294, enrichment: 99 atom%) and Ca13CO3 (cat number: IR-32318, enrichment: 98 atom%) which were to be applied directly to the soil were purchased from Shanghai ZZBio Co., Ltd., Shanghai, China.
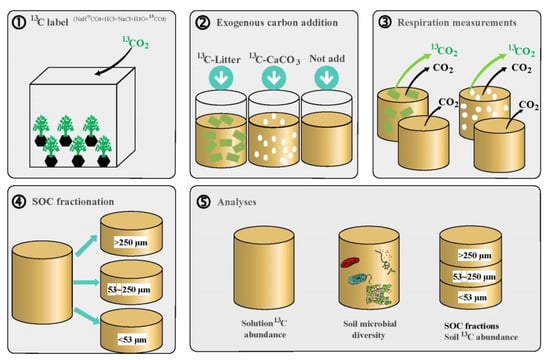
Figure 1.
Experimental setup. ① The pulse-labeling method was employed to label with 13C Koelreuteria paniculata seedlings, from which 13C_litter was obtained. Every half-month, 13CO2 generated by the reaction between NaH13CO3 and HCl was injected into a closed chamber where K. paniculata seedlings were growing. After six 13CO2 pulses (three-month-old plants), the stems and leaves were harvested, mixed, dried, and ground finely through a 5 mm sieve to produce enriched 13C_litter. ② The lime soil was subjected to three treatments: addition of 13C-litter, addition of 13C_CaCO3, and no addition of exogenous C. After adding the C source, soil samples were thoroughly mixed and incubated for 80 days. ③ Mineralization (CO2 release) was measured at 10, 20, 40, 60, and 80 days of incubation with three replicates per treatment. ④ Air-dried and finely ground soil samples were used to determine C fractionation using a sieve-based system (>250 μm, 53~250 μm, <53 μm). ⑤ A small portion of each soil sample was used for microbial determinations; C content and 13C abundance were determined in aqueous solutions; the distribution of labeled C across fractions was analyzed using an Elementar vario cube TOC-isoprime100 organic C analyzer–stable isotope mass spectrometer.
To remove the inorganic C from the soil samples, 0.01 M of HCl was added until no bubbles were produced. Subsequently, the soil samples were dried in an oven and injected with distilled water to adjust moisture to approximately 60% of the field moisture capacity, followed by a pre-incubation at 25 °C for one week. Next, the soil samples were laid flat on a plastic film. Crushed 13C_litter or 13C_CaCO3 was spread evenly on the soil samples at a rate of 0.1 g 50 g−1 soil (in amounts sufficient to achieve the individual experimental treatment plan). After the mixture was adequately stirred with a glass rod, the plastic film was folded and carefully shaken until the added substance was well blended with the soil. The soils thus obtained were used in the subsequent incubation analyses. The 13C abundance in 13C_litter (δlit 13C) and in the commercial 13C_CaCO3 (δCaC 13C) was 1221.05 and 99.00 relative to the Vienna Pee Dee Belemnite (V-PDB) standard, respectively.
2.3. Incubation Experiment
2.3.1. Experimental Design
Three treatments were included: (1) no addition of any exogenous substance (control, CL); (2) addition of 0.1 g of 13C_litter 50 g−1 soil (LL); and (3) addition of 0.1 g of 13C_CaCO3 50 g−1 soil (CCL) (Figure 1②). A total of 18 replicates per treatment were performed to allow the collection of 3 replicated samples at each time-point (5, 10, 20, 40, 60, and 80 days). A total of 54 mineralization incubation microsystems were set (three treatments × six sampling times × three replicates per sampling time).
2.3.2. Mineralization Incubation Experiment
To determine SOC mineralization, the alkali absorption method was applied. Over the period of March–May 2021, 50 g of each isotopically labeled soil sample was placed in a 50 mL beaker (with sufficient replicates to achieve the experimental treatment plan) and the water content was adjusted with deionized water to approximately 60% of the field moisture capacity. The beaker was then placed at the bottom of a 1000 mL wide-mouth bottle and preincubated at 25 °C for 7 d. Subsequently, a 50 mL absorbent cup containing 10 mL of 0.1 M NaOH solution was placed at the bottom of the incubation bottle which was then sealed and further incubated in the dark at 25 °C. Three experimental units per treatment were taken out at each time point and analyzed together with a blank control (no exogenous C source). For some replicates, the absorbent cup was removed at 5, 10, 20, 40, 60, and 80 days of incubation, immediately after which the bottle was sealed to allow incubation to continue. Nine absorbent cups were taken out at each time point. After adding two drops of phenolphthalein indicator, the remaining NaOH solution was titrated with 0.1 M of HCl. The following reaction was expected to occur inside the sealed microsystem: 13CO2 + 2NaOH = Na213CO3 + H2O (Figure 1③). The amount of mineralized C released as CO2 was indirectly estimated from the titration of the remaining NaOH solution. Then, the aqueous solution in each absorbent cup was transferred into a 10 mL centrifuge tube to determine the 13C abundance. A total of 58 soil samples (the 54 samples already described and 4 additional samples not subjected to incubation) were subsequently processed. Each sample was divided into two parts. One part was placed in a −70 °C refrigerator for soil microbial determinations, whereas the other part was dried and ground finely for SOC fractionation.
2.4. SOC Fractionation
SOC fractionation was carried out using the wet-sieve fractionation method developed by Six et al. [35]. After air drying and passing through a 2 mm sieve, soil samples were weighed and placed, together with 15 glass beads, on the top sieve of a microaggregate separator sieve set (top-sieve mesh size: 250 μm; bottom-sieve mesh size: 53 μm). The separator sieve set was allowed to vibrate vertically for 30 min; aggregates >250 μm remained on the top sieve, and microaggregates 53~250 μm remained on the bottom sieve, whereas clay and silt particles passed through the 53 μm sieve (Figure 1④). Then, 25 mL of a 0.25 M CaCl2 solution was added to the bucket below the inferior sieve and centrifuged at 1730× g for 15 min to separate the clay from the silt particle fraction. Each fraction was transferred to an aluminum box and then steam-dried using a water bath, followed by drying in an oven at 60 °C for 12 h and fine grinding and passing through a 0.25 mm sieve. The >250 μm, 53~250 μm, and <53 μm fractions consisted of macroaggregates, microaggregates, and mineral particulate organic C, respectively. A stable isotope ratio mass spectrometer was used to determine the organic C content and 13C abundance in all samples (Figure 1⑤).
2.5. Soil Physical and Chemical Properties
Soil physicochemical properties were determined based on the methods described in Bao [36]. Soil pH was determined using the potentiometric method with a soil–water ratio of 1:2.5 (pH meter, PHS-25), and bulk density was measured using the ring-knife weighing method. The oil bath-heated potassium dichromate oxidation volumetric technique was applied to calculate the SOC content (thermostatic oil bath, HH-S). Total nitrogen was determined by Kjeldahl distillation (Automatic kieldahl apparatus, Kjeltec 8100), while the molybdenum antimony colorimetric and the NaOH fusion–flame photometric methods allowed the estimation of total phosphorus and total potassium contents (ultraviolet spectrophotometer, UV-9000s and flame spectrophotometer, FP6420), respectively. The exchangeable Ca content was measured using the ammonium acetate exchange–atomic absorption spectrophotometry method (atomic absorption spectrometer, ZEEnit-700P). Soil enzyme activity was determined based on the methods described in Guan [37]. Soil urease, sucrase, and neutral phosphatase activity were determined using the phenol–sodium hypochlorite colorimetric method, the 3,5-dinitrosalicylic acid colorimetric method, and the sodium benzene phosphate colorimetric method (ultraviolet spectrophotometer, UV-9000s), respectively.
2.6. Soil Microbial Analysis
2.6.1. DNA Extraction and PCR Amplification
Total DNA extraction was performed with the E.Z.N.A.®Soil DNA Kit (Omega Bio-tek, Norcross, GA, USA) according to the manufacturer’s instructions. The concentration and purity of DNA were determined using a NanoDrop 2000 spectrophotometer. The DNA extraction quality was evaluated using 1% agarose gel electrophoresis. Two primers, 338F (5′-ACTCCTACGGGAGGCAGCAG-3′) and 806R (5′-GGACTACHVGG GTWTCTAAT-3′), were used to amplify the V3–V4 variable region of the bacterial 16S rRNA gene [38]. Two other primers, ITS1F (5′-CTTGGTCATTTAGAG GAAGTAA-3′) and ITS2R (5′-GCTGCGTTCTTCATCGATGC-3′), were used to amplify the fungal internal transcribed spacer (ITS1 region) [39]. PCR products were purified using the AxyPrep DNA Gel Extraction Kit (Axygen Biosciences, Union City, CA, USA) and quantified using QuantiFluor™-ST (Promega, Madison, WI, USA). The processed PCR amplification products were sequenced on the IlluminaMiSeq platform (Illumina, San Diego, CA, USA) using the double-end sequencing method developed by Shanghai Majorbio Bio-pharm Technology Co., Ltd., Shanghai, China.
2.6.2. Sequence Data Processing
Paired-end sequences were merged into a single sequence using FLASH v.1.2.11, followed by quality filtering using Trimmomatic v.0.33 (average quality score: >20). Chimeric sequences were then identified and removed using the UCHIME algorithm. Valid reads were thus obtained. Operational taxonomic units (OTUs) were identified using Uparse v.7.0 based on a similarity threshold of 97% [40]. To reduce spurious OTUs, those with fewer than two representative sequences were removed. The most representative sequence of each OTU was ultimately selected. Taxonomic information was annotated using the Ribosomal Database Project classifier based on Silva 132 and Unite 8.0 databases for bacteria and fungi, respectively, with a confidence threshold of 70%. To minimize the effects of variations in readings from different samples, all the samples were normalized based on the minimum sequence.
2.7. Calculations and Statistical Analysis
2.7.1. Data Calculation Methods
The organic C content in each fraction (mg kg−1 soil) = organic C mass fraction in each fraction (%) × organic C content in each fraction (mg kg−1 fraction).
The litter C input (g m−2) = litter of the standing crop per unit area (g m−2) × C content in the litter (g kg−1)/1000.
The cumulative amount of organic C mineralized (mg CO2 kg−1) refers to the total amount of soil CO2 released over the period from the beginning of the incubation process to a certain time point.
The following equations allow the mineralized C originating from exogenous C (Q) and native SOC (Qsoi) in mg kg−1 to be calculated:
where Qtot is the amount of respiratory soil mineralization (mg kg−1), δtot is the δ13C value of the mineralized solution during mineralization, δsoi is the δ13C value of the soil during mineralization, and δ is the δ13C value of the litter or CaCO3.
Q = Qtot × (δtot − δsoi)/(δ − δsoi)
Qsoi = Qtot × (δ − δ tot)/(δ − δsoi)
The following equation describes the SOC priming effect:
where CO2-tre is the organic C originating from the native soil in the LL or CCL treatment and CO2-ck is the organic C originating from the native soil in the CL treatment (both in mg kg−1).
PE = CO2-tre − CO2-ck
The following equations allow the soil C originating from exogenous C and native SOC to be calculated:
where δ13Cafter is the δ13C value of different soil C fractions after a certain time of incubation, δ13Ctre is the δ13C value of the litter or CaCO3, δ13Cbefore is the δ13C value of different soil C fractions before a certain time of incubation, f is the proportion of native SOC after a certain time of incubation (%), Ctre is the amount of C derived from the litter or CaCO3 (mg kg−1), Csoi is the amount of C derived from native SOC (mg kg−1), and Ctotal is the C content in the different soil fractions after a certain time of incubation (mg kg−1).
δ 13Cafter = δ 13Ctre × (1 − f) + f × δ 13Cbefore
Ctre = (1 − f) × C total
Csoi = f × C total
2.7.2. Data Processing and Analysis
SPSS (16.0) was used to perform a statistical analysis. A two-way analysis of variance (ANOVA) was conducted to analyze the effects of exogenous matter addition and incubation time on SOC mineralization. Means were compared by the least significant difference test and Student’s t-test, and the level of significance (α) was set at 0.05. Linear regressions in R were performed to investigate whether soil microbial characteristics significantly predicted the SOC priming effect and the soil mineral particulate C (<53 μm fraction C) estimate. The decision coefficient R2 depended on the optimal simulation models. Path analysis (using the plspm package in R) was used to investigate the direct and indirect effects of microbial variables on SOC mineralization. To simplify the model, Shannon index values for both bacterial and fungal communities were used because they were shown to affect significantly SOC mineralization in previous Pearson correlation analyses. We calculated the standardized total effects (direct plus indirect effects from the path analysis) of the bacterial and fungal Shannon index on SOC mineralization.
3. Results
3.1. Soil C Mineralization and Native Soil C Priming
By analyzing 13CO2, we could differentiate between CO2 derived from the native SOC and CO2 derived from the exogenous compounds. In the 13C_litter amended soil, native-soil-derived CO2 (3360.79 mg CO2-C kg−1 Cbulk) and net litter-derived CO2 (33.52 mg CO2-C kg−1 Cbulk) were significantly higher than in the 13C_CaCO3 amended soil (native-soil-derived CO2: 2855.76 mg CO2-C kg−1 Cbulk; net CaCO3-derived CO2:13.04 mg CO2-C kg−1 Cbulk), with p < 0.01 and t = 6.003; p < 0.001 and t = 18.512, respectively (Figure 2a,b). Litter-derived CO2 only accounted for 0.99% of the total respiration in the 13C_litter treatment, and the CaCO3-derived CO2 for around 0.45% in the 13C_CaCO3 amended treatment. The 13C_litter addition induced a higher priming effect than 13C_CaCO3 addition (Figure 2c,d), accounting for a net release of 832.12 mg CO2-C kg−1 Cbulk from the native SOC compared to 327.09 mg CO2-C kg−1 Cbulk in the 13C-CaCO3 treatment (p < 0.001, t = 80.689).
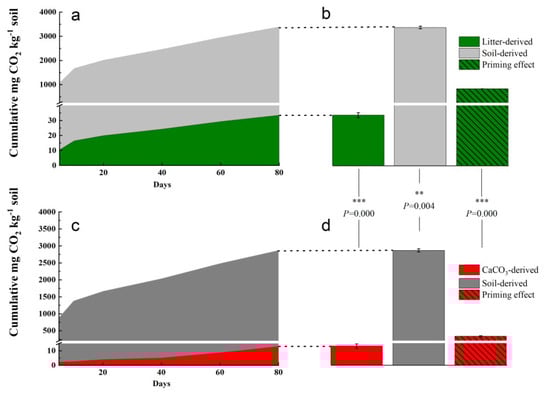
Figure 2.
Cumulative heterotrophic respiration in 13C_litter and 13C_CaCO3 addition soils. Respired CO2-C mg kg−1 soil during the 80-day incubation in (a,b) 13C_litter and (c,d) 13C_CaCO3 addition soil. The total respired CO2-C in soil with (b) 13C_litter and (d) 13C_CaCO3 addition is displayed on the right (means, SDs displayed with errors bars, n = 3 independent replicates) together with the total priming effect. We report CO2-derived C per amount C in incubated samples to directly showcase the mechanistic process level. Asterisks represent significant differences between the textures (*** p < 0.001, ** 0.001 ≤ p < 0.01). Statistical significance was analyzed using an unpaired two-sided t-test.
3.2. Litter-Derived and CaCO3-Derived C Distribution across Different Size Fractions
We assessed the contribution of OC derived from the litter and CaCO3 to the different OM pools. The soil-derived C in mg kg−1 Cbulk was similarly distributed across OM fractions in both treatments (p = 0.348, t = −1.062), showing a not statistically significant tendency towards a decreasing contribution to the >250 μm and 53~250 μm fractions as far as the incubation time progressed, with decreases of 2916.71 and 1841.06 mg C kg−1 Cbulk, respectively, in the 13C-litter-treated soil and of 2507.18 and 1905.14 mg C kg−1 Cbulk in the 13C_CaCO3-treated soil, coinciding with a trend towards an increasing contribution to the <53 μm fraction from the 5th day to the 80th day of incubation (with increases of 1396.99 and 1556.55 mg C kg−1 Cbulk in LL and CCL, respectively) (Figure 3a).
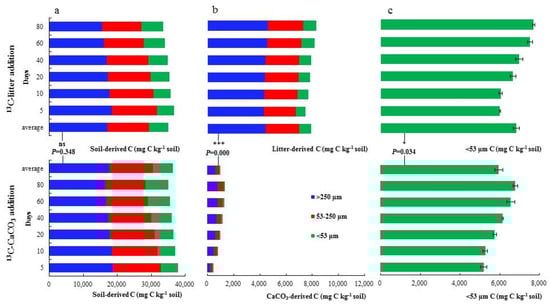
Figure 3.
Allocation of soil-derived and litter-derived C to SOC fractions in 13C_litter and 13C_CaCO3 addition soils. Content of > 250 μm, 53~250 μm, and < 53 μm fraction C and in mg C kg−1 soil of (a) soil, (b) allothigene (13C_litter, 13C_CaCO3), and (c) all originate in different incubation periods of 13C_litter and 13C_CaCO3 addition soils (means, SDs displayed with errors bars, n = 3 independent replicates). Asterisks represent significant differences between the average values of different addition soils (*** p < 0.001, * 0.01 ≤ p < 0.05, ns p ≥ 0.05). Statistical significance was analyzed using an unpaired two-sided t-test.
Interestingly, a significant difference was found in the amount of litter-derived C compared to CaCO3-derived C across OM fractions. While the addition of 13C_litter led to 5535.91, 3205.87, and 1120.91 mg C kg−1 Cbulk in >250, 53~250, and <53 μm fractions, respectively, in 13C_CaCO3-amended samples, these values were much lower: 583.48, 321.06, and 97.11 mg C kg−1 Cbulk, respectively (p = 0.000, t = 330.683). However, in both treatments, most of the C supplied by the exogenous source was found in the >250 μm fraction, followed by 53~250 and <53 μm fractions, and a non-significant increasing trend with the extension of the incubation time was observed (for >250 μm, 53~250 μm, and <53 μm fractions, increases of 337.27, 336.46, and 329.87 mg C kg−1 Cbulk in the 13C-litter treatment and of 588.49, 259.63, and 24.59 mg C kg−1 Cbulk in the 13C_CaCO3 treatment, respectively) (Figure 3b). The evolution of total C in the <53 μm fraction is shown in Figure 3c. Slight differences and an increasing trend with the extension of the incubation time were detected for both treatments (6899 and 5951.07 mg C kg−1 Cbulk for soil amended with 13C_litter and 13C_CaCO3, respectively) (p = 0.034, t = 15.564).
3.3. Soil Microbial Community Characteristics and Diversity
The effect of exogenous C additions on soil bacterial and fungal community composition is shown in Figure 4. In the unamended soil (CL), bacteria (Figure 4a) and fungi (Figure 4d) comprising >1% of the community did not change significantly throughout the incubation period. However, several bacterial groups showed a decreasing trend in LL and CCL treatments (Figure 4b,c), while unclassified_k_Fungi showed an increasing trend (Figure 4e,f), both mainly at the expense of increases in minority taxa (those comprising <1% and grouped as “others”). Massilia decreased by 9.82%, 18.84%, and 10.88% with the extension of the incubation time in the CL, LL, and CCL treatments, respectively, while unclassified_k_Fungi increased by 21.09%, 43.43%, and 34.52%. However, the relative abundance of bacterial and fungal communities comprising >1% in the samples not subjected to incubation did not show significant differences among treatments (Figure 4g,h).
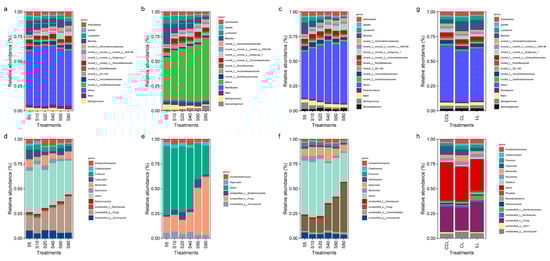
Figure 4.
Characteristics of the soil microbial community composition at the genus level. (a,b) and (c) show the composition of the soil bacterial community in the CL (no addition of exogenous carbon), LL (13C_litter addition), and CCL (13C_CaCO3 addition) treatments at different stages of incubation, respectively. (d–f) show the composition of the soil fungal community in the CL (no addition of exogenous carbon), LL (13C_litter addition), and CCL (13C_CaCO3 addition) treatments at different stages of incubation, respectively. (g,h) show the composition of the bacterial and fungal communities in different treatments, respectively. The composition of each community with an abundance greater than 1% is shown in the figure, whereas the communities with an abundance less than or equal to 1% are classified as others (means, n = 3 independent replicates).
The Shannon diversity index of soil bacteria increased significantly with the extension of the incubation time in LL and CCL treatments (by 0.79 and 0.43, respectively), whereas that of fungi decreased significantly (by 1.72 and 1.32, respectively). Bacteria and fungi diversity changed most obviously in the LL treatment (19.36% and 45.38%). There was no significant difference in bacterial and fungal diversity among the three treatments (Table 3).
Table 3.
Diversity of soil bacteria and fungi under different treatments and incubation stages. CL: not addition, LL: 13C_litter addition, CCL: 13C_CaCO3 addition. All data are means, “±” displayed with the standard deviation, n = 3 independent replicates. The lowercase and uppercase letters denote significant differences in bacterial and fungal diversity in different treatments at different stages of incubation and in different treatments, respectively. Statistical significance was analyzed using an unpaired two-sided t-test.
3.4. Relationship of Soil Microbial Communities with Native C Priming and Soil Mineral Particulate Organic C
The addition of exogenous C sources led to defined correlations between Shannon diversity indexes and the priming effect on native soil C and between those indexes and soil mineral particulate C (<53 μm). The addition of both C sources led to a negative correlation between the bacterial Shannon diversity index and the priming effect, and a positive correlation between the fungal Shannon diversity index and the priming effect (Figure 5). On the contrary, the addition of both C sources resulted in a significant positive correlation between the bacterial Shannon diversity index and the soil mineral particulate C amount, and to a negative correlation between the fungal Shannon diversity index and soil mineral particulate C (Figure 6).
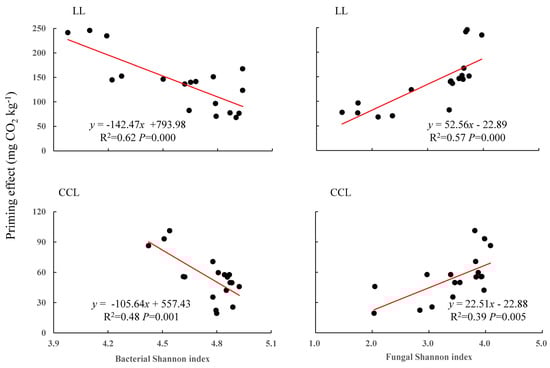
Figure 5.
Correlation of soil microbial diversity with native soil carbon priming effect. LL is 13C_litter addition; CCL is 13C_CaCO3 addition. The two plots on the left show the linear regression models of bacterial diversity and the priming effect. The two plots on the right show the linear regression models of fungal diversity and the priming effect. The regression equations, R2, and differences are provided in the figure.
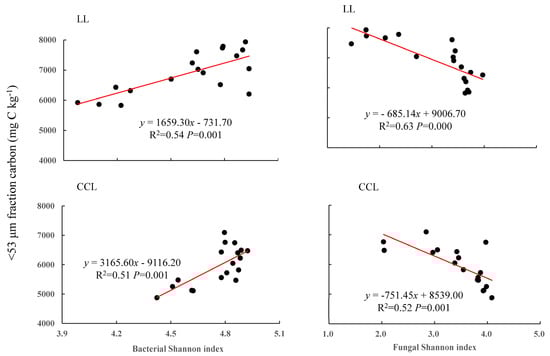
Figure 6.
Correlation of soil microbial diversity with soil mineral particulate C. LL is 13C_litter addition, and CCL is 13C_CaCO3 addition. The two plots on the left show the linear regression models of bacterial diversity and soil mineral particulate C. The two plots on the right show the linear regression models of fungal diversity and soil mineral particulate C. The regression equations, R2, and differences are provided in the figure.
4. Discussion
4.1. Effects of Exogenous C Sources on SOC Mineralization
In this study, SOC mineralization was 15.48% higher in the presence of litter than CaCO3 over 80 days of continuous incubation. Litter constitutes an additional C source in the soil. The organic C in the litter may be consumed by soil microbes, accelerating SOC mineralization [30,41]. Previous studies reported that, comparatively, the mineralization stability of the Ca-bonded organic C in the added CaCO3 was higher than that of total SOC [42]. Ca2+ is expected to bind to SOC and form aggregates, thereby slowing SOC mineralization. In addition, it was informed that Ca2+ combines with the free radicals in the active humified soil OM, covering its surface with a calcium crust, thereby limiting the contact between organic C and microbes and thus reducing the organic C decomposition rate [43,44]. The formation of Ca-bonded organic C after the addition of exogenous CaCO3 led to a high level of SOC stability which, in turn, slowed SOC mineralization. A net increase or decrease in the cumulative SOC mineralization rate due to the addition of exogenous C has been referred to as a positive or negative priming effect, respectively [30]. Whether a positive or negative priming effect occurs depends primarily on soil microbial activity. Most soil microbes remain dormant under natural conditions. Adding fresh OM activates dormant soil microbes, causing changes in the soil microbial community structure and stimulating SOC decomposition [7,45].
In this study, adding either litter or CaCO3 led to a positive priming effect on SOC mineralization, suggesting the following ideas: (1) adding an exogenous OM source stimulated the activity of native soil microbes and provided sufficient nutrients for microbial activity, thereby accelerating the decomposition of native SOC; (2) the exogenous OM source added to the soil contained some microbes, thereby altering the soil microbial community structure and stimulating SOC decomposition; or (3) that the addition of litter or CaCO3 may have promoted the growth of soil fungi but inhibited the growth of soil bacteria. This result is consistent with many previous studies [7,16,46]. However, some authors found that the addition of exogenous C caused a negative priming effect on SOC [34,47,48]. The priming effect occurs in most soils [34,49,50] and is determined by nutrient effectiveness, climate, soil type, vegetation, and microbial properties [51].
In this research, the SOC priming effect was 61.00% greater in the LL treatment than in the CCL treatment. This may be the consequence of higher organic C and cellulose contents in the litter, which could be easily decomposed and utilized when added to the soil, providing soil microbes with essential nutrients and increasing the microbial activity, thereby accelerating SOC mineralization [52,53].
4.2. Fate of Exogenous C
In this study, as the incubation time increased, there was a decrease in the total OC contained in the fraction > 250 μm and 53~250 μm and an increase in that contained in the fraction < 53 μm. Macroaggregates and microaggregates constitute the primary sites of exchange between the soil and its surrounding environment; the compounds contained in these aggregates could have been utilized and decomposed by soil microbes during the incubation process, undergoing mineralization and releasing CO2. Consequently, the SOC in macroaggregates and microaggregates (>250 µm and 53~250 µm) decreased. On the other hand, the mineral particulate organic C tends to interact with clay minerals, forming organic–inorganic complexes. Under the strong physical, chemical, and biochemical protection exerted by clay minerals [54], the mineral particulate organic C was less susceptible to microbial consumption and was stored and sequestered in the soil, forming an SOC pool which is difficult to degrade.
A decrease in SOC after the addition of exogenous C is not a common phenomenon [18,55]; however, some studies have reported similar findings. For example, Luo et al. [56] also found a loss of 3.3% of organic C after 87 days of incubation in soil amended with biochar. In line with our findings, Chen et al. [57] examined the distribution of red soil aggregates using 13C as a marker and discovered a gradual decrease in the SOC in macro- and microaggregates and a gradual increase in mineral particulate organic C (<53 μm) with the incubation time. Due to the short period assessed in the present study, our findings only reflect short-term changes in SOC. Dong [58] found that the organic C in soil that received exogenous C decreased by 20% after three years of continuous incubation, but an upward trend was detected after six years of continuous incubation. Therefore, the short-term decrease in SOC after adding exogenous C may be transient.
We found that the soil C content in the different fractions originated primarily from the C present in the native soil C. The >250 μm fraction had the highest C content, derived from native and exogenous C, followed by the 53~250 μm and <53 μm fractions. This suggests that both native and exogenous C preferentially entered the macroaggregates, followed by the microaggregates and, finally, smaller aggregates. This finding is in agreement with previous results [54,59]. During the 80-day incubation period, a decrease in the C content derived from the native C in the >250 μm and 53~250 μm fractions and an increase in the C derived from the exogenous sources could be noticed. This result suggests that as the incubation time increased, the origin of C in the >250 μm and 53~250 μm fractions tended to shift to exogenous C, whereas the native soil C tended to undergo mineralization and decomposition and, thus, decreased. Comparatively, an increase in the C content derived from both native and exogenous C was found in the <53 μm fraction, a mineral particulate fraction where C was reported to be stable and less subject to decomposition and consumption by microbes, constituting the functional SOC fraction [23]. In addition, the exogenous C entering this fraction could have been sequestered, resulting in an increased stable SOC fraction. This phenomenon was particularly pronounced in the LL treatment, which is in line with previous findings [60].
4.3. Effects of Microbes on Soil C Priming and Sequestration after Exogenous C Addition
In this study, soil bacteria diversity was higher than fungi diversity, both expressed through the Shannon index. Besides, as the incubation time progressed, the Shannon index of soil bacteria exhibited an upward trend, whereas the Shannon index of soil fungi showed a downward trend. Extensive research has found that adding exogenous C can increase soil bacterial diversity [61,62] but has no significant impact on soil fungal diversity [10,63], a finding that has been mainly linked to the rise in easily soluble organic C at the early stages of incubation after exogenous C addition. A large amount of available C and nitrogen stimulates soil microbes, which rapidly decompose these compounds, resulting in larger numbers and, usually, increased diversity [30,41]. As the incubation time advances, the proportion of soil OM readily available to be degraded decreases, whereas the proportion of more resistant materials (e.g., lignin) increases, resulting in insufficient available nutrients for soil microbes. However, at the initial stages of substrates’ utilization, fungi are the first to play a dominant role. Some fungi can decompose the substrates available in the soil matrix efficiently and grow actively. The fast-growing mycelia can pass through plant cell walls and break down substances less prone to being decomposed, providing energy for bacterial growth and reproduction at later stages of incubation [30,64,65]. These concepts explain why bacterial diversity is maintained or increases during incubation, whereas fungi of different functional groups die successively when they have fulfilled their respective roles and their preferent substrates become exhausted [29,66], resulting in decreasing fungal diversity with incubation time.
Of note is that the SOC priming effect of both treatments was significantly negatively correlated with soil bacterial diversity but significantly positively correlated with soil fungal diversity. In contrast, the mineral particulate C fraction was significantly positively correlated with the Shannon diversity index of soil bacteria and significantly negatively correlated with the Shannon diversity index of soil fungi. As a whole, these findings suggest that soil fungi increased SOC mineralization and decomposition and accelerated the SOC priming effect, whereas soil bacteria increased SOC stability and mineral particulate C, which tends to constitute the functional fraction of SOC, as described before [23,67,68].
The effects of soil fungi on SOC priming significantly exceeded the effects of bacteria on SOC sequestration (R = 0.40 vs. 0.27, p = 0.003 vs. 0.02), leading to an increase in SOC mineralization and decomposition after the addition of exogenous C. This phenomenon was more pronounced in the LL treatment than CCL treatment. Sheng and Zhu [69] found that adding biochar to soil increased the diversity of soil bacterial communities, reduced CO2 emissions, and increased soil C sequestration. Gai et al. [70] found a decreasing trend in fungal diversity and an increased risk of soil C loss in a subtropical Lei bamboo (Phyllostachys praecox) forest after adding OM to the soil. Similarly, by examining red soil added with 13C_labeled CaCO3 and rice straw, Xiao et al. [30] found that fungal diversity was a crucial factor for SOC mineralization and that soil C sequestration was significantly and directly affected by bacterial diversity. The results of this study are in line with that finding (Figure 7).
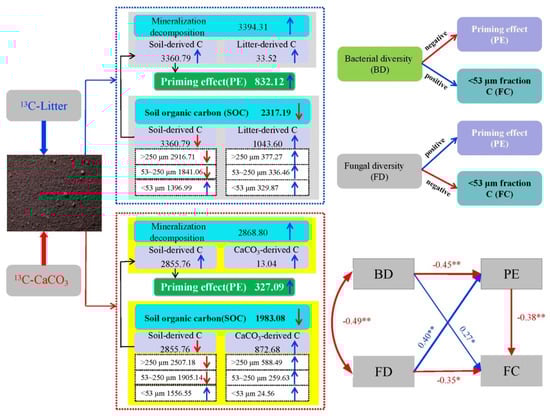
Figure 7.
Main effects of 13C_litter and 13C_CaCO3 addition on organic carbon decomposition and stabilization in lime soil. BD: bacterial diversity, FD: fungal diversity, PE: priming effect, FC: C in <53 μm fraction. Short vertical blue and red arrows represent increases and decreases in soil C processes in response to 13C_litter and 13C_CaCO3 additions. Oblique blue and red arrows indicate positive and negative correlations, respectively. Numerical values correspond to results at day 80 of incubation. A path analysis of the direct and indirect effects of bacterial diversity and fungal diversity on the priming effect and C in the <53 μm fraction is presented. The width of the arrows indicates the strength of the standardized path coefficient. The blue lines indicate positive path coefficients, and the red lines indicate negative path coefficients. Asterisks represent significant differences between the average values (** 0.001 ≤ p < 0.01, * 0.01 ≤ p < 0.05). Statistical significance was analyzed using an unpaired two-sided t-test.
5. Conclusions
In this study, we performed an 80-day continuous 13C-isotope-labeled mineralization incubation experiment and found that adding litter had a considerably greater impact on SOC mineralization compared to adding CaCO3, but both additions resulted in a positive SOC priming effect. Adding litter or CaCO3 reduced the total organic C content in the soil and the C fraction associated with macroaggregates but increased that associated with the mineral particulate fraction (<53 μm), suggesting that mineral particulate C was the functional fraction of SOC. As the incubation time increased, a significantly positive correlation became apparent between SOC priming and fungal diversity, as well as between the mineral particulate C fraction and soil bacterial diversity. This finding suggests that SOC priming was mainly dependent on fungal diversity, whereas SOC sequestration was mainly dependent on bacterial diversity, and that the effects of soil fungi on SOC priming significantly exceeded the effects of bacteria on SOC sequestration, resulting in a decrease in total SOC.
Author Contributions
Conceptualization, L.Z. and L.Y.; methodology, L.Z. and L.Y.; software, L.Z. and J.C.; validation, Y.W. and C.Z.; formal analysis, L.Z.; investigation, L.Z., Y.W., C.Z. and Y.C.; resources, L.Y.; data curation, L.Y.; writing—original draft preparation, L.Z.; writing—review and editing, L.Z., Y.W. and J.C.; visualization, L.Z.; supervision, G.C.; project administration, L.Y.; funding acquisition, L.Y. All authors have read and agreed to the published version of the manuscript.
Funding
This research was funded by the National Natural Science Foundation of China under Grant No. 42161052, the National Key Research and Development Program of China under Grant No. 2016YFC0502604, the Science and Technology Support Program of Guizhou Province under Grant No. Guizhou Scientific Cooperation Support [2022] General 200, the Special Fund for Provincial Scientific Research of the Guizhou Academy of Sciences under Grant No. Guizhou Academy of Sciences Special Scientific Cooperation [2023] 03, and the Postgraduate Education Innovation Program in Guizhou Province under Grant No. YJSKYJJ[2021]079.
Data Availability Statement
Not applicable.
Conflicts of Interest
The authors declare no conflict of interest.
References
- Yu, G.R.; Zhang, L.; He, H.L.; Yang, M. A process-based model and simulation system of dynamic change and spatial variation in large-scale terrestrial ecosystems. Chin. J. Appl. Ecol. 2021, 32, 2653–2665. (In Chinese) [Google Scholar]
- Pan, Y.; Richard, A.B.; Fang, J.Y.; Richard, H.; Pekka, E.K.; Werner, A.K.; Oliver, L.P.; Anatoly, S.; Simon, L.L.; Josep, G.C.; et al. A large and persistent carbon sink in the world’s forests. Science 2011, 333, 988–993. [Google Scholar] [CrossRef]
- Zhu, J.X.; Hu, H.F.; Tao, S.L.; Chi, X.L.; Li, P.; Jiang, L.; Ji, C.J.; Zhu, J.L.; Tang, Z.Y.; Pan, Y.D.; et al. Carbon stocks and changes of dead organic matter in China’s forests. Nature 2017, 8, 151. [Google Scholar] [CrossRef] [PubMed]
- Chow, A.T.; Tanji, K.K.; Gao, S.; Dahlgren, R.A. Temperature, water content and wet-dry cycle effects on DOC production and carbon mineralization in agricultural peat soils. Soil Biol. Biochem. 2006, 38, 477–488. [Google Scholar] [CrossRef]
- Lal, R. Soil carbon sequestration impacts on global climate change and food security. Science 2004, 304, 1623–1627. [Google Scholar] [CrossRef]
- Hamer, U.; Marschner, B. Priming effects in different soil types induced by fructose, alanine, oxalic acid and catechol additions. Soil Biol. Biochem. 2005, 37, 445–454. [Google Scholar] [CrossRef]
- Liu, A.X.J.; Finley, B.K.; Mau, R.L.; Schwartz, E.; Dijkstra, P.; Bowker, M.A.; Hungate, B.A. The soil priming effect: Consistent across ecosystems, elusive mechanisms. Soil Biol. Biochem. 2020, 140, 107617. [Google Scholar] [CrossRef]
- Kuzyakov, Y.; Friedel, J.K.; Stahr, K. Review of mechanisms and quantification of priming effects. Soil Biol. Biochem. 2000, 32, 1485–1498. [Google Scholar] [CrossRef]
- Liu, L.; Gundersen, P.; Zhang, T.; Mo, J. Effects of phosphorus addition on soil microbial biomass and community composition in three forest types in tropical China. Soil Biol. Biochem. 2012, 44, 31–38. [Google Scholar] [CrossRef]
- Klink, S.; Keller, A.B.; Wild, A.J.; Baumert, V.L.; Gube, M.; Lehndorff, E.; Meyer, N.; Mueller, C.W.; Phillips, R.P.; Pausch, J. Stable isotopes reveal that fungal residues contribute more to mineral-associated organic matter pools than plant residues. Soil Biol. Biochem. 2022, 168, 108634. [Google Scholar] [CrossRef]
- Li, Y.; Moinet, G.Y.K.; Clough, T.J.; Whitehead, D. Organic matter contributions to nitrous oxide emissions following nitrate addition are not proportional to substrate-induced soil carbon priming. Sci. Total Environ. 2022, 851, 158274. [Google Scholar] [CrossRef] [PubMed]
- Sulman, B.N.; Phillips, R.P.; Oishi, A.C.; Shevliakova, E.; Pacala, S.W. Microbe-driven turnover offsets mineral-mediated storage of soil carbon under elevated CO2. Nat. Clim. Change 2014, 4, 1099–1102. [Google Scholar] [CrossRef]
- Guenet, B.; Marta, C.S.; Philippe, C.; Marwa, T.; Fabienne, M.; Soong, J.L.; Janssens, I.A. Impact of priming on global soil carbon stocks. Glob. Change Biol. 2018, 5, 1873–1883. [Google Scholar] [CrossRef] [PubMed]
- Guenet, B.; Neill, C.; Bardoux, G.; Abbadie, L. Is there a linear relationship between priming effect intensity and the amount of organic matter input. Appl. Soil Ecol. 2010, 3, 436–442. [Google Scholar] [CrossRef]
- Li, J.H.; Hou, Y.L.; Zhang, S.X.; Li, W.J.; Xu, D.H.; Knops, J.M.H.; Shi, X.M. Fertilization with nitrogen and/or phosphorus lowers soil organic carbon sequestration in alpine meadows. Land Degrad. Dev. 2018, 29, 1634–1641. [Google Scholar] [CrossRef]
- Huo, C.F.; Liang, J.Y.; Zhang, W.D.; Wang, P.; Cheng, W.X. Priming effect and its regulating factors for fast and slow soil organic carbon pools: A meta-analysis. Pedosphere 2022, 32, 140–148. [Google Scholar] [CrossRef]
- Ye, C.; Chen, D.; Hall, S.J.; Pan, S.; Yan, X.; Bai, T.; Guo, H.; Zhang, Y.; Bai, Y.; Hu, S. Reconciling multiple impacts of nitrogen enrichment on soil carbon: Plant, microbial and geochemical controls. Ecol. Lett. 2018, 21, 1162–1173. [Google Scholar] [CrossRef]
- Luo, R.Y.; Kuzyakov, Y.; Liu, D.Y.; Fan, J.L.; Luo, J.F.; Lindsey, S.; He, J.S.; Ding, W.X. Nutrient addition reduces carbon sequestration in a Tibetan grassland soil: Disentangling microbial and physical controls. Soil Biol. Biochem. 2020, 144, 107764. [Google Scholar] [CrossRef]
- Zheng, T.T.; Xie, H.T.; Grant, L.T.; Bao, X.L.; Deng, F.B.; Yan, E.R.; Zhou, X.H.; Liang, C. Shifts in microbial metabolic pathway for soil carbon accumulation along subtropical forest succession. Soil Biol. Biochem. 2021, 160, 108335. [Google Scholar] [CrossRef]
- Liang, J.; Zhou, Z.; Huo, C.; Shi, Z.; Cole, J.R.; Huang, L.; Konstantinidis, K.T.; Li, X.; Liu, B.; Luo, Z.; et al. More replenishment than priming loss of soil organic carbon with additional carbon input. Nat. Commun. 2018, 9, 3175. [Google Scholar] [CrossRef]
- Zhang, H.; Ding, W.; Yu, H.; He, X. Carbon uptake by a microbial community during 30-day treatment with 13C-glucose of a sandy loam soil fertilized for 20 years with NPK or compost as determined by a GS-S-IRMS analysis of phospholipid fatty acids. Soil Biol. Biochem. 2013, 57, 228–236. [Google Scholar] [CrossRef]
- Zhang, Q.F.; Feng, J.G.; Li, J.; Huang, C.Y.; Shen, Y.W.; Cheng, W.X.; Zhu, B. A distinct sensitivity to the priming effect between labile and stable soil organic carbon. New Phytol. 2022, 4, 18458. [Google Scholar] [CrossRef] [PubMed]
- Witzgall, K.; Vidal, A.; Schubert, D.I.; Höschen, C.; Schweizer, S.A.; Buegger, F.; Pouteau, V.; Chenu, C.; Mueller, C.W. Particulate organic matter as a functional soil component for persistent soil organic carbon. Nat. Commun. 2021, 12, 4115. [Google Scholar] [CrossRef]
- Du, H.; Zeng, F.P.; Song, T.Q.; Wen, Y.G.; Li, C.G.; Peng, W.X.; Zhang, H.; Zeng, Z.X. Spatial pattern of soil organic carbon of the main forest soils and its influencing factors in Guangxi, China. Chin. J. Plant Ecol. 2016, 40, 282–291. (In Chinese) [Google Scholar]
- Wang, K.L.; Yue, Y.M.; Chen, H.S.; Wu, X.B.; Xiao, J.; Qi, X.K.; Zhang, W.; Du, H. The comprehensive treatment of karst rocky desertification and its regional restoration effects. Acta Ecol. Sin. 2019, 39, 7432–7440. [Google Scholar]
- Chen, S.; Zhong, J.; Li, S.L.; Ran, L.S.; Wang, W.F.; Xu, S.; Yan, Z.L.; Xu, S. Multiple controls on carbon dynamics in mixed karst and non-karst mountainous rivers, Southwest China, revealed by carbon isotopes (δ13C and δ14C). Sci. Total Environ. 2021, 791, 47–60. [Google Scholar] [CrossRef] [PubMed]
- Wang, Y.W.; Luo, W.J.; Zeng, G.N.; Yang, H.L.; Wang, M.F.; Liu, Y.N.; Cheng, A.Y.; Zhang, L.; Cai, X.L.; Chen, J.; et al. CO2 flux of soil respiration in natural recovering karst abandoned farmland in Southwest China. Acta Geochim 2020, 4, 527–538. [Google Scholar] [CrossRef]
- Zhang, L.M.; Wang, Y.; Chen, J.; Li, F.B.; Feng, L.; Yu, L.F. Characteristics and drivers of soil organic carbon saturation deficit in karst forests of China. Diversity 2022, 14, 62. [Google Scholar] [CrossRef]
- Feng, S.Z.; Huang, Y.; Ge, Y.H.; Su, Y.R.; Xu, X.W.; Wang, Y.D.; He, X.Y. Variations in the patterns of soil organic carbon mineralization and microbial communities in response to exogenous application of rice straw and calcium carbonate. Sci. Total Environ. 2016, 571, 615–623. [Google Scholar] [CrossRef]
- Xiao, D.; Huang, Y.; Feng, S.Z.; Ge, Y.H.; Zhang, W.; He, X.Y.; Wang, K.L. Soil organic carbon mineralization with fresh organic substrate and inorganic carbon additions in a red soil is controlled by fungal diversity along a pH gradient. Geoderma 2018, 321, 79–89. [Google Scholar] [CrossRef]
- Fornara, D.A.; Steinbeiss, S.; Mcnamara, N.P.; Gleixner, G.; Oakley, S.; Poulton, P.R.; Macdonald, A.J.; Bardgett, R.D. Increases in soil organic carbon sequestration can reduce the global warming potential of long-term liming to permanent grassland. Glob. Change Biol. 2011, 17, 1925–1934. [Google Scholar] [CrossRef]
- Phillips, R.L.; Zak, D.R.; Holmes, W.E.; White, D.C. Microbial community composition and function beneath temperate trees exposed to elevated atmospheric carbon dioxide and ozone. Oecologia 2002, 131, 236–244. [Google Scholar] [CrossRef] [PubMed]
- Wang, Q.; Wang, Y.; Wang, S.; He, T.; Liu, L. Fresh carbon and nitrogen inputs alter organic carbon mineralization and microbial community in forest deep soil layers. Soil Biol. Biochem. 2014, 72, 145–151. [Google Scholar] [CrossRef]
- Xie, N.H.; An, T.T.; Zhuang, J.; Mark, R.; Sean, S.; Li, S.Y.; Wang, J.K. High initial soil organic matter level combined with aboveground plant residues increased microbial carbon use efficiency but accelerated soil priming effect. Biogeochemistry 2022, 160, 1–15. [Google Scholar] [CrossRef]
- Six, J.; Conant, R.T.; Paul, E.A.; Paustian, K. Stabilization mechanisms of soil organic matter: Implications for C-saturation of soils. Plant Soil 2002, 241, 155–176. [Google Scholar] [CrossRef]
- Bao, S.D. Soil Agrochemical Analysis, 3rd ed.; China Agriculture Press: Beijing, China, 2001; pp. 3–109. [Google Scholar]
- Guan, S.Y. Soil Enzymes and Research Methods; China Agriculture Science Press: Beijing, China, 1986. (In Chinese) [Google Scholar]
- Xu, N.; Tan, G.; Wang, H.; Gai, X. Effect of biochar additions to soil on nitrogen leaching, microbial biomass and bacterial community structure. Eur. J. Soil Biol. 2016, 74, 1–8. [Google Scholar] [CrossRef]
- Adams, R.I.; Miletto, M.; Taylor, J.W.; Bruns, T.D. Dispersal in microbes: Fungi in indoor air are dominated by outdoor air and show dispersal limitation at short distances. ISME J. 2013, 7, 1262–1273. [Google Scholar] [CrossRef]
- Edgar, R.C. UPARSE: Highly accurate OTU sequences from microbial amplicon reads. Nat. Methods 2013, 10, 996–998. [Google Scholar] [CrossRef]
- Song, X.J.; Liu, X.T.; Liang, G.P.; Li, S.P.; Li, J.Y.; Zhang, M.N.; Zheng, F.J.; Ding, W.T.; Wu, X.P.; Wu, H.J. Positive priming effect explained by microbial nitrogen mining and stoichiometric decomposition at different stages. Soil Biol. Biochem. 2022, 175, 108852. [Google Scholar] [CrossRef]
- Huang, Y.; Su, Y.R.; Liang, S.C.; Chen, X.B.; He, X.Y. Responses of organic carbon mineralization in typical soils in northwest Guangxi of China to calcium carbonate and soil moisture. Chin. J. Ecol. 2013, 32, 2695–2702. (In Chinese) [Google Scholar]
- Hu, L.N.; Su, Y.R.; He, X.Y.; Li, Y.; Li, L.; Wang, A.H.; Wu, J.S. The Speciation and Content of Calcium in Karst Soils, and Its Effects on Soil Organic Carbon in Karst Region of Southwest China. Sci. Agric. Sin. 2012, 45, 1946–1953. (In Chinese) [Google Scholar]
- Zornoza, R.; Acosta, J.A.; Faz, A.; Bååth, E. Microbial growth and community structure in acid mine soils after addition of different amendments for soil reclamation. Geoderma 2016, 272, 64–72. [Google Scholar] [CrossRef]
- Qiao, N.; Schaefer, D.; Blagodatskaya, E. Labile carbon retention compensates for CO2 released by priming in forest soils. Glob. Change Biol. 2014, 20, 1943–1954. [Google Scholar] [CrossRef]
- Liu, B.J.; Xie, Z.B.; Liu, Q.; Wang, X.J.; Lin, Z.B.; Bi, Q.C.; Lian, X.W.; Liu, G.; Zhu, J.G. Correlation between soil carbon excitation induced by biochar and soil physicochemical properties. Soil 2021, 53, 343–353. [Google Scholar]
- Santruckova, H.; Picek, T.; Tykva, R.; Šimek, M.; Bohumil, P. Short-term partitioning of 14C-[U]-glucose in the soil microbial pool under varied aeration status. Biol. Fertil. Soils 2004, 40, 386–392. [Google Scholar] [CrossRef]
- Guenet, B.; Raynaud, X.; Bardoux, G.; Abbadie, L. Negative priming effect on mineralization in a soil free of vegetation for 80 years. Eur. J. Soil Sci. 2010, 61, 384–391. [Google Scholar] [CrossRef]
- Lloyd, D.A.; Ritz, K.; Paterson, E.; Kirk, G.J.D. Effects of soil type and composition of rhizodeposits on rhizosphere priming phenomena. Soil Biol. Biochem. 2016, 103, 512–521. [Google Scholar] [CrossRef]
- Razanamalala, K.; Razafimbelo, T.; Maron, P.A.; Ranjard, L.; Chemidlin, N.; Lelièvre, M.; Dequiedt, S.; Ramaroson, V.H.; Marsden, C.; Becquer, T.; et al. Soil microbial diversity drives the priming effect along climate gradients: A case study in Madagascar. ISME J. 2018, 12, 451–462. [Google Scholar] [CrossRef]
- Kuzyakov, Y. Priming effects: Interactions between living and dead organic matter. Soil Biol. Biochem. 2010, 42, 1363–1371. [Google Scholar] [CrossRef]
- Lou, Y.S.; Ren, L.X.; Li, Z.P.; Zhang, T.L. Effect of rice residues on carbon dioxide and nitrous oxide emissions from a paddy soil of subtropical China. Water Air Soil Pollut. 2007, 178, 157–168. [Google Scholar] [CrossRef]
- Bernard, L.; Isabelle, B.D.; Derrien, D.; Fanin, N.; Fontaine, S.; Guenet, B.; Karimi, B.; Marsden, C.; Maron, P.A. Advancing the mechanistic understanding of the priming effect on soil organic matter mineralisation. Funct. Ecol. 2022, 1, 1332–1337. [Google Scholar] [CrossRef]
- Stegarescu, G.; Jordi, E.G.; Kaido, S.; Karin, K.; Alar, A.; Endla, R. Effect of crop residue decomposition on soil aggregate stability. Agriculture 2020, 10, 527. [Google Scholar] [CrossRef]
- Luo, R.; Fan, J.; Wang, W.; Luo, J.; Kuzyakov, Y.; He, J.S.; Chu, H.; Ding, W. Nitrogen and phosphorus enrichment accelerates soil organic carbon loss in alpine grassland on Qinghai-Tibetan Plateau. Sci. Total Environ. 2019, 650, 303–312. [Google Scholar] [CrossRef]
- Luo, Z.K.; Feng, W.T.; Luo, Y.Q.; Baldock, J.; Wang, E.L. Soil organic carbon dynamics jointly controlled by climate, carbon inputs, soil properties and soil carbon fractions. Glob. Change Biol. 2017, 23, 4430–4439. [Google Scholar] [CrossRef]
- Chen, X.F.; Liu, M.; Jiang, C.Y.; Wu, M.; Li, Z.P. Organic carbon mineralization in aggregate fractions of red paddy soil under different fertilization treatments. Sci. Agric. Sin. 2018, 51, 3325–3334. (In Chinese) [Google Scholar]
- Dong, J.C. Effect of Adding Exogenous Calcium and Organic Materials on the Transformation of Soil Organic Carbon; Shenyang Agricultural University: Liaoning, China, 2019. (In Chinese) [Google Scholar]
- Ge, Y.H.; Su, Y.R.; Zou, D.S.; Hu, L.N.; Feng, S.Z.; Xiao, W.; He, X.Y. Organic carbon mineralization in lime soils in Karst region of Guangxi, South China in response to exogenous organic substrate and calcium carbonate. Chin. J. Ecol. 2012, 31, 2748–2754. (In Chinese) [Google Scholar]
- Xiao, M.L.; Chen, X.B.; Li, Y.; He, X.Y.; Shen, Y.; Su, Y.R. Response of carbon release from brown calcareous soils and red soils to mineral additions (Fe(OH)3 and CaCO3). J. Ecol. 2014, 33, 2936–2942. [Google Scholar]
- Zhu, M.T.; Liu, X.X.; Wang, J.M.; Liu, Z.W.; Zheng, J.F.; Bian, R.J.; Wang, G.M.; Zhang, X.H.; Li, L.Q.; Pan, G.X. Effects of biochar application on soil microbial diversity in soil aggregates from paddy soil. Acta Ecol. Sin. 2020, 40, 1505–1516. [Google Scholar]
- Keyvan, E.S.; Bahram, M.; Ghanbari, M.S.; Gohar, D.; Tohidfar, M.; Eremeev, V.; Talgre, L.; Khaleghdoust, B.; Mirmajlessi, S.M.; Luik, A.; et al. Cropping systems with higher organic carbon promote soil microbial diversity. Agric. Ecosyst. Environ. 2021, 319, 107521. [Google Scholar]
- Wang, C.; Liu, D.W.; Bai, E. Decreasing soil microbial diversity is associated with decreasing microbial biomass under nitrogen addition. Soil Biol. Biochem. 2018, 120, 126–133. [Google Scholar] [CrossRef]
- Silverman, G.L.B.; Lew, R.R. Regulation of the tip-high [Ca2+] gradient in growing hyphae of the fungus Neurosporacrassa. Eur. J. Cell Biol. 2001, 80, 379–390. [Google Scholar] [CrossRef]
- Zhang, W.; Wei, H.L.; Gao, H.W. Soil microbial diversity and its environmental impact factor research progress. Ecology 2005, 24, 48–52. [Google Scholar]
- Han, S.; Manuel, D.B.; Luo, X.S.; Liu, Y.R.; Van, N.D.; Chen, W.L.; Zhou, J.Z.; Huang, Q.Y. Soil aggregate size-dependent relationships between microbial functional diversity and multifunctionality. Soil Biol. Biochem. 2021, 154, 108143. [Google Scholar] [CrossRef]
- Andrew, T.N.; Emanuel, G.; Erland, B.; Patrick, M. Soil carbon and microbes in the warming tropics. Funct. Ecol. 2022, 6, 1338–1354. [Google Scholar]
- Cotrufo, M.F.; Haddix, M.L.; Kroeger, M.E.; Stewart, C.E. The role of plant input physical-chemical properties, and microbial and soil chemical diversity on the formation of particulate and mineral-associated organic matter. Soil Biol. Biochem. 2022, 168, 108648. [Google Scholar] [CrossRef]
- Sheng, Y.Q.; Zhu, L.Z. Biochar alters microbial community and carbon sequestration potential across different soil pH. Sci. Total Environ. 2018, 622, 1391–1399. [Google Scholar] [CrossRef]
- Gai, X.; Zhong, Z.K.; Zhang, X.P.; Bian, F.Y.; Yang, C.B. Effects of chicken farming on soil organic carbon fractions and fungal communities in a Lei bamboo (Phyllostachys praecox) forest in subtropical China. For. Ecol. Manag. 2021, 479, 118603. [Google Scholar] [CrossRef]


Disclaimer/Publisher’s Note: The statements, opinions and data contained in all publications are solely those of the individual author(s) and contributor(s) and not of MDPI and/or the editor(s). MDPI and/or the editor(s) disclaim responsibility for any injury to people or property resulting from any ideas, methods, instructions or products referred to in the content. |
© 2023 by the authors. Licensee MDPI, Basel, Switzerland. This article is an open access article distributed under the terms and conditions of the Creative Commons Attribution (CC BY) license (https://creativecommons.org/licenses/by/4.0/).