Abstract
The lack of desirable oak (Quercus spp.) regeneration on upland sites is a problem in the Central Hardwood Region. While the reintroduction of fire, thinning, and/or harvesting has been proposed as a solution to increase oak regeneration, these treatments may have limited impact on productive sites, and the effects on the growth of residual midstory oak stems is not clear. This study examined the regeneration response and growth of residual midstory white oak (Quercus alba) stems in a mature, oak-dominated, upland forest following four treatments: (1) burn, (2) thin and burn, (3) harvest and thin and burn, and (4) no treatment (control) at Trail of Tears State Forest located in southern Illinois. Results indicated there was no significant difference in oak density among treatments for any regeneration size class. In addition, none of the treatments resulted in a radial growth release in residual midstory white oak stems. These results suggested these treatments may need to be modified to increase oak regeneration on productive sites and indicated that there may not have been enough time since treatment application, or treatments may not have been intense enough, to release midstory residual stems.
1. Introduction
The Central Hardwood Region (CHR) is a continuous forest region that spans much of central and eastern United States. It is known for its oak (Quercus spp.) -dominated forests, which cover 40% of the forest area [1,2,3]. Nowhere else in North America does such a high concentration of high-quality oak-dominated stands exist [1]. During the 1600–1800s, oaks were continuously recruited into the canopy, but that successional relationship shifted after periodic anthropogenic disturbances abruptly stopped around the 1930s [4,5]. Currently, while many CHR forests still have high levels of stocking of mature oak species and successful small oak regeneration, there is a bottleneck when it comes to advancing small regeneration into the overstory, which is attributed to this decreased disturbance [6].
Disturbance is fundamental to the formation of temperate forest ecosystems in this region and the use of periodic fire has been hypothesized in the literature to facilitate the regeneration of oak species [7,8,9]. However, a growing body of research suggests that fire alone is largely ineffective in regenerating oak [9,10] and may even increase competition from other species such as red maple (Acer rubrum L.) [11,12,13,14,15]. In the absence of successful regeneration with fire alone, additional treatments have been implemented, e.g., harvesting, thinning, oftentimes in combination with fire, to stimulate oak regeneration. In some instances, this has proven to be a successful strategy although evidence suggests that oak regeneration may still be below desirable levels following treatment, particularly on productive sites [12,15,16,17,18]. Furthermore, the impact of these treatments on residual oak midstory stems, trees that are too small to harvest and retain in thinning but may be damaged by fire, is unclear. The objective of this paper was to compare regeneration of hardwood species in response to burning, thinning, and harvesting, and a combination of these treatments, compared to an untreated control. In addition, this paper addresses how these treatments influence radial growth in residual midstory white oak stems, which is contestably one of the most economically important species throughout the CHR [19].
2. Materials and Methods
2.1. Research Area
This project was conducted at Trail of Tears State Forest (TTSF) in southern Illinois in Union County (Figure 1). Mean annual temperature is 13 °C, and mean annual precipitation is 117 cm. The topography of TTSF consists of narrow ridgetops with moderate to steep side slopes (15%–44%) [20]. A 262 ha study area within TTSF was established in 2014 as a place for the Illinois Department of Natural Resources to develop silvicultural guidelines for oak regeneration (Figure 1). Elevation within the study area ranged from 145 to 200 m and soils were predominantly well drained, loess-derived, productive (white oak site index 20 m, base age 50) silt loams [21]. Prior to treatment beginning in 2014, fires had been suppressed within TTSF since the 1930s [5]. Some areas were lightly harvested until 1989 (removal of mature stems without accompanying midstory control), but these areas were similar in forested composition to unharvested areas 20 to 30 years after the last harvest [22]. As a result of past management activities, species composition within the study area was uniform prior to treatment, with upper slopes dominated by oak (predominately white oak) and hickory species (Carya spp.) in the overstory with sugar maple (A. saccharum) and American beech (Fagus grandifolia Ehrh.) in the under-to-midstory. The lower slopes were dominated by American beech, sugar maple, sweet gum (Liquidambar styraciflua L.), and tulip poplar (Liriodendron tulipifera L.) in the overstory, with only a minor component of oak and hickory species [23].
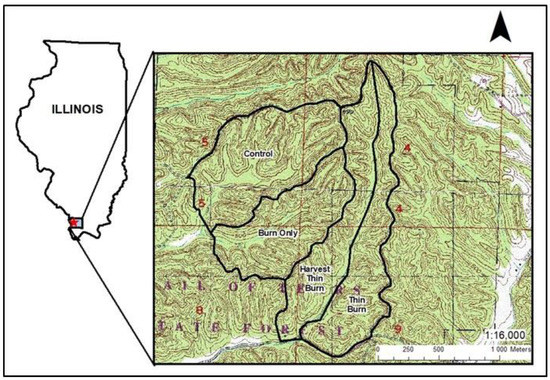
Figure 1.
Trail of Tears State Forest study location within Union County in southern Illinois with treatment units: control (C), burn only (B), harvest and thin and burn (HTB), and thin and burn (TB).
The study area was divided into four treatment areas: (1) burn only (B), (2) thin and burn (TB), (3) harvest and thin and burn (HTB), and (4) control (C) (Figure 1). The B treatment (62 ha) was burned in fall 2014, spring 2017, and spring 2018. Prior to these burns, fire lines were established using rakes and backpack blowers. Backing fires were used to strengthen the fire lines before ignition with ring head fires and interior ignition strips. The TB treatment (61 ha) underwent a mid-canopy control forest stand improvement (FSI) treatment that targeted undesirable shade-tolerant species in February 2015, which removed about 20% of the basal area and was burned in spring 2017, spring 2018, and fall 2020. The HTB treatment (57 ha) had a variable retention harvest in 2016/2017, followed by FSI in October 2017, and prescribed burns in spring 2017, spring 2018, and fall 2020. The combined cutting treatments reduced the total basal area by 40%. The control treatment (82 ha) had no management. Because of the way the demonstration area was laid out in TTSF, the results of this study are limited owing to pseudoreplication.
2.2. Data Collection and Analysis
Eighty randomly selected variable radius plots (10 basal area factor (BAF)), 20 plots per treatment, were sampled in summer 2021. Data collection included overstory sampling, regeneration density, and canopy openness [23]. Overstory trees, all woody stems > 7.6 cm diameter at breast height (1.37 m, DBH), were identified and DBH was measured. These data were used to calculate density (trees/ha) and basal area (m2/ha) for each species in each treatment. Regeneration data for all woody species were collected in fixed radius plots (1.71 m radius) at each cardinal direction, 7.9 m from plot center. Regeneration was classified as either a large sapling (>1 m in height and >2.5 cm to 7.6 cm DBH), small sapling (>1 m in height and up to 2.5 cm DBH), or seedling (≥2.5 cm to 1 m in height). Coverage of woody vines was estimated as a percentage of ground cover. A spherical convex densiometer was used to quantify canopy openness (%) for each plot. Four densiometer readings, one facing each cardinal direction, were averaged to obtain mean canopy openness per overstory plot.
All data were analyzed using RStudio version 2022.02.2 [24] using the multcomp package to test for multiple comparisons for generalized linear mixed models [25]. Data from 2021 were examined using one-way analysis of variance (ANOVA) followed with Tukey’s HSD post hoc comparisons between treatments if the ANOVA reported statistical significance (p < 0.05). Residuals from all response variables were tested to ensure normality and homogeneity of variances. This analysis elucidated statistical differences of canopy openness, basal area, and density of overstory and regeneration size classes between treatments, as well as between species.
2.3. Radial Growth Analysis
Radial growth release was measured across all treatments by analyzing ring width growth from the past seven years of midstory white oak trees. Selected trees ranged from 18.5 to 38.9 cm DBH, had a dominant, non-forked leader and overall healthy vigor. For each tree, two increment cores were extracted 180° apart at DBH using an increment borer, perpendicular to the slope of the ground in the summer of 2021 [26]. If there were not any trees within the variable radius plot that met the stated criteria, then the closest tree to plot center that did meet the criteria was sampled. The collected tree cores (n = 126) were air-dried, mounted, and sanded with progressively finer sandpaper to reveal the cellular structure [27]. All samples were first skeleton-plotted to begin parsing out signature years, and then they were scanned into WinDENDRO to measure ring widths [28]. Afterwards, samples were cross-dated into a master chronology for each treatment. The tree ring width measurements were cross-dated with the help of the xDateR Shiny application [29,30]. Out of thirty-one cores collected from the burn treatment, two were excluded because of cross-dating errors. No other samples were dropped from analysis in any other treatments.
To elucidate the influence of mean temperature (°C), precipitation (mm), or Palmer drought severity index (PDSI) on radial growth, a Pearson’s correlation coefficient was calculated between the control treatment’s standardized ring width chronology and monthly regional climate averages using the treeclim package in R [31]. Climate correlation analysis was calculated with a 100-year static window over a 36-month period (two previous years plus the target year) with the control treatment to remove any influence of silvicultural activity from the recently applied treatments [32].
The Dendrochronology Program Library in R (dplR) [30] and Tree Ring Analysis of Disturbance Events in R (TRADER) packages were used to detrend RWL files and reconstruct disturbances [33]. The radial growth averaging (RGA) criteria, developed by Lorimer and Frelich and modified by Nowacki and Abrams, were used to calculate percent growth change since they were originally developed using oak data for use in mature closed-canopy oak/hickory forests of the eastern U.S. [34,35] and because running mean methods are the most robust for detrending disturbance events [36]. Newer studies suggest that the RGA method may present more temporal accuracy, fewer false positives, and greater sensitivity than boundary-line, absolute increase, or other methods for detrending [37]. Lorimer and Frelich’s original quantitative criteria for defining release used the change in growth (%GC) before and after an event [34]. They defined moderate (50%–99% GC) and major (>100% GC) release events with a growth duration that can either be temporary (10–15 years) or prolonged (>15 years) [34]. Nowacki and Abrams’s RGA approach modified the previous criteria from Lorimer and Frelich to identify release events as a 25% increase threshold using 10-year running mean growth rates [35]. This lower threshold allows for better detection of moderate releases in the midstory white oak individuals. This study used an asymmetrical window of ten years before and seven years after the target year of 2014 to account for time since initial treatment application to sampling with a ten-year buffer to decrease chances of multiple consecutive release detections. Moderate (>25% GC) and major release (>50% GC) threshold parameters were maintained from Nowacki and Abrams [35].
3. Results
3.1. Overstory
Across all treatments in the study area, mean overstory basal area was significantly different between treatments, ranging from 16.5 m2/ha in the HTB to 23.2 m2/ha in the control unit (Table 1; F 3,76 = 3.992, p = 0.01), and post hoc comparisons revealed a statistically significant difference between the total basal area in the HTB and control units (p = 0.006). White oak had the highest average basal area of any species in all treatments, ranging from 31% basal area in the control to 46% in the B unit; however, there was no statistical difference found among treatments (F 3,76 = 0.921, p = 0.435). Overstory mean density was lowest in the TB unit (185 trees/ha) and highest in the control (316 trees/ha) and was significantly different among the treatments (Table 2; F 3,76 = 3.682, p = 0.016).

Table 1.
Overstory mean basal area (m2/ha) and standard error (S.E.) by species and across treatments: control (C), burn only (B), thin and burn (TB), and harvest and thin and burn (HTB). Different letters following standard errors indicate a significant difference among the treatments (p < 0.05).
Table 2.
Overstory mean density (trees/ha) and standard error (S.E.) by species and across treatments: control (C), burn only (B), thin and burn (TB), and harvest and thin and burn (HTB). Different letters following standard errors indicate a significant difference among the treatments (p < 0.05).
3.2. Understory Regeneration
Large saplings (>1 m in height and >2.5 to 7.6 cm DBH) had the highest overall average density in the control (736 stems/ha), followed by TB (467 stems/ha), B (395 stems/ha), and HTB (213 stems/ha) including all species (Table 3). There was a statistically significant difference in large sapling density between treatments (F 3,76 = 3.265, p = 0.026), with a significant difference between the control and HTB treatments specifically (p = 0.015). American beech had the highest density of any species of large saplings in every treatment, with the largest proportion in B (64%), followed by control (58%), HTB (40%), and TB (36%) (Table 3). The only unit to have large sapling oak species was the TB unit, making up 3% of all large saplings, but there was no statistical difference in oaks among treatments (Table 3; F 3,76 = 1.00, p = 0.398). There were no white oak large saplings found in any treatment.
Table 3.
Large saplings (>1 m in height and >2.5 to 7.6 cm DBH) mean density (stems/ha) and standard error (S.E.) by species and across treatments: control (C), burn only (B), thin and burn (TB), and harvest and thin and burn (HTB). Different letters following standard errors indicate a significant difference among the treatments (p < 0.05).
Small saplings (>1 m in height and up to 2.5 cm DBH) had the highest overall density in the HTB treatment (3541 stems/ha), followed by the control (1727 stems/ha), TB (1685 stems/ha), and B (198 stems/ha) (Table 4). Small sapling density among treatments was highly significant (F 3,76 = 7.061, p < 0.0003), with Tukey’s HSD test finding a statistical significance between HTB and B treatments (p < 0.001). Sassafras (Sassafras albidum N.) had the highest density in HTB, TB, and the B units, making up 46%, 38%, and 65% of all small saplings, respectively, but only 3% of small saplings in the control unit (Table 4). Pawpaw (Asimina triloba L.) small saplings were abundant across all treatments as well, making up 43% of the control, 8% of B, 19% of HTB, and 17% of TB. Tulip poplar comprised 23% of the TB and 8% of HTB but was absent in the control and B units. No other species made up more than 15% of small sapling density for any of the treatments. Oak species were found in the TB only, accounting for 1% of small sapling density, and there were no white oak small saplings found in any unit.
Table 4.
Small saplings (>1 m in height and up to 2.5 cm DBH) mean density (stems/ha) and standard error (S.E.) by species and across treatments: control (C), burn only (B), thin and burn (TB), and harvest and thin and burn (HTB). Different letters following standard errors indicate a significant difference among the treatments (p < 0.05).
Seedling (≥2.5 cm to 1 m in height) density ranged from 21,706 stems/ha in the TB unit to 17,048 stems/ha in the HTB unit, and there was no significant difference in combined seedling density among treatments (Table 5; F 3,76 = 1.134, p = 0.341). Tulip poplar, the species with the highest density across treatments, made up the highest proportion of seedling species in the TB unit (32%), while pawpaw had the highest proportion in the control (28%). White oak seedling density ranged from 410 stems/ha (2% of total density) in the B unit to 1176 stems/ha (7% of total density) in the HTB unit individually.
Table 5.
Seedling (≥2.5 cm to 1 m in height) mean density (stems/ha) and standard error (S.E.) by species and across treatments: control (C), burn only (B), thin and burn (TB), and harvest and thin and burn (HTB). Different letters following standard errors indicate a significant difference among the treatments (p < 0.05).
3.3. Woody Vines
Woody vines, poison ivy (Toxicodendron radicans L.), Virginia creeper (Parthenocissus quinquefolia L.), and grape (Vitis spp. L.) ground coverage was highest in the HTB treatment (57%), followed by the TB (53%), control (18%), and B (15%) (F 3,76 = 15.553, p < 0.0001), with multiple comparisons identifying a highly significant difference between HTB and control (p < 0.0001), and TB and control (p < 0.001). Poison ivy was found in 99% of plots (F 3,76 = 11.632, p < 0.0001), and there were highly significant differences in ground cover between HTB and control (p = 0.001) and between TB and control (p < 0.001). Virginia creeper was recorded in 91% of plots (F 3,76 = 3.795, p = 0.014), with a difference between the TB and B units only (p = 0.013). Grape was recorded in 71% of plots (F 3,76 = 9.463, p < 0.001), and there was a significant difference in ground coverage between HTB and control (p < 0.001) and TB and control (p = 0.003) treatments.
3.4. Canopy Openness
Average canopy openness ranged from 1% to 11% with high variability within treatments. The control unit averaged 1% canopy openness (0%–3% range), followed by B with 2% (0%–6% range), TB with 6% (1%–20% range), and HTB with 11% (<1%–26% range). A one-way ANOVA revealed that there was a statistically significant difference in canopy openness between treatments (F 3,76 = 27.534, p < 0.0001). Tukey’s HSD test reported a highly significant difference in canopy openness among the HTB and control units (p < 0.001) and the TB and control (p < 0.001). Canopy openness was not significantly different between control and B (p = 0.960).
3.5. Radial Growth Release and Climate Correlations
From the 126 white oak cores analyzed using the RGA method with an asynchronous window, 41 (27%) exhibited at least one release event. Only 10 (6%) cores had multiple release events detected. Since 1861, there have been 154 releases from the 126 samples, including 83 (54%) major (>50% increase in growth sustained for 10 years) and 71 (46%) moderate (>25% increase in growth sustained for 10 years) releases across all units found using the RGA detection method (Figure 2). However, none of these releases were detected since treatment application in 2014 (Figure 2).
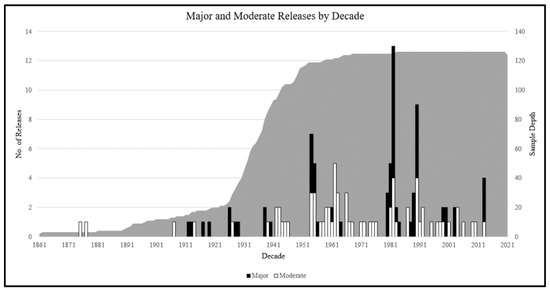
Figure 2.
Major and moderate releases per decade at the Trail of Tears State Forest demonstration area. Major (>50% growth increase lasting 10 years) and moderate (>25% growth increase lasting 10 years) releases in midstory white oak (Quercus alba) individuals were detected using a modified version of the radial growth averaging (RGA) release detection method with an asymmetric detection window of 10 years before and 7 years after the target year of 2014 [35]. Gray portion represents core sample depth (number of trees).
Correlation analysis indicated that climate did have a statistically significant but minor role in influencing radial growth [32]. Monthly mean values of temperature and precipitation showed both positive and negative significant correlations, while the Palmer drought severity index (PDSI) showed significant positive relationships with radial growth.
4. Discussion
This work addresses the continuing question of the effectiveness of silvicultural options to successfully regenerate oak species in the CHR. Despite trying a combination of treatments, oak regeneration did not differ from the control. Oaks only made up 0%–3% of the large saplings, 0%–1% of small saplings, and 6%–14% of the seedling layer size classes in the units with treatments. Our results indicated that there appears to be a bottleneck of oak seedlings maturing into advance regeneration, as has been reported in other studies [6,38,39]. While prescribed burning and harvesting have been hypothesized as part of the solution to oak regeneration, there may be limits to these treatments, including insufficient canopy openness, increased competition from other species, and deer herbivory [13].
4.1. Increasing Light through Canopy Disturbance
Mature closed-canopy forests in the CHR are characterized as having little to no light that reaches the forest floor except for naturally caused canopy gaps. Since anthropogenic disturbances declined in the mid-20th century, overstory tree canopies have filled out, creating a dense, closed-canopy structure with little light reaching the forest floor. In this study, the canopy openness in the control treatment ranged from 0%–3% across all plots, which is insufficient to successfully regenerate oaks. Brose and Rebbeck reported that oak species need at least 15%–40% canopy openness for successful regeneration, while Iverson et al. recommended roughly 6%–18% sunlight penetration to the forest floor to adequately regenerate oak/hickory [40,41]. Burning alone is not likely to produce a significant increase in light reaching the forest floor [8,42,43]. Our data support these studies since there was no significant difference in canopy openness between the B and control treatments after three prescribed fires over a seven-year period. Overstory removal through thinning and/or large-scale harvesting is therefore necessary to provide the required canopy openings; however, these openings may be unevenly distributed across the landscape. Canopy openness within the HTB treatment ranged from <1% to 26% across all plots, indicating some areas within the treatment may not have received sufficient light through canopy removal to successfully regenerate oak.
4.2. Controlling Non-Oak Regeneration
When light levels are sufficient to regenerate oaks, other species often benefit as well, particularly in productive sites. In a study in Indiana, Greenler and Saunders reported that as canopy cover increased around canopy gaps, sassafras and tulip poplar quickly colonized gaps with higher light levels, suppressing competitive oak regeneration on mesic sites [17]. Similar results were found in our study as sassafras was a more abundant species in the HTB and TB treatments compared to the control treatment. Tulip poplar, a rapidly growing pioneer species, also responded well to disturbance in our study and comprised a large proportion across all regeneration size classes, primarily in the TB treatment. Several studies have shown that various disturbance intensities, from clearcutting to a singular shelterwood cut, can lead to tulip poplar dominance, quickly overtopping oak regeneration [44,45,46]. Schweitzer and Dey’s proposed two-phase management could help prevent oak species from being rapidly overtopped by faster growing species [46]. It is also worth noting that there was a high occurrence of woody vine species found throughout all treatment areas, and these species should be considered for future treatment. Increased soil disturbance and light availability resulting from the treatments to these species in the understory could cause them to thrive, possibly outcompeting wanted oak regeneration [47].
4.3. Deer Herbivory
In addition to increased competition from other plant species, browse pressure from white-tailed deer (Odocoileus virginianus Z.) may contribute to oak regeneration failure. While the effects of deer browse were not directly assessed in this study, in a companion study, Leeson et al. reported suppressed oak regeneration after only one year of deer exclosure establishment within TTSF [48]. Numerous studies have reported similar results across the CHR [49,50,51], indicating that changes in density and species composition have been heavily influenced by herbivory pressure, shifting future forest composition [51,52], and reducing tree growth [53,54]. Researchers have proposed that increased deer hunting may alleviate browse pressure on regeneration [52,55], and it is likely that this is the only long-term solution to this problem [16], but this may not be a socially acceptable solution by all stakeholders.
4.4. Silvicultural Release of Midstory Oaks
The 154 releases detected in this study were between the years 1875 and 2013, prior to treatment implementation. These radial growth releases were detected in varied years rather than in a large cohort. The top three years with the highest number of combined releases in descending order were: 1982 (17 releases), 1990 (13 releases), and 1954 (10 releases). This suggests that radial growth was mainly influenced by localized factors, e.g., individual tree death or removal, rather than large-scale disturbance within TTSF.
Since 2014, there have been no releases detected; therefore, the most recent silvicultural treatments did not cause a dramatic increase in growth to trigger release detection using this release detection method at this time. There are several explanations as to why there were no releases detected in any treatment within the past seven years since initiation of treatment application. Despite there being seven growing seasons between the first burn on site and four years since the overstory removal harvest, there may not have been enough time in the calculation window. Having less than the ten-to-fifteen-year symmetric time window commonly used for disturbance detection may have impacted the number of releases detected [35]. Second, radial growth may lag when responding to canopy thinning, taking several growing seasons for a silvicultural release to be detected. Rentch et al. reported a lag time of three years for chestnut oak (Quercus montana W.) [56]. Additionally, a radial growth lag could stem from the highly suppressed nature of the cored white oak trees. Not only could this suppression cause additional lag time between suppressed growth and a release, but it could also mean that a tree cannot show a release because it has been in this state for too long. Crop tree release is typically executed during stem exclusion stage when trees are younger (10–30 years old) and typically are growing rapidly [57]. The cores averaged between 85 and 95 years old, suggesting these individuals may be reaching an age where they can no longer release owing to continuously suppressed growth. Lastly, treatments may not have been intense enough. Miller and Stringer suggested that residual stand density needs to be approximately 60%–70% stocking to have a release [58]. The B treatment did not have any canopy disturbance. Although the TB treatments removed about 20% basal area and the HTB harvest treatment removed about 40% basal area, these reductions may not have been as intense as needed to induce a silvicultural release.
5. Conclusions
The results indicated that the multiple treatments (including burning, thinning, and harvesting) did not successfully regenerate oaks at this time. Challenges include insufficient light, competition from other species, deer herbivory, and insufficient time since treatment application for results. Future research should continue to address the ongoing regeneration failure of oaks throughout the CHR before the shorter-lived oak species become extirpated by attaining their maximum age without successfully reproducing. Additionally, land managers may consider best management practices for future forests that are not dominated by oak species. The radial growth averaging method of detecting disturbances and silvicultural release used in this paper detected past disturbances in this oak/hickory-dominated forest in the CHR. However, care should be taken when applying this method in time periods shorter than ten years after disturbance.
Author Contributions
E.N.I., E.J.H., J.W.G. and C.M.R. conceived the project and designed the methodology; E.N.I. collected the data; E.N.I., E.J.H. and C.M.R. analyzed the data; E.N.I. led the writing of the manuscript while E.J.H., J.W.G. and C.M.R. contributed to the revisions of this manuscript. All authors have read and agreed to the published version of the manuscript.
Funding
This research was funded by the USDA Forest Service McIntire Stennis Program and Southern Illinois University School of Forestry and Horticulture.
Data Availability Statement
The datasets generated and/or analyzed during the current study are available from the first and corresponding authors upon reasonable request.
Acknowledgments
The authors would like to thank the Illinois Department of National Resources for their collaboration throughout the project.
Conflicts of Interest
The authors declare no conflict of interest.
References
- Fralish, J.S. The central hardwood forest: Its boundaries and physiographic provinces. In Proceedings of the 13th Central Hardwood Forest Conference, Urbana, IL, USA, 1–3 April 2002; Van Sambeek, J.W., Dawson, J.O., Ponder, F., Jr., Loewenstein, E.F., Fralish, S., Eds.; General Technical Report NC-234. US Department of Agriculture, Forest Service, North Central Research Station: St. Paul, MN, USA, 2003; Volume 234, pp. 1–20. [Google Scholar]
- Hicks, R.R., Jr. A resource at the crossroads: A history of the central hardwoods. In Proceedings of the 11th Central Hardwood Forest Conference, Columbia, MO, USA, 23–26 March 1997; Pallardy, S.G., Cecich, R.A., Garrett, H.G., Johnson, P.S., Eds.; Gen. Tech. Rep. NC-188. U.S. Department of Agriculture, Forest Service, North Central Forest Experiment Station: St. Paul, MN, USA, 1997; Volume 188, pp. 1–22. [Google Scholar]
- Parker, G.R.; Ruffner, C.M. Current and historical forest conditions and disturbance regimes in the Hoosier-Shawnee ecological assessment area. In The Hoosier-Shawnee Ecological Assessment; General Technical Report NC-244; US Department of Agriculture Forest Service, North Central Research Station: St. Paul, MN, USA, 2004; Volume 244, pp. 23–59. [Google Scholar]
- Dey, D.C.; Schweitzer, C.J. A review on the dynamics of prescribed fire, tree mortality, and injury in managing oak natural communities to minimize economic loss in North America. Forests 2018, 9, 461. [Google Scholar] [CrossRef]
- van de Gevel, S.L.; Ruffner, C.M. Land-use history and resulting forest succession in the Illinois Ozark Hills. In Proceedings of the 15th Central Hardwood Forest Conference, Knoxville, TN, USA, 27 February–1 March 2006; e-General Technical Report SRS-101. US Department of Agriculture, Forest Service, Southern Research Station: Asheville, NC, USA, 2006; Volume 101, pp. 719–726. [Google Scholar]
- Schweitzer, C.J.; Dey, D.C.; Wang, Y. White oak (Quercus alba) response to thinning and prescribed fire in northcentral Alabama mixed pine–hardwood forests. For. Sci. 2019, 65, 758–766. [Google Scholar] [CrossRef]
- Abrams, M.D. Fire and the development of oaks. BioScience 1992, 42, 346–353. [Google Scholar] [CrossRef]
- Arthur, M.A.; Alexander, H.D.; Dey, D.C.; Schweitzer, C.J.; Loftis, D.L. Refining the oak-fire hypothesis for management of oak-dominated forests of the eastern United States. J. For. 2012, 110, 257–266. [Google Scholar] [CrossRef]
- Brose, P.H.; Dey, D.C.; Phillips, R.J.; Waldrop, T.A. A meta-analysis of the fire-oak hypothesis: Does prescribed burning promote oak reproduction in eastern North America? For. Sci. 2013, 59, 322–334. [Google Scholar] [CrossRef]
- Holzmueller, E.J.; Jose, S.; Jenkins, M.A. The response of understory species composition, diversity, and seedling regeneration to repeated burning in southern Appalachian oak-hickory forests. Nat. Areas J. 2009, 29, 255–262. [Google Scholar] [CrossRef]
- Abrams, M.D. Distribution, historical development and ecophysiological attributes of oak species in the eastern United States. Ann. Des Sci. For. 1996, 53, 487–512. [Google Scholar] [CrossRef]
- Albrecht, M.A.; McCarthy, B.C. Effects of prescribed fire and thinning on tree recruitment patterns in central hardwood forests. For. Ecol. Manag. 2006, 226, 88–103. [Google Scholar] [CrossRef]
- McEwan, R.W.; Dyer, J.M.; Pederson, N. Multiple interacting ecosystem drivers: Toward an encompassing hypothesis of oak forest dynamics across eastern North America. Ecography 2011, 34, 244–256. [Google Scholar] [CrossRef]
- Xin, Y.; Williams, R.A. Effects of burn season on large seedlings of oak and other hardwood regeneration three years after shelterwood harvest. For. Stud. 2019, 71, 1–16. [Google Scholar] [CrossRef]
- Schweitzer, C.J.; Dey, D.C.; Wang, Y. Hardwood-pine mixedwoods stand dynamics following thinning and prescribed burning. Fire Ecol. 2016, 12, 85–104. [Google Scholar] [CrossRef]
- Dey, D.C. Sustaining oak forests in eastern North America: Regeneration and recruitment, the pillars of sustainability. For. Sci. 2014, 60, 926–942. [Google Scholar] [CrossRef]
- Greenler, S.M.; Saunders, M.R. Short-term, spatial regeneration patterns following expanding group shelterwood harvests and prescribed fire in the Central Hardwood Region. For. Ecol. Manag. 2019, 432, 1053–1063. [Google Scholar] [CrossRef]
- Holzmueller, E.; Groninger, J.W.; Ruffner, C.M. Facilitating oak and hickory regeneration in mature central hardwood forests. Forests 2014, 5, 3344–3351. [Google Scholar] [CrossRef]
- Mann, D.P.; Wiedenbeck, J.K.; Dey, D.C.; Saunders, M.R. Evaluating economic impacts of prescribed fire in the Central Hardwood Region. J. For. 2020, 118, 275–288. [Google Scholar] [CrossRef]
- United State Geological Survey. USGS 7.5-Minute Image Map for Jonesboro; United States Geological Survey: Illinois, IL, USA, 2015. [Google Scholar]
- National Cooperative Soil Survey. Soil Survey of Union County; United States Department of Natural Resources Conservation Service: Illinois, IL, USA, 2001; pp. 1–440. [Google Scholar]
- Holzmueller, E.J.; Groninger, J.W.; Ruffner, C.M.; Ozier, T.B. Composition of oak stands in the Illinois Ozark Hills 2 decades following light harvesting and no cutting. North. J. Appl. For. 2011, 28, 50–53. [Google Scholar] [CrossRef]
- Hoover, N.M. Succession of an Upland Oak/Hickory Forest in the Central Hardwood Region. Master’s Thesis, Southern Illinois University at Carbondale, Carbondale, IL, USA, 2018. [Google Scholar]
- R Core Team. R: A Language and Environment for Statistical Computing; R Foundation for Statistical Computing: Vienna, Austria, 2022. [Google Scholar]
- Hothorn, T.; Bretz, F.; Westfall, P. Simultaneous inference in general parametric models. Biom. J. J. Math. Methods Biosci. 2008, 50, 346–363. [Google Scholar] [CrossRef]
- Copenheaver, C.A.; Black, B.A.; Stine, M.B.; McManamay, R.H.; Bartens, J. Identifying dendroecological growth releases in American beech, jack pine, and white oak: Within-tree sampling strategy. For. Ecol. Manag. 2009, 257, 2235–2240. [Google Scholar] [CrossRef]
- Stokes, M.; Smiley, T. An Introduction to Tree-Ring Dating; University of Chicago Press: Chicago, IL, USA, 1968. [Google Scholar]
- Regent Instruments Inc. WinDENDRO: An Image Analysis System for Tree-Rings Analysis; Regent Instruments Inc.: Sainte Foy, QC, Canada, 2021. [Google Scholar]
- Bunn, A.G. A dendrochronology program library in R (dplR). Dendrochronologia 2008, 26, 115–124. [Google Scholar] [CrossRef]
- Bunn, A.G. Statistical and visual crossdating in R using the dplR library. Dendrochronologia 2010, 28, 251–258. [Google Scholar] [CrossRef]
- Zang, C.; Biondi, F. treeclim: An R package for the numerical calibration of proxy-climate relationships. Ecography 2015, 38, 431–436. [Google Scholar] [CrossRef]
- Inglis, E.N. Hardwood Regeneration and Growth following Multiple Silvicultural Treatments in a Central Hardwood Forest. Master’s Thesis, Southern Illinois University at Carbondale, Carbondale, IL, USA, 2022. [Google Scholar]
- Altman, J.; Fibich, P.; Dolezal, J.; Aakala, T. TRADER: A package for tree ring analysis of disturbance events in R. Dendrochronologia 2014, 32, 107–112. [Google Scholar] [CrossRef]
- Lorimer, C.G.; Frelich, L.E. A methodology for estimating canopy disturbance frequency and intensity in dense temperate forests. Can. J. For. Res. 1989, 19, 651–663. [Google Scholar] [CrossRef]
- Nowacki, G.J.; Abrams, M.D. Radial-growth averaging criteria for reconstructing disturbance histories from presettlement-origin oaks. Ecol. Monogr. 1997, 67, 225–249. [Google Scholar] [CrossRef]
- Rubino, D.L.; McCarthy, B. Comparative analysis of dendroecological methods used to assess disturbance events. Dendrochronologia 2004, 21, 97–115. [Google Scholar] [CrossRef]
- Trotsiuk, V.; Pederson, N.; Druckenbrod, D.L.; Orwig, D.A.; Bishop, D.A.; Barker-Plotkin, A.; Fraver, S.; Martin-Benito, D. Testing the efficacy of tree-ring methods for detecting past disturbances. For. Ecol. Manag. 2018, 425, 59–67. [Google Scholar] [CrossRef]
- Izbicki, B.J.; Alexander, H.D.; Paulson, A.K.; Frey, B.R.; McEwan, R.W.; Berry, A.I. Prescribed fire and natural canopy gap disturbances: Impacts on upland oak regeneration. For. Ecol. Manag. 2020, 465, 118107. [Google Scholar] [CrossRef]
- Nowacki, G.J.; Abrams, M.D. The demise of fire and “mesophication” of forests in the eastern United States. BioScience 2008, 58, 123–138. [Google Scholar] [CrossRef]
- Brose, P.H.; Rebbeck, J. A comparison of the survival and development of the seedlings of four upland oak species grown in four different understory light environments. J. For. 2017, 115, 159–166. [Google Scholar] [CrossRef]
- Iverson, L.R.; Hutchinson, T.F.; Peters, M.P.; Yaussy, D.A. Long-term response of oak-hickory regeneration to partial harvest and repeated fires: Influence of light and moisture. Ecosphere 2017, 8, e01642. [Google Scholar] [CrossRef]
- Hutchinson, T.F.; Sutherland, E.K.; Yaussy, D.A. Effects of repeated prescribed fires on the structure, composition, and regeneration of mixed-oak forests in Ohio. For. Ecol. Manag. 2005, 218, 210–228. [Google Scholar] [CrossRef]
- Stan, A.B.; Rigg, L.S.; Jones, L.S. Dynamics of a managed oak woodland in northeastern Illinois. Nat. Areas J. 2006, 26, 187–197. [Google Scholar] [CrossRef]
- Groninger, J.W.; Long, M.A. Oak ecosystem management considerations for central hardwoods stands arising from silvicultural clearcutting. North. J. Appl. For. 2008, 25, 173–179. [Google Scholar] [CrossRef]
- Rebbeck, J.; Gottschalk, K.; Scherzer, A. Do chestnut, northern red, and white oak germinant seedlings respond similarly to light treatments? Growth and biomass. Can. J. For. Res. 2011, 41, 2219–2230. [Google Scholar] [CrossRef]
- Schweitzer, C.J.; Dey, D.C. Midstory shelterwood to promote natural Quercus reproduction on the mid-Cumberland Plateau, Alabama: Status four years after final harvest. In Proceedings of the 20th Central Hardwood Forest Conference, Columbia, MO, USA, 28 March–1 April 2016; Kabrick, J.M., Dey, D.C., Knapp, B.O., Larsen, D.R., Shifley, S.R., Stelzer, H.E., Eds.; General Technical Report NRS-P-167. US Department of Agriculture, Forest Service, Northern Research Station: Newtown Square, PA, USA, 2017; Volume 167, pp. 87–98. [Google Scholar]
- Rebbeck, J. Fire management and woody invasive plants in oak ecosystems. In Proceedings of the 4th Fire in Eastern Oak Forests Conference, Springfield, MO, USA, 17–19 May 2011; Dey, D.C., Stambaugh, M.C., Clark, S.L., Schweitzer, C.J., Eds.; Gen. Tech. Rep. NRS-P-102. US Department of Agriculture, Forest Service, Northern Research Station: Newtown Square, PA, USA, 2012; Volume 102, pp. 142–155. [Google Scholar]
- Leeson, R.E.N.; Clayton, K.; Oliver, D.C.; Holzmueller, E.J.; Winkel, B.M. Short-term effects of silviculture treatments and white-tailed deer exclusion on oak and hickory regeneration in southern Illinois. Ill. State Acad. Sci. 2020, 113, 31–40. [Google Scholar]
- Miller, G.W.; Brose, P.H.; Gottschalk, K.W. Advanced oak seedling development as influenced by shelterwood treatments, competition control, deer fencing, and prescribed fire. J. For. 2017, 115, 179–189. [Google Scholar] [CrossRef]
- Redick, C.H.; Jacobs, D.F. Mitigation of deer herbivory in temperate hardwood forest regeneration: A meta-analysis of research literature. Forests 2020, 11, 1220. [Google Scholar] [CrossRef]
- Strole, T.A.; Anderson, R.C. White-tailed deer browsing: Species preferences and implications for central Illinois forests. Nat. Areas J. 1992, 12, 139–144. [Google Scholar]
- Ward, J.S.; Williams, S.C. Influence of deer hunting and residual stand structure on tree regeneration in deciduous forests. Wildl. Soc. Bull. 2020, 44, 519–530. [Google Scholar] [CrossRef]
- Adams, A.S.; Rieske, L.K. Herbivory and fire influence white oak (Quercus alba L.) seedling vigor. For. Sci. 2001, 47, 331–337. [Google Scholar]
- Kellner, K.F.; Swihart, R.K. Timber harvest and drought interact to impact oak seedling growth and survival in the Central Hardwood Forest. Ecosphere 2016, 7, e01473. [Google Scholar] [CrossRef]
- Gorchov, D.L.; Blossey, B.; Averill, K.M.; Dávalos, A.; Heberling, J.M.; Jenkins, M.A.; Kalisz, S.; McShea, W.J.; Morrison, J.A.; Nuzzo, V. Differential and interacting impacts of invasive plants and white-tailed deer in eastern US forests. Biol. Invasions 2021, 23, 2711–2727. [Google Scholar] [CrossRef]
- Rentch, J.S.; Desta, F.; Miller, G.W. Climate, canopy disturbance, and radial growth averaging in a second-growth mixed-oak forest in West Virginia, USA. Can. J. For. Res. 2002, 32, 915–927. [Google Scholar] [CrossRef]
- Miller, C.; Grayson, S.; Houser, A.; Clatterbuck, W.; Kuers, K. Thirty-year assessment of released, overtopped white oaks. In Proceedings of the 17th Central Hardwood Forest Conference, Lexington, KY, USA, 5–7 April 2010; Fei, S., Lhotka, J.M., Stringer, J.W., Gottschalk, K.W., Miller, G.W., Eds.; Gen. Tech. Rep. NRS-P-78. US Department of Agriculture, Forest Service, Northern Research Station: Newtown Square, PA, USA, 2011; Volume 78, pp. 514–520. [Google Scholar]
- Miller, G.W.; Stringer, J.W. Effect of crown release on tree grade and dbh growth of white oak sawtimber in eastern Kentucky. In Proceedings of the 14th Central Hardwood Forest Conference, Wooster, OH, USA, 16–19 March 2004; Yaussy, D.A., Hix, D.M., Long, R.P., Goebel, P.C., Eds.; Gen. Tech. Rep. NE-316. US Department of Agriculture, Forest Service, North Central Research Station: St. Paul, MN, USA, 2004; Volume 316, pp. 37–44. [Google Scholar]
Disclaimer/Publisher’s Note: The statements, opinions and data contained in all publications are solely those of the individual author(s) and contributor(s) and not of MDPI and/or the editor(s). MDPI and/or the editor(s) disclaim responsibility for any injury to people or property resulting from any ideas, methods, instructions or products referred to in the content. |
© 2023 by the authors. Licensee MDPI, Basel, Switzerland. This article is an open access article distributed under the terms and conditions of the Creative Commons Attribution (CC BY) license (https://creativecommons.org/licenses/by/4.0/).