Article

Heavy Logging Machinery Impacts Soil Physical Properties More than Nematode Communities

by
Kara S. Gibson
1,*,
Deborah A. Neher
2,
Nancy C. Johnson
3,4,
Robert R. Parmenter
5 and
Anita J. Antoninka
1
1
School of Forestry, Northern Arizona University, 200 East Pine Knoll Dr., Flagstaff, AZ 86011, USA
2
Department of Plant and Soil Science, University of Vermont, 63 Carrigan Dr., Burlington, VT 05405, USA
3
School of Earth and Sustainability, Northern Arizona University, 624 S Knoles Dr., Flagstaff, AZ 86011, USA
4
Department of Biological Sciences, Northern Arizona University, 617 S Beaver St., Flagstaff, AZ 86011, USA
5
Valles Caldera National Preserve, National Park Service, P.O. Box 359, Jemez Springs, NM 87025, USA
*
Author to whom correspondence should be addressed.
Forests 2023, 14(6), 1205; https://doi.org/10.3390/f14061205
Submission received: 14 May 2023 / Revised: 2 June 2023 / Accepted: 5 June 2023 / Published: 10 June 2023

Abstract

:
Mechanized logging equipment causes considerable soil disturbance, but little information is available regarding thresholds for impacts on soil nematodes—critical members of soil foodwebs which perform important ecological functions. We examined responses of nematode communities and soil physical characteristics to the increasing number of passes (one, three, or nine) by a tracked feller buncher during thinning of a xeric mixed conifer forest in New Mexico, USA. Within and between the harvester tracks, we measured soil surface penetration resistance and shear strength, quantified bulk density at four depth increments up to a maximum depth of 27 cm, and characterized nematode assemblages in the upper 10 cm. Eight months after treatment, nematode communities were less impacted than soil physical properties by harvester passes. Total nematode abundance was unaffected by any level of feller buncher disturbance, and sensitive K-selected nematode groups were reduced only at nine passes. Conversely, soil compaction occurred with a single pass and extended deep into the soil profile to at least 23–27 cm. The first pass also decreased surface penetration resistance and shear strength, indicating disruption of soil surface structural integrity. Additional passes did not further increase bulk density or decrease surface structural integrity. Our results indicate that low levels of logging machinery traffic may have negligible effects on nematode communities, but nevertheless emphasize the importance of minimizing areas subjected to disturbance because of impacts on soil physical properties.

1. Introduction

Thinning and logging operations in most industrialized countries rely extensively on mechanical harvesters (e.g., feller bunchers), skidders, and forwarders. Understanding how the use of such heavy equipment affects soil biota is crucial for minimizing negative impacts on soil foodwebs and the ecosystem processes they mediate. However, little attention has been paid to how disturbance from logging machinery affects the most abundant multicellular animals in forest soils: nematodes. Nematode assemblages often include millions of individuals per square meter [1] and comprise bacterivorous, fungivorous, predatory, omnivorous, and herbivorous taxa, all of which perform important (and generally beneficial) functional roles [2]. Microbivore nematodes enhance microbial activity, modulate the biomass and composition of microbial communities, and can contribute substantially to nutrient cycling [3,4,5]: in a meta-analysis of manipulative laboratory and greenhouse studies, Trap et al. [4] found that N mineralization nearly doubled in the presence of bacterivore nematodes. (Fungivore nematodes are probably less important than bacterivore nematodes for N mineralization [6,7].) Omnivorous and predatory nematodes can regulate the densities of animals feeding at lower trophic levels [8]. Root herbivore nematodes can stimulate or suppress plant growth, depending on their densities and identities; their feeding can also influence plant community dynamics, although the ramifications of root herbivore activities in natural systems remain poorly characterized relative to agricultural systems [9]. Nematodes in all feeding groups can disperse microbial propagules which adhere to their cuticles or survive passage through their intestines (with the latter dispersal mechanism more likely with microbivore nematodes) [10]. Finally, nematodes are important prey items for animals occupying higher trophic levels in soil foodwebs: not only do many predatory microarthropods rely on them, but they also represent a key source of nutrition for many otherwise detritivorous or microbivorous microarthropods which consume nematodes in small quantities [11]. Indeed, nematodes are suspected to be an important source of omega-3 fatty acids in terrestrial foodwebs [12]. Management impacts on nematodes can thus reverberate to affect larger animals (e.g., terrestrial salamanders).
Soil compression, vibration, churning, and shearing caused by logging equipment can both fatally injure nematodes and modify key aspects of their habitat [13,14]. Nematodes are aquatic organisms, requiring water films for activity (although many species are capable of anhydrobiosis); they are also too small to alter soil pore structure by their own movements. Pore size, connectivity, and soil hydration status thus determine their ability to sense and access food [15], and, for sexually reproducing species, to find mates. Soil disturbances from tracked harvesters alter all three of these habitat parameters. Compaction reduces pore volumes, pore connectivity, water infiltration, and gas exchange [16,17,18,19]. These changes can restrict nematode movements and hamper their ability to detect chemical signals indicating the location of prey and conspecifics. Near the surface, however, harvester traffic can temporarily stimulate microbial prey for some nematodes by severing roots and mixing organic and mineral soil layers. Harvesters also crush and uproot herbaceous plants and mosses, restricting the flow of matter and energy into the soil foodweb and altering microclimate.
The objective of this study was to determine how impacts on nematode communities and soil physical properties vary with the number of passes by a tracked harvester (feller buncher). We subjected forest floor understory vegetation and volcanic loamy soils to one, three, or nine passes from a feller buncher during thinning of a xeric mixed conifer forest in Valles Caldera National Preserve, New Mexico, USA and measured soil responses eight months later. Within and between the feller buncher tracks, we characterized nematode assemblages in the uppermost 10 cm of soil (where they are most abundant), measured soil surface penetration resistance and shear strength, documented ground cover variability, and quantified bulk density at four depth increments up to a maximum depth of 27 cm.
We expected that responses of nematode taxa to disturbance (manifesting as changes to habitat and resource availability and as mortality caused by vibration, shearing, and compression forces) would vary according to their size, life history characteristics, and feeding habits. We hypothesized that compaction would reduce total pore space available to nematodes and that this would most negatively impact large K-selected taxa, because these nematodes require the largest pore sizes and are least able to take advantage of hot spots and “hot moments” [20] of organic enrichment (Hypothesis 1). We also hypothesized that eight months after treatment application, populations of r-selected bacterivore and fungivore nematodes (“opportunists” with high reproductive output and generation times of days to weeks) would have recovered from the initial mortality event to a greater extent than K-selected taxa (“persisters” with low reproductive output and generation times of months to years) (Hypothesis 2), and that for these r-selected microbivores, diminished pore accessibility would be outweighed by stimulation of saprotrophic microbes (Hypothesis 3). Finally, we hypothesized that the removal of vegetative ground cover would decrease the abundance of herbivorous nematodes (Hypothesis 4).

2. Materials and Methods

2.1. Study Site, Experimental Design, Field Measurements, and Sample Collection

This study was performed at a site located at 35.953° N, 106.591° W and ~2700 m elevation at the foot of Cerro Seco in Valles Caldera National Preserve, New Mexico, USA (Figure 1). This site was selected as we had pre-treatment data from previous work and were able to work with operators prior to thinning to conduct our controlled experiment. Soils at this site are volcanic loams to silt loams [21] classified primarily as Vitrandic Hapludalfs, Vitrandic Hapludolls, and Vitrandic Argiudolls [22]. Prior to thinning, soil organic matter content in the uppermost 10 cm was 12.32% (SE = 1.27%) [21]. Overstory vegetation consists of mixed conifer forest including Engelmann spruce (Picea engelmannii Parry ex Engelm.), Colorado blue spruce (Picea pungens Engelm.), white fir (Abies concolor (Gord. & Glend.) Lindl. ex Hildebr.), Douglas-fir (Pseudotsuga menziesii (Mirb.) Franco), and ponderosa pine (Pinus ponderosa Lawson & C. Lawson), with occasional quaking aspen (Populus tremuloides Michx.). Mean temperatures range from 15 °C in July to −5 °C in December and January, and the area receives a mean of 690 mm of precipitation annually [23]. Although absent from the treatment area, soil foodwebs in similar vegetation types within the Preserve include the endangered endemic Jemez Mountains salamander (Plethodon neomexicanus Stebbins & Riemer), a strictly terrestrial species which spends most of the year belowground.
In November 2017, we established three experimental transects along natural corridors between trees to assess soil compaction and disturbance by logging machinery and impacts to soil nematode communities. Sections of each of the first three transects received treatments of one, three, and nine passes by a track feller buncher (TimberPro model TL735-B with a Quadco 22B saw attachment and 600 mm single grouser track shoes). The machine’s total weight was approximately 30,086 kg, distributed as 54.4 kPa (for comparison, a ~90 kg person produces surface compression forces of 75–151 kPa while walking). Trees surrounding the transects were left intact to isolate the effects of soil disturbance from those of light and temperature changes that occur following tree removal [24]. Three replicate treated and untreated sample pairs were collected the following July at evenly spaced points along the one, three, and nine pass sections of the three feller buncher transects, respectively. Treated samples were collected from the footprint of the machine track (subsequently termed “track samples”), and untreated samples (hereafter referred to as “intertrack samples”) were collected from between the tracks (Figure 2). Soil sampling and surface measurements occurred at three evenly spaced points per transect section. Prior to sampling, we characterized ground cover within 0.25 m2 quadrats centered on each sample collection point, quantifying percent cover by grasses, shrubs, forbs, mosses, lichens, pine litter, spruce litter, forb litter, moss litter, thatch, woody debris, sticks, scat, and bare ground. All sampling and in situ soil measurements were performed at consistent points marked on a 0.25 m2 cover frame. Within each quadrat, we measured soil surface resistance to penetration (three readings with a model FT 011 pocket penetrometer; QA supplies, Norfolk, VA, USA), litter depth, shear strength using a TORVANE (Durham Geo Slope Indicator, Tucker, GA, USA), and trench depth (i.e., depth of the nearest indentation formed by feller buncher tracks). For penetrometer readings, values of 0.099 kg/mm2 (the instrument’s maximum reading) or above were treated as 0.099 kg/mm2 (this applied to 10 of 162 readings). We collected soil cores for the determination of bulk density at depth increments of approximately 2–6 cm, 9–13 cm, 16–20 cm, and 23–27 cm. Cores were retrieved using a bulk density sampling cup with a liner ring (AMS, Inc., American Falls, ID, USA) designed to minimize compaction caused by sampling. When using this sampler, excess soil must be trimmed from the liner ring, resulting in discontinuous sampling depth increments (2–6 cm, 9–13 cm, 16–20 cm, and 23–27 cm are the first four depth increments retrievable by the sampler). Occasionally, a small amount of soil fell out of the sampling cup during retrieval, and in those instances, we measured the missing volume by covering the soil sample with plastic wrap (before removing it from the core) and noting the volume of water required to fill the liner ring to the brim.
Because most soil fauna reside in the uppermost 0–10 cm, we sampled this interval for nematodes. Overlying litter, if present, was cleared away, and soil cores for nematode extraction were removed using pipe segments with an internal diameter of 5.08 cm. Nematode soil samples were kept on ice for transport to Northern Arizona University and were stored at 4 °C until processing.

2.2. Sample Processing

Bulk density soil samples were dried at 105 °C and weighed. Bulk density was calculated as soil sample dry weight divided by 90.59 cm3, the internal volume of the sampling cup liner ring, according to instructions from the sampler manufacturer. When applicable, we corrected for incomplete samples by subtracting the measured missing volume from the internal liner ring volume.
Nematodes were extracted by centrifugal flotation with industrial grade colloidal silica solution (Ludox HSA; W.R. Grace and Co., Columbia, MD, USA) using a method modified from Griffiths et al. [25]. Briefly, soil samples were sieved through mesh with 6.3 mm openings and thoroughly homogenized, and a 5 g subsample was dried for 48 h at 105 °C to determine gravimetric water content. An 80 mL soil subsample for nematode extraction was weighed and transferred to a 500 mL centrifuge tube, which was filled with tap water and shaken. Subsamples were then centrifuged at 2110 RPM (~700 RCF) for 12 min. Floating organic matter was removed from the centrifuge tubes with a spoon and the supernatant was decanted and discarded. Nematodes and soil particles in the remaining pellet were resuspended in 300 mL of colloidal silica solution (diluted to a specific gravity of 1.17 g/cm3 with DI water) and centrifuged again at the same speed for 6 min. Nematodes were retrieved from the supernatant by pouring it over a 20 μm sieve, then were backwashed into a beaker with tap water. The original colloidal silica solution which passed through the sieve was then returned to the centrifuge tube, and the centrifugation and sieving steps were repeated twice, for a total of three times. Finally, the resulting nematode suspension was poured through an 850 μm sieve to remove any remaining large organic debris. Collected animals were preserved in DESS solution [26] and refrigerated at 4 °C until examination. Eight randomly selected track/intertrack sample pairs per disturbance level were included in nematode analyses (48 total samples). We present nematode abundances below as nematodes per g dry soil.
As nematode abundances were very high (median density in this study was ~6.5× greater than the global median reported in [27] and was in the 89th percentile of abundances reported from 6285 locations worldwide), we estimated total sample abundance based on 10% subsamples. We used a Hensen–Stempel pipette, developed to avoid sampling fractionation of plankton suspensions, to obtain representative 4 mL subsamples of 40 mL nematode suspensions. Samples were mixed gently by repeated inversion prior to subsampling, and subsampled nematodes were examined using an inverted compound microscope at 100×–400× magnification. We validated the accuracy of this abundance estimation method for 11 samples by comparing abundances calculated by subsampling to those obtained by direct examination of all nematodes present in a sample. Enumeration of entire nematode samples was performed using a stereomicroscope at a magnification of 40×–78.8×. Correlation between these abundance estimation methods was deemed sufficient to justify subsampling (r2 = 0.93).
The first 200 nematodes encountered in each subsample were identified to the taxonomic level necessary for classification to feeding group and position on the colonizer-persister scale (cp class; [28]). This scale represents the continuum from r-strategists (cp1) to K-strategists (cp5). Nematodes in colonizer-persister classes cp1 and cp2 are considered indicators of organic enrichment and/or basal fauna (disturbance-tolerant nematodes occurring in virtually all soils), while nematodes in the maturity indicator classes cp3, cp4, and cp5 are associated with increasing foodweb stability, complexity, and connectance [29]. Assignments were made according to the NEMAPLEX Nematode Ecophysiological Parameter database [30] with one exception: Monhysteridae were grouped with cp3 bacterivores because Monhystera was found by Fiscus and Neher [31] to be sensitive to tillage effects. Because specimen conditions sometimes made a determination of family impossible, and this information is necessary for the assignment of cp4 and cp5 Dorylaimida to both cp class and feeding group, all Dorylaimida were grouped together as cp4/cp5 omnivores, predators, and fungivores. We distinguished the groups cp1 bacterivores, cp2 bacterivores, cp3 bacterivores, cp4 bacterivores, cp2 fungivores, cp4/cp5 Dorylaimida, cp4 predators, cp2 plant associates (the ubiquitous and enigmatic Tylenchidae), and strict herbivores (which were not assigned to cp class, as plant-parasitic taxa are not commonly used as indicators of disturbance). Group assignments for taxa are listed in Table 1. We refer to the combination of feeding and cp groups as functional guilds (sensu Ferris et al. [29]), but it should be noted that the order Dorylaimida encompasses multiple functional guilds.

2.3. Statistical Analyses

Effects of pass number (transect segment), depth (for bulk density), and track/intertrack treatments on soil physical properties and nematode groups were analyzed using a non-parametric ANOVA-type mixed between-within subjects procedure based on sample ranks [33], implemented in R version 4.0.3 [34] using the package nparLD [35]. This procedure is robust to outliers and, for small sample sizes, is competitive with parametric mixed ANOVA [33]. We treated the transect sampling point as the “subject”, treatment (track or intertrack) as the within-subjects factor, and passes as the between-subjects factor (for penetration resistance, shear strength, and nematode groups, an F1-LD-F1 design). Our bulk density model additionally included depth as a nested within-subjects factor (an F1-LD-F2 design). For physical properties, a small number of missing values were dealt with either by averaging remaining replicates for the sample (penetrometer: 1 missing observation out of 162 total observations from the 54 sampling locations) or by the exclusion of the sample from analysis (torvane: 2 missing observations out of 54 total; bulk density: 5 missing observations out of 216 total). When models indicated a significant interaction between treatment and passes or depth, we performed post-hoc tests on individual pass levels and depths, respectively, to delineate impact thresholds. These post-hoc tests were conducted by fitting non-parametric ANOVA-type mixed between-within subjects models to subsets of the data (i.e., the specific factor levels we wished to examine) and running the ANOVA.test function. We have not corrected p-values for multiple comparisons because, given the relevance of our findings to conservation of the endangered Jemez Mountains Salamander, we consider the potential consequences of Type II errors to be graver than those of Type I errors.
Bivariate regression was performed to test whether the abundances of nematode groups could be predicted from indicators of soil physical disturbance and to determine whether herbivorous nematodes were correlated with plant cover classes. For regression analyses of nematode groups and bulk density, we examined each of the bulk density sampling intervals that overlapped with our nematode sampling interval (2–6 cm and 9–13 cm) as well as their mean. Predictor and response variables were log-transformed where necessary to achieve normality and homoscedasticity. Linear regressions were performed in R 4.0.3 [34] and visualized with the package ggplot2 [36]. We tested for multivariate treatment group differences using a multi-response permutation procedure (MRPP), a non-parametric test that calculates A, the chance-corrected proportion of between-sample distances explained by treatment group identity [37]. Community differences were visualized via non-metric multidimensional scaling ordination (NMDS). All NMDS and MRPP analyses were performed with PC-ORD version 5.10 [37] using the Bray–Curtis distance.

3. Results

3.1. Soil Physical Properties

Soil physical properties were altered with just one pass from the feller buncher, while more passes produced negligible additional changes. Both penetration resistance and shear strength were reduced in the feller buncher tracks relative to the intertracks, but there was no significant interaction between treatment (track or intertrack) and number of passes for either response variable (Figure 3; Table 2), indicating that the first pass was responsible for most of the damage to surface soil structure. Similarly, there was a significant main effect of treatment on bulk density, but no interaction between passes and treatment (Figure 4; Table 3) (although bulk density tended to be greatest in the tracks that received nine passes, and estimated relative treatment effects increased with each pass level for the track samples; Table S1).
The effects of feller buncher traffic on bulk density were more discernible deeper in the soil profile than near the surface. Our model detected an interaction between bulk density and depth, and post-hoc analyses revealed that feller buncher effects on bulk density were not detectable in the 2–6 cm interval (treatment main effect: ATS = 0.253, df = 1, p = 0.615), despite greater bulk density in track samples relative to intertrack samples at depths of 9–13 cm (treatment main effect: ATS = 6.69, df = 1, p = 0.010), 16–20 cm (treatment main effect: ATS = 16.03, df = 1, p < 0.001), and 23–27 cm (treatment main effect: ATS = 14.20, df = 1, p < 0.001). On average and across pass levels, bulk density was 8.9% greater in the tracks than between them at the three deepest intervals sampled.

3.2. Ground Cover

On average and across pass levels, the feller buncher reduced live grass and moss cover (the dominant plant cover groups) by half or more, while quadrupling the mean amount of bare ground (Figure 2; Table 4). These trends of reduced plant cover and increased bare ground in the tracks relative to the intertracks were evident across all pass levels. However, MRPP detected significant differences in ground cover composition between track and intertrack quadrats only at the 3 and 9 pass treatment levels (Table 5).

3.3. Nematode Community Impacts

Total nematode abundance was unaffected by any level of feller buncher traffic (Figure 5; Table 6), and total nematodes were not correlated with a bulk density of either the 2–6 cm interval, the 9–13 cm interval, or the mean of these two intervals (r2 < 0.05, p > 0.15 in all cases). There also was no significant relationship between total nematode densities and penetration resistance (r2 = 0.050, p = 0.115) or shear strength (r2 = 0.043, p = 0.162). However, nematode functional groups differed in their responses to disturbance from the harvester.
Fungivore and bacterivore nematodes with colonizer-persister values of cp1 (enrichment opportunists [38]) and cp2 (general opportunists) appeared resilient to harvester traffic. Cp2 bacterivores were elevated in the nine-pass intertrack treatment (post-hoc non-parametric ANOVA-type analysis for nine-pass data only: ATS = 6.42, df = 1.00, p = 0.011), but were otherwise unaffected by feller buncher disturbance (Figure 6a; Table 7). Only about 20% of samples (eight samples from the feller buncher tracks and two intertrack samples) yielded any cp1 bacterivores at all; where they occurred, these nematodes usually were present in low numbers (<1 nematode/g dry soil) (Table S2). Cp2 fungivores likewise comprised a small fraction of the nematode communities in our samples. These nematodes, which are dually classified as enrichment opportunists and basal fauna, were more abundant in the tracks relative to the intertracks (Figure 6b; Table 7).
Persister nematodes in cp groups 3–5 declined only at the level of nine passes from the feller buncher (Figure 7a). Total cp3, cp4, and cp5 nematodes showed a weak negative relationship with bulk density of the 9–13 cm sampling interval (Figure 7b), but not with the 2–6 cm interval (r2 = 0.008, p = 0.550) or the mean of the 2–6 cm and 9–13 cm intervals (r2 = 0.047, p = 0.139). Abundance of nematodes in these groups also correlated positively with penetration resistance (Figure 7c), but we did not detect a relationship between sensitive nematode groups and our soil shear strength measurements (Figure 7d). The dominant persister groups, cp3/cp4 bacterivores (Figure 7e; Table 8) and cp4/cp5 Dorylaimida (Figure 7f; Table 8), exhibited similar patterns in their responses to the harvester disturbance treatment levels. Contrary to our expectation that larger taxa requiring larger pores would be most impacted by compaction, slender cp3 and cp4 bacterivores were correlated weakly with bulk density (r2 = 0.065, p = 0.084 for the 9–13 cm bulk density sampling interval), while no relationship was apparent between bulk density and abundance of large-bodied Dorylaimida (r2 = 0.025, p = 0.291 for bulk density at 9–13 cm).
Despite the negative effects of the feller buncher on understory vegetation, herbivorous nematodes (Figure 8a; Table 9) and plant associated nematodes in the family Tylenchidae (Figure 8b; Table 9) were not reduced in the tracks relative to the intertracks. Herbivore abundances were, however, related to variability in ground cover. Herbivorous nematodes were more abundant in plots with more grass and thatch cover, and less numerous in plots with more bare ground (Figure 8c). When examined as bivariate correlations, only the relationship between herbivorous nematodes and the percent grass cover was significant (r2 = 0.20, p = 0.002). Tylenchidae—a family which comprised a median ~27% of nematode individuals across samples, in line with proportions frequently reported from natural systems [39]—were not correlated with grass or any other cover class (r2 < 0.1, p > 0.1 for all relationships).

4. Discussion

4.1. Physical Properties

Responses of soil physical properties to tracked harvester disturbance can be complex. While compaction should be expected to increase soil bulk density, penetration resistance, and shear strength, churning disaggregation of the litter and soil matrix is anticipated to decrease all three of these variables. Although our study design does not allow us to disentangle the effects of compaction from those of churning, our findings of reduced surface penetration resistance and shear strength in the feller buncher tracks suggest that churning effects predominated in the topsoil. In further support of this inference, we also observed no effect of the feller buncher on bulk density in our shallowest sampling interval (2–6 cm), despite the occurrence of traffic-related compaction deeper in the soil profile. Indeed, contrary to studies (e.g., [13,40,41]) reporting that compaction from logging machinery is greatest near the surface and attenuates rapidly with depth, in our study the greatest harvester-related bulk density increase occurred at the deepest sampling intervals (16–20 cm and 23–27 cm). This pattern may also be explained by the relatively low surface contact stress produced by the feller buncher, but relatively high mass load per track (~15,043 kg): with increasing depth, soil stress is increasingly a function of a machine’s mass load per wheel or track rather than of the surface contact stress applied [42]. It is possible that compaction extended even deeper into the soil profile than the maximum depth we measured (27 cm). This is concerning because recovery from compaction takes longer at depth: soils may recover within a few years from compaction near the surface (although this is not a given: McNabb and Startsev [43] report that near-surface boreal forest soils still had not recovered 7 years after compaction by a skidder), while compaction at 20–30 cm may persist for half a century or longer [44]. While the danger of long-lasting subsoil compaction from increasingly heavy agricultural machinery has recently been highlighted [42], less attention has been paid to the relationship between logging machinery weight and compaction depth in forest soils. There is a need for studies establishing safe equipment weight limits to avoid deep compaction, adjusted for specific soil types and site conditions.
Our findings echo numerous other reports indicating that the first pass by heavy logging machinery is often the most damaging [45,46] (but see [13]). Both subsoil compaction and damage to soil surface structural integrity occurred with one pass from the feller buncher, while subsequent passes had insignificant additional effects. Compaction in our experimental transects may have been more severe than in the wider treatment area because our transects were not covered with slash mats ahead of harvester passage, a common practice that provides some protection against soil compaction, especially when soils are wet [46,47]. Conversely, the harvester in this experiment was not carrying a tree, which likely reduced compaction; our study design may also have underestimated compaction because compression forces can radiate some distance away from logging machinery tracks (e.g., Labelle and Jaeger [48] observed bulk density increases up to 1 m away from tracks). Thus, the bulk density of soil in the intertracks may have been greater than that of untreated soil further from the tracks [46].

4.2. Nematode Communities

Despite these changes to their physical habitat, nematode communities appeared largely resilient or resistant to harvester traffic. We observed no effect of the feller buncher on total nematode abundance with any number of passes, and contrary to our hypothesis that compaction would adversely affect nematodes by restricting the availability of suitably-sized pores (Hypothesis 1), neither total nematodes nor large-bodied, K-selected Dorylaimida were correlated with bulk density. Although the bulk density is an imperfect measure of usable pore space [49], our results suggest that pore space was not limited to nematodes in the top 10 cm of soil at the time of sampling, possibly because the soil was not compacted in the uppermost few centimeters where organic matter and food resources were presumably concentrated.
While nematode communities were insensitive to bulk density, nematode functional guild responses point instead to the overriding importance of post-mortality recovery and food resource changes in structuring nematode communities eight months after disturbance. In support of our hypothesis that r-selected nematode groups would recover more quickly than K-selected groups following the initial mortality event (Hypothesis 2), r-selected groups were either neutrally or positively affected by feller buncher traffic, while only K-selected “persister” nematodes in cp groups 3–5 were less abundant in the feller buncher tracks than in the intertracks. However, even K-selected nematodes were not impacted until nine passes. We infer from this that several passes may be necessary before extensive nematode mortality occurs. Interestingly, persister bacterivores with cp classifications of 3 and 4 declined more dramatically than Dorylaimida with cp classifications of 4 and 5, which could imply that the former occupy less structurally stable niches [50,51] than the latter.
The hypothesis that opportunist microbivores would benefit from stimulation of their food resources (Hypothesis 3) by surface disturbance was supported by an increase in cp2 fungivores (but not opportunist bacterivores) in the feller buncher tracks relative to the intertracks at all pass levels. This indicates that feller buncher disturbance stimulated the fungal energy channel in the soil foodweb to a greater extent than the bacterial energy channel, likely because the organic resources made available to saprotrophs during the disturbance (e.g., root necromass, woody debris, and conifer needles) were predominantly recalcitrant materials with high C:N ratios—substrate characteristics which favor fungal decomposition over bacterial decomposition. In a field study of nematode community succession following the addition of various organic materials ranging in complexity and C:N ratios, cp2 fungivores increased most rapidly in plots amended with recalcitrant, high C:N materials, while opportunist bacterivores were stimulated least by these organic amendment types [38]. The increase in cp2 fungivores within the feller buncher tracks was likely lower than occurred across the surrounding treated area (and lower than might be expected following thinning of conifer forests generally), because organic enrichment in the disturbance transects mainly took the form of fragmentation and incorporation of existing forest floor organic material into the soil, whereas logging debris is typically deposited during real-world harvesting operations. Logging debris can have significant, if transient, stimulatory effects on nematode communities: In a clear-cut Scots pine (Pinus sylvestris) forest in Sweden, slash temporarily elevated total nematode abundance by up to 360% relative to an unlogged control forest, and up to 220% relative to clear-cut plots without slash [52]. Similarly, at another site within Valles Caldera National Preserve, total nematode abundance was 112% greater within a Pinus ponderosa forest management unit that had been thinned two years prior (with mastication of unmerchantable timber) than within an adjacent untreated management unit [53]. (Nematodes were not identified in either of these studies.)
The feller buncher reduced vegetative ground cover, but counter to our expectation that plant-feeding nematodes (including herbivores and plant-associates) would be impacted negatively by diminished availability of roots following disturbance (Hypothesis 4), the tracks and intertracks did not differ in abundances of plant associates (Tylenchidae) or herbivores. Feeding habits in the Tylenchidae remain poorly resolved; members have been variously reported to feed on plant roots, fungi, mosses, or algae [54,55]. Diverse dietary preferences within this family may explain why their overall densities were unrelated to ground cover and unaffected by feller buncher traffic. However, herbivore abundances were correlated with ground cover (especially grass cover), implying that the high heterogeneity of vegetation across our experimental area may have obscured the effect of feller buncher disturbance on these nematodes. It is also possible that the narrowness of the feller buncher tracks dampened the impact of disturbance on this trophic group, since roots from surviving plants on either side could have continued provisioning herbivores within the tracks.

5. Conclusions

Results of this study suggest that nematode communities may be relatively resistant, and potentially resilient, to disturbance from heavy harvesters. If so, nutrient cycling, microorganism dispersal, and pest regulation services provided by nematode communities are unlikely to be impacted by low levels of logging machinery traffic. Further work is needed to confirm our findings across soil and equipment types and to explore the implications of harvester disturbances for soil foodweb functions, especially where topsoil compaction is more severe. The complex nature of the soil disturbance in our study may have obscured linkages between soil pore accessibility and nematodes which could be illuminated by investigations quantifying pore size and connectivity. Finally, the identification of sentinel nematode taxa [56] that are especially sensitive to soil disturbance by logging machinery could aid forest managers in minimizing impacts and in gauging long-term changes in soil foodwebs following treatment.
Although impacts to nematode communities were minimal at low traffic levels, our findings highlight the vulnerability of this soil type to deep compaction with even one pass from heavy logging machinery. We thus stress the importance of using the lightest effective equipment and minimizing the area driven upon, particularly when working on fine or volcanic soils which may be inordinately vulnerable to compaction and slower to recover from it [40,45,57]. We also suggest that techniques for avoiding compaction (e.g., use of slash mats and thinning when soils are dry or frozen) be evaluated in situ prior to treating large areas on a given soil type, especially where sensitive or endangered belowground species occur. These tests should ideally be conducted at a depth of at least 15 cm. Finally, in forests that have previously been logged using heavy machinery, preexisting disturbance pathways should be identified and reused to the extent feasible to minimize cumulative impacts [58].
Climate change and the increased prevalence of high-severity forest fires necessitate forest management, including the use of heavy equipment. We recommend some precautionary practices from this research, but also indicate a need for further study.

Supplementary Materials

The following supporting information can be downloaded at https://www.mdpi.com/article/10.3390/f14061205/s1: Table S1: Rank means, number of observations, and relative treatment effects from non-parametric ANOVA-type mixed between-within subjects analysis of bulk density. Table S2: Abundance (nematodes per g dry soil) of nematode functional groups. Table S3: Multi-repsonse permutation procedure analysis of nematode community differences, based on functional guilds. Figure S1: Non-metric multidimensional scaling ordination of nematode community differences. Figure S2: Total nematode abundances, calculated on a per-area basis. Figure S3: Abundances per m2 of cp2 bacterivores (a) and cp2 fungivores (b). Figure S4: (a) Total abundances of cp3, cp4, and cp5 nematodes per m2; correlations between total cp3, cp4, and cp5 nematodes per m2 and (b) bulk density at 9–12 cm, (c) surface penetration resistance, and (d) soil shear stress; (e) Harvester disturbance treatment responses of total cp3 and cp4 bacterivores per m2; (f) Responses of Dorylaimida per m2 to harvester traffic. Figure S5: Densities per m2 of (a) herbivore nematodes and (b) nematodes in the family Tylenchidae.

Author Contributions

Conceptualization, K.S.G., N.C.J., R.R.P. and A.J.A.; methodology, K.S.G. and A.J.A.; software, K.S.G. with support from A.J.A.; validation, K.S.G., D.A.N., N.C.J., R.R.P. and A.J.A.; formal analysis, K.S.G. with support from D.A.N. and A.J.A.; investigation, K.S.G. and A.J.A.; resources, Northern Arizona University, Valles Caldera National Preserve, K.S.G., N.C.J., R.R.P. and A.J.A.; data curation, K.S.G. and R.R.P.; writing—original draft preparation, K.S.G.; writing—review and editing, D.A.N., N.C.J., R.R.P. and A.J.A.; visualization, K.S.G. with support from A.J.A.; supervision, A.J.A.; project administration, K.S.G., N.C.J., R.R.P. and A.J.A.; funding acquisition, N.C.J., R.R.P. and A.J.A. All authors have read and agreed to the published version of the manuscript.
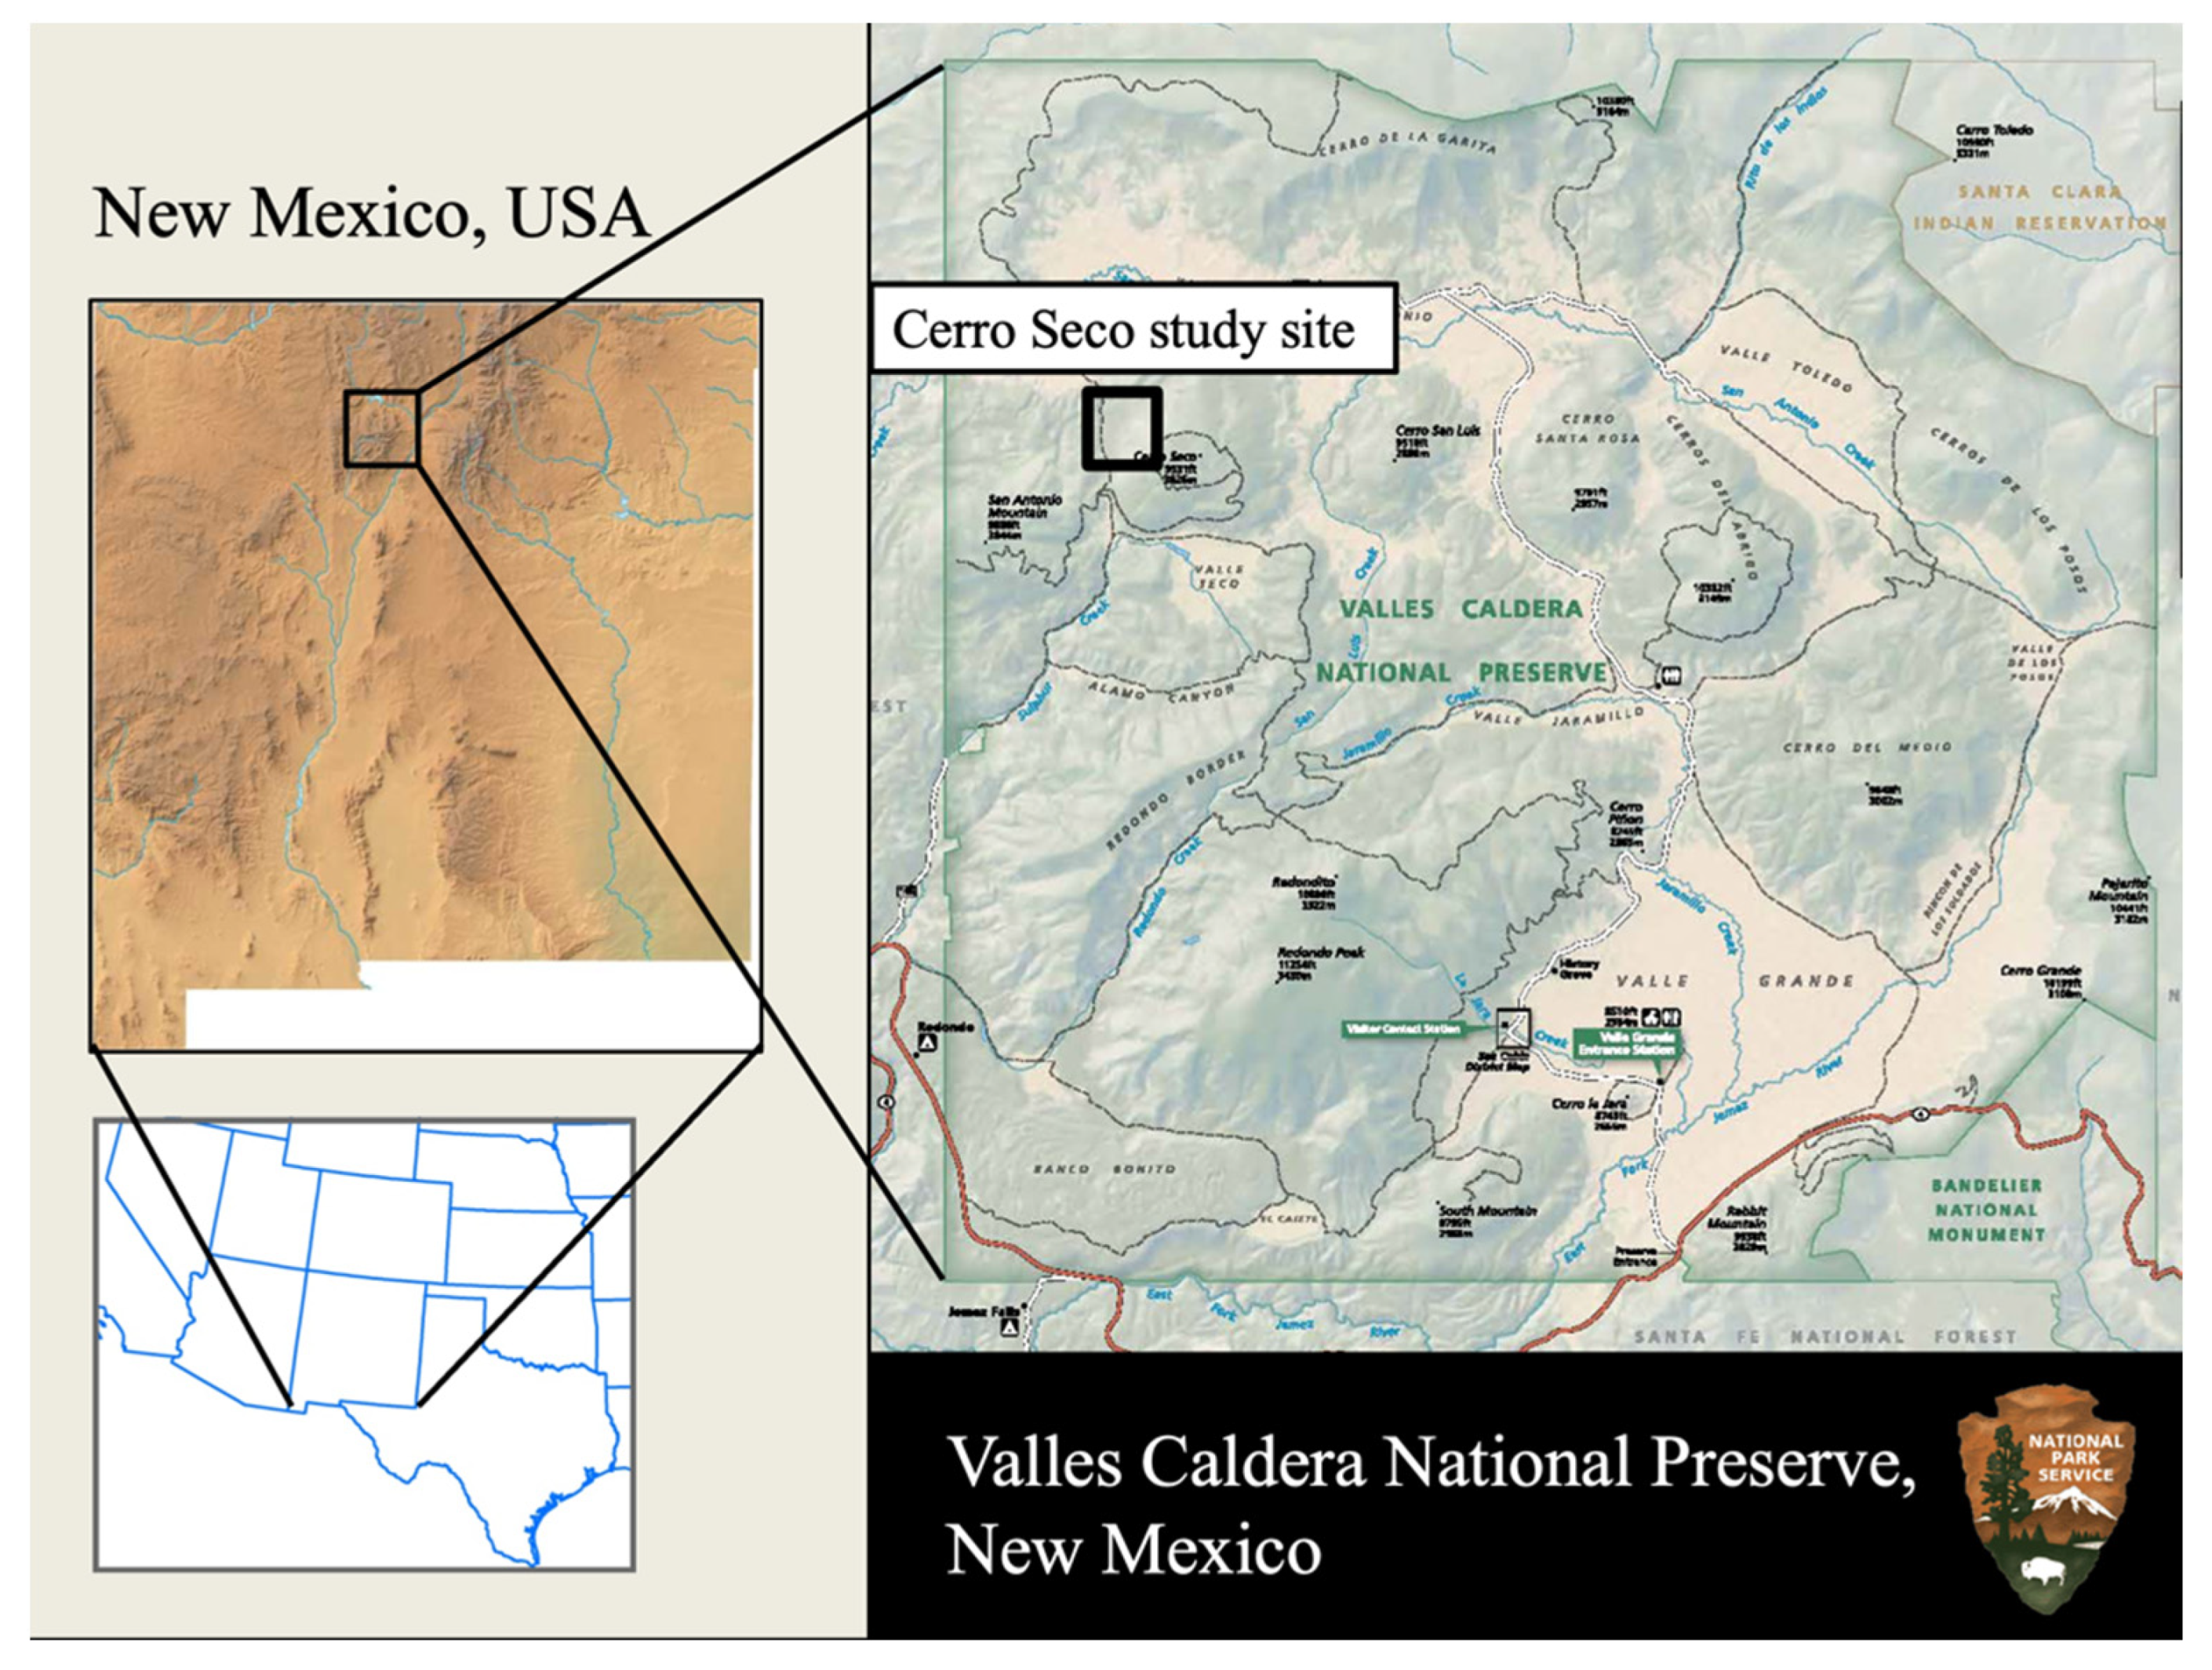
Funding

This research was funded by the National Park Service, Valles Caldera National Preserve, through Cooperative Ecosystem Studies Units (CESU) Task Agreement #P16AC00911 grant to A.J.A. and N.C.J.

Data Availability Statement

The data presented in this study are openly available on the US National Park Service Integrated Resource Management Applications (IRMA) DataStore website at: https://irma.nps.gov/DataStore/Reference/Profile/2298873 (accessed on 13 May 2023) (IRMA DataStore item code: 2298873).

Acknowledgments

We thank feller buncher operator Joby Conley of TC Company for treating our transects. We are also grateful to Maxwell Benning, Mildred Diaz, Cedric Gammon, Jenni Hedin, Verti Sigurani, Michael Sloan, and Sedona Spann for their invaluable assistance with sample collection and processing.

Conflicts of Interest

The authors declare no conflict of interest. The funder (National Park Service) had no role in the design of the study; in the collection, analyses, or interpretation of data; in the writing of the manuscript; or in the decision to publish the results. Co-author R.R.P. acquired the funding from NPS for this project.

References

  1. Yeates, G.W. Abundance, Diversity, and Resilience of Nematode Assemblages in Forest Soils. Can. J. For. Res. 2007, 37, 216–225. [Google Scholar] [CrossRef]
  2. Neher, D.A. Role of Nematodes in Soil Health and Their Use as Indicators. J. Nematol. 2001, 33, 161–168. [Google Scholar] [PubMed]
  3. Ferris, H.; Venette, R.C.; Lau, S.S. Population Energetics of Bacterial-Feeding Nematodes: Carbon and Nitrogen Budgets. Soil Biol. Biochem. 1997, 29, 1183–1194. [Google Scholar] [CrossRef]
  4. Trap, J.; Bonkowski, M.; Plassard, C.; Villenave, C.; Blanchart, E. Ecological Importance of Soil Bacterivores for Ecosystem Functions. Plant Soil 2016, 398, 1–24. [Google Scholar] [CrossRef] [Green Version]
  5. Fu, S.; Ferris, H.; Brown, D.; Plant, R. Does the Positive Feedback Effect of Nematodes on the Biomass and Activity of Their Bacteria Prey Vary with Nematode Species and Population Size? Soil Biol. Biochem. 2005, 37, 1979–1987. [Google Scholar] [CrossRef]
  6. Okada, H.; Ferris, H. Effect of Temperature on Growth and Nitrogen Mineralization of Fungi and Fungal-Feeding Nematodes. Plant Soil 2001, 234, 253–262. [Google Scholar] [CrossRef]
  7. Ferris, H.; Venette, R.C.; Scow, K.M. Soil Management to Enhance Bacterivore and Fungivore Nematode Populations and Their Nitrogen Mineralisation Function. Appl. Soil Ecol. 2004, 25, 19–35. [Google Scholar] [CrossRef]
  8. Steel, H.; Ferris, H. Soil Nematode Assemblages Indicate the Potential for Biological Regulation of Pest Species. Acta Oecol. 2016, 73, 87–96. [Google Scholar] [CrossRef]
  9. Wilschut, R.A.; Geisen, S. Nematodes as Drivers of Plant Performance in Natural Systems. Trends Plant Sci. 2021, 26, 237–247. [Google Scholar] [CrossRef]
  10. Ingham, R.E.; Trofymow, J.A.; Ingham, E.R.; Coleman, D.C. Interactions of Bacteria, Fungi, and Their Nematode Grazers: Effects on Nutrient Cycling and Plant Growth. Ecol. Monogr. 1985, 55, 119–140. [Google Scholar] [CrossRef]
  11. Heidemann, K.; Hennies, A.; Schakowske, J.; Blumenberg, L.; Ruess, L.; Scheu, S.; Maraun, M. Free-Living Nematodes as Prey for Higher Trophic Levels of Forest Soil Food Webs. Oikos 2014, 123, 1199–1211. [Google Scholar] [CrossRef]
  12. Menzel, R.; Geweiler, D.; Sass, A.; Simsek, D.; Ruess, L. Nematodes as Important Source for Omega-3 Long-Chain Fatty Acids in the Soil Food Web and the Impact in Nutrition for Higher Trophic Levels. Front. Ecol. Evol. 2018, 6, 96. [Google Scholar] [CrossRef] [Green Version]
  13. Nazari, M.; Eteghadipour, M.; Zarebanadkouki, M.; Ghorbani, M.; Dippold, M.A.; Bilyera, N.; Zamanian, K. Impacts of Logging-Associated Compaction on Forest Soils: A Meta-Analysis. Front. For. Glob. Chang. 2021, 4. [Google Scholar] [CrossRef]
  14. Eroğlu, H.; Sariyildiz, T.; Küçük, M.; Sancal, E. The Effects of Different Logging Techniques on the Physical and Chemical Characteristics of Forest Soil. Baltic For. 2016, 22, 139–147. [Google Scholar]
  15. Erktan, A.; Or, D.; Scheu, S. The Physical Structure of Soil: Determinant and Consequence of Trophic Interactions. Soil Biol. Biochem. 2020, 148, 107876. [Google Scholar] [CrossRef]
  16. Shestak, C.J.; Busse, M.D. Compaction Alters Physical but Not Biological Indices of Soil Health. Soil Sci. Soc. Am. J. 2005, 69, 236. [Google Scholar] [CrossRef] [Green Version]
  17. Reicosky, D.C.; Voorhees, W.B.; Radke, J.K. Unsaturated Water Flow through a Simulated Wheel Track. Soil Sci. Soc. Am. J. 1981, 45, 3–8. [Google Scholar] [CrossRef]
  18. Kim, I.; Han, S.-K.; Acuna, M.; Woo, H.; Oh, J.-H.; Choi, B. Effect of Heavy Machine Traffic on Soil CO2 Concentration and Efflux in a Pinus Koraiensis Thinning Stand. Forests 2021, 12, 1497. [Google Scholar] [CrossRef]
  19. Teepe, R.; Brumme, R.; Beese, F.; Ludwig, B. Nitrous Oxide Emission and Methane Consumption Following Compaction of Forest Soils. Soil Sci. Soc. Am. J. 2004, 68, 605–611. [Google Scholar] [CrossRef]
  20. Kuzyakov, Y.; Blagodatskaya, E. Microbial Hotspots and Hot Moments in Soil: Concept & Review. Soil Biol. Biochem. 2015, 83, 184–199. [Google Scholar]
  21. Johnson, N.C.; Antoninka, A.J.; Gibson, K.S.; Grover, H.S. Impact of Forest Restoration Activities (Thinning and Fire) on Soil Compaction and Soil Biological Communities: Final Report to Valles Caldera National Preserve and the National Park Service. 2021. Available online: https://irma.nps.gov/DataStore/Reference/Profile/2299470 (accessed on 14 May 2023).
  22. Hibner, C.D.; Strenger, S.; Miller, A.; Sebring, S.; Olson, D.; Nemecek, J.; Schmit, S.; Bishop, C.; Ferguson, C.; Robbie, W.; et al. Terrestrial Ecological Unit Inventory of the Valles Caldera National Preserve, Sandoval County, New Mexico. Unpublished Report; USDA Forest Service, Region 3, Albuquerque, New Mexico and Natural Resources Conservation Service; USDA: Santa Fe, NM, USA, 2010. [Google Scholar]
  23. PRISM Climate Group PRISM Climate Data. Available online: https://prism.oregonstate.edu/ (accessed on 19 July 2021).
  24. Parmenter, R.R.; Losleben, M.V. Influence of Mixed Conifer Forest Thinning and Prescribed Fire on Soil Temperature and Moisture Dynamics in Proximity to Forest Logs: A Case Study in New Mexico, USA. Forests 2023, 14, 1117. [Google Scholar] [CrossRef]
  25. Griffiths, B.S.; Boag, B.; Neilson, R.; Palmer, L. The Use of Colloidal Silica to Extract Nematodes from Small Samples of Soil or Sediment. Nematologica 1990, 26, 465–473. [Google Scholar]
  26. Yoder, M.; Tandingan, I.; Ley, D.; King, I.W.; Mundo-Ocampo, M.; Mann, J.; Blaxter, M.; Poiras, L.; De Ley, P. DESS: A Versatile Solution for Preserving Morphology and Extractable DNA of Nematodes. Nematology 2006, 8, 367–376. [Google Scholar] [CrossRef]
  27. van den Hoogen, J.; Geisen, S.; Wall, D.H.; Wardle, D.A.; Traunspurger, W.; de Goede, R.G.M.; Adams, B.J.; Ahmad, W.; Ferris, H.; Bardgett, R.D.; et al. A Global Database of Soil Nematode Abundance and Functional Group Composition. Sci. Data 2020, 7, 103. [Google Scholar] [CrossRef] [PubMed] [Green Version]
  28. Bongers, T. The Maturity Index: An Ecological Measure of Environmental Disturbance Based on Nematode Species Composition. Oecologia 1990, 83, 14–19. [Google Scholar] [CrossRef]
  29. Ferris, H.; Bongers, T.; De Goede, R.G.M. A Framework for Soil Food Web Diagnostics: Extension of the Nematode Faunal Analysis Concept. Appl. Soil Ecol. 2001, 18, 13–29. [Google Scholar] [CrossRef]
  30. Ferris, H. Nemaplex Ecophysiological Parameters. Available online: http://nemaplex.ucdavis.edu/Ecology/EcophysiologyParms/EcoParameterMenu.html (accessed on 30 March 2019).
  31. Fiscus, D.A.; Neher, D.A. Distinguishing Sensitivity of Free-Living Soil Nematode Genera to Physical and Chemical Disturbances. Ecol. Appl. 2002, 12, 565–575. [Google Scholar] [CrossRef]
  32. Bongers, T.; de Goede, R.G.M.; Korthals, G.W.; Yeates, G.W. Proposed Changes of C-p Classification for Nematodes. Russ. J. Nematol. 1995, 3, 61–62. [Google Scholar]
  33. Brunner, E.; Domhof, S.; Langer, F. Nonparametric Analysis of Longitudinal Data in Factorial Experiments; Wiley: Hoboken, NJ, USA, 2002; ISBN 9780471441663. [Google Scholar]
  34. R Core Team. R: A Language and Environment for Statistical Computing; R Foundation for Statistical Computing: Vienna, Austria, 2020. [Google Scholar]
  35. Noguchi, K.; Gel, Y.R.; Brunner, E.; Konietschke, F. NparLD: An R Software Package for the Nonparametric Analysis of Longitudinal Data in Factorial Experiments. J. Stat. Softw. 2012, 50, 1–23. [Google Scholar] [CrossRef] [Green Version]
  36. Wickham, H. Ggplot2. Wiley Interdiscip. Rev. Comput. Stat. 2011, 3, 180–185. [Google Scholar] [CrossRef]
  37. McCune, B.; Mefford, M.J. PC-ORD. In Multivariate Analysis of Ecological Data; Version 5.10; MjM Software Design: Gleneden Beach, OR, USA, 2006; ISBN 9780972129008. [Google Scholar]
  38. Ferris, H.; Matute, M.M. Structural and Functional Succession in the Nematode Fauna of a Soil Food Web. Appl. Soil Ecol. 2003, 23, 93–110. [Google Scholar] [CrossRef]
  39. Ferris, H.; Bongers, T. Nematode Indicators of Organic Enrichment. J. Nematol. 2006, 38, 3–12. [Google Scholar]
  40. Cambi, M.; Certini, G.; Neri, F.; Marchi, E. The Impact of Heavy Traffic on Forest Soils: A Review. For. Ecol. Manag. 2015, 338, 124–138. [Google Scholar] [CrossRef]
  41. Bates, P.C. Compaction by Logging Equipment of Six Soils in Northwestern Montana as Affected by Soil Water Content, Equipment Type, and Number of Passes. 1981. Available online: https://scholarworks.montana.edu/xmlui/bitstream/handle/1/8207/31762103592026.pdf?sequence=1 (accessed on 6 July 2022).
  42. Keller, T.; Or, D. Farm Vehicles Approaching Weights of Sauropods Exceed Safe Mechanical Limits for Soil Functioning. Proc. Natl. Acad. Sci. USA 2022, 119, e2117699119. [Google Scholar] [CrossRef]
  43. Mc Nabb, D.H.; Startsev, A. Seven-Year Changes in Bulk Density Following Forest Harvesting and Machine Trafficking in Alberta, Canada. Forests 2022, 13, 553. [Google Scholar] [CrossRef]
  44. Mohieddinne, H.; Brasseur, B.; Spicher, F.; Gallet-Moron, E.; Buridant, J.; Kobaissi, A.; Horen, H. Physical Recovery of Forest Soil after Compaction by Heavy Machines, Revealed by Penetration Resistance over Multiple Decades. For. Ecol. Manag. 2019, 449, 117472. [Google Scholar] [CrossRef]
  45. Ampoorter, E.; De Schrijver, A.; Van Nevel, L.; Hermy, M.; Verheyen, K. Impact of Mechanized Harvesting on Compaction of Sandy and Clayey Forest Soils: Results of a Meta-Analysis. Ann. For. Sci. 2012, 69, 533–542. [Google Scholar] [CrossRef] [Green Version]
  46. Ampoorter, E.; Goris, R.; Cornelis, W.M.; Verheyen, K. Impact of Mechanized Logging on Compaction Status of Sandy Forest Soils. For. Ecol. Manag. 2007, 241, 162–174. [Google Scholar] [CrossRef]
  47. Han, H.-S.; Page-Dumroese, D.; Han, S.-K.; Tirocke, J. Effects of Slash, Machine Passes, and Soil Moisture on Penetration Resistance in a Cut-to-Length Harvesting. Int. J. Forest Eng. 2006, 17, 11–24. [Google Scholar] [CrossRef]
  48. Labelle, E.R.; Jaeger, D. Soil Compaction Caused by Cut-to-Length Forest Operations and Possible Short-Term Natural Rehabilitation of Soil Density. Soil Sci. Soc. Am. J. 2011, 75, 2314–2329. [Google Scholar] [CrossRef] [Green Version]
  49. Jones, F.G.W.; Thomasson, A.J. Bulk Density as an Indicator of Pore Space in Soils Usable By Nematodes. Nematologica 1976, 22, 133–137. [Google Scholar]
  50. Bouwman, L.A.; Arts, W.B.M. Effects of Soil Compaction on the Relationships between Nematodes, Grass Production and Soil Physical Properties. Appl. Soil Ecol. 2000, 14, 213–222. [Google Scholar] [CrossRef]
  51. Boag, B. Effect of Soil Compaction on Migratory Plant-Parasitic Nematodes. Crop Res. 1985, 25, 63–67. [Google Scholar]
  52. Sohlenius, B. Short-Term Influence of Clear-Cutting on Abundance of Soil-Microfauna (Nematoda, Rotatoria and Tardigrada) in a Swedish Pine Forest Soil. J. Appl. Ecol. 1982, 19, 349–359. [Google Scholar] [CrossRef]
  53. Gibson, K.S.; Johnson, N.C.; Laturno, C.; Parmenter, R.R.; Antoninka, A. Abundance of Mites, but Not of Collembolans or Nematodes, Is Reduced by Restoration of a Pinus Ponderosa Forest with Thinning, Mastication, and Prescribed Fire. Trees For. People 2022, 7, 100190. [Google Scholar] [CrossRef]
  54. Okada, H.; Harada, H.; Kadota, I. Fungal-Feeding Habits of Six Nematode Isolates in the Genus Filenchus. Soil Biol. Biochem. 2005, 37, 1113–1120. [Google Scholar] [CrossRef]
  55. Qing, X.; Bert, W. Family Tylenchidae (Nematoda): An Overview and Perspectives. Org. Divers. Evol. 2019, 19, 391–408. [Google Scholar] [CrossRef]
  56. Zhao, J.; Shao, Y.; Wang, X.; Neher, D.A.; Xu, G.; Li, Z.; Fu, S. Sentinel Soil Invertebrate Taxa as Bioindicators for Forest Management Practices. Ecol. Indic. 2013, 24, 236–239. [Google Scholar] [CrossRef]
  57. Page-Dumroese, D.S.; Jurgensen, M.F.; Tiarks, A.E.; Ponder, F., Jr.; Sanchez, F.G.; Fleming, R.L.; Kranabetter, J.M.; Powers, R.F.; Stone, D.M.; Elioff, J.D.; et al. Soil Physical Property Changes at the North American Long-Term Soil Productivity Study Sites: 1 and 5 Years after Compaction. Can. J. For. Res. 2006, 36, 551–564. [Google Scholar] [CrossRef]
  58. Moghaddas, E.E.Y.; Stephens, S.L. Mechanized Fuel Treatment Effects on Soil Compaction in Sierra Nevada Mixed-Conifer Stands. For. Ecol. Manag. 2008, 255, 3098–3106. [Google Scholar] [CrossRef]
Figure 1. Location of the Cerro Seco study site within Valles Caldera National Preserve and New Mexico, USA.
Forests 14 01205 g001
Figure 2. One of three experimental feller buncher disturbance transects. Flags represent sampling points within and between the tracks (each cluster of three flags represents one sampling location). Each of the three transect blocks included three sections treated with 1, 3, and 9 passes, respectively. Samples and measurements were taken at three points per track and intertrack transect section (N = 54 sampling locations).
Forests 14 01205 g002
Figure 3. (a) Soil surface resistance to penetration as measured with a pocket penetrometer (each observation is the mean of three replicate readings). (b) Shear strength as measured by TORVANE. Open boxplots show data from between the feller buncher tracks (I = intertrack), and filled boxplots show data from the tracks (T). Pink, purple, and blue represent one, three, and nine passes, respectively. The horizontal line within each box represents the median for that treatment, and the lower and upper bounds of the box indicate the 25th and 75th percentiles. Whiskers extend to 1.5× the interquartile range (IQR) from the lower and upper box bounds. Outlier observations more extreme than 1.5× the IQR are plotted as dots.
Forests 14 01205 g003
Figure 4. Soil bulk densities (g/cm3) from four depths beneath the track and intertrack sampling locations that received 1, 3, or 9 passes (pink, blue and purple, respectively) from a feller buncher. Open boxplots show data from between the feller buncher tracks, and filled boxplots show data from the tracks. The horizontal line within each box represents the median for that treatment, and the lower and upper bounds of the box indicate the 25th and 75th percentiles, respectively. Whiskers extend to 1.5× the interquartile range from the lower and upper box bounds, and outlier observations are plotted as individual dots.
Forests 14 01205 g004
Figure 5. 
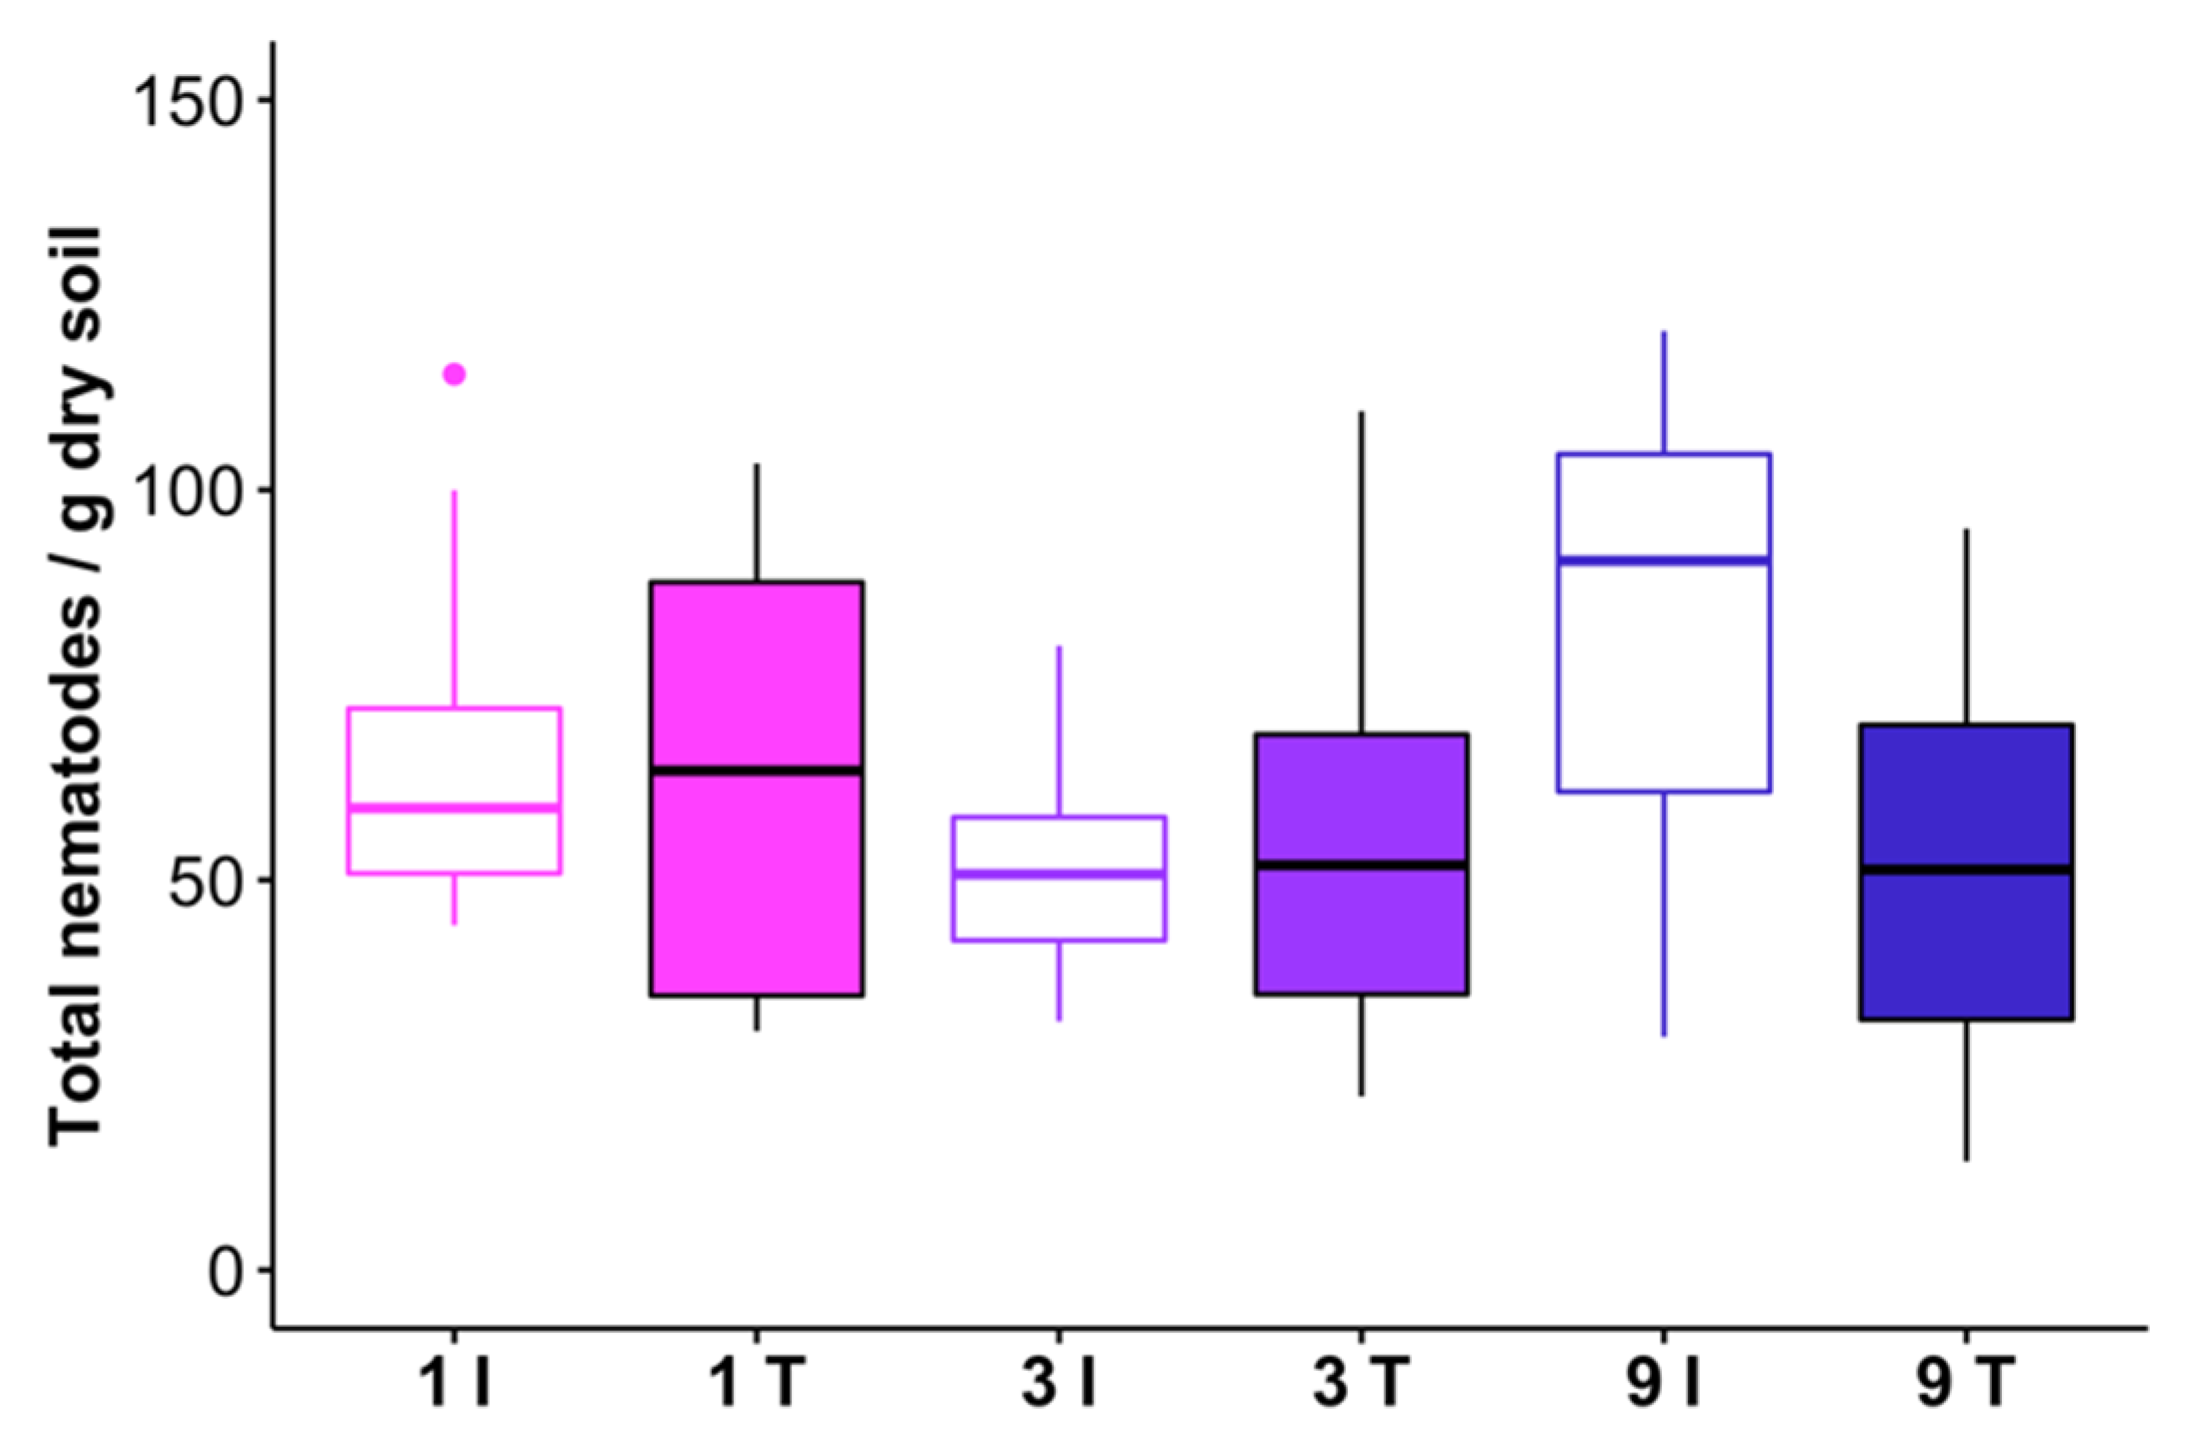
Total nematode abundances in track (T) and intertrack (I) transect areas which received 1, 3, or 9 passes from the feller buncher. One outlier observation is not shown (276 nematodes/g dry soil in a 9 pass intertrack sample). The horizontal line within each box represents the treatment median, and the lower and upper bounds of the box indicate the 25th and 75th percentiles, respectively. Whiskers extend to 1.5× the interquartile range from the lower and upper box bounds. Outlier observations are represented as dots.
Forests 14 01205 g005
Figure 6. 
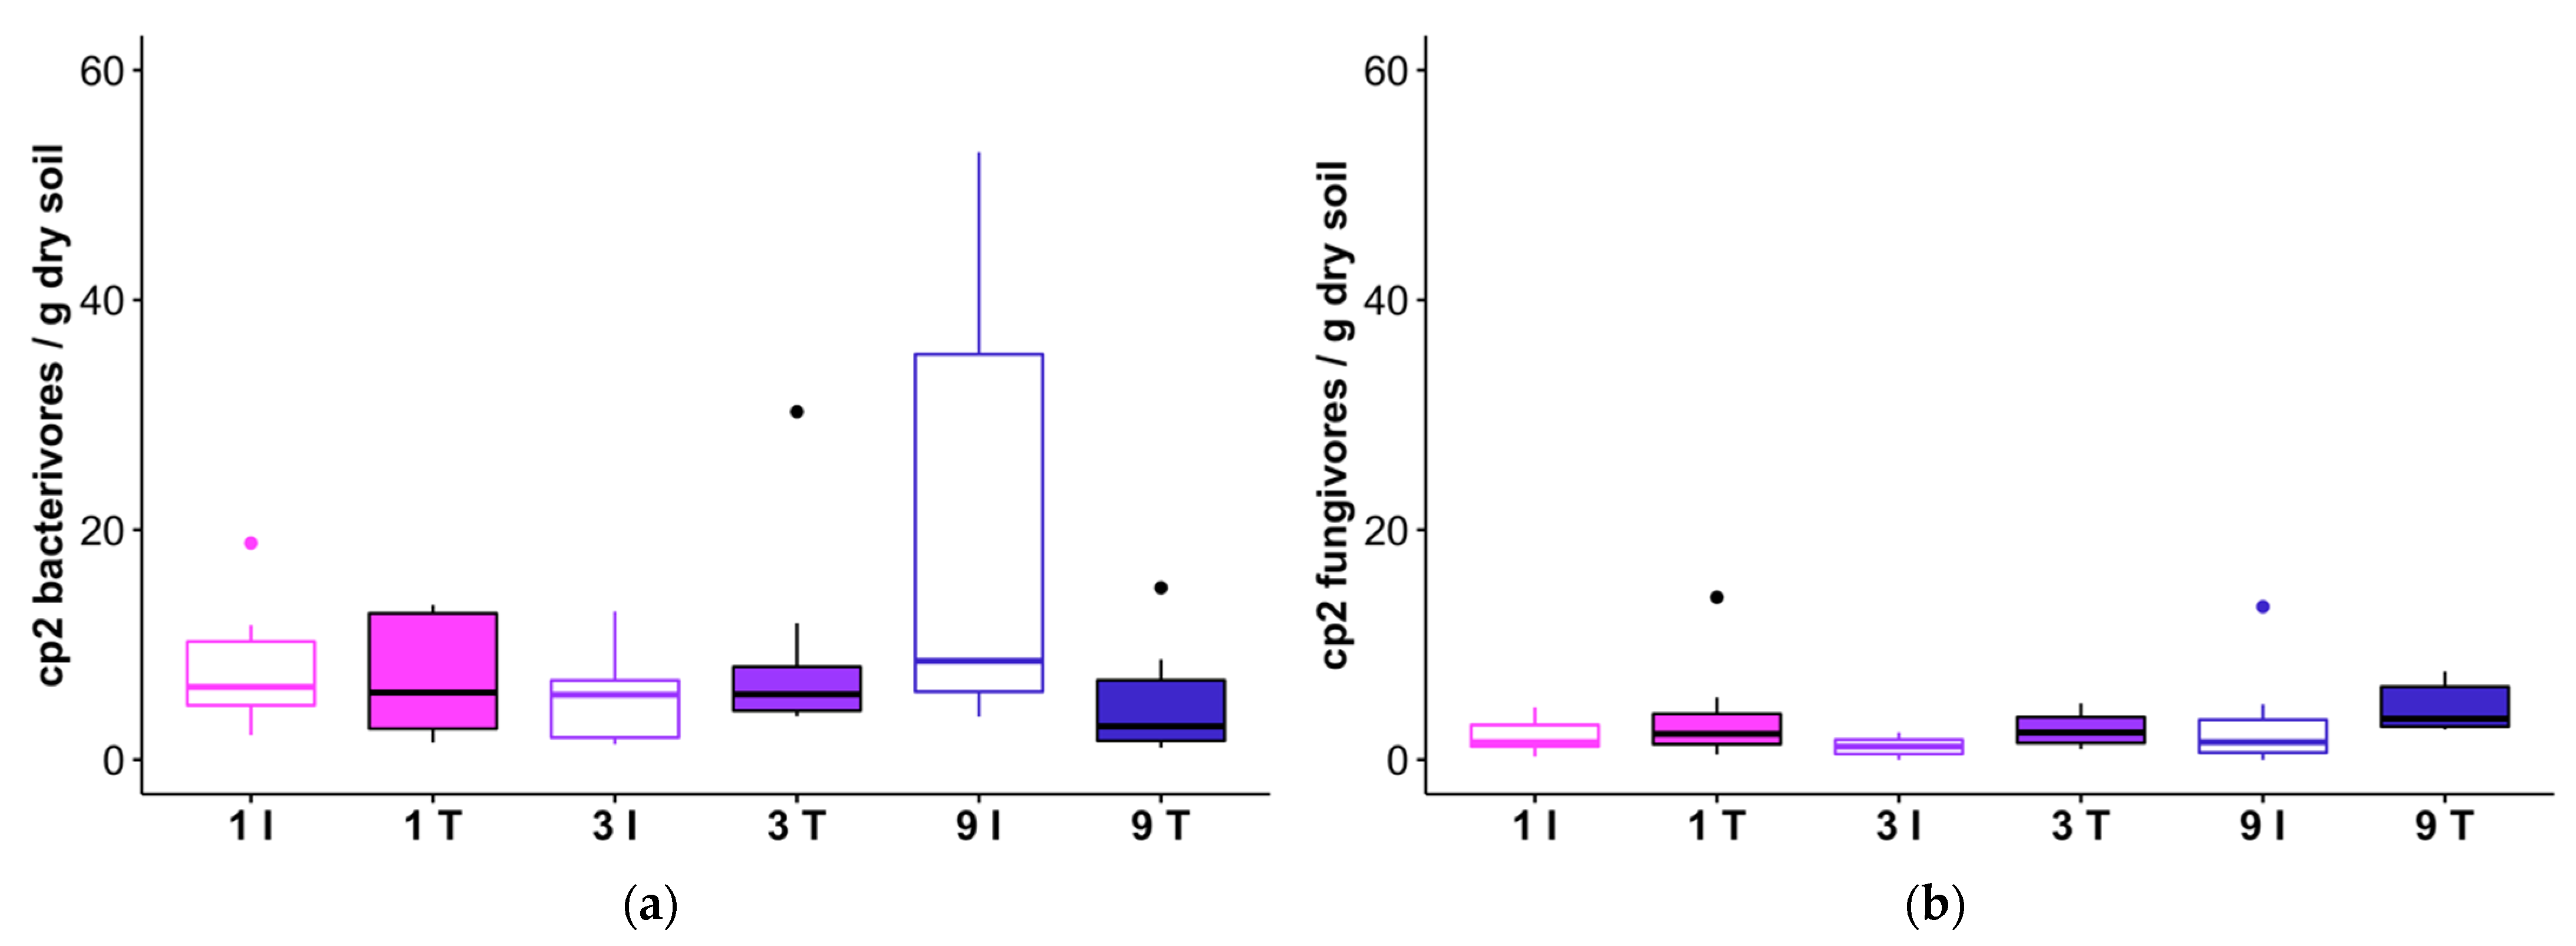
Abundances of cp2 bacterivores (a) and cp2 fungivores (b) in track (T) and intertrack (I) transect areas which received 1, 3, or 9 passes from the feller buncher. The horizontal line within each box represents the median for that treatment combination, and the 25th and 75th percentiles for each treatment combination are delineated by the lower and upper bounds of the boxes, respectively. Whiskers extend to 1.5× the interquartile range.
Forests 14 01205 g006
Figure 7. Total abundances of cp3, cp4, and cp5 nematodes in feller buncher tracks (T) that received one, three, or nine passes, and matched intertrack (I) sampling locations (a); and correlations between total cp3, cp4, and cp5 nematodes and (b) bulk density at 9–12 cm, (c) surface penetration resistance, and (d) soil shear stress. (e) Harvester disturbance treatment responses of total cp3 and cp4 bacterivores. (f) Responses of Dorylaimida to harvester traffic. The horizontal line within each box represents the median for that treatment, and the lower and upper bounds of the box indicate the 25th and 75th percentiles, respectively. Whiskers extend to 1.5× the interquartile range from the lower and upper box bounds. Outlier observations are plotted as dots.
Forests 14 01205 g007
Figure 8. Abundances of (a) herbivore nematodes and (b) nematodes in the family Tylenchidae (one observation of 174 Tylenchidae/g dry soil in a 9-intertrack treatment is not shown). The horizontal line within each box represents the median for that treatment, and the lower and upper bounds of the box indicate the 25th and 75th percentiles, respectively. Whiskers extend to 1.5× the interquartile range from the lower and upper box bounds, and outliers are plotted as dots. (
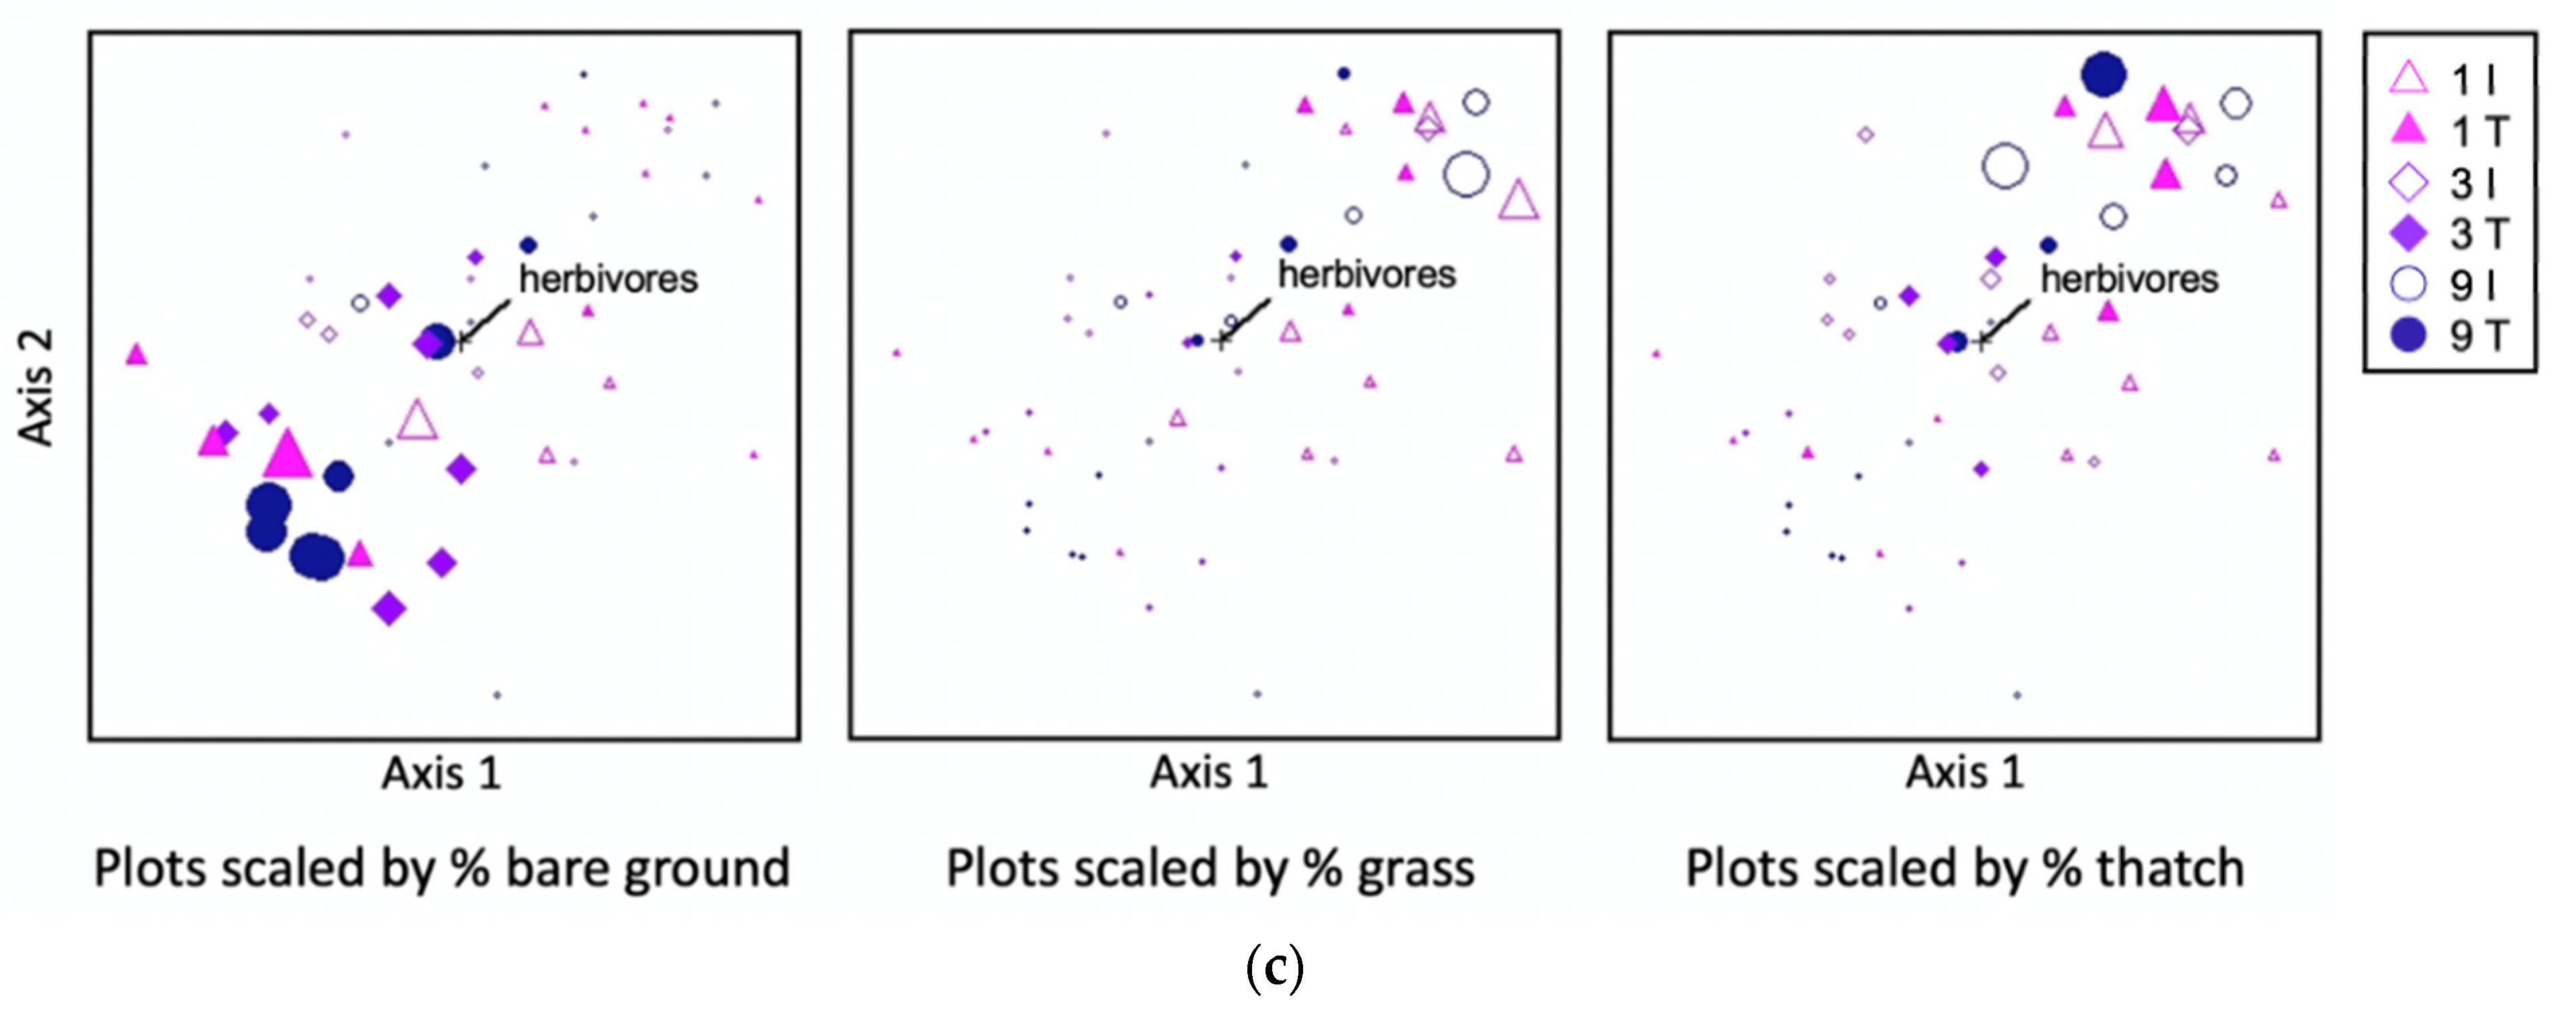
c) Non-metric multidimensional scaling (NMDS) ordination of ground cover, performed using Bray-Curtis distance, with points scaled according to percent bare ground, grass, and thatch (senesced grass) cover, respectively (larger points indicate greater cover by the category indicated below each panel; treatment means and standard errors for each cover class are listed in Table 4). Herbivore abundance is shown as a vector overlay, indicating the relationship of herbivores with plot ground cover dissimilarity along axes 1 and 2 of the three-dimensional NMDS ordination. The direction of the line away from the center point indicates the direction of the association. I = intertrack, T = track; 1, 3, and 9 refer to a number of feller buncher passes received.
Forests 14 01205 g008aForests 14 01205 g008b
Table 1. Feeding group and colonizer-persister (cp) class assignments for nematode taxa at the Cerro Seco study site in Valles Caldera National Preserve.
Feeding Group(s)cp Class(es)Taxon
Bacterivorescp1Panagrolaimidae
Rhabditidae
cp2Cephalobidae
Plectidae
cp3Monhysteridae *
Prismatolaimidae
Rhabdolaimidae
Teratocephalobidae
cp4Alaimidae
Fungivorescp2Aphelenchidae
Aphelenchoididae
Predatorscp4Mononchidae
Omnivores/predators/fungivorescp4/cp5Dorylaimida
HerbivoresNACriconematidae
Hoplolaimidae
Hemicyclophoridae
Trichodoridae
Other Tylenchoidea (apart from Tylenchidae)
Plant associatescp2Tylenchidae
* Included with cp3 bacterivores based on Fiscus and Neher’s [31] finding that Monhystera was sensitive to indirect effects of tillage (but classified as cp2 according to [32]).
Table 2. Non-parametric ANOVA-type analysis of soil penetration resistance and shear strength; ATS = ANOVA-type test statistic; df = numerator degrees of freedom; passes = number of passes applied to the transect segment (1, 3, or 9).
Penetration Resistance
dfATSp
Passes1.920.250.770
Treatment (track vs. intertrack)1.0022.54<0.001 ***
Passes × Treatment1.892.240.109
Shear Strength
dfATSp
Passes1.780.780.443
Treatment (track vs. intertrack)1.007.770.005 **
Passes × Treatment1.940.420.653
**: p ≤ 0.01, ***: p < 0.001.
Table 3. Non-parametric ANOVA-type analysis of bulk density; ATS = ANOVA-type test statistic; df = numerator degrees of freedom; passes = number of passes applied to the transect segment (1, 3, or 9).
Bulk Density
dfATSp
Passes1.991.210.298
Treatment (track vs. intertrack)1.0015.99<0.001 ***
Depth2.526.70<0.001 ***
Passes × Treatment1.932.120.122
Depth × Treatment2.623.060.033 *
Passes × Depth4.691.910.094
Passes × Treatment × Depth4.450.450.795
*: p ≤ 0.05, ***: p < 0.001.
Table 4. Litter depth, trench depth (depth of the nearest indentation formed by the feller buncher tracks), and ground cover measured in intertrack (I) and track (T) quadrats from the 1, 3, and 9 pass segments of the experimental transects. Ground cover classes are listed in descending order of their mean cover within the intertrack quadrats. Thatch = senesced grass.
1 I1 T3 I3 T9 I9 TI (Overall)T (Overall)
Mean (SE)Mean (SE)Mean (SE)Mean (SE)Mean (SE)Mean (SE)Mean (SE)Mean (SE)
Litter depth (cm)2.7 (0.8)2.7 (0.8)1.8 (0.3)1.9 (0.5)3.4 (1)1.7 (0.5)2.6 (0.4)2.1 (0.3)
Trench depth (cm)NA5.7 (0.7)NA5 (0.6)NA5.3 (0.9)NA5.3 (0.4)
Thatch (%)30.6 (7.9)26.1 (8.7)27.8 (7.2)15 (4.8)26.1 (10.7)22.8 (10.3)28.1 (4.8)21.3 (4.7)
Moss (%)2.8 (1.5)4.4 (2.6)28.3 (6)17.2 (7.7)30.6 (12)8.9 (3.4)20.6 (5)10.2 (3)
Grass (%)28.1 (7.7)10.8 (3.8)9.3 (4.9)3.1 (1.3)23 (9.6)8.3 (3.6)20.1 (4.5)7.4 (1.9)
Pine litter (%)20 (7.3)11.1 (4.6)7.2 (2.9)7.8 (3.4)8.3 (3.4)5.6 (1.8)11.9 (3)8.1 (2)
Bare ground (%)17.4 (9)30 (10.6)6.1 (2.9)45.9 (5.1)10 (7.8)55 (12.5)11.2 (4)43.6 (5.9)
Spruce litter (%)0.2 (0.2)6.1 (3.5)15.6 (5.6)8.3 (4.9)14.4 (8.8)3.3 (2.4)10.1 (3.6)5.9 (2.1)
Lichen (%)6.9 (2.4)5.7 (4.4)4.4 (1.9)5 (1.8)2.8 (1.2)1.1 (1.1)4.7 (1.1)3.9 (1.6)
Forb (%)1.4 (1.1)1.7 (1.2)3 (1.2)0.4 (0.3)2.8 (2.2)2.2 (1.2)2.4 (0.9)1.4 (0.6)
Wood mulch (%)3 (1.9)10.6 (4.5)2.8 (2.2)2.2 (1.7)1.1 (0.7)6.1 (5.5)2.3 (1)6.3 (2.4)
Sticks (%)0.6 (0.6)0.6 (0.6)3.9 (2.3)2.7 (1.2)1.7 (1.2)3.6 (1.4)2 (0.9)2.3 (0.7)
Moss litter (%)2.2 (1.5)0 (0)1.7 (1.7)5.1 (3.3)0 (0)0 (0)1.3 (0.7)1.7 (1.2)
Shrub (%)0 (0)0 (0)0 (0)0.4 (0.4)0.6 (0.6)0 (0)0.2 (0.2)0.1 (0.1)
Scat (%)0 (0)0 (0)0.2 (0.2)0.2 (0.2)0 (0)0 (0)0.1 (0.1)0.1 (0.1)
Forb litter (%)0 (0)3.3 (3.3)0 (0)1.1 (1.1)0 (0)0 (0)0 (0)1.5 (1.2)
Table 5. Multi-response permutation procedure (MRPP) results for ground cover, performed using Bray–Curtis distance. A is the chance-corrected proportion of between-sample distances explainable by the treatment group.
Ap
Overall group differences0.0927<0.001 ***
1 pass (intertrack vs. track)−0.0070.500
3 passes (intertrack vs. track)0.08980.002 **
9 passes (intertrack vs. track)0.12340.004 **
**: p ≤ 0.01, ***: p < 0.001.
Table 6. Non-parametric ANOVA-type analysis of total nematode abundance; ATS = ANOVA-type test statistic; df = numerator degrees of freedom; passes = number of passes applied to the transect segment (1, 3, or 9).
Total Nematodes
dfATSp
Passes1.970.660.513
Treatment (track vs. intertrack)1.002.040.154
Passes × Treatment1.991.930.145
Table 7. Results of non-parametric ANOVA-type analysis of cp2 bacterivore and cp2 fungivore abundances; ATS = ANOVA-type test statistic; df = numerator degrees of freedom; passes = number of passes applied to the transect segment (1, 3, or 9).
cp2 Bacterivores
dfATSp
Passes2.000.090.911
Treatment (track vs. intertrack)1.001.840.175
Passes × Treatment1.953.880.022 *
cp2 Fungivores
dfATSp
Passes1.971.770.172
Treatment (track vs. intertrack)1.0010.160.001 **
Passes × Treatment1.630.850.407
*: p ≤ 0.05, **: p ≤ 0.01.
Table 8. Non-parametric ANOVA-type analysis of total cp3, cp4, and cp5 nematodes; cp3 and cp4 bacterivores; and Dorylaimida; ATS = ANOVA-type test statistic; df = numerator degrees of freedom; passes = number of passes applied to the transect segment (1, 3, or 9).
Total cp3, cp4, and cp5 Nematodes
dfATSp
Passes1.931.490.227
Treatment (track vs. intertrack)1.003.400.065
Passes × Treatment1.923.770.025 *
cp3 and cp4 Bacterivores
dfATSp
Passes1.770.260.747
Treatment (track vs. intertrack)1.005.490.019 *
Passes × Treatment1.844.920.009 **
Dorylaimida
dfATSp
Passes2.001.990.137
Treatment (track vs. intertrack)1.003.210.073
Passes × Treatment1.843.930.023 *
*: p ≤ 0.05, **: p ≤ 0.01.
Table 9. Non-parametric ANOVA-type analysis of herbivore nematodes and nematodes in the family Tylenchidae. ATS = ANOVA-type test statistic; df = numerator degrees of freedom; passes = number of passes applied to the transect segment (1, 3, or 9).
Herbivores
dfATSp
Passes1.802.650.077
Treatment (track vs. intertrack)1.000.600.439
Passes × Treatment1.631.010.353
Tylenchidae
dfATSp
Passes1.980.250.779
Treatment (track vs. intertrack)1.002.170.141
Passes × Treatment1.690.450.606
Disclaimer/Publisher’s Note: The statements, opinions and data contained in all publications are solely those of the individual author(s) and contributor(s) and not of MDPI and/or the editor(s). MDPI and/or the editor(s) disclaim responsibility for any injury to people or property resulting from any ideas, methods, instructions or products referred to in the content.

