Article

Automated Segmentation of Individual Tree Structures Using Deep Learning over LiDAR Point Cloud Data

1
Department of Forest Ecology and Protection, Kyungpook National University, Sangju 37224, Republic of Korea
2
Forest ICT Research Center, National Institute of Forest Science, Seoul 02455, Republic of Korea
3
Department of Software, Kyungpook National University, Sangju 37224, Republic of Korea
*
Authors to whom correspondence should be addressed.
Forests 2023, 14(6), 1159; https://doi.org/10.3390/f14061159
Submission received: 3 April 2023 / Revised: 18 May 2023 / Accepted: 2 June 2023 / Published: 5 June 2023
(This article belongs to the Section Forest Inventory, Modeling and Remote Sensing)

Abstract

:
Deep learning techniques have been widely applied to classify tree species and segment tree structures. However, most recent studies have focused on the canopy and trunk segmentation, neglecting the branch segmentation. In this study, we proposed a new approach involving the use of the PointNet++ model for segmenting the canopy, trunk, and branches of trees. We introduced a preprocessing method for training LiDAR point cloud data specific to trees and identified an optimal learning environment for the PointNet++ model. We created two learning environments with varying numbers of representative points (between 2048 and 8192) for the PointNet++ model. To validate the performance of our approach, we empirically evaluated the model using LiDAR point cloud data obtained from 435 tree samples scanned by terrestrial LiDAR. These tree samples comprised Korean red pine, Korean pine, and Japanese larch species. When segmenting the canopy, trunk, and branches using the PointNet++ model, we found that resampling 25,000–30,000 points was suitable. The best performance was achieved when the number of representative points was set to 4096.

1. Introduction

Reducing carbon emissions is important for mitigating the risk of climate change. One effective method to achieve this is through the appropriate management of forests, which act as carbon sinks. This process requires accurate data regarding forest resources, which can be obtained using remote-sensing technology and field surveys. Above-ground biomass (AGB) can be measured using destructive methods, such as cutting and weighing the plant material, whereas understory ground biomass is estimated using allometry equations. The allometry equation refers to the method of estimating biomass by applying the taper equation using the true biomass of a single tree, which is calculated using the fresh and dry weights of the trunk, branches, and leaves measured through field surveys. However, these methods require a considerable amount of labor and can be dangerous to workers. With the advancement in remote-sensing technology, estimating biomass in a nondestructive manner has become possible [1,2,3,4,5,6,7,8,9,10]. This method is less labor-intensive and reduces the risk of injury to workers.
The structure of the trees needs to be segmented first. The trunk is used to estimate the wood volume, and the branch is utilized to calculate the amount of the fuel and biomass in forest fires [5,11,12]. However, the degree of difficulty in dividing tree structures can vary depending on the tree species and stand structure. The biomass estimation from commonly used satellite imagery is affected by low spatial and spectral resolutions, making data acquisition of the trunk portion difficult. Recently, Light Detection and Ranging (LiDAR) systems have been used to overcome this limitation. LiDAR systems can be classified into three types based on their platform: ground-based, aerial, and portable type. Airborne LiDAR can collect highly detailed information about the lower canopy and ground, but the level of detail obtained depends on the forest’s structure and the density of the laser beam emitted. Terrestrial LiDAR systems can also cause occlusion, but this can be solved using a multiscan method. Therefore, researchers have attempted to segment the canopy, trunk, and branches using terrestrial LiDAR systems [13,14,15,16].
To perform this process, understanding the geometric features of different dimensions from the point cloud and determining the patterns are necessary. Machine-learning techniques, which have been developed alongside computer-vision technology, offer great potential to find the patterns from the available data and to classify and segment the data [17,18]. However, the segmentation results may vary depending on the classifier and the calculation methods used by the researchers. Therefore, finding the optimal learning environment for the classifier is important.
Various studies have been conducted using deep-learning techniques to classify tree species or segment tree structures [19,20,21]. However, these studies only focused on the segmentation of the canopy and trunk, and they did not consider branch segmentation. Additionally, although the performance of the deep-learning models was compared, no comparison in terms of the accuracy was made according to the learning environment of the model, such as the hyperparameter adjustment. Recently, the k-means and RANSAC algorithms have been used to distinguish between leaves and wood [22]. Users are required to define the values of the parameters used in these algorithms, such as the k value for k-means, the number of iterations, and the inlier ratio for RANSAC. Therefore, the range of parameters should be carefully determined by considering the species and conditions of the trees. These issues can be resolved using deep learning. Therefore, this study aimed to verify the performance of the PointNet++ model by adjusting its learning environment based on the data acquired from terrestrial LiDAR for automatic segmentation of the canopy, trunk, and branches.
The primary contributions of this study are as follows:
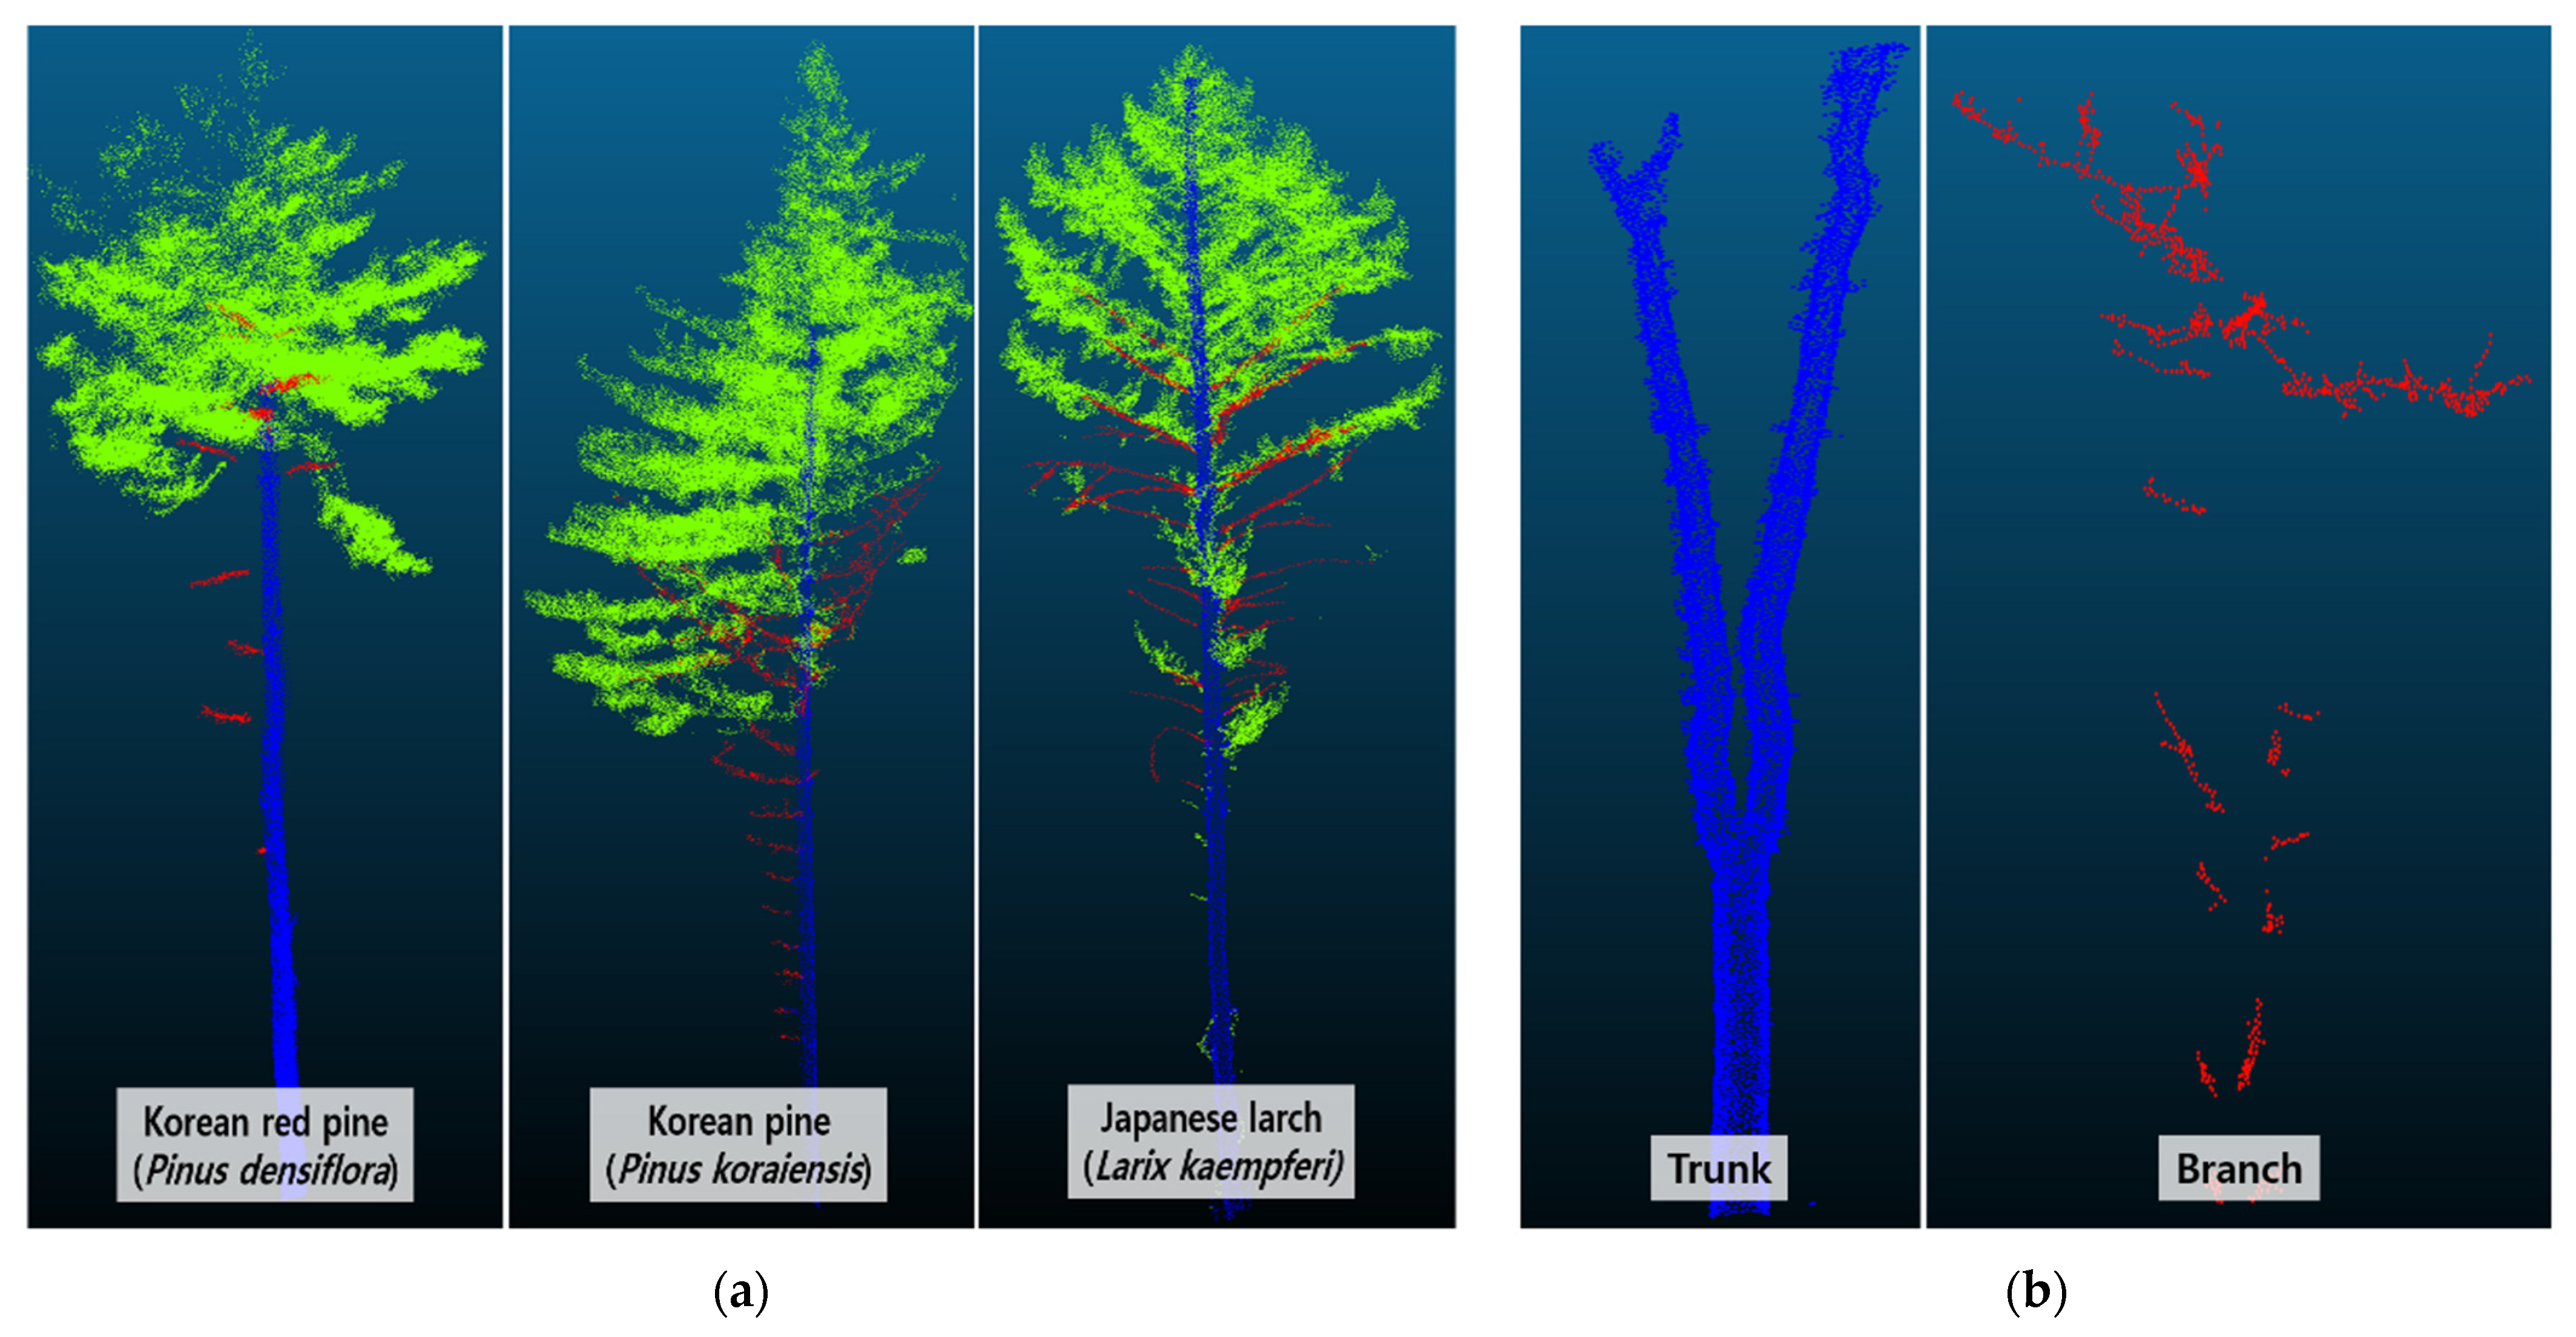
  • We proposed a new approach that leveraged PointNet++ for segmenting the canopy, trunk, and branches of trees. By applying PointNet++, we addressed the limitations of previous studies that have primarily focused on canopy and trunk segmentation, neglecting branch segmentation.
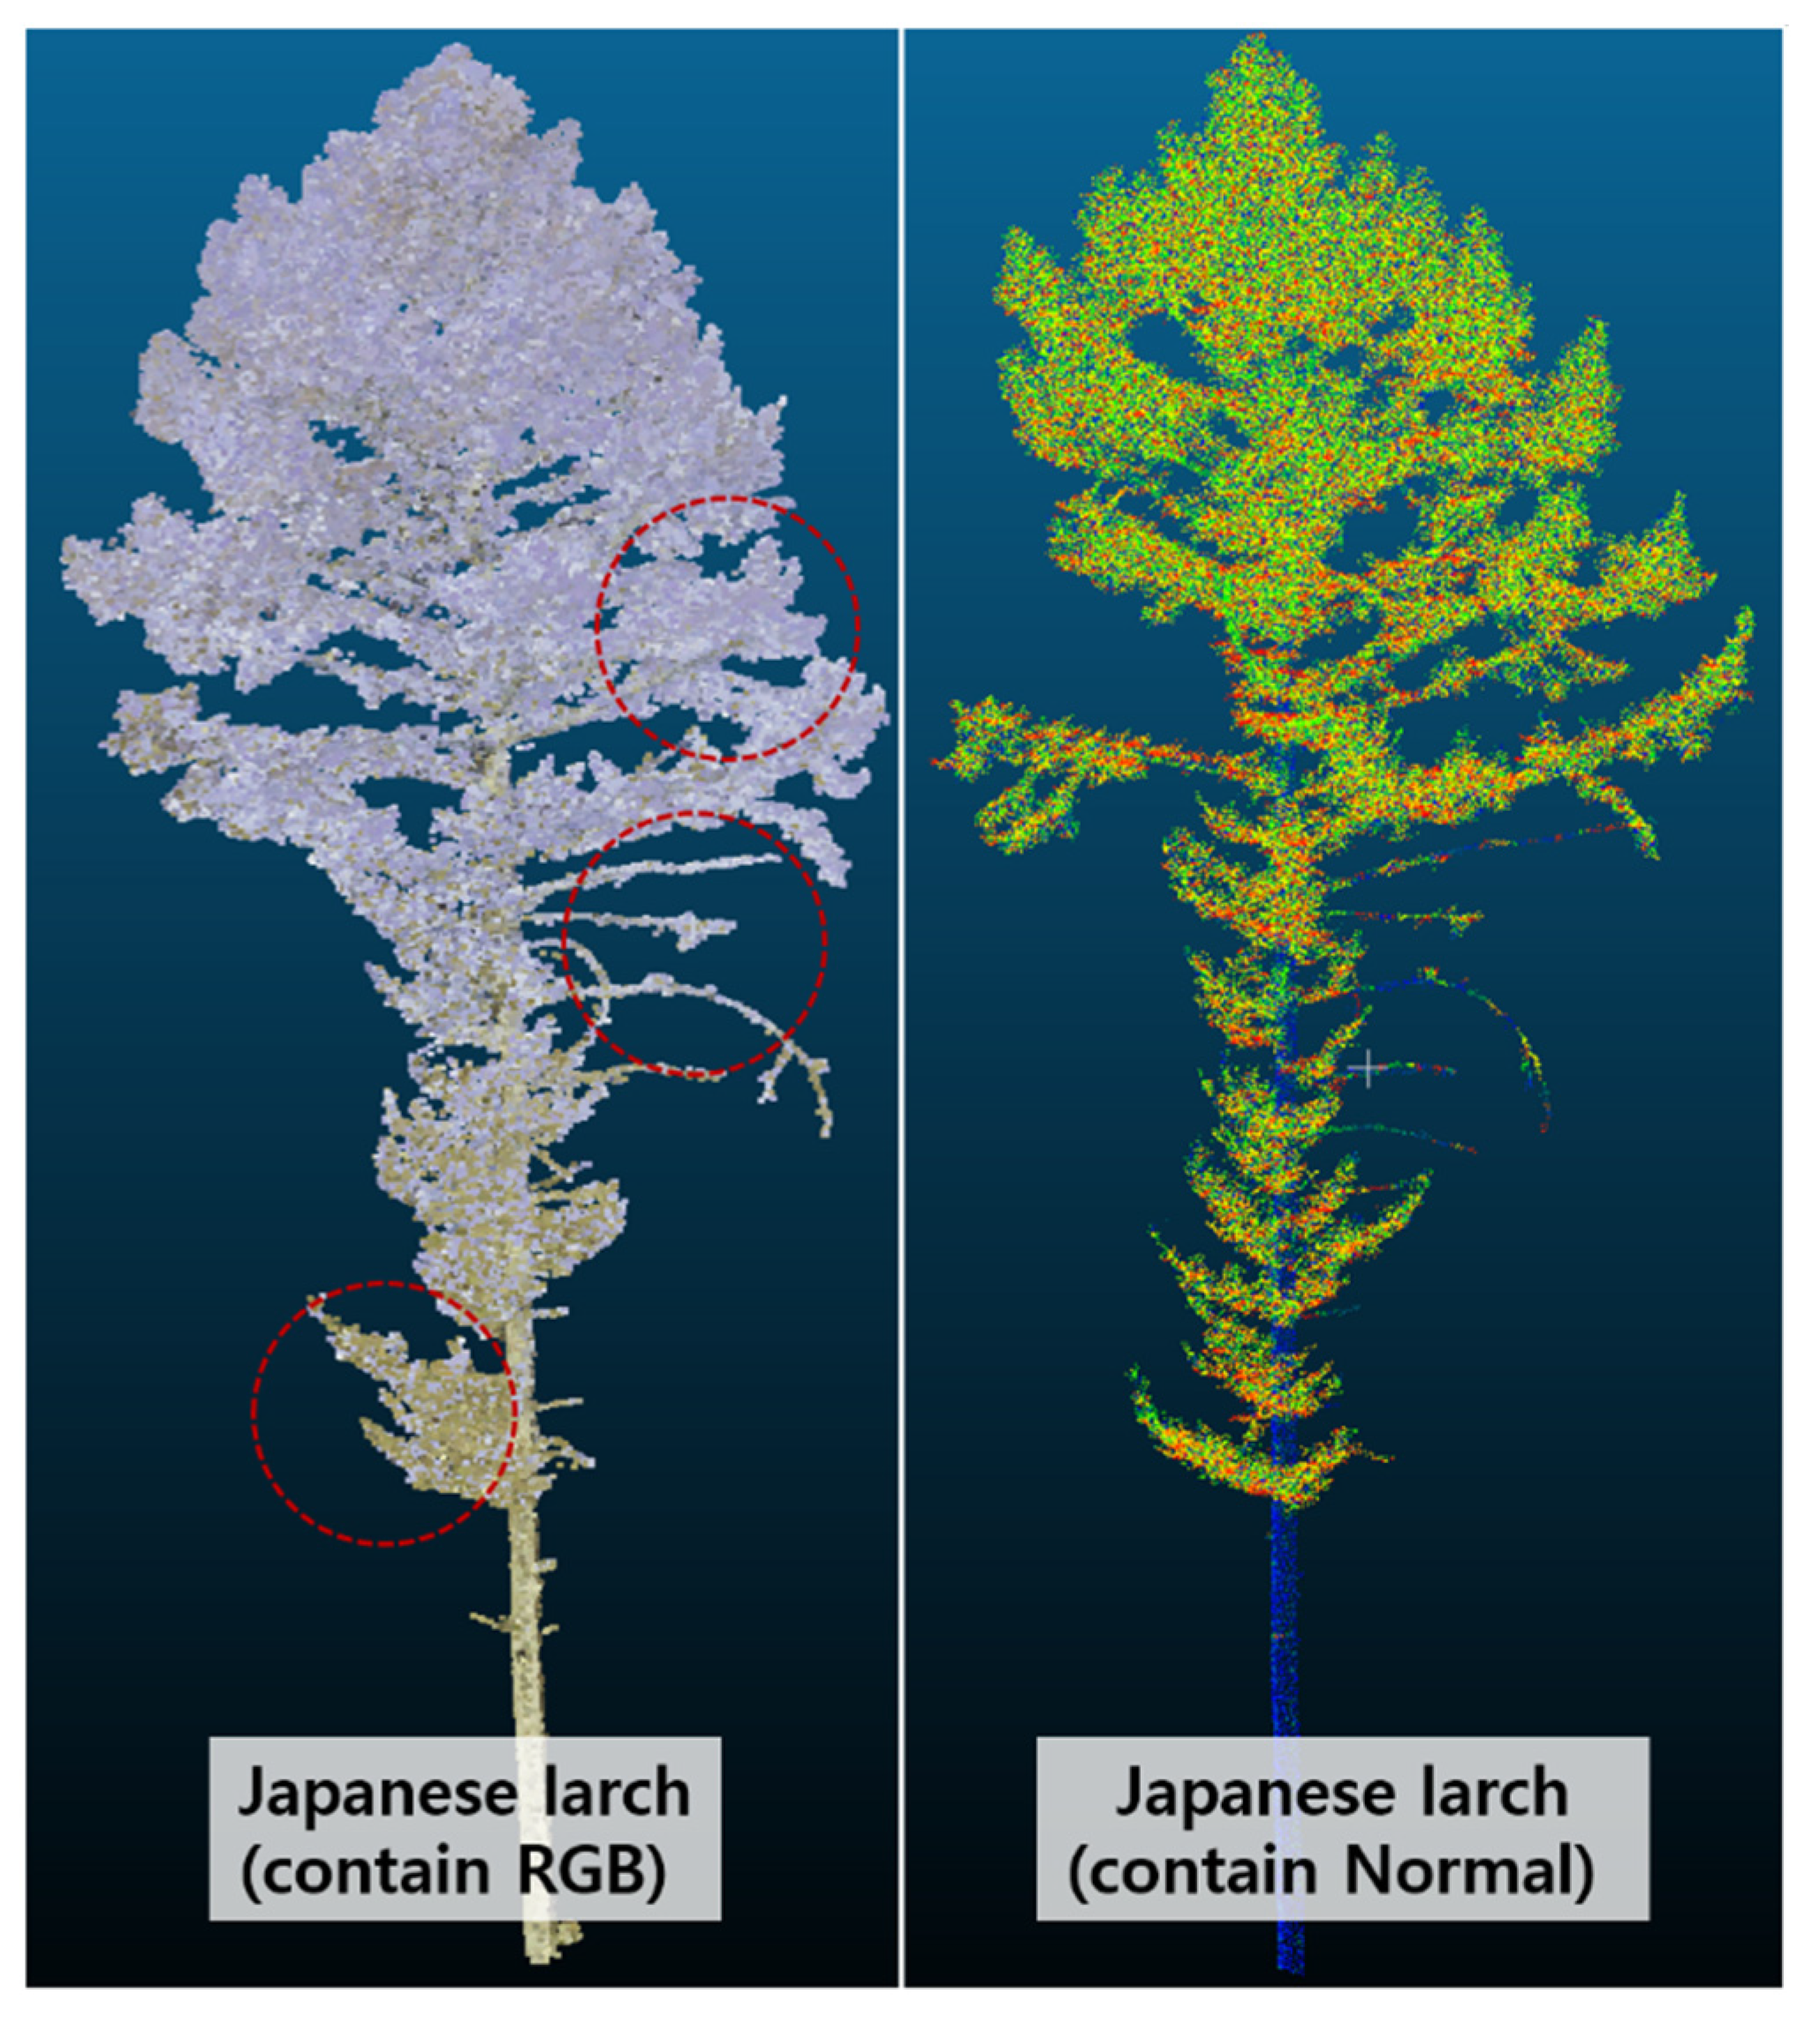
  • We introduced a preprocessing method for LiDAR point cloud data, which was tailored to handle the characteristics of tree-related LiDAR data, leading to improved accuracy in the segmentation results.
  • We identified an optimal learning environment for PointNet++ in the context of tree-structure segmentation. We achieved superior segmentation results and enhanced the overall effectiveness of the PointNet++ model.
This paper is structured as follows: Section 2 describes previous research. Section 3 outlines the data acquisition, preparation, and model performance verification methods. Section 4 explains the model segmentation accuracy according to the learning environment, and Section 5 provides the discussion. Finally, Section 6 presents the conclusion.

2. Related Work

Machine-learning approaches can be categorized as supervised, which involves using labeled data to train a model, or unsupervised, where the system groups data into similar clusters [23,24,25,26,27,28,29,30,31]. Each of these methods uses different techniques and approaches to segment the point cloud data (Table 1).
The graph-based method creates nodes using density-based spatial clustering of applications with noise (DBSCAN), mean shift, and K-mean clustering methods, and subsequently divides the canopy and trunk by arranging them in a topological network using the shortest path algorithm. One advantage of this method is that it is relatively easy to implement; however, it suffers from several limitations. When many nodes exist, the computational burden increases, and small branches may be misclassified as the trunk and canopy. Additionally, the structural differences among species can act as a limiting factor in selecting the parameters for the clustering process.
In the point cloud obtained from LiDAR, the canopy possesses a strong dispersive property, whereas the stem mainly has a linear or surface vector property. The branches possess attributes of both the canopy and trunk. These differences can be distinguished using a geometrical feature basis. Among the geometric feature-based methods, classification-performance verification studies have been conducted on random forests, Gaussian mixture models, and support vector machines [32]; furthermore, 3D convolutional neural networks (CNNs), such as the PointNet and PointNet++ models are being reviewed [33]. The supervised learning method requires preprocessing of training data and sophisticated labeling. Hence, the model performance may vary, but adjusting the parameters according to the structural differences based on the species is not necessary. To improve the performance of tree-structure segmentation using the geometric feature method, research on preprocessing of the learning data, learning environments, and classifier selections is required.
During the preprocessing stage of the training data, various characteristics of the point cloud such as red, green, and blue (RGB), intensity, surface normal, and scattering can be added to the x, y, and z values of the point cloud to enhance the segmentation of the tree structure. The canopy, which is rich in chlorophyll, appears green, whereas the trunk appears brown due to the presence of lignin. These contrasting features provide classifiers with clear information for segmenting the canopy and trunk. However, we need to note that the availability of the RGB information is dependent on the employed LiDAR equipment, and it may not be available for all parts due to occlusion. Combining information such as linear and surface vectors with geometric features can improve the segmentation performance [33,36].
However, most prior research has focused on mentioning the accuracy of the adopted algorithms or comparing the performance (accuracy, precision, recall, and F1 score) of different models. For deep learning models, providing quantitative evaluations of the preprocessing effect of the training data and adjusting the training environment on the performance of the model are particularly important.

3. Materials and Methods

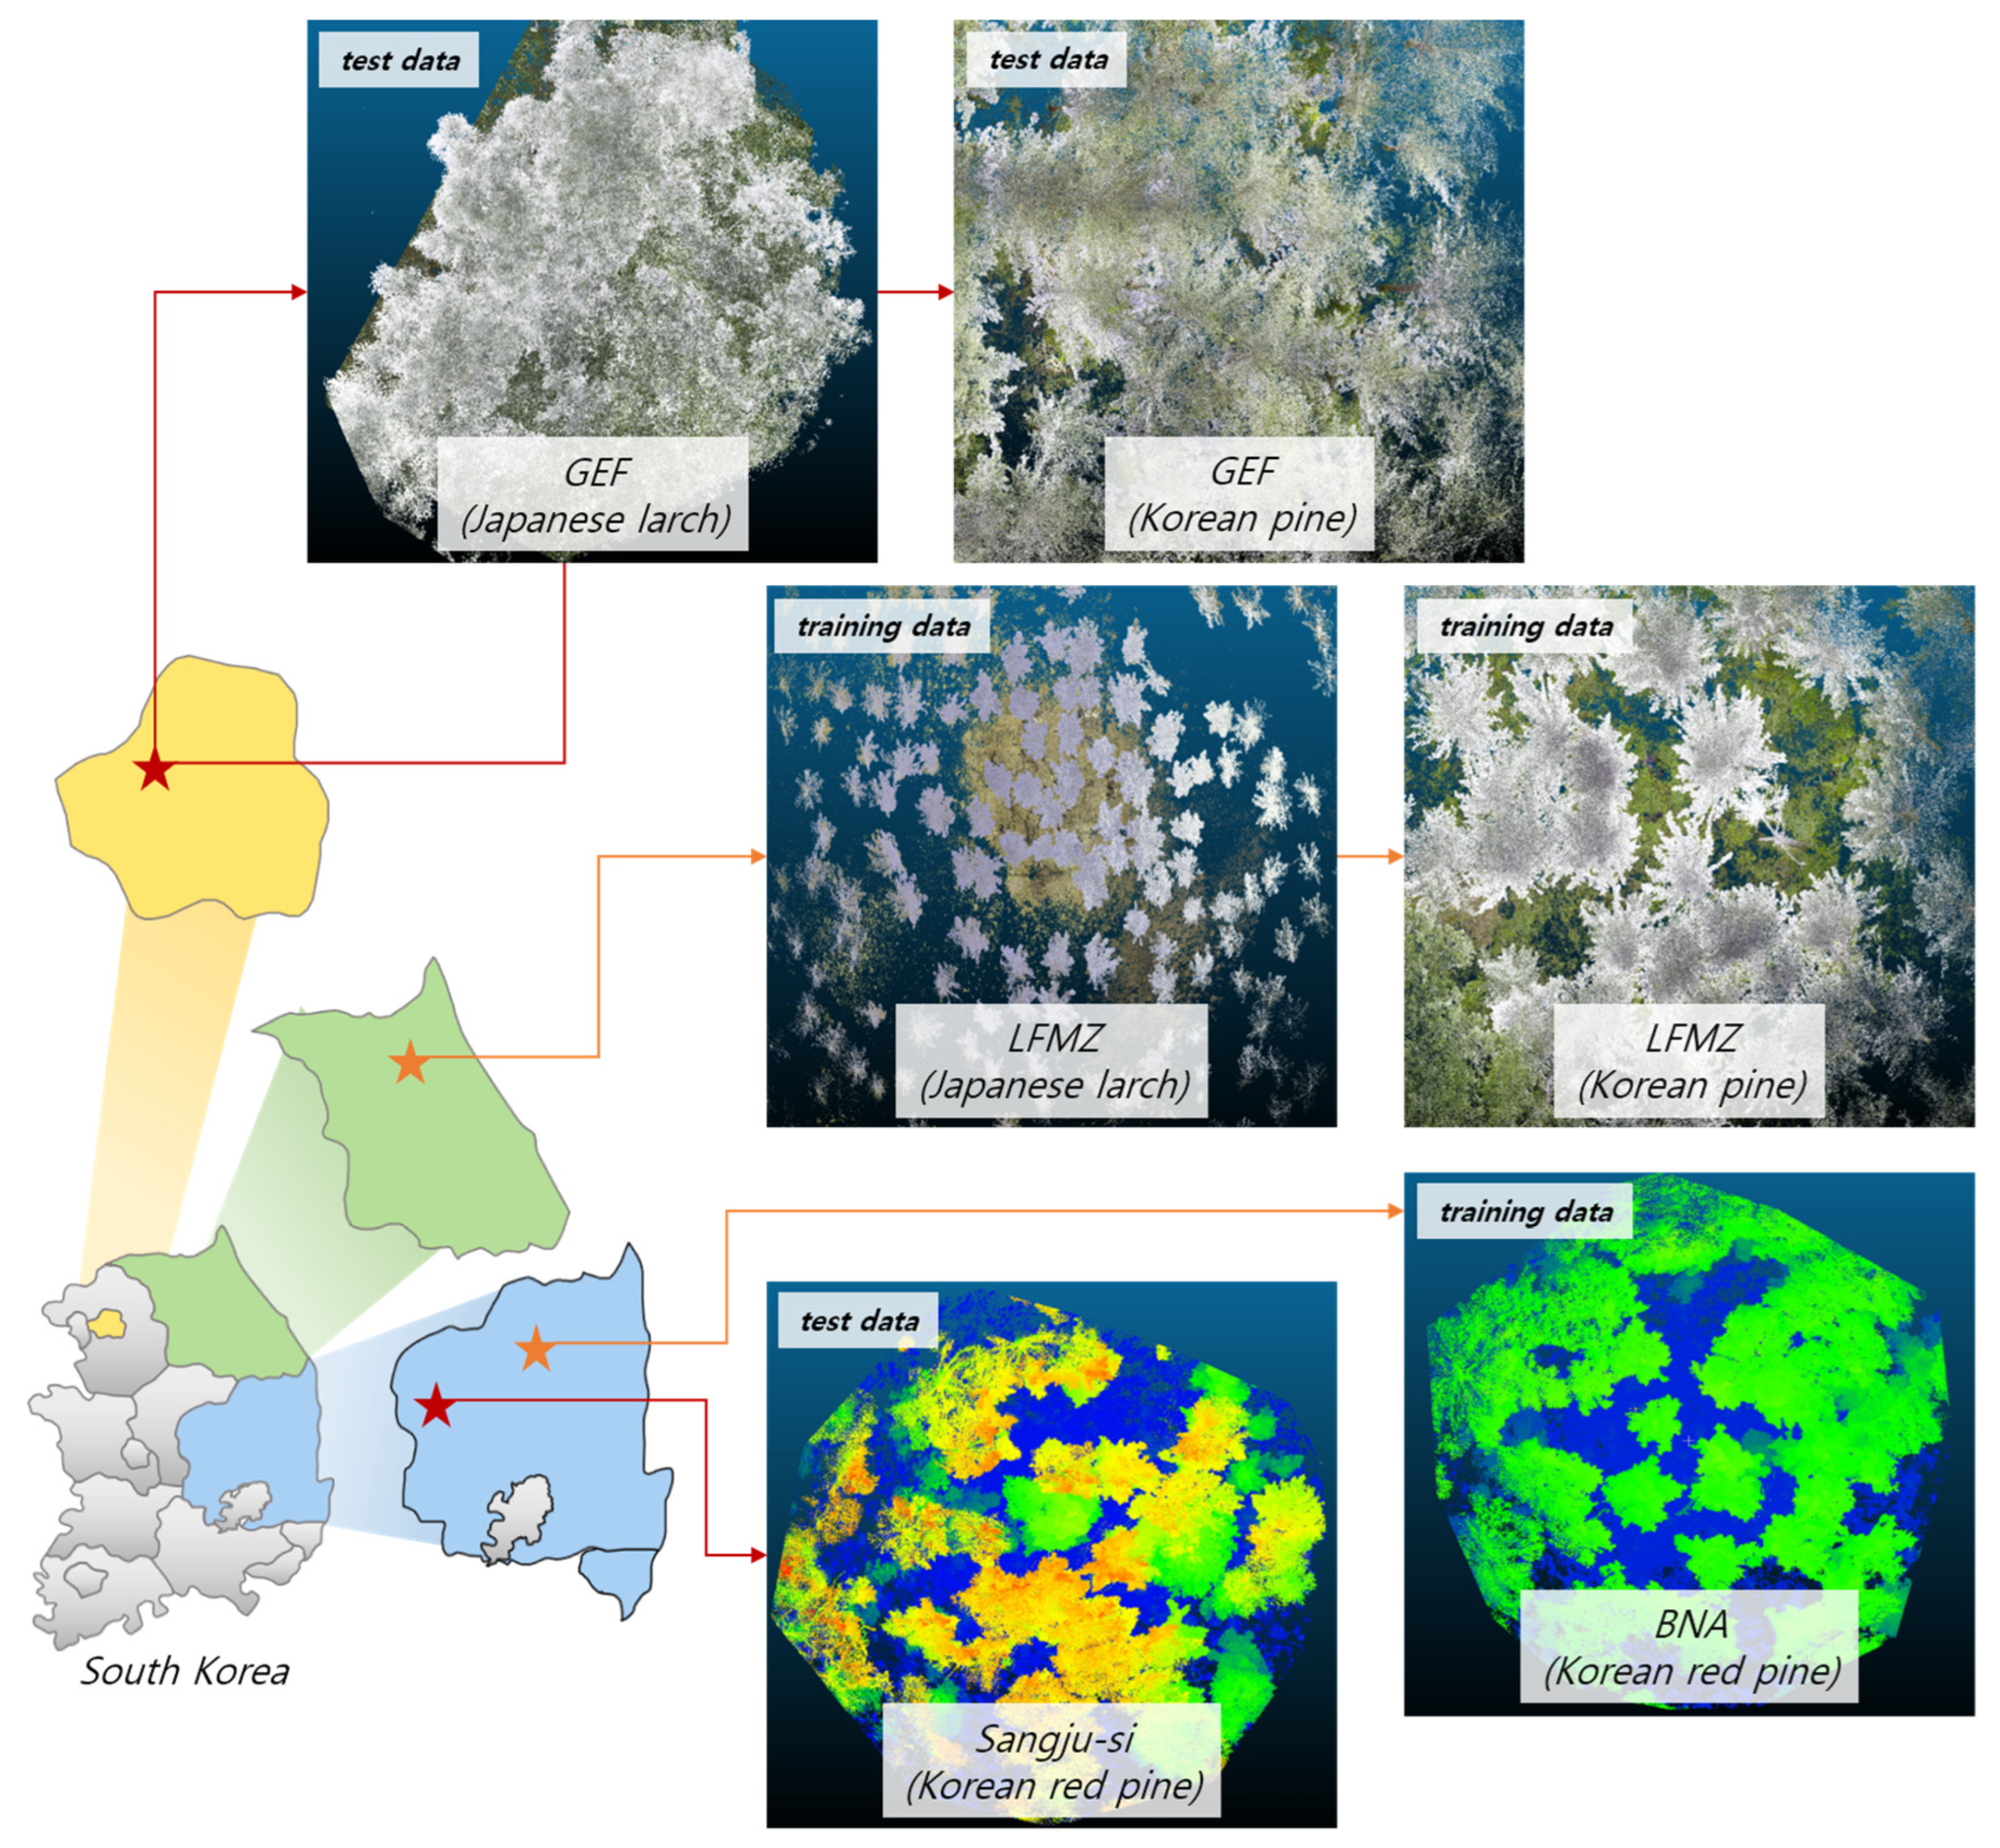
3.1. Data Preparation

The data used for learning and verification were collected from the Korean red pine (Pinus densiflora), which is an artificial forest located in the Backdudaegan National Arboretum (BNA) in Bonghwa-gun, Gyeongsangbuk-do, and from the Korean pine (Pinus koraiensis) and Japanese larch (Larix kaempferi), which are artificial forests in the Leading Forest Management Zone (LFMZ) in Chuncheon-si and Hongcheon-gun, Gangwon-do, respectively.
The data used in the test were obtained from the Korean red pine artificial forest located in Sangju-si, Gyeongsangbuk-do (Sangju Experimental Forest (SEF)) and the Korean pine and Japanese larch artificial forest located in the Gwangneung Experimental Forest, Namyangju-si, Gyeonggi-do (shown in Figure 1 and Table 2).
The plot was scanned onceusing a backpack laser scanner (BLS) (Libackpack D50, Greenvalley International, Berkeley, California, USA) and 18 times using a terrestrial laser scanner (TLS) (Leica RTC 360, Leica, Wetzlar, Hesse, Germany). To prevent data loss due to occlusion, the BLS data collection method involves passing through all individual trees. Conversely, the TLS data collection method selects a survey method based on the international benchmarking [37].
The scan data, which were taken multiple times, were combined into one scan data using the Leica Cyclone REGISTER 360. Despite the precautions taken, some occlusions remained in the data that were collected using the BLS and TLS methods. Incomplete data can lead to mis-segmentation as reported in studies such as [38,39]. However, they may inevitably exist depending on the LiDAR data collection method and equipment performance. Therefore, all the data, including incomplete ones, were included in the training data for a rigorous test of part segmentation of PointNet++ at https://github.com/yanx27/Pointnet_Pointnet2_pytorch (accessed on 4 June 2023).
As shown in Figure 2, all scanned data underwent the following preprocessing steps. Down-sampling was performed to a 5 cm point resolution using Poisson sampling provided by the Point Data Abstraction Library (PDAL-2.5.2 version) (Figure 2a). (1) The ground was flattened and removed (Figure 2b). (2) Understory vegetation in the forest can affect the training, verification, and testing process. Therefore, the trunk and canopy regions were first separated using PDAL to remove the understory vegetation. The trunk region was divided based on the understory vegetation with the highest height in the plot without any special criteria. In the present study, most of the understory vegetation was in between 3.5 and 4.3 m high; thus, the trunk was set to 0–4.8 m, and the canopy was set to 4.5–100 m and cut down (Figure 2c). The TreeSeg [40] application was used to remove the understory vegetation and extract the trunk from the cut-trunk region [41]. The TreeSeg application used Euclidean clustering to organize the unorganized point cloud and then separated the trunk and understory vegetation using region-based segmentation. (3) Next, the separation was performed by matching the cylinder shape using the random sample consensus and least median of square algorithms to extract only the trunk (Figure 2d). (4) Finally, the trunk and canopy regions were merged using PDAL to obtain clean data without understory vegetation (Figure 2e).
The canopy, trunk, and branch were manually labeled using the CloudCompare program from preprocessed data from 435 trees (Table 3).
Out of the 435 trees, 306 were used as learning data (102 Korean red pine, 102 Korean pine, and 102 Japanese larch), 72 as verification data (24 Korean red pine, 24 Korean pine, and 24 Japanese larch), and 57 as test data (19 Korean red pine, 19 Korean pine, and 19 Japanese larch). The canopy (green), trunk (blue), and branches (red) were labeled in individual tree data (Figure 3a). The labeling was performed by manually selecting the areas corresponding to the canopy, trunk, and branches using the editing tools supported by the CloudCompare program, which allows for mouse-based interaction. In the case of Korean red pine, the region of the branches and canopy was clearly distinguished, but distinguishing between the Korean pine and Japanese larch was difficult. Therefore, structural analysis and labeling of each tree required 7 days. Due to the tree growth process, distinguishing between the trunks and branches are challenging when offshoots are present. To segment them, the direction of the vector was used. Points that were formed in the z direction were segmented as trunks, whereas those in the x and y directions were segmented as branches. To accurately segment the branches, a detailed segmentation process was necessary because the branches were connected to the canopy. Although efforts were made to segment only the branches, instances may have occurred where points segmented as branches were also included as parts of the canopy because of practical limitations (Figure 3b).
This limitation was particularly noticeable in the Korean pine and Japanese larch, causing different numbers of the branch classes for each tree species. The final segmented training data included 306 canopies, 306 trunks, and 270 branches. The training, validation, and test data also included a similar number of each class with an average of 2,176,282 points for the canopies, 448,644 points for the trunks, and 68,094 points for the branches.

3.2. Experiment Environment

To segment the tree parts, we utilized PointNet++ [42], which achieves a high level of intersection over union (IoU) of 93.2 in the 3D part segmentation taxon of the state of the art. In the part segmentation of the canopy, stem, and branch classes, we did not use the RGB information because some LiDAR equipment does not support RGB and the colors of the canopy, trunk, and branches collected in this study were not clearly distinguished. Specifically, in the case of the Japanese larch, the branches had the same color as the canopy. Therefore, color was excluded from the learning factor. Only each point (x, y, and z), its surface normal vector (x, y, and z), and label values were used (Figure 4).
To find the optimal values that could accurately divide the three classes (canopy, trunk, and branch), we modified and learned the different hyperparameters (Table 4).
The basic architecture of PointNet++ extracted 1024 local and global features per sample. In addition to the correlation between the batch size and learning rate, the classification and segmentation accuracies were affected by the number of feature points extracted in the sampling layer and density-adaptive layer stages [43,44].
Therefore, the model was trained under two different conditions:
  • The input data were classified into resampled (canopy, trunk = 10,000 points and branch = 2500, 10,000 points) and non-resampled.
  • The learning environment was adjusted by extracting 2048, 4096, and 8196 local and global features at the sampling-layer stage. Setups 1–3 were used for non-resampling as the learning material, whereas Setups 4–6 were used for resampling as a learning environment.
Furthermore, the ball-tree method was used for grouping the feature points instead of the Euclidean method in which the radius value was set at 0.05 m. Successful detection was considered when the point cloud and ground-truth point cloud detected by the canopy, trunk, and branch contained IoU values of 50% or more. All training, validation, and testing were performed on a desktop equipped with an Intel i9-9900K CPU, 128 GB DDR4 RAM, and 12 GB RTX 3080ti GPU. The training took 10 days (Setup 4: 1 day, Setups 1 and 5: 2 days, Setups 2 and 6: 3 days; and Setup 3: 5 days).

3.3. Evaluation of the Model Performance

The performance of the PointNet++ model was evaluated using precision, recall, and F1 scores after the learning process was completed. The calculations were made using Equations (1)–(4), and the results were obtained by calculating the true positives (TPs), true negatives (TNs), false positives (FPs), and false negatives (FNs) using a confusion matrix.
A c c u r a c y = T P + T N T P + T N + F P + F N
P r e c i s i o n = T P T P + F P
R e c a l l = T P T P + F N
F 1   s c o r e = 2 × p r e c i s i o n × r e c a l l p r e c i s i o n + r e c a l l

4. Statistical and Empirical Analysis of Model Performance

4.1. Experiment A

The results of the class division based on the number of representative points (2048, 4096, and 8192) are listed in Table 5.
The results of the class division of the Korean red pine, Korean pine, and Japanese larch based on the number of representative points (2048, 4096, and 8192) were as follows:
  • For the Korean red pine, precision was the highest for 8192 representative points (86.0%), recall was the highest for 2048 representative points (70.6%), and the best F1 score was achieved for 2048 representative points (0.7), indicating that the segmentation of the Korean red pine without resampling performed well at these numbers of representative points.
  • The Korean pine also performed well for 2048 representative points with an F1 score of 0.7.
  • The Japanese larch had a lower F1 score of 0.5 in all conditions, which was lower than that of the Korean red pine and Korean pine.
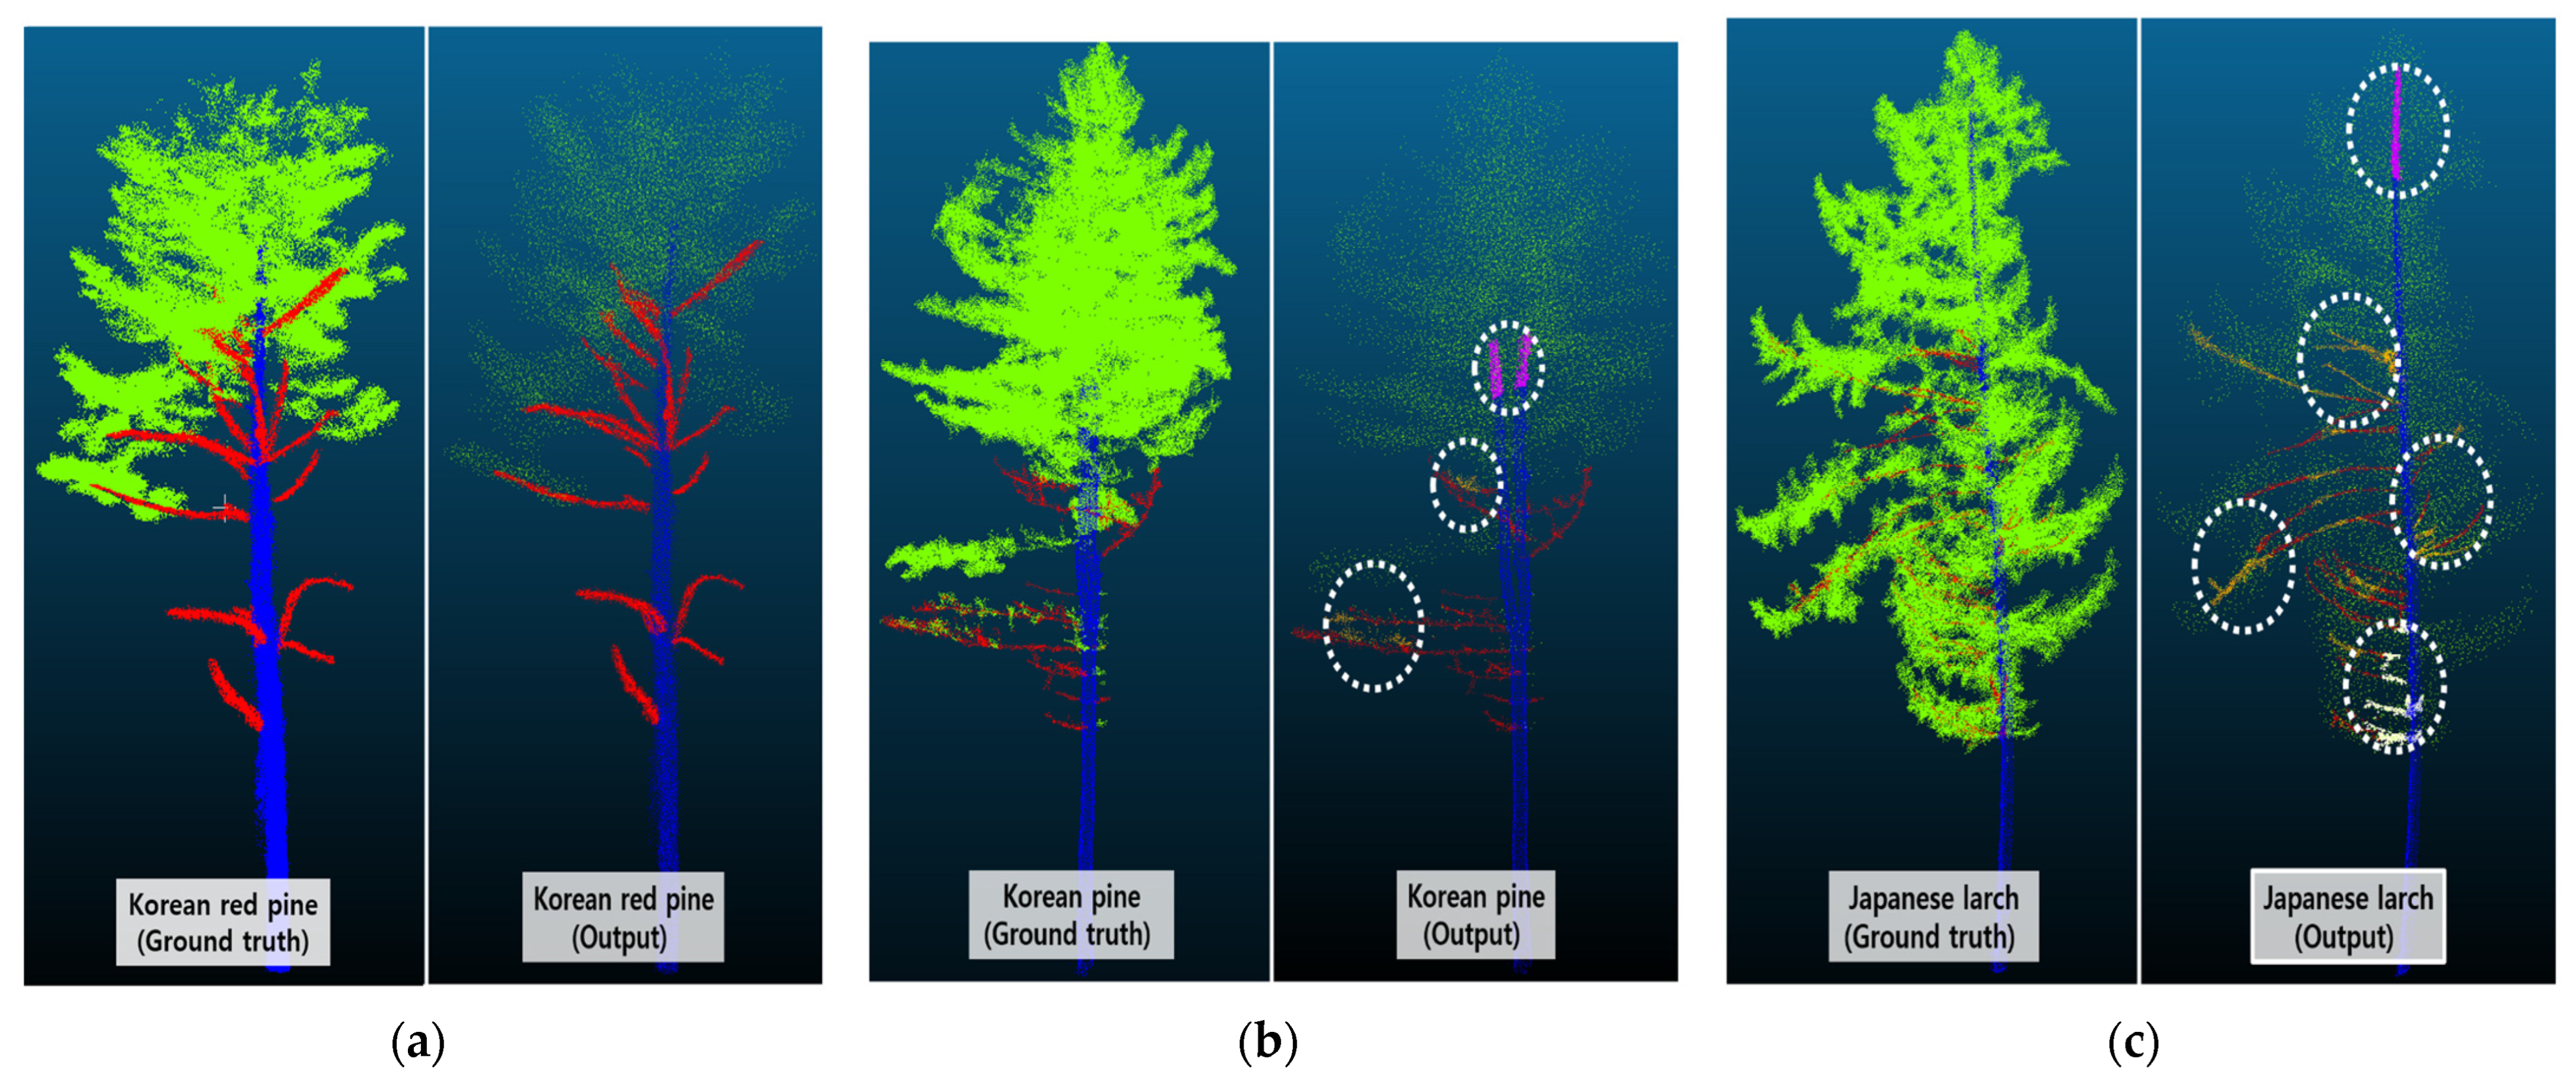
The model performance results by class for 2048 representative points were as follows (Table 6).
The results of the segmentation of the canopy and trunk of the tree species (Korean red pine, Korean pine, and Japanese larch) showed a high average F1 score of 0.85, but the score for the branches was very low at 0.16. In all tree species, most branches were incorrectly segmented as canopy. Not all branches of the Japanese larch could be identified and were mis-segmented as canopy (Figure 5c) The reason could be that the PointNet++ model, which used the ball-tree algorithm to extract the feature points based on the metric space at the sampling-layer stage, did not sufficiently extract the branches because the distance between the canopy and branches did not meet the threshold of 0.05 m set for segmentation.
The results of the segmentation of the Korean red pine and Korean pine demonstrated that although the branches located in the trunk region were properly segmented, those located in the same region as the canopy was not properly segmented (orange) (Figure 6a). Additionally, even when the trunk was located in a region separate from the canopy, many cases of proper segmentation occurred. However, mis-segmentation (purple) also occurred toward the treetop. This result was particularly prominent in the case of the Korean pine and Japanese larch. In the case of the Korean red pine, the canopy, trunk, and the regions between branches were separated, whereas in the Korean pine and Japanese larch, the trunks were often covered by the canopy (Figure 6b,c). Hence, the trunk recall value was found to be lower than that of the Korean red pine.
In summary, in Environment A where resampling was not performed, when 2048 representative points were present (Setup 1), we found that the performance of the model segmentation was high on average. Furthermore, we observed that in the case of PointNet++, which extracted representative points using metric space, the segmentation performance was poor when the space between the canopy, trunk, and branches was not sufficiently segmented.

4.2. Experiment B

The results of the class division based on the number of representative points (2048, 4096, and 8192) are listed in Table 7.
When resampling was conducted, the model performance improved with an increase in the number of representative points; the highest performance was observed when 4096 or 8192 points were used. Specifically, the best performance was achieved when 4096 points were used for the Korean red pine (F1 score = 0.9), Korean pine (F1 score = 0.9), and Japanese larch (F1 score = 0.8).
The model performance results by class for 4096 representative points are listed in Table 8.
The results of the canopy and trunk segmentation yielded a high average F1 score of 0.95, and the segmentation of the branches exhibited an even higher score of 0.67 than that in the A environment. Specifically, the Korean red pine and Korean pine demonstrated exceptional segmentation performance and showed a reduced tendency for misclassification of branches compared with the previous setup (as shown in Figure 7a,b). The accuracy of the branch segmentation of the Japanese larch slightly improved compared with that in environment A, but it remained low with a recall of 29.1%.
Resampling was used to create a space between the canopy, trunk, and branch regions, as shown in Figure 8. However, Figure 6c shows that in the case of the Japanese larch, the region between the branch and canopy considerably overlapped and the distance space was not sufficient, causing similar results as those shown in Figure 7c.
As a result, when resampling was performed, the segmentation performance of the model was found to be high, on average, when 4096 representative points were used (Setup 5). This was because the resampling ensured a sufficient distance space between the class regions, which was beneficial for extracting representative points using a ball tree. Therefore, when segmenting a tree with similar characteristics as the Japanese larch, securing sufficient distance space between classes was necessary by lowering the ball-tree threshold to 0.05 m or less or by increasing the strength of the resampling.

4.3. Comparative Analysis of Part Segmentation Results in Related Studies

Recent studies have largely employed supervised learning methods using CNN structures such as PointNet and PointCNN for segmenting the canopy, trunk, and ground [34] as well as for distinguishing individual trees within forested areas [45,46]. Unsupervised techniques such as DBSCAN and mean shift have also been used to differentiate between the canopy and trunk regions. However, in contrast to these previous studies that focused primarily on segmenting the canopy and trunk, this study specifically targeted the extraction of the canopy, trunk, and branches. To evaluate the performance of our approach based on PointNet++, we provided precision and F1 scores in Table 9, while noting that the accuracy of the branch segmentation was not presented, as the previous studies listed in Table 9 only address the canopy and trunk segmentation.
When comparing the segmentation results, using the F1 score is an accurate approach even when the number of test data samples differs. However, in similar studies where the F1 score was not reported, the comparison was solely based on the precision values. In terms of trunk-segmentation performance, Table 9 indicates that the segmentation results achieved by the PointNet++ model outperformed those obtained by both PointCNN and PointNet.
Notably, the canopy-segmentation accuracy in this study was relatively low, reaching 90.3%. This decrease could be attributed to the additional segmentation of the branches, which impacted the precision analysis. An effective method using mean shift and Dijkstra’s algorithm was proposed for classifying the canopy and wood (trunk and branches) [31]. Unsupervised methods offer the advantage of not requiring labor-intensive labeling work and reducing pre-processing time. However, determining the appropriate parameter values for clustering tasks, particularly when processing point cloud data for trees, can be challenging owing to the variability among species. In this study, we employed resampling strength and varied the number of representative points to ensure consistent learning data. The proposed environment in this study presented advantages for accurately segmenting complex tree structures, including the canopy, trunk, and branches.

5. Discussion

The high segmentation accuracy was demonstrated through the resampling of training data to approximately 25,000–30,000 points using Poisson sampling and extracting 4096 representative points. However, the performance of the PointNet++ model deteriorated when dealing with areas where the distinction between the canopy, trunk, and branches was unclear, such as in case of Japanese larch. This limitation can be attributed to the hierarchical feature-learning approach of PointNet++ that relies on a metric space. Although the performance of the model improved with resampling compared with nonresampling scenarios (Experiment A: accuracy = 79.8% and Experiment B: accuracy = 92.2%), both precise labeling and methods are required to increase the amount of training data and enhance the performance of the model.

6. Conclusions

This study evaluated the performance of part segmentation for three coniferous species, i.e., Korean red pine, Korean pine, and Japanese larch, using the PointNet++ model. By adjusting two learning environments, we segmented the canopy, trunk, and branches. Comparing the empirical results, we observed an 11% increase in the accuracy when resampling was applied compared to when it was not. In the resampling environment, we achieved an average F1 score of 0.86 with 4096 representative points. This implies that for optimal segmentation of the canopy, trunk, and branches using PointNet++, resampling of approximately 25,000–30,000 points is recommended and the model performs well with 4096 representative points. In our future work, we intend to explore the accurate estimation of AGB while simultaneously automating the segmentation of the canopy, trunk, and branches. This will be achieved by leveraging PointNet++ and incorporating biomass coefficients derived from comprehensive field surveys.

Author Contributions

Conceptualization, H.-J.C. and J.-T.K.; methodology, D.-H.K. and C.-U.K.; software, D.-H.K.; validation, J.-M.P. and D.-G.K.; formal analysis, D.-H.K.; investigation, C.-U.K.; writing—original draft preparation, D.-H.K.; writing—review and editing, J.-T.K. and H.-J.C.; funding acquisition, C.-U.K., J.-M.P. and J.-T.K. All authors have read and agreed to the published version of the manuscript.

Funding

This research was funded by Forest Resources Statistics Project, FM0000-2020-01-2023. Hyung-Ju Cho was partially supported by the Basic Science Research Program through the National Research Foundation of Korea (NRF), funded by the Ministry of Education (NRF-2020R1I1A3052713).

Data Availability Statement

Data sharing not applicable.

Conflicts of Interest

The authors declare no conflict of interest.

References

  1. Lee, H.J.; Ru, J.H. Application of LiDAR Data & High-Resolution Satellite Image for Calculate Forest Biomass. J. Korean Soc. Geospat. Inf. Sci. 2012, 20, 53–63. [Google Scholar]
  2. Chang, A.J.; Kim, H.T. Study of Biomass Estimation in Forest by Aerial Photograph and LiDAR Data. J. Korean Assoc. Geogr. Inf. Stud. 2008, 11, 166–173. [Google Scholar]
  3. Lin, Y.C.; Liu, J.; Fei, S.; Habib, A. Leaf-Off and Leaf-On UAV LiDAR Surveys for Single-Tree Inventory in Forest Plantations. Drones 2021, 5, 115. [Google Scholar] [CrossRef]
  4. Bauwens, S.; Bartholomeus, H.; Calders, K.; Lejeune, P. Forest Inventory with Terrestrial LiDAR: A Comparison of Static and Hand-Held Mobile Laser Scanning. Forests 2016, 7, 127. [Google Scholar] [CrossRef] [Green Version]
  5. Kankare, V.; Holopainen, M.; Vastaranta, M.; Puttonen, E.; Yu, X.; Hyyppä, J.; Vaaja, M.; Hyyppä, H.; Alho, P. Individual Tree Biomass Estimation using Terrestrial Laser Scanning. ISPRS J. Photogramm. Remote Sens. 2013, 75, 64–75. [Google Scholar] [CrossRef]
  6. Stovall, A.E.; Shugart, H.H. Improved Biomass Calibration and Validation with Terrestrial LiDAR: Implications for Future LiDAR and SAR Missions. IEEE J. Sel. Top. Appl. Earth Obs. Remote Sens. 2018, 11, 3527–3537. [Google Scholar] [CrossRef]
  7. Stovall, A.E.; Vorster, A.G.; Anderson, R.S.; Evangelista, P.H.; Shugart, H.H. Non-Destructive Aboveground Biomass Estimation of Coniferous Trees using Terrestrial LiDAR. Remote Sens. Environ. 2017, 200, 31–42. [Google Scholar] [CrossRef]
  8. Delagrange, S.; Jauvin, C.; Rochon, P. PypeTree: A Tool for Reconstructing Tree Perennial Tissues from Point Clouds. Sensors 2014, 14, 4271–4289. [Google Scholar] [CrossRef] [Green Version]
  9. Wang, C.; Ji, M.; Wang, J.; Wen, W.; Li, T.; Sun, Y. An Improved DBSCAN Method for LiDAR Data Segmentation with Automatic Eps Estimation. Sensors 2019, 19, 172. [Google Scholar] [CrossRef] [Green Version]
  10. Krisanski, S.; Taskhiri, M.S.; Gonzalez Aracil, S.; Herries, D.; Turner, P. Sensor Agnostic Semantic Segmentation of Structurally Diverse and Complex Forest Point Clouds using Deep Learning. Remote Sens. 2021, 13, 1413. [Google Scholar] [CrossRef]
  11. Kim, D.W.; Han, B.H.; Park, S.C.; Kim, J.Y. A Study on the Management Method in Accordance with the Vegetation Structure of Geumgang Pine (Pinus densiflora) Forest in Sogwang-ri, Uljin. J. Korean Inst. Landsc. Archit. 2022, 50, 1–19. [Google Scholar]
  12. Lee, S.J.; Woo, C.S.; Kim, S.Y.; Lee, Y.J.; Kwon, C.G.; Seo, K.W. Drone-Image-Based Method of Estimating Forest-Fire Fuel Loads. J. Korean Soc. Hazard Mitig. 2021, 21, 123–130. [Google Scholar] [CrossRef]
  13. Brede, B.; Lau, A.; Bartholomeus, H.M.; Kooistra, L. Comparing RIEGL RiCOPTER UAV LiDAR Derived Canopy Height and DBH with Terrestrial LiDAR. Sensors 2017, 17, 2371. [Google Scholar] [CrossRef] [Green Version]
  14. Trochta, J.; Krůček, M.; Vrška, T.; Král, K. 3D Forest: An Application for Descriptions of Three-Dimensional Forest Structures using Terrestrial LiDAR. PLoS ONE 2017, 12, e0176871. [Google Scholar] [CrossRef] [PubMed] [Green Version]
  15. Xi, Z.; Hopkinson, C.; Chasmer, L. Filtering Stems and Branches from Terrestrial Laser Scanning Point Clouds using Deep 3-D Fully Convolutional Networks. Remote Sens. 2018, 10, 1215. [Google Scholar] [CrossRef] [Green Version]
  16. Moorthy, S.M.K.; Calders, K.; Vicari, M.B.; Verbeeck, H. Improved Supervised Learning-Based Approach for Leaf and Wood Classification from LiDAR Point Clouds of Forests. IEEE Trans. Geosci. Remote Sens. 2019, 58, 3057–3070. [Google Scholar] [CrossRef] [Green Version]
  17. Gleason, C.J.; Im, J. Forest Biomass Estimation from Airborne LiDAR Data using Machine Learning Approaches. Remote Sens. Environ. 2012, 125, 80–91. [Google Scholar] [CrossRef]
  18. Zhang, L.; Shao, Z.; Liu, J.; Cheng, Q. Deep Learning Based Retrieval of Forest Aboveground Biomass from Combined LiDAR and Landsat 8 Data. Remote Sens. 2019, 11, 1459. [Google Scholar] [CrossRef] [Green Version]
  19. Guan, H.; Yu, Y.; Ji, Z.; Li, J.; Zhang, Q. Deep Learning-Based Tree Classification using Mobile LiDAR Data. Remote Sens. Lett. 2015, 6, 864–873. [Google Scholar] [CrossRef]
  20. Neuville, R.; Bates, J.S.; Jonard, F. Estimating Forest Structure from UAV-Mounted LiDAR Point Cloud using Machine Learning. Remote Sens. 2021, 13, 352. [Google Scholar] [CrossRef]
  21. Wu, L.; Zhu, X.; Lawes, R.; Dunkerley, D.; Zhang, H. Comparison of Machine Learning Algorithms for Classification of LiDAR Points for Characterization of Canola Canopy Structure. Int. J. Remote Sens. 2019, 40, 5973–5991. [Google Scholar] [CrossRef]
  22. Su, Z.; Li, S.; Liu, H.; Liu, Y. Extracting Wood Point Cloud of Individual Trees Based on Geometric Features. IEEE Geosci. Remote Sens. Lett. 2019, 16, 1294–1298. [Google Scholar] [CrossRef]
  23. Wang, D.; Momo Takoudjou, S.; Casella, E. LeWoS: A Universal Leaf-Wood Classification Method to Facilitate the 3D Modelling of Large Tropical Trees using Terrestrial LiDAR. Methods Ecol. Evol. 2020, 11, 376–389. [Google Scholar] [CrossRef]
  24. Hackenberg, J.; Spiecker, H.; Calders, K.; Disney, M.; Raumonen, P. SimpleTree—An Efficient Open Source Tool to Build Tree Models from TLS Clouds. Forests 2015, 6, 4245–4294. [Google Scholar] [CrossRef]
  25. Ferrara, R.; Virdis, S.G.; Ventura, A.; Ghisu, T.; Duce, P.; Pellizzaro, G. An Automated Approach for Wood-Leaf Separation from Terrestrial LIDAR Point Clouds using the Density Based Clustering Algorithm DBSCAN. Agric. For. Meteorol. 2018, 262, 434–444. [Google Scholar] [CrossRef]
  26. Chen, W.; Hu, X.; Chen, W.; Hong, Y.; Yang, M. Airborne LiDAR Remote Sensing for Individual Tree Forest Inventory using Trunk Detection-Aided Mean Shift Clustering Techniques. Remote Sens. 2018, 10, 1078. [Google Scholar] [CrossRef] [Green Version]
  27. Raumonen, P.; Kaasalainen, M.; Åkerblom, M.; Kaasalainen, S.; Kaartinen, H.; Vastaranta, M.; Holopainen, M.; Disney, M.; Lewis, P. Fast Automatic Precision Tree Models from Terrestrial Laser Scanner Data. Remote Sens. 2013, 5, 491–520. [Google Scholar] [CrossRef] [Green Version]
  28. Paul, K.I.; Roxburgh, S.H.; Chave, J.; England, J.R.; Zerihun, A.; Specht, A.; Lewis, T.; Bennett, L.T.; Baker, T.G.; Adams, M.A.; et al. Testing the Generality of Above-Ground Biomass Allometry Across Plant Functional Types at the Continent Scale. Glob. Chang. Biol. 2016, 22, 2106–2124. [Google Scholar] [CrossRef]
  29. Fan, G.; Nan, L.; Dong, Y.; Su, X.; Chen, F. AdQSM: A New Method for Estimating Above-Ground Biomass from TLS Point Clouds. Remote Sens. 2020, 12, 3089. [Google Scholar] [CrossRef]
  30. Fu, H.; Li, H.; Dong, Y.; Xu, F.; Chen, F. Segmenting Individual Tree from TLS Point Clouds using Improved DBSCAN. Forests 2022, 13, 566. [Google Scholar] [CrossRef]
  31. Hui, Z.; Jin, S.; Xia, Y.; Wang, L.; Ziggah, Y.Y.; Cheng, P. Wood and Leaf Separation from Terrestrial LiDAR Point Clouds Based on Mode Points Evolution. ISPRS J. Photogramm. Remote Sens. 2021, 178, 219–239. [Google Scholar] [CrossRef]
  32. Wang, D.; Hollaus, M.; Pfeifer, N. Feasibility of Machine Learning Methods for Separating Wood and Leaf Points from Terrestrial Laser Scanning Data. ISPRS Ann. Photogramm. Remote Sens. Spat. Inf. Sci. 2017, 4, 157–164. [Google Scholar] [CrossRef] [Green Version]
  33. Windrim, L.; Bryson, M. Detection, Segmentation, and Model Fitting of Individual Tree Stems from Airborne Laser Scanning of Forests using Deep Learning. Remote Sens. 2020, 12, 1469. [Google Scholar] [CrossRef]
  34. Krisanski, S.; Taskhiri, M.S.; Gonzalez Aracil, S.; Herries, D.; Muneri, A.; Gurung, M.B.; Montgomery, J.; Turner, P. Forest Structural Complexity Tool—An Open Source, Fully-Automated Tool for Measuring Forest Point Clouds. Remote Sens. 2021, 13, 4677. [Google Scholar] [CrossRef]
  35. Hamraz, H.; Jacobs, N.B.; Contreras, M.A.; Clark, C.H. Deep Learning for Conifer/Deciduous Classification of Airborne LiDAR 3D Point Clouds Representing Individual Trees. ISPRS J. Photogramm. Remote Sens. 2019, 158, 219–230. [Google Scholar] [CrossRef] [Green Version]
  36. Zhu, X.; Skidmore, A.K.; Wang, T.; Liu, J.; Darvishzadeh, R.; Shi, Y.; Premier, J.; Heurich, M. Improving Leaf Area Index (LAI) Estimation by Correcting for Clumping and Woody Effects using Terrestrial Laser Scanning. Agric. For. Meteorol. 2018, 263, 276–286. [Google Scholar] [CrossRef]
  37. Liang, X.; Hyyppä, J.; Kaartinen, H.; Lehtomäki, M.; Pyörälä, J.; Pfeifer, N.; Holopainen, M.; Brolly, G.; Francesco, P.; Hackenberg, J.; et al. International Benchmarking of Terrestrial Laser Scanning Approaches for Forest Inventories. ISPRS J. Photogramm. Remote Sens. 2018, 144, 137–179. [Google Scholar] [CrossRef]
  38. Liu, B.; Chen, S.; Huang, H.; Tian, X. Tree Species Classification of Backpack Laser Scanning Data Using the PointNet++ Point Cloud Deep Learning Method. Remote Sens. 2022, 14, 3809. [Google Scholar] [CrossRef]
  39. Briechle, S.; Krzystek, P.; Vosselman, G. Classification of Tree Species and Standing Dead Trees by Fusing UAV-Based Lidar Data and Multispectral Imagery in the 3D Deep Neural Network PointNet++. ISPRS Ann. Photogramm. Remote Sens. Spat. Inf. Sci. 2020, 2, 203–210. [Google Scholar] [CrossRef]
  40. Available online: https://github.com/apburt/treeseg (accessed on 4 June 2023).
  41. Burt, A.; Disney, M.; Calders, K. Extracting Individual Trees from Lidar Point Clouds using treeseg. Methods Ecol. Evol. 2019, 10, 438–445. [Google Scholar] [CrossRef] [Green Version]
  42. Qi, C.R.; Yi, L.; Su, H.; Guibas, L.J. Pointnet++: Deep Hierarchical Feature Learning on Point Sets in a Metric Space. Adv. Neural Inf. Process. Syst. 2017, 30, 1–10. [Google Scholar]
  43. Keskar, N.S.; Mudigere, D.; Nocedal, J.; Smelyanskiy, M.; Tang, P.T.P. On Large-Batch Training for Deep Learning: Generalization Gap and Sharp Minima. arXiv 2016, arXiv:1609.04836. [Google Scholar]
  44. Kandel, I.; Castelli, M. The Effect of Batch Size on the Generalizability of the Convolutional Neural Networks on a Histopathology Dataset. ICT Express 2020, 6, 312–315. [Google Scholar] [CrossRef]
  45. Wang, J.; Chen, X.; Cao, L.; An, F.; Chen, B.; Xue, L.; Yun, T. Individual Rubber Tree Segmentation Based on Ground-Based LiDAR Data and Faster R-CNN of Deep Learning. Forests 2019, 10, 793. [Google Scholar] [CrossRef] [Green Version]
  46. Zou, X.; Cheng, M.; Wang, C.; Xia, Y.; Li, J. Tree Classification in Complex Forest Point Clouds Based on Deep Learning. IEEE Geosci. Remote Sens. Lett. 2017, 14, 2360–2364. [Google Scholar] [CrossRef]
  47. Shen, X.; Huang, Q.; Wang, X.; Li, J.; Xi, B. A Deep Learning-Based Method for Extracting Standing Wood Feature Parameters from Terrestrial Laser Scanning Point Clouds of Artificially Planted Forest. Remote Sens. 2022, 14, 3842. [Google Scholar] [CrossRef]
Figure 1. Location of the study site. The data collection was performed using BLS (backpack laser scanner) equipment for the Korean red pine and the TLS (terrestrial laser scanner) equipment for the Korean pine and Japanese larch. The point cloud shown in Figure 1 is a representation of only a part of the employed data.
Forests 14 01159 g001
Figure 2. Data preprocessing. (a) Point clouds down-sampled to 5 cm resolution using Poisson sampling. (b) Results of the normalizing and removing ground points. (c) Tree trunk area is segmented considering the height of understory vegetation. (d) Trunk point clouds were extracted using the TreeSet application. (e) Stand point clouds with the understory vegetation was removed.
Forests 14 01159 g002
Figure 3. Manually labeled canopy, trunk, and branch point clouds. (a) Canopy, branch, and trunk point clouds were labeled and manually segmented, including offset offshoots. (b) Manually segmented Korean pine trunk and branch point clouds.
Forests 14 01159 g003
Figure 4. Tree data that included RGB. Because the branch and trunk have similar color (in the red circle) (left), the RGB values were removed and surface normal vector (x, y, z) values were added to the data (right).
Forests 14 01159 g004
Figure 5. Results of the part segmentation by label (canopy, trunk, and branch) of Setup 1 (representative point = 2048) using PointNet++. (a) Confusion matrix of the Korean red pine; (b) confusion matrix of the Korean pine; and (c) confusion matrix of the Japanese larch. In all segmentation results, the branch-segmentation performance was low, and in the case of the Japanese larch, most of the branches were estimated as canopy.
Forests 14 01159 g005
Figure 6. Results of the class (canopy, trunk, and branch) part segmentation in Setup 1. The purple color indicated the result of the trunk being mis-segmented as a canopy, and the orange color indicated the result of the branch being mis-segmented as a canopy. (a) Results of the mis-segmentation of the Korean red pine; (b) results of the mis-segmentation of the Korean pine; and (c) results of the mis-segmentation of the Japanese larch.
Forests 14 01159 g006
Figure 7. Results of part segmentation by label (canopy, trunk, and branch) in Setup 5 (representative points = 4096) using PointNet++. (a) Confusion matrix of the Korean red pine; (b) confusion matrix of the Korean pine; and (c) confusion matrix of the Japanese larch. In all segmentation results, the branch-segmentation performance was low, and in the case of Japanese larch, most of the branches were estimated as canopy.
Forests 14 01159 g007
Figure 8. Results of class (canopy, trunk, and branch) part segmentation in Setup 5. The purple color indicated the result of the trunk being mis-segmented as canopy, the yellow color represented the result of the branch being mis-segmented as canopy, and the white color showed the result of the branch being mis-segmented as trunk. (a) Results of the segmentation of the Korean red pine; (b) results of the mis-segmentation of the Korean pine; and (c) results of the mis-segmentation of the Japanese larch.
Forests 14 01159 g008
Table 1. Comparison of existing works for segmenting individual tree structures.
Related WorkMethodDeep LearningPart SegmentFully AutomatedHyperparameter Tuning TestDescription
[23,24,31]Random Forest,
Data clustering, CPS algorithm
A study that combines data clustering and shortest path algorithms to segment the canopy and trunk.
[32,33,34,35]Deep learning, Machine learningValidation of deep learning and machine -learning models for canopy and trunk segmentation.
Table 2. Characteristics of the 20 plots scanned for tree species classification where the † (‡) symbol refers to training data (test data).
Tree SpeciesLocationPlot Size
(n)
Tree Density
(Tree/ha−1)
Tree Height
(m)
Tree DBH (cm)LiDARPoint Density
(pts/m2)
Korean red pine BNA
(37°0′27.61″ N,
128°47′45.98″ E)
30 × 30 m2 (6)14526.451.2LiBackpack D5025,579
Korean pine LFMZ
(37°48′0.86″ N,
127°56′58.08″ E)
30 × 30 m2 (4)27822.332.1Leica RTC36088,746
Japanese larch LFMZ
(37°48′16.23″ N,
127°56′45.51″ E)
30 × 30 m2 (7)17827.637.6Leica RTC36097,674
Korean red pine SEF
(36°22′39.60″ N,
128°8′42.49″ E)
20 × 20 m2 (1)55018.327.3LiBackpack D5034,762
Korean pine GEF
(37°45′32.15″ N,
127°10′52.66″ E)
30 × 30 m2 (1)32222.723.8Leica RTC36084,241
Japanese larch GEF
(37°45′38.33″ N,
127°10′54.24″ E)
30 × 30 m2 (1)32621.924.5Leica RTC36091,447
Table 3. Details of tree data labeled using the CloudCompare program from the preprocessed data.
DivisionTree SpeciesClass
Canopy
(n)
Trunk
(n)
Branch
(n)
Training dataTrainingKorean red pine10210278
Korean pine10210263
Japanese larch10210274
Subtotal306306215
ValidationKorean red pine242420
Korean pine242416
Japanese larch242419
Subtotal727255
Test dataTestKorean red pine191918
Korean pine191914
Japanese larch191916
Subtotal575748
Total435435318
Table 4. Hyperparameter values of PointNet++ to segment the canopy, trunk, and branch.
HyperparameterABDescription
Setup 1Setup 2Setup 3Setup 4Setup 5Setup 6
Batch size16221622Sample size per batch
Representative points204840968192204840968192Local and global feature points
ResamplingFalseTrueResampling of tree points
Grouping methodBall-tree (threshold = 0.05 m)Feature point grouping method
Density-adaptive layer modelMulti-scale groupingThe abstraction level contains grouping and feature extraction of a single scale
OptimizerAdamOptimization algorithm
Epoch400Number of epochs in training
NormalTrueUse normal vector
Table 5. Comparison of the accuracy, precision, recall, and F1 score of the tree species in Experiment A setup.
Tree SpeciesRepresentative PointsAccuracy
(%)
Precision
(%)
Recall
(%)
F1 Score
Korean red pint204881.783.170.60.7
409680.185.067.00.6
819276.086.063.80.6
Korean pine204885.582.862.90.7
409683.991.257.10.6
819283.992.757.70.6
Japanese larch204873.453.556.00.5
409671.253.654.20.5
819274.254.356.70.5
Table 6. Comparison of the accuracy, precision, recall, and F1 score by label (canopy, trunk, and branch) in Setup 1 (2048 representative points).
DivisionKorean Red PineKorean PineJapanese Larch
CanopyTrunkBranchCanopyTrunkBranchCanopyTrunkBranch
Accuracy (%)97.596.617.598.678.211.897.870.10.00
Precision (%)71.495.981.984.193.171.264.995.70.00
Recall (%)97.596.917.598.678.211.897.870.10.00
F1 score0.830.960.290.910.850.200.780.810.00
Table 7. Comparison of the overall accuracy, precision, recall, and F1 score of the tree species in the Experiment B setup.
Tree SpeciesRepresentative PointsOA
(%)
Precision
(%)
Recall
(%)
F1 Score
Korean red pint204892.490.890.20.9
409695.594.794.20.9
819294.894.293.10.9
Korean pine204889.681.881.00.8
409692.787.885.40.9
819291.688.779.20.8
Japanese larch204882.475.674.60.7
409686.386.873.90.8
819283.886.767.60.7
Table 8. Comparison of the accuracy, precision, recall, and F1 score by label (canopy, trunk, and branch) in Setup 5 (representative points = 4096).
DivisionKorean Red PineKorean PineJapanese Larch
CanopyTrunkBranchCanopyTrunkBranchCanopyTrunkBranch
Accuracy (%)96.698.287.795.896.763.894.598.129.1
Precision (%)95.397.991.094.793.075.780.894.585.3
Recall (%)96.698.287.795.896.763.894.598.129.1
F1 score0.960.960.890.950.950.690.870.960.43
Table 9. Comparison of the part segmentation results with similar studies. The part marked with * refers to the results of segmenting the trunk and branch by treating them as the same region. Unsupervised learning contains the mean shift and Dijkstra methods.
Related WorkMethodPrecision
(%)
F1 Score
(%)
Tree Species
CanopyTrunkCanopyTrunk
[33]PointNet97.651.7 *--Monterey pine (Pinus radiata)
[34]PointNet++97.494.8 *--Monterey pine, Eucalyptus (Eucalyptus amygdalina)
[47]PointCNN97.287.0 *--Camellia (Camellia japonica), Chinese white poplar (Populus x Mentosa)
[31]Unsupervised--90.087.1 *Sugar maple (Acer saccharum), Norway spruce (Picea abies), Lodgepole pine (Pinus contorata) etc.
This studyPointNet++90.395.192.795.7Korean red pine, Korean pine, Japanese larch
Disclaimer/Publisher’s Note: The statements, opinions and data contained in all publications are solely those of the individual author(s) and contributor(s) and not of MDPI and/or the editor(s). MDPI and/or the editor(s) disclaim responsibility for any injury to people or property resulting from any ideas, methods, instructions or products referred to in the content.

