3.1. Results of Mangroves Spatial Distribution Extraction Based on GF-2 Images with Different Vegetation Indices
Based on the GF-2 image,
IMII and other commonly used vegetation indexes were used to extract the spatial distribution of mangroves. The results are shown in
Figure 5, and the accuracy evaluation results are shown in
Table 5. The corresponding high-resolution image from Google Earth can be found in
Figure S4 in the Supplementary Materials.
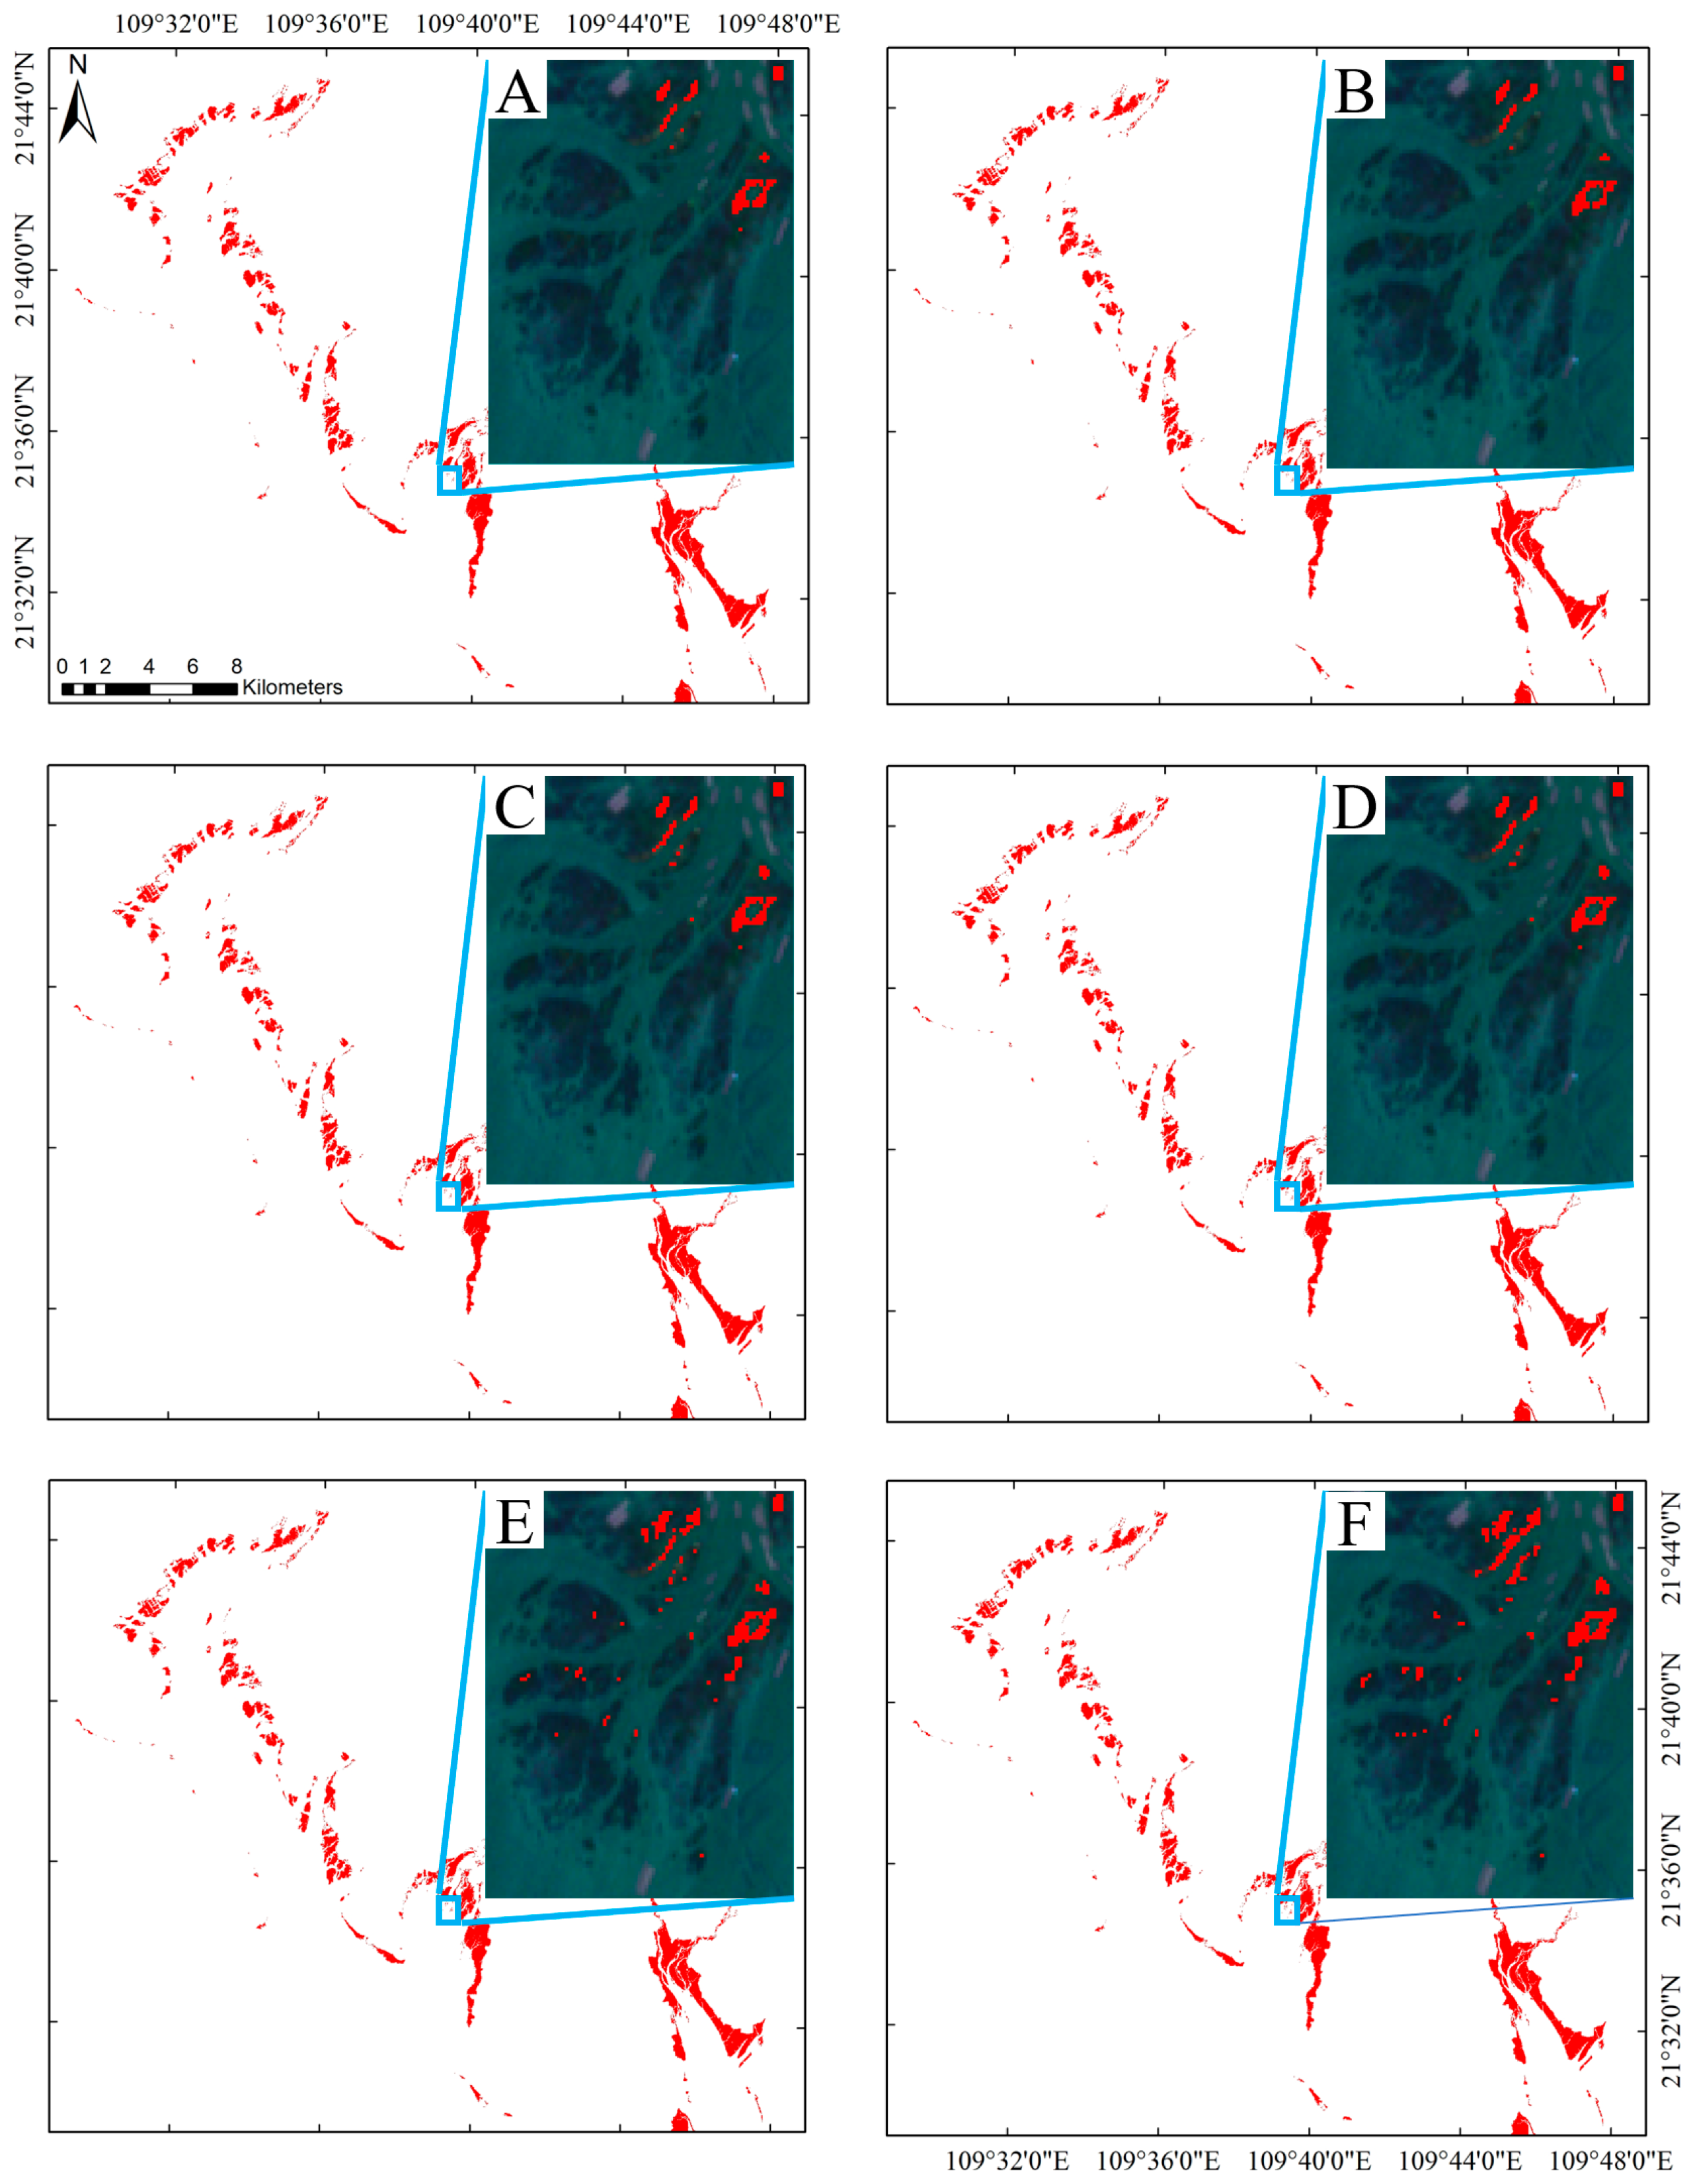
According to the results shown in
Figure 5, it was not possible to accurately extract the submerged mangroves by employing the
EVI,
NDVI, and
NDWI indexes proposed based on the single tide image. In particular, in cases where the tide level was high, a large number of mangroves in the flooded area became undetectable, as shown in the partially enlarged areas of
Figure 5D–F. While the extraction results of
IMII1,
IMII2 and
SMRI based on the high and low tide level images were more accurate, this made it possible to distinguish the submerged mangroves in the case of a high tide level, as shown in the partially enlarged areas of
Figure 5A–C. Additionally, the extraction result of the
IMII2 was more accurate than that of the
IMII1 and
SMRI, due to the fact that the
IMII1 and
SMRI failed to effectively extract the submerged mangroves in some areas.
According to
Table 5, it was indicated that the spatial distribution extraction of mangroves based on the vegetation index extracted from GF-2 images achieved accurate results, with an overall accuracy of more than 87% and a
Kappa coefficient higher than 0.80. Among them, the result of
IMII2 was the best, with an overall accuracy and a
Kappa coefficient of 91.79% and 0.87, respectively. Next, the results of
IMII1 included an overall accuracy and
Kappa coefficient of 91.49% and 0.87, respectively. While the results of
NDVI were the lowest, with an overall accuracy and
Kappa coefficient of 87.15% and 0.80, respectively.
Meanwhile, the user accuracy of the mangrove extraction results with
EVI,
NDVI, and
NDWI was high; however, the mapping accuracy was low, which indicates that there were many errors in the mangrove spatial distribution extraction results. This is relatively consistent with the results shown in
Figure 5, i.e., the above four vegetation indexes were unable to effectively extract the submerged mangroves, and the spatial distribution of the mangroves became significantly underestimated in the case where the high tide remote sensing image was employed to extract the mangrove trees. On the contrary,
IMIIs and
SMRI were capable of effectively distinguishing submerged mangroves in the case of extracting mangroves from high tide remote sensing images, and the extraction result of
IMII2 was superior to the result of
IMII1. Therefore, the difference between the user accuracy and mapping accuracy of
IMII1 and
IMII2 was small, and in the case of
IMII2, the difference was smaller, with results of 0.65% less than the difference of
IMII1 at 1.96%.
Based on the results of univariate, the extraction of the spatial distribution of mangroves through multivariate collaboration was attempted, and the results are shown in
Table 6. Due to the large number of multivariate combination classification results, it was not convenient to display them all. Therefore, only some of the multivariate combination classification results are shown in
Table 6. And the confusion matrices of land cover classification with some vegetation indices based on GF-2 images can be found in
Table S1 in the Supplementary Materials.
Analyzing the results presented in
Table 5 and
Table 6, it can be observed that, in most cases, the accuracy of multivariate collaborative applications was superior to those of univariate. For bivariate classification results shown in
Table 6, the result based on
IMII1 and
NDWI was the best, with an overall accuracy of 93.26% and a
Kappa coefficient of 0.8949, which was superior to all univariate classification results. For the three-variable classification results, although the result based on the combination of
IMII1,
NDWI, and
NDVI variables outperformed the univariate classification results, it was lower than the classification results of
IMII1 and
NDWI. The results indicate that although multivariable collaborative applications can improve classification results to a certain extent in most cases, inappropriate variable combinations not only fail to improve the classification results, but also reduce the classification results.
In summary, the vegetation index extracted based on GF-2 images allowed for the extraction of more accurate spatial distribution results for mangroves. Furthermore, the IMII1 and IMII2 derived from high and low tide level images were capable of effectively extracting submerged mangroves, and the results were also more accurate than those of other vegetation indexes, while the extraction result of IMII2 was the best. Although multivariable collaborative applications can improve classification results in most cases, it is important to pay attention when applying multivariable collaboration, as inappropriate variable combinations not only fail to improve classification results, but also lower classification results.
3.2. Results of Mangrove Spatial Distribution Extraction Based on Senitnel-2 Images with Different Vegetation Indices
For further verification of the applicability of the extraction of vegetation indices based on GF-2 images for medium-resolution images, the proposed vegetation index was tested on Sentinel-2 images of three regions within study areas A, B, and C. And the high-resolution images from Google Earth in study areas A, B, and C can be found in
Figures S1, S2 and S3 in the Supplementary Materials. The extraction results for the spatial distribution of mangroves in study area D are shown in
Figure 6, and the precision evaluation results are shown in
Table 7.
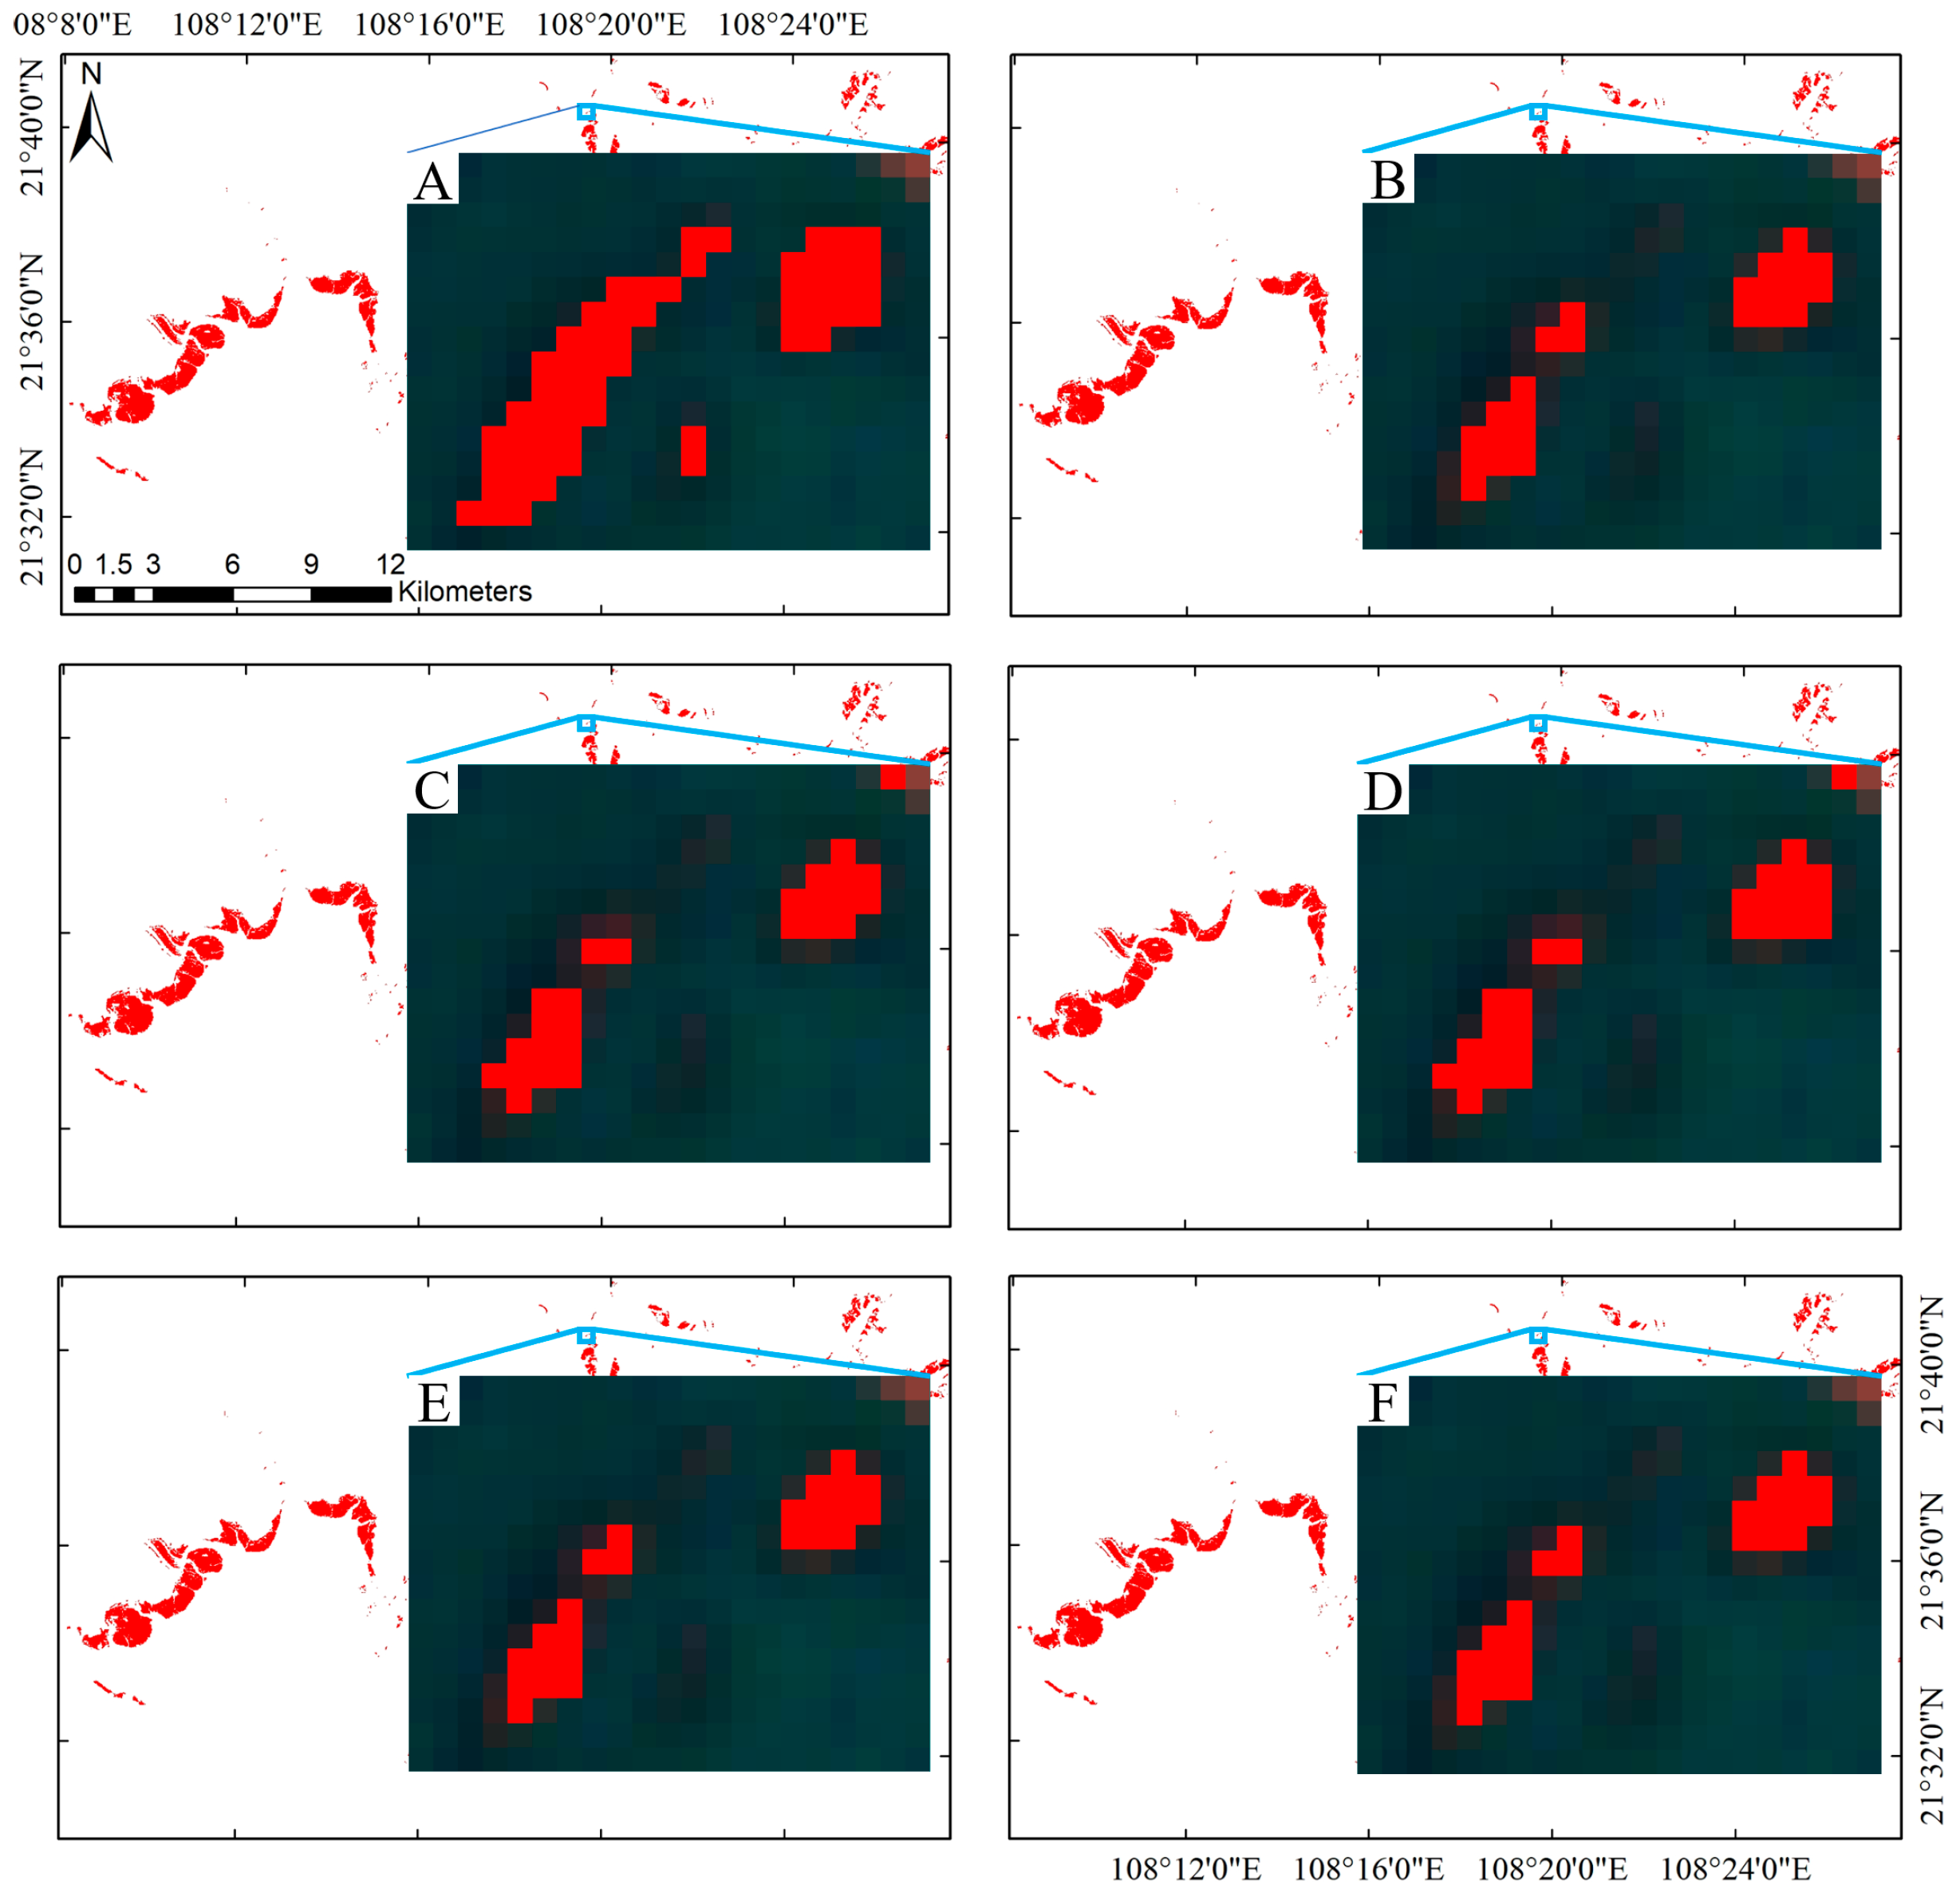
According to the results shown in
Figure 6, in the case of the Sentinel-2 image, while the overall difference between the extraction results of the spatial distribution of mangroves based on the vegetation index was not obvious, the difference became apparent in the case of certain distinct areas, as shown in the partially enlarged area in
Figure 6. According to the partially enlarged area in
Figure 6, it can be observed that in this particular area, the extraction areas for
IMII1,
IMII2,
SMRI, and
EVI were relatively smaller, while
NDVI, and
NDWI exhibited larger extraction areas for mangroves. This was primarily due to the severe invasion of
Spartina alterniflora Loisel. in this region.
NDVI and
NDWI tended to misclassify
Spartina alterniflora Loisel. as mangroves, to some extent, during the mangrove extraction process, resulting in a larger extracted area for mangroves. On the other hand, other indices are better at distinguishing between mangroves and
Spartina alterniflora Loisel., leading to a relatively smaller extracted area for mangroves.
According to
Table 7, the extraction results of the spatial distribution of mangroves based on the vegetation index extracted from the Sentinel-2 image in study area A were accurate enough and the difference was not obvious. The overall accuracy was higher than 88%, and the
Kappa coefficient was greater than 0.8. Among them, the overall accuracy and
Kappa coefficient of
IMII2 were the highest, with 91.11% and 0.86, respectively, followed by
IMII1, where the overall accuracy and
Kappa coefficient were 90.64% and 0.86, respectively. The results of the
NDWI were the lowest, with an overall accuracy and
Kappa coefficient of 88.64% and 0.83, respectively.
Meanwhile, the mapping accuracy of mangrove extraction results for each vegetation index was high; however, the user accuracy was low, which indicates that there were many missing errors in the extraction results of the spatial distribution of mangrove trees. The difference between the user accuracy and the mapping accuracy of IMII1 was the smallest, with only 3.92%, while the difference between the user accuracy and the mapping accuracy of NDWI was the largest, at 11.58%. Several factors contributed to this situation, including the complex and scattered nature of the mangrove tree species in the region and the invasion of Spartina alterniflora Loisel., particularly in the Dandouhai region, which causes Spartina alterniflora Loisel. to be divided into mangrove forests in the majority of cases.
Furthermore, the spatial distribution of mangroves was also extracted through multivariate collaboration in study area A, and the results are shown in
Table 8. And the confusion matrices of land cover classification with some vegetation indices based on Sentinel-2 images in study area A can be found in
Table S2 in the Supplementary Materials.
According to the results presented in
Table 7 and
Table 8, it can be observed that the accuracy of multivariate collaborative applications was superior to those of univariate. For bivariate classification results shown in
Table 8, the result based on
SMRI and
NDVI was the best, with an overall accuracy of 91.84% and a
Kappa coefficient of 0.8755, which was superior to all univariate classification results. For the three-variable classification results, the result based on the combination of
SMRI,
NDWI, and
NDVI variables outperformed the bivariate and univariate classification results. The results indicate that for study area A, although multivariate collaborative application can improve classification results, the improvement was relatively small.
The extraction results of the spatial distribution of mangroves with each vegetation index based on Sentinel-2 images in study area B are shown in
Figure 7, and the accuracy evaluation results are shown in
Table 9.
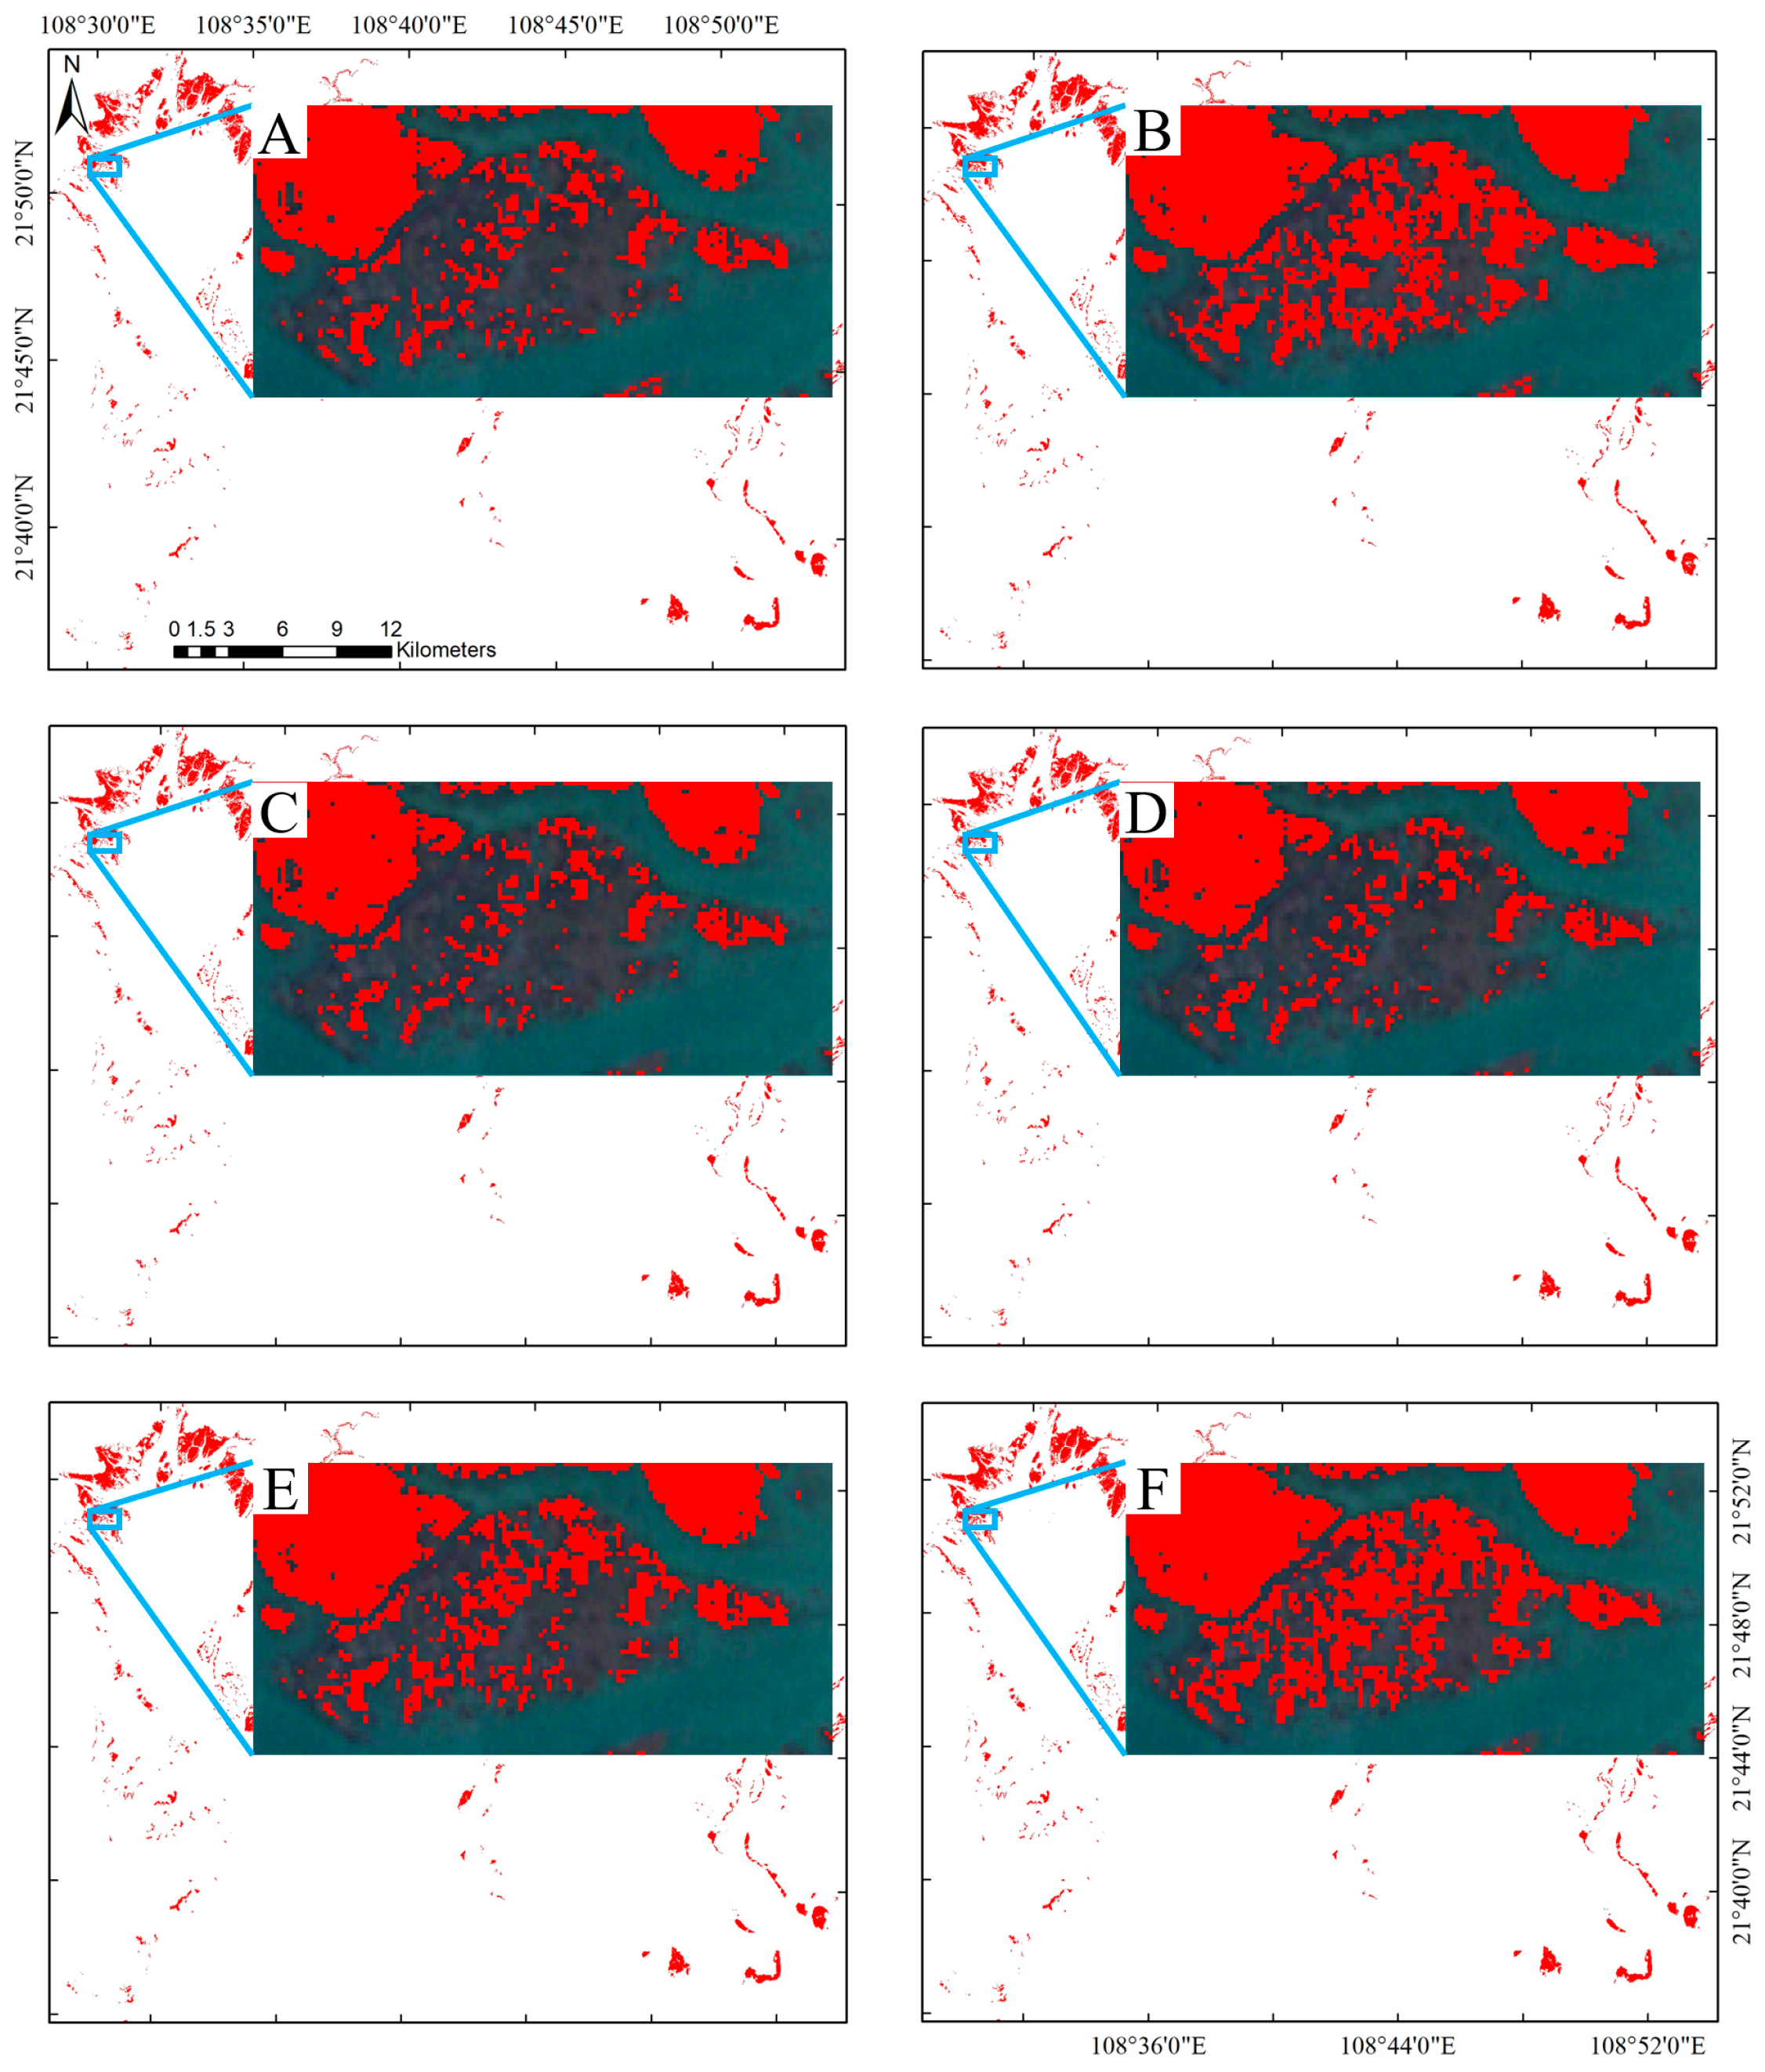
According to
Figure 7, the overall and detailed differences in the extraction results of the spatial distribution of mangroves with each vegetation index were not obvious. This was mainly because the mangroves in this area were relatively tall and, therefore, less affected by tidal inundation. In most areas, mangrove areas that were affected by tidal inundation were smaller than 10 m, while the spatial resolution of Sentinel-2 images was 10 m, thus making it difficult to reach a complete pixel. The effect of the tidal inundations on the spatial distribution of mangroves was less than one pixel; hence, the difference in the spatial distribution of mangroves extracted through different vegetation indexes was not significant.
According to
Table 9, the spatial distribution extraction results of mangroves based on the vegetation index extracted from Sentinel-2 images in study area B were accurate enough and the difference was not obvious. The overall accuracy was higher than 91.6%, and the
Kappa coefficient was greater than 0.86. Among them, the overall accuracy and
Kappa coefficient of
IMIIs were the highest, at 92.27% and 0.88, respectively. The results of
NDWI were the lowest, and the overall accuracy and
Kappa coefficient were 91.62% and 0.87, respectively, which were only 0.65% different from the results of
IMIIs.
Meanwhile, the extraction results of the spatial distribution of mangroves with each vegetation index were accurate, and there were no significant errors either. In addition, the user accuracy and mapping accuracy of the extraction results for each vegetation index were high. This was mainly due to the fact that the mangrove trees in this area were relatively tall, and the image depicting tidal inundation was relatively small.
At the same time, the spatial distribution of mangroves was also extracted through multivariate collaboration in study area B, and the specific results are shown in
Table 10. And the confusion matrices of land cover classification with some vegetation indices based on Sentinel-2 images in study area B can be found in
Table S3 in the Supplementary Materials.
Based on the results shown in
Table 9 and
Table 10, it can be observed that for study area B, the multivariate collaborative application did not improve the accuracy of classification results. Compared with the results of univariate classification, the results of multivariate collaborative applications showed a decrease. This was mainly because in the study area B, the impact of tidal inundation on mangroves was relatively small, and univariate can achieve more accurate extraction of mangrove spatial distribution, while the multivariate collaborative application actually reduced the classification results.
The extraction results of the spatial distribution of mangroves with each vegetation index based on Sentinel-2 images in study area C are shown in
Figure 8, and the accuracy evaluation results are shown in
Table 11.
According to
Figure 8, the overall difference in the extraction results of the spatial distribution of mangroves for each vegetation index was not obvious, although the difference was relatively obvious in the case of certain areas, as shown in the partially enlarged area in
Figure 8. As shown in the figure, in cases where the tide level was high, it was likely that the
IMII2,
NDVI, and
NDWI classified other vegetation as mangroves, while the extraction results of the
IMII1,
SMRI, and
EVI were relatively accurate with relatively few errors.
According to
Table 11, in study area C, there were only minor differences among the results when using different vegetation indexes to determine the spatial distribution of mangroves; the overall accuracy was higher than 92.6%, and the
Kappa coefficient was greater than 0.88. In this case, the overall accuracy and
Kappa coefficient of
IMII2 were the highest, with 93.97% and 0.91, respectively. The results of the
NDVI were the lowest, with 92.62% and 0.89, respectively. The difference in overall accuracy and
Kappa coefficient between
IMII2 and
NDVI was only 1.35% and 0.02, respectively.
Meanwhile, it can be observed that various vegetation indices exhibited high mapping accuracy but low user accuracy in mangrove extraction, indicating a significant amount of misclassifications in the spatial distribution of mangroves using these indices. Among them,
IMII2 had the smallest difference between user accuracy and mapping accuracy, with only 3.55%, while
NDVI had the largest difference, reaching 7.01%. This was primarily due to the complexity of tree species and the scattered distribution of mangroves in the study area, as well as the presence of a certain amount of
Spartina alterniflora Loisel. invasion, resulting in many other vegetation types being misclassified as mangroves. The specific results are shown in the magnified area of
Figure 8.
Similar to study areas A and B, the spatial distribution of mangroves was extracted using multivariate collaboration in study area C, and the results are shown in
Table 12. And the confusion matrices of land cover classification with some vegetation indices based on Sentinel-2 images in study area C can be found in
Table S3 in the Supplementary Materials.
Because of the complexity of the environment in study area C, most multivariate collaborative applications can improve classification results, as shown in
Table 12. However, when
NDVI was combined with other vegetation indices, the classification results may slightly decrease, such as
SMRI and
NDVI, as well as
EVI and
NDVI combinations.
In summary, the extraction results of the spatial distribution of mangroves of each vegetation index based on the medium-resolution Sentinel-2 images were not significantly different on the whole. However, the differences were relatively large in some regions, and the results of IMII2 were relatively more accurate in comparison to the other vegetation indexes. This was mainly because the spatial resolution of Sentinel-2 images was relatively coarse, and the optimal resolution was only 10 m. Generally, for most areas, the longitudinal length between the start and end lines of mangrove inundation rarely exceeded 10 m. Therefore, the difference between the extraction results of the spatial distribution of mangroves in most regions was less than one pixel, while the low mangroves in some regions became largely or even completely submerged during tidal inundation; this led to the occurrence of significant differences in the extraction results of the spatial distribution of mangroves. However, such regions were relatively small in the study area; thus, they did not lead to any significant differences in the overall extraction results of each vegetation index. At the same time, introducing different variables in SVM classification typically enhanced classification accuracy. This was because multivariable inputs provided more information and features, aiding in the accurate differentiation of various land cover categories. However, in some cases, the introduction of multiple variables may lead to a decrease in accuracy. This is because each variable provides features from a different perspective, which can introduce inconsistencies and uncertainty in the decision boundary of the algorithm.


