Article

Effect of Nitrogen Addition to the Soil on Atlantic Forest Tree Seedlings

by
Lara Raposo Bardy
1,
Tatiane Viegas Debiasi
1,
Karina Sanada
1,
Artur Berbel Lirio Rondina
2,
José Marcelo Domingues Torezan
1,
Renata Stolf-Moreira
1,
Edmilson Bianchini
1,
José Antonio Pimenta
1 and
Halley Caixeta Oliveira
1,*
1
Department of Animal and Plant Biology, State University of Londrina, Rodovia Celso Garcia Cid km 380, Londrina 86057-970, Brazil
2
Department of Biology, Centro Universitário das Faculdades Integradas de Ourinhos (Unifio), Rodovia BR-153, km 338, Ourinhos 19909-100, Brazil
*
Author to whom correspondence should be addressed.
Forests 2023, 14(6), 1111; https://doi.org/10.3390/f14061111
Submission received: 25 March 2023 / Revised: 17 May 2023 / Accepted: 24 May 2023 / Published: 26 May 2023
(This article belongs to the Section Forest Ecophysiology and Biology)

Abstract

:
The input of large amounts of fertilizers in agricultural areas may result in nitrogen (N) leakage to nearby forest fragments, which can impact the physiology and growth of trees. The current study aimed to assess the effects of soil N addition on seedlings of four tree species in the Brazilian Atlantic Forest: Croton floribundus and Astronium graveolens (pioneer), Guarea kunthiana and Aspidosperma polyneuron (non-pioneer). The experiment was carried out in a greenhouse condition with three treatments: reference (soil without addition of nutrients), N addition (N: soil with addition of ammoniacal-N), and complete (C: soil with addition of ammoniacal-N and other macro and micronutrients). Croton floribundus seedlings presented higher shoot growth with N addition, mainly in treatment C, and only this treatment increased net photosynthesis. There was great variation in the metabolic responses induced by treatments N and C, with accumulation of nitrate in the leaves and xylem sap only in seedlings in treatment N. In A. graveolens, there was a decrease in transpiration in response to treatments N and C. However, water use efficiency, leaf area, and dry mass increased only in seedlings subjected to treatment C. Regarding metabolic parameters, A. graveolens was little responsive to the treatments. In G. kunthiana seedlings, the treatments decreased net photosynthesis and increased leaf total N. Only treatment N led to decreased stem dry mass and increased nitrate contents in leaves and xylem sap. Aspidosperma polyneuron exhibited no change in growth, but there was an accumulation of N compounds in the leaves for both treatments N and C, which suggests that this species could be a good bioindicator of N addition to the soil. Although influencing different parameters, the results indicate that soil N addition affects the performance of both pioneer and non-pioneer species. Finally, the implications of these results for biomonitoring of N availability in the soil of forest fragments are discussed.

1. Introduction

Global levels of reactive nitrogen (N) have been enhanced due to anthropogenic activities, such as fossil fuel combustion and the intensive use of N-fertilizers [1,2]. In agricultural crops, reactive N (such as ammonium, nitrate, and urea) is applied in high doses, however, a large part is not used by the cultivated plants, and is lost to adjacent ecosystems through volatilization, percolation, and surface runoff [3,4,5]. Since N is the nutrient that plants need in the greatest amount, N availability in the soil strongly influences the performance and survival of plant species [6,7]. In terrestrial ecosystems, increased N levels in the soil may change the plant–soil interactions, as well as the competition among plant species, which can modify the composition of plant communities and lead to biodiversity loss.
Forests are among the terrestrial ecosystems most affected by the increased availability of reactive N [8,9]. However, the majority of studies about the effects of N deposition on the growth and physiology of trees were carried out with species from temperate and subtropical forests [10], so there is scarce knowledge about the responses of native species of tropical forests to N addition to the soil [10,11]. In addition, mature tropical forests are generally less N-limited than temperate or subtropical forests, resulting in different responses of tree species to N addition [10].
Meta-analysis studies indicate that the increase in carbon sequestration in response to N addition (generally in the form of NH4NO3) is much lower in tropical forests (when detected) than in temperate and subtropical forests [10,12,13]. Consistent with these observations, Jiang et al. [14] showed that N increased the relative growth rates of small trees in a tropical mountain forest in China only when applied together with phosphorus (P), suggesting that the P content in the soil may affect the responses of tropical tree seedlings to increased N. Santiago et al. [15] also demonstrated the joint effect of N and P in stimulating the growth of tree seedlings in a tropical forest in Panama. However, Cárate-Tandalla et al. [16] reported an increase in the mortality of seedlings of Pouteria torta (Mart.) Radlk. after addition of N (even with P) in a tropical forest in Ecuador. Moreover, in long-term experiments carried out by Lu et al. [11], the addition of high concentrations of N to the soil led to a sharp decrease in the richness and density of tree species in a tropical forest in China.
Data about the effects of N addition on the physiology and metabolism of plants in tropical forests are contrasting. Pasquini and Santiago [17] observed a positive effect of adding N to the soil in a tropical rainforest in Panama on the photosynthesis and N content in the leaves of Alseis blackiana Hemsl seedlings. Other studies observed that the net photosynthetic rate of seedlings of tree species from tropical forests in China was not changed, or even reduced, after treatment with large amounts of N [18,19]. Mao et al. [19] also reported increases in the contents of N, soluble proteins, and free amino acids in the leaves of three understory tree species in response to an increase in N in the soil.
Several studies have indicated that the metabolic and physiological responses of tree species to increased N are dependent on their ecological characteristics, such as nutrient demand, shade tolerance, growth rate, and canopy position [20,21,22]. For example, in a study evaluating the effect of adding N to the canopy of a Chinese subtropical forest, Liu et al. [23] found that individuals of Castanea henryi (Skan) Rehder & E.H. Wilson (a canopy tree species) had higher N and chlorophyll contents in the leaves, but demonstrated a decrease in Rubisco activity, protein content, and photosynthetic N use efficiency. On the other hand, the understory tree species Ardisia quinquegona Blume presented increased leaf protein content and net photosynthetic rate in response to the addition of N in the forest canopy [23].
Tree species from different functional groups in tropical forests have different N use strategies, which are important adaptive responses to the environment where they live [6,24,25,26,27,28]. Studies with tree seedlings native to the Brazilian Atlantic Forest indicate that shade-intolerant species have high N assimilation capacity in the shoots, associated with high activity of nitrate reductase (NR) in the leaves and high levels of nitrate translocated in the xylem sap. On the other hand, shade-tolerant species assimilate N mainly in the roots and predominantly translocate amino acids in the xylem sap [26,27]. Despite presenting fast growth and being dependent on high N availability in the soil, shade-intolerant species are more sensitive to toxicity caused by the accumulation of N as ammonium in the soil than shade-tolerant species, and exhibit a preference for the use of N as nitrate [26,27].
Considering the diversity of N use strategies presented by native tree species from the Atlantic Forest, it is important to evaluate how seedlings of species with different shade tolerance degrees respond to the addition of reactive N in the soil, in order to predict changes in plant communities and propose strategies for their conservation. Moreover, the assessment of metabolic responses may allow the recommendation of bioindicator species and biomarkers of increased N in the soil in forest fragments [29]. Thus, we aimed to assess the effects of the high availability of N in the soil (alone or together with other nutrients) on the growth, physiology, and N metabolism of seedlings of native tree species of the Brazilian Atlantic Forest, with different shade-tolerance degrees, grown in a greenhouse condition.

2. Material and Methods

2.1. Plant Species and Treatments

Seedlings of four Atlantic Forest tree species with different degrees of shade tolerance were studied: Croton floribundus Spreng., shade-intolerant, semi-deciduous, occurring mainly at the edges of forests; Astronium graveolens Jacq., shade-intolerant, deciduous, often present in secondary forests; Guarea kunthiana A. Juss., shade-tolerant, evergreen, and typical of the forest understory; and Aspidosperma polyneuron Müll.Arg., shade-tolerant, evergreen, and occupies the forest understory when young, but is emergent when adult.
The experiment was carried out at the State University of Londrina (23°19′29″ S; 51°11′51″ W), in a greenhouse with shade net (92% light retention) that allows photosynthetically active radiation (PAR) close to that of forest fragments. Seeds were obtained from 3–5 mature trees for each species, found in forest fragments, and were sown in plastic trays containing washed sand. When the seedlings reached nearly 10 cm in height, they were individually transferred to 760 cm3 bags (100 cm2 of surface area) containing clayey Rhodic Ferrasol [30] with the following characteristics: pH 5.02; organic matter, 31.54 g dm−3; total N, 1.2 g dm−3; labile P = 1.0 mg dm−3; available K = 0.14 cmolc dm−3; available Ca = 2.8 cmolc dm−3; available Mg = 1.3 cmolc dm−3.
After 20 days of acclimation in the bags, the seedlings of the four tree species were subjected to one of the following treatments for 60 days: (i) reference, without added nutrients to the soil; (ii) treatment N, in which only N was added to the soil as 2 mM (NH4)2SO4 solution; (iii) treatment C, in which complete nutrient solution with all macro and micronutrients was added to the soil (2 mM (NH4)2SO4, 1 mM KH2PO4, 2 mM K2SO4, 2 mM MgSO4, 2 mM CaCl2, 100 µM FeSO4-EDTA, 92.6 µM H3BO3, 18 µM MnCl2, 1.5 µM ZnCl2, 0.6 µM Na2MoO4, 0.7 µM CuCl2). These treatments allowed the evaluation of effects on the plants of the high availability of N in the soil, both alone and together with other nutrients. The solutions (50 mL) were applied once a week and, on the other days, the plants were watered as needed. This treatment scheme resulted in the total addition of 28 kg N ha−1, considering the 60 days of the experiment. The experiment was performed in a completely randomized design and each treatment had 10 biological replicates.

2.2. Biometric Analyses

After the growth period in the bags, the plants were carefully removed and separated into shoot and roots. The roots were washed in tap water and oven-dried at 60 °C until constant dry weight. For the shoot, the length was measured from the stem base to the shoot apical meristem with a measuring scale and total leaf area was assessed using a LI-3000C leaf area integrator (LI-COR Biosciences, Lincoln, NE, USA). After this, leaves and stems were oven-dried at 60 °C until constant dry weight. The specific leaf area (SLA) and root to shoot ratio were calculated as follows:
S L A = T o t a l   l e a f   a r e a L e a f   d r y   m a s s
R o o t   t o   s h o o t   r a t i o = R o o t   d r y   m a s s L e a f   d r y   m a s s + S t e m   d r y   m a s s

2.3. Physiological Analyses

The net photosynthetic rate, stomatal conductance, transpiration rate, and intercellular CO2 concentration were assessed in the youngest fully expanded leaf of each plant in the morning (8–10 a.m.) using an infrared gas analyzer (Irga) LI-6400 XT (LI-COR Biosciences, United States). The leaf was placed in a 6 cm2 measuring chamber with saturating photosynthetically active radiation adjusted to 1500 µmol m−2 s−1 and a flow rate of 400 mL min−1. Water use efficiency (WUE) was calculated as follows:
W U E = N e t   p h o t o s y n t h e t i c   r a t e T r a n s p i r a t i o n   r a t e

2.4. Metabolic Analyses

A 0.2-g fresh sample of the two youngest fully expanded leaves was ground into liquid N2 and used to extract low molecular weight compounds (nitrate, ammonium, and free amino acids) with MCW (methanol: chloroform: water, 12:5:3, v:v:v) [31]. The xylem sap was extracted from stems using a Schölander-type pressure chamber. The contents of nitrate, ammonium, and amino acids in the xylem sap and leaf MCW extracts were determined colorimetrically using the SpectraMax Plus 384 spectrophotometer (Molecular Devices, Sunnyvale, CA, USA). Nitrate was quantified after its reduction to nitrite by vanadium chloride catalyst (0.4% VCl3 in 0.5 M HCl). The resulting nitrite was detected after reaction with the Griess reagent (1% sulfanilamide in 1.5 M HCl followed by the addition of 0.02% N-naphthyl-ethylenediamine) at 540 nm [32]. NH4+ was quantified by the Berthelot reaction adding the reagents A (1% phenol and 0.2 mM sodium nitroprusside) and B (125 mM NaOH, 150 mM Na2HPO4, and 0.12% NaClO) sequentially. Absorbance readings were performed at 625 nm [33]. The total content of free amino acids was determined by the ninhydrin reaction (0.2 M citrate buffer pH 5, 5% ninhydrin, and 0.01 M KCN—the last two were diluted in methyl cellosolve) followed by extraction with 60% ethanol. Absorbance readings were carried out at 570 nm [34].
Soluble proteins were recovered from the leaf precipitate material from the extraction with MCW by stirring with 0.1 M NaOH for 24 h. The content of soluble proteins in the leaves was then quantified using the Coomassie Blue reagent [35].
The activity of the enzyme nitrate reductase (NR) was determined in vivo as described by Stewart et al. [36]. Segmented fresh leaf samples (0.15 g) were incubated in syringes containing the reaction solution (K2HPO4 0.05 M; 1% propanol; KNO3 0.05 M; pH 7.5), under vacuum, in the dark, for 40 min. The nitrite was then quantified in the solution using the Griess reagent, as described previously.
Nitrogen concentration in leaves was determined after digestion of the ground tissues (<1.0 mm) in 1.5 mL of sulfuric acid, containing 0.05 g of catalyst (K2SO4 + CuSO4 10:1, m/m), at 350 °C. After digestion, the material was diluted with distilled water (1/600). Next, the green salicylate method [37] was applied, adding 6 mL of distilled water, 1 mL of reagent A (citric acid 50 g L−1, sodium citrate 50 g L−1, and NaOH 25 g L−1), 1 mL of reagent B (sodium nitroprusside 1.0 g L−1), and 1 mL of reagent C (0.15% NaClO) to 1.0 mL of the dilution. After 1 h, absorbance readings were performed at 697 nm in a spectrophotometer (Genesys 10S UV-Vis, Thermo Scientific, Waltham, MA, USA).

2.5. Statistical Analyses

Four biological replicates of each treatment were used for metabolic analyses, and ten replicates were used for biometric and physiological analyses. The dataset was tested for normality by the Shapiro–Wilk test and homogeneity of variances by Bartlett’s test. When necessary, data were log10-transformed to meet the assumptions of parametric tests. Means were analyzed by one-way ANOVA followed by Fisher’s test (α = 5%), using the software STATISTICA v.12.0 (StatSoft Inc. Tulsa, OK, USA).
Principal component analyses (PCA) were performed to compare species responses to nutrient addition to the soil. For each variable, the ratio between the averages of treatment N and the reference (N/R) and between the averages of treatment C and the reference (C/R) were calculated within the same species. The ratios were log10-transformed to allow equal weights to the positive and negative effects of the treatments. These ratios were used to build a PCA with biometric and physiological variables and another with metabolic variables, using the software R, Stats package, version 4.0.2 (R Core Team, Vienna, Austria).

3. Results

3.1. Biometric and Physiological Parameters

For C. floribundus, seedlings exhibited higher leaf dry mass, leaf area, and leaf specific area, as well as a lower root/shoot ratio, in treatments N and C than the reference (Table 1). However, the effects of treatment C on these parameters were more remarkable than those induced by N. For A. graveolens, seedlings grown in treatment N had lower shoot length than reference seedlings. Seedlings in treatment C presented higher shoot length, leaf area, and leaf dry mass, as well as a lower root/shoot ratio, than reference seedlings. Guarea kunthiana seedlings grown in treatment N exhibited only lower stem dry mass than those grown in the other treatments, while treatment C did not affect any biometric attribute. Seedlings of A. polyneuron did not present differences for biometric attributes among the treatments.
Seedlings of C. floribundus grown in treatments N and C presented higher intercellular CO2 concentration and net photosynthetic rate, respectively, than seedlings grown in the reference (Figure 1). For A. graveolens, seedlings grown in treatments N and C had a lower transpiration rate and stomatal conductance than those grown in the reference, while seedlings in treatment C also had a lower intercellular CO2 concentration in leaves, but higher water use efficiency. Guarea kunthiana seedlings had a lower transpiration rate and stomatal conductance in treatment C, and lower net photosynthesis in treatments N and C, in relation to the reference. Aspidosperma polyneuron seedlings grown in treatments C and N exhibited a lower intercellular CO2 concentration in leaves than seedlings grown in the reference.

3.2. Metabolic Parameters

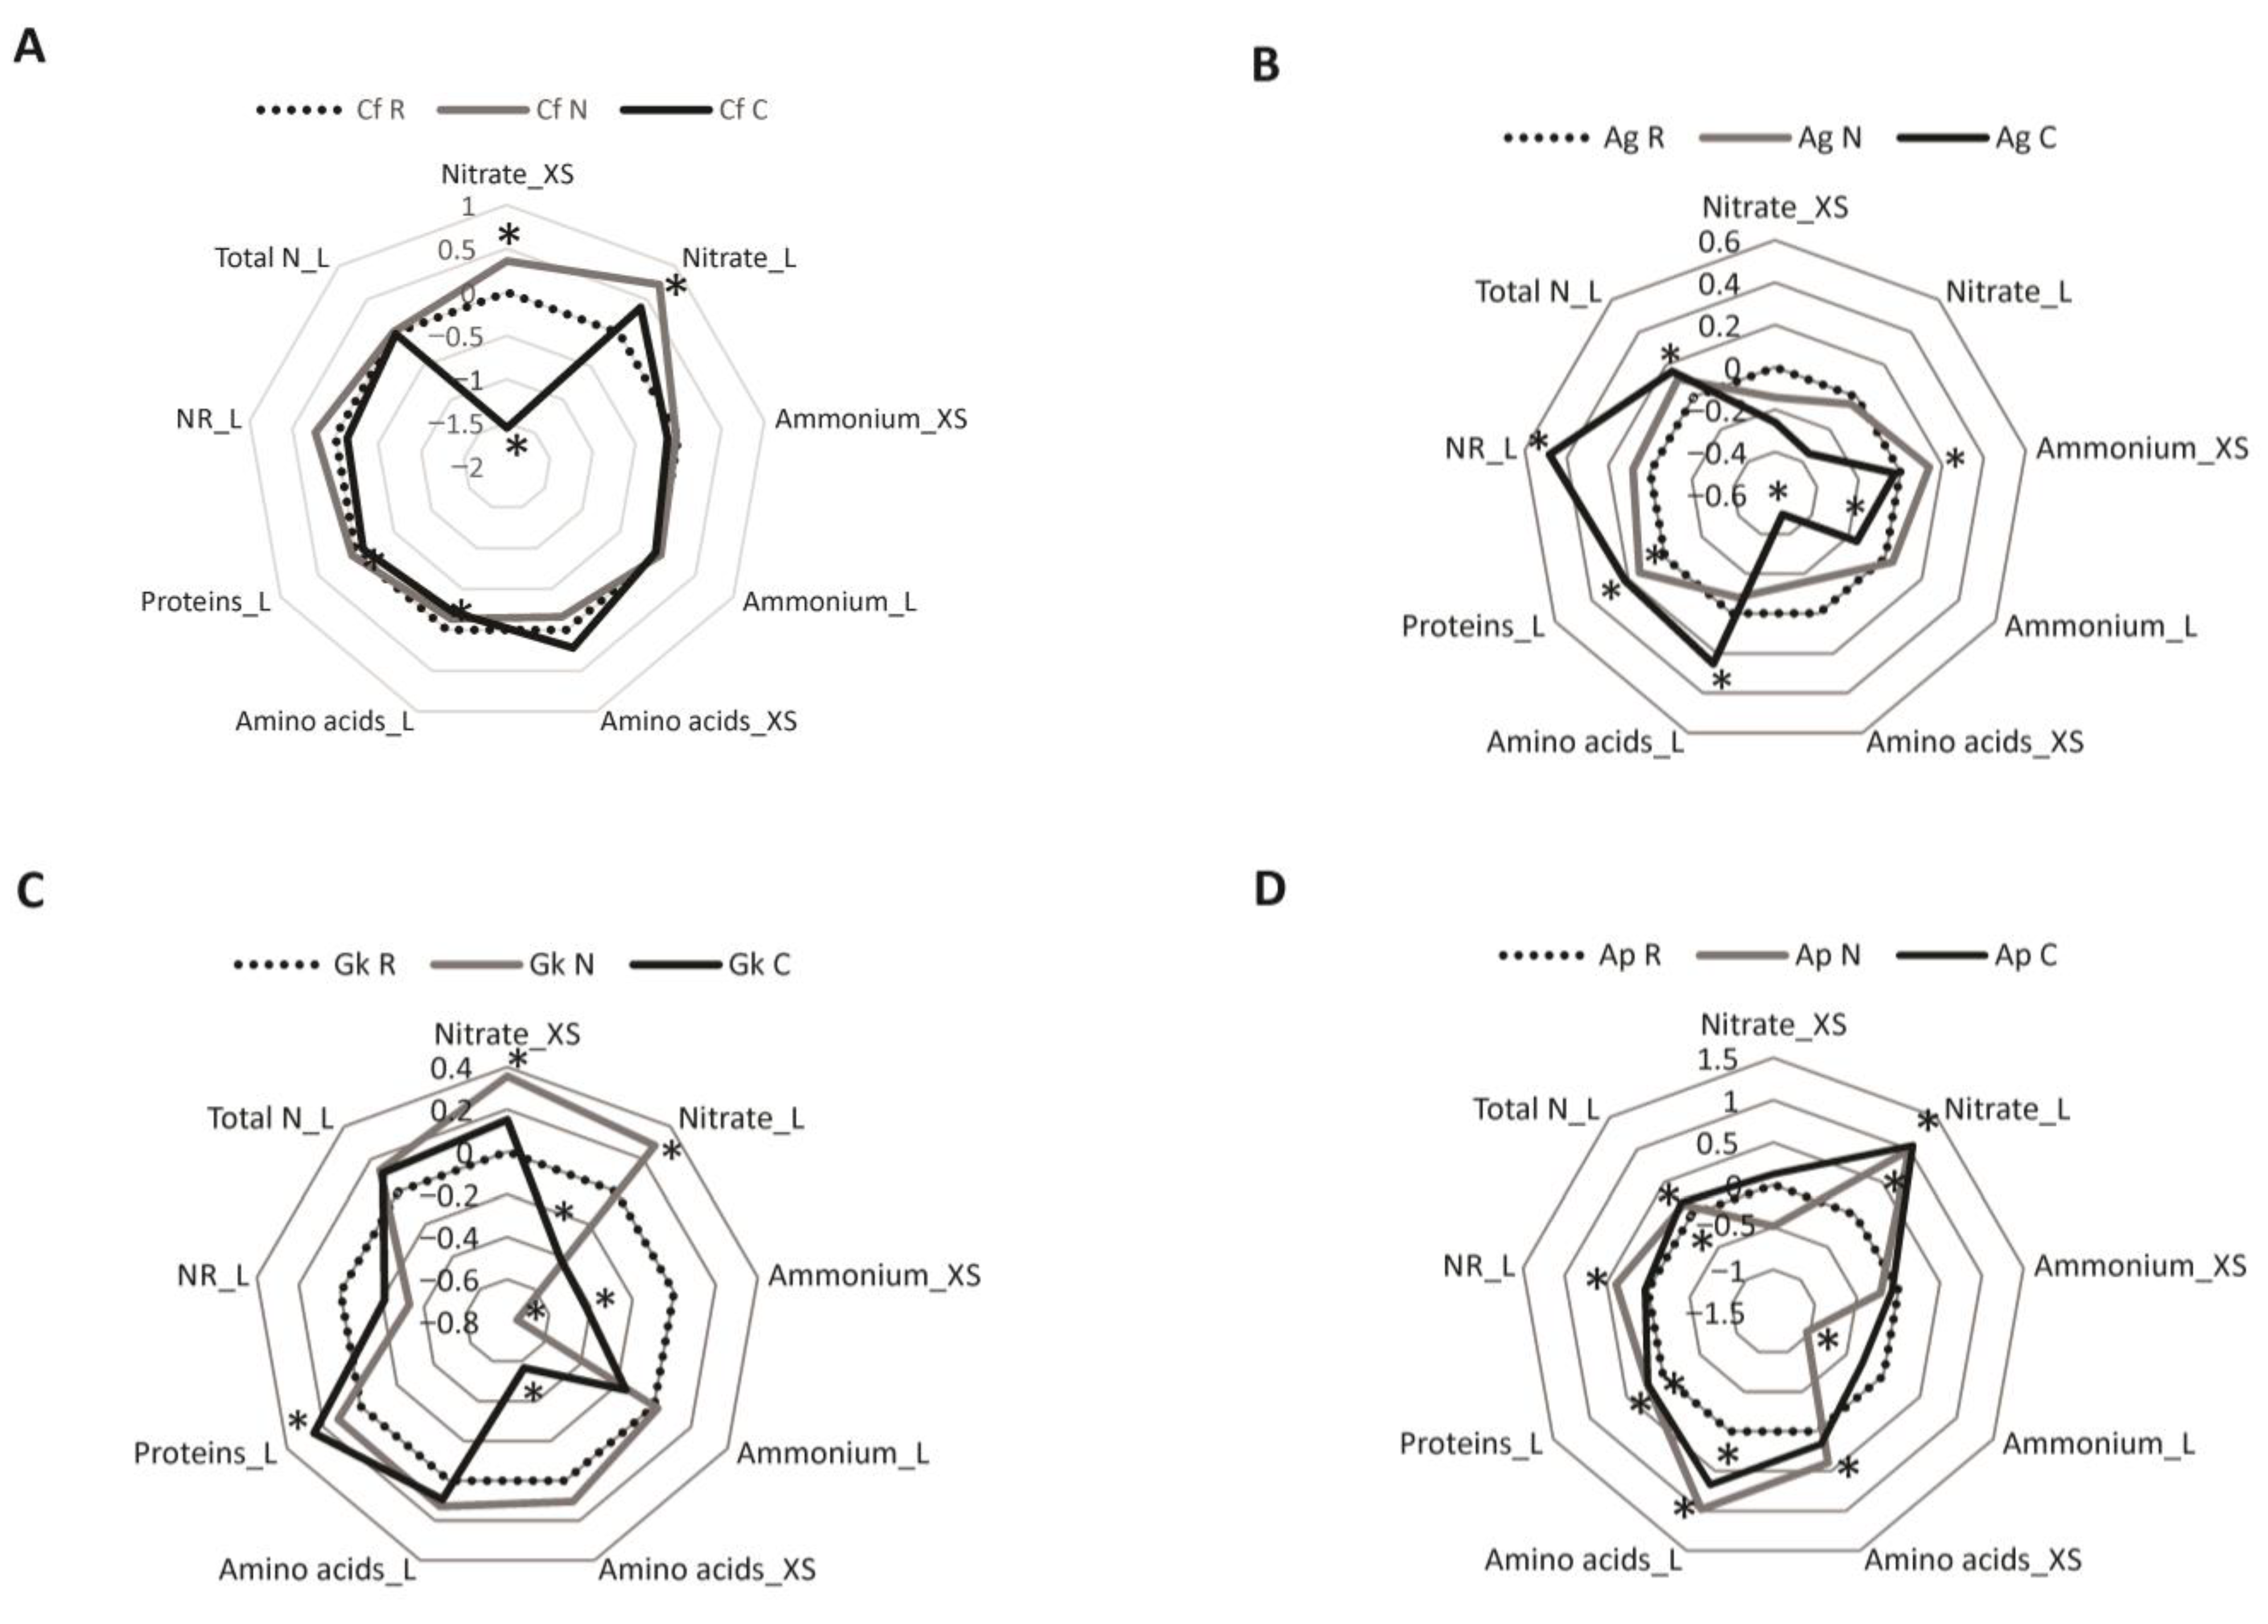
The metabolic responses of the seedlings to the addition of nutrients in the soil are presented in radar graphs made using the log10-transformed N/R and C/R ratios (Figure 2). Means and standard errors of the metabolic parameters can be found in Table S1.
For C. floribundus, the nitrate contents in the xylem sap and leaves increased in the seedlings grown in treatment N compared to those grown in the reference (Figure 2A). On the other hand, the nitrate content in the xylem sap, as well as the contents of amino acids and proteins in the leaves, decreased in seedlings grown in treatment C.
Seedlings of A. graveolens grown in treatment N exhibited higher protein content in the leaves and ammonium content in the xylem sap than those grown in the reference (Figure 2B). In the leaves of A. graveolens seedlings grown in treatment C, the levels of amino acids, proteins, and total N, as well as the NR activity were higher than those presented in the leaves of seedlings grown in the reference, but the ammonium content was lower. In the xylem sap, the only significant effect of treatment C was a decrease in the amino acid content.
For G. kunthiana, the contents of nitrate, amino acids, and total N were higher in the leaves of seedlings grown in treatment N than in the leaves of reference seedlings, but the content of ammonium in the xylem sap was lower (Figure 2C). Treatment C increased the total N and protein contents but decreased the nitrate content in the leaves of this species. Treatment C also led to reduced levels of amino acids and ammonium in the xylem sap.
Seedlings of A. polyneuron submitted to treatments N and C had a higher content of nitrate, amino acids, proteins, and total N in the leaves than seedlings grown in the reference (Figure 2D). In this species, treatment N led to a decrease in the levels of ammonium in the leaves, as well as an increase in NR activity in the leaves and amino acid content in the xylem sap.

3.3. Multivariate Analyses

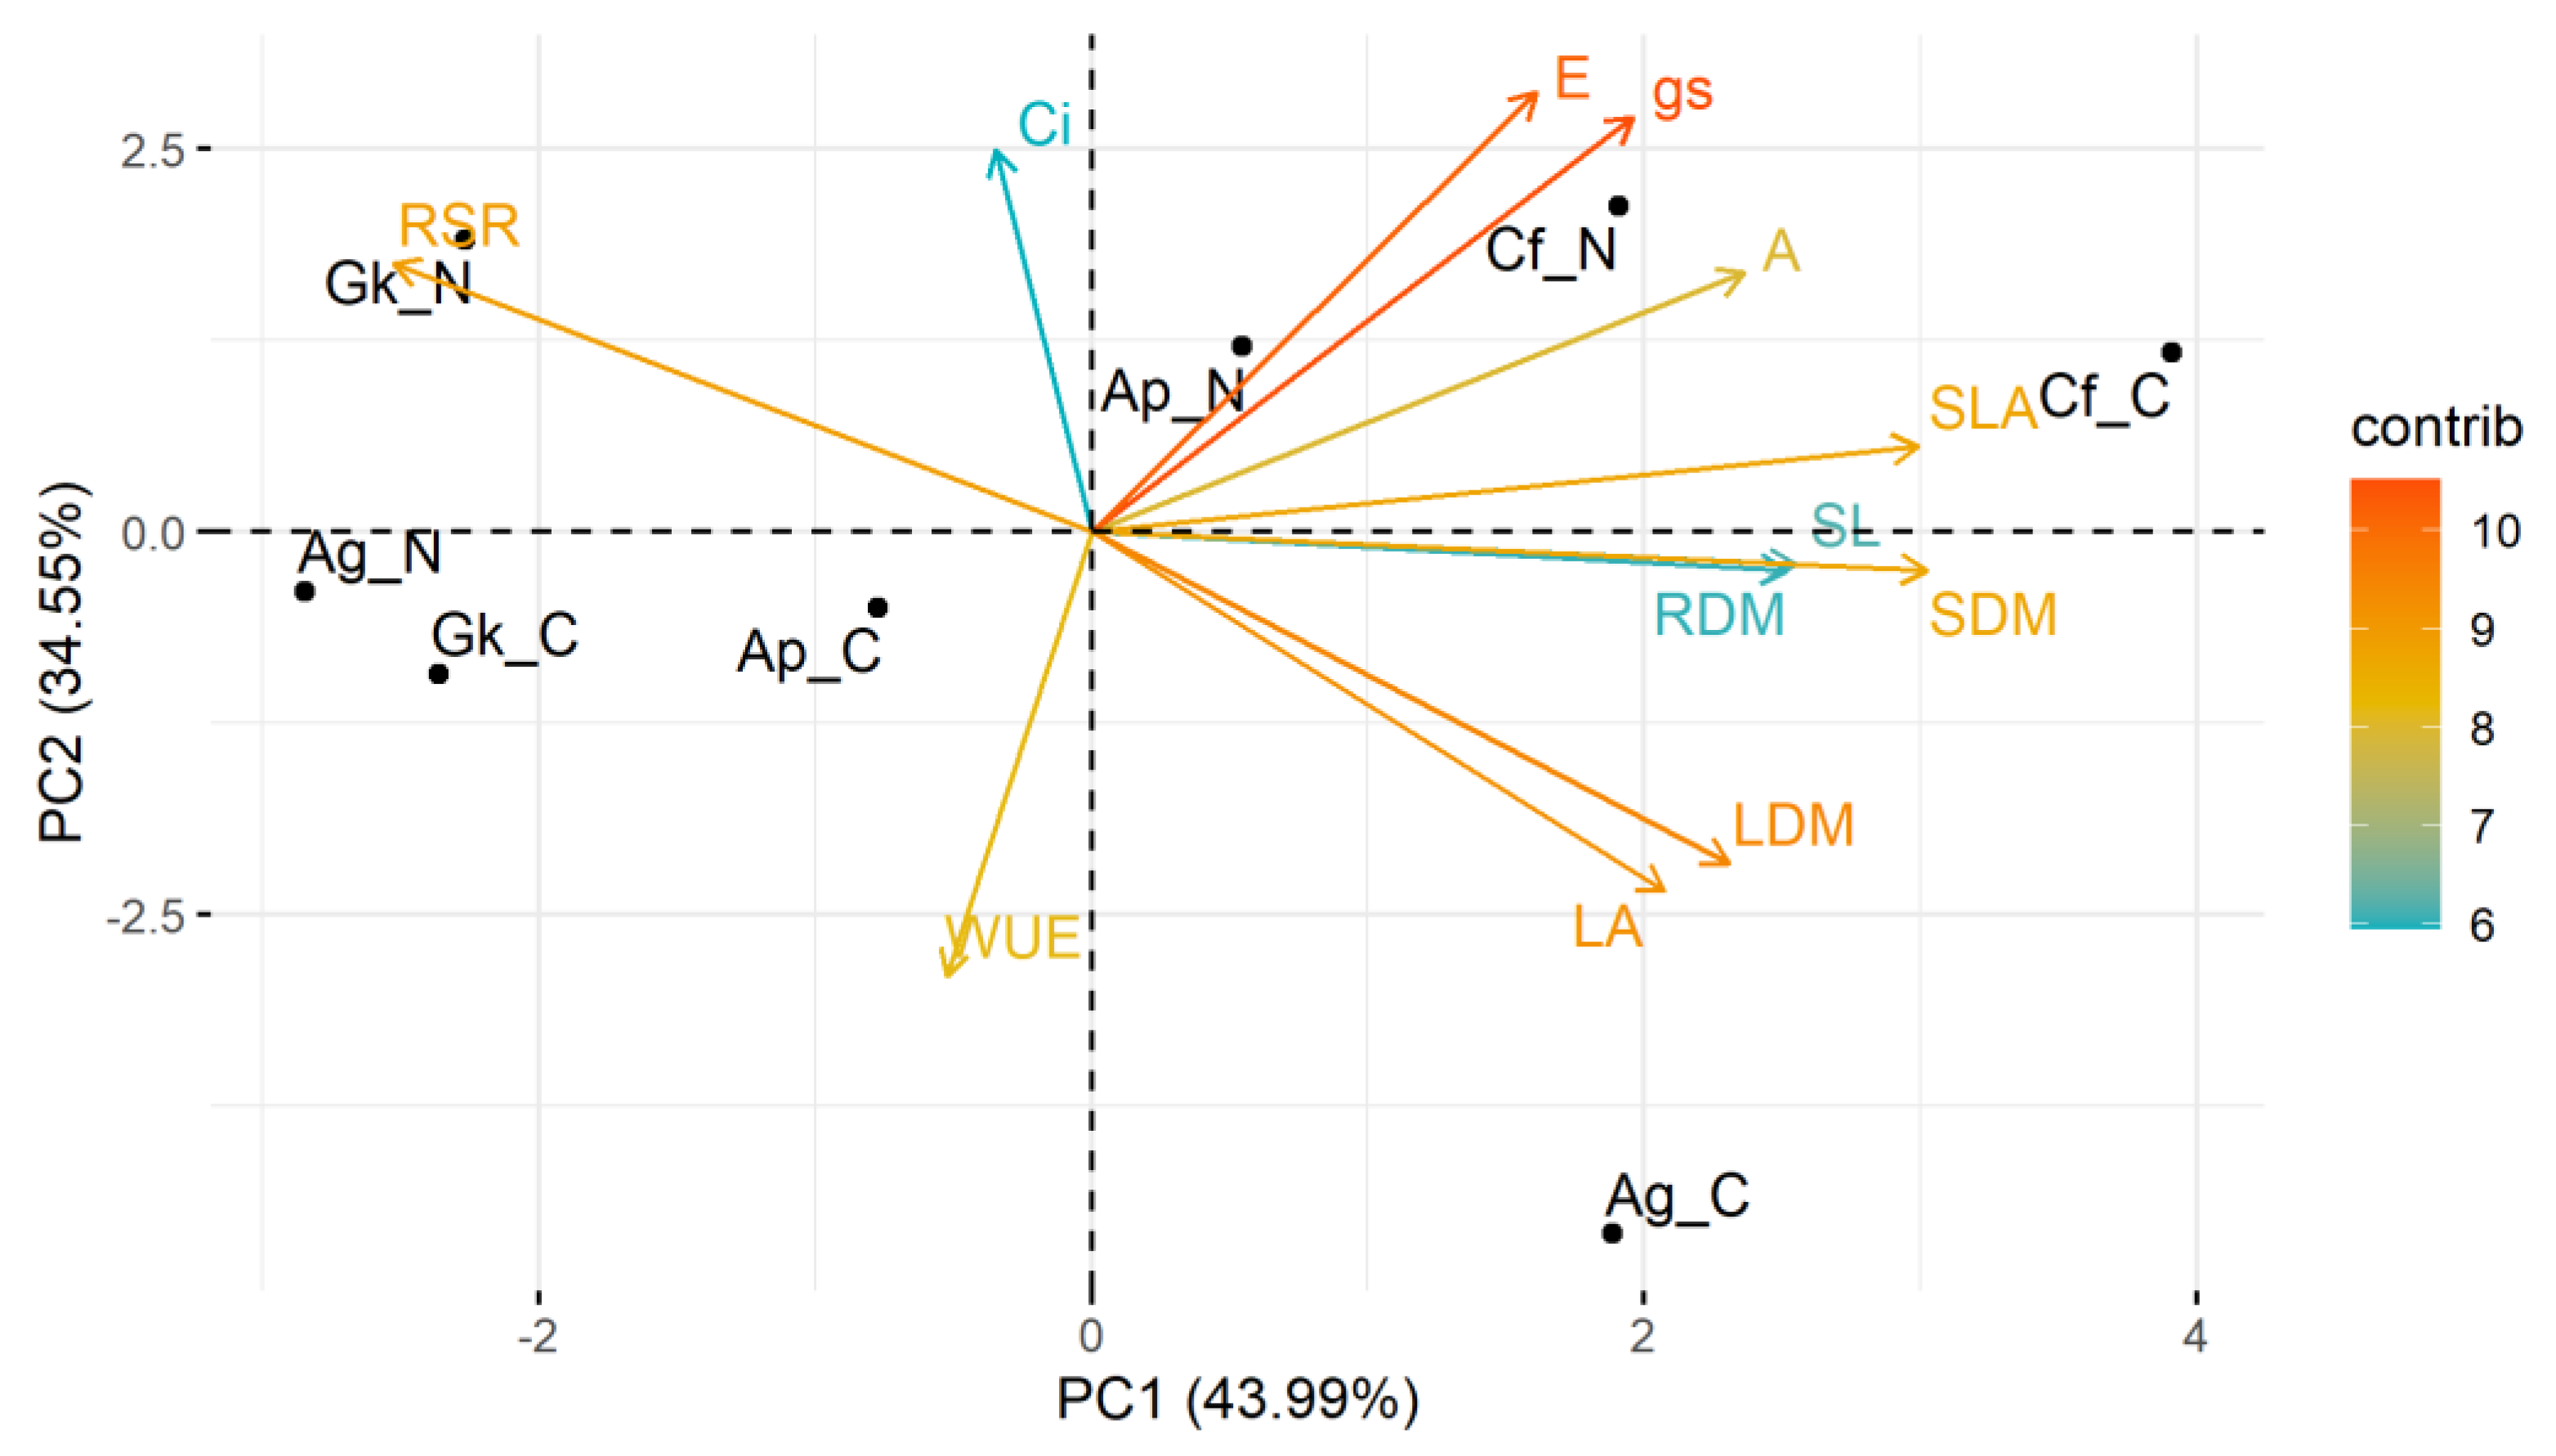
The two main components of the PCA performed with biometric and physiological data (Figure 3) explained approximately 76% of the data variance (PC1 = 44.0%; PC2 = 34.6%). Most variables (transpiration rate, stomatal conductance, net photosynthesis, leaf dry mass, stem dry mass, root dry mass, shoot length, leaf area, and specific leaf area) were on the positive side of component 1. The C. floribundus seedlings grown in treatment N and, mainly, in treatment C were positively related to these variables and negatively to the root/shoot ratio (located on the negative side of component 1).
This behavior indicates that the growth and physiology of the species C. floribundus were most positively affected by treatments N and C. Seedlings of A. graveolens in treatment C were positively related to leaf area, leaf dry mass, and WUE, but negatively related to the root/shoot ratio. The seedlings of A. graveolens in treatment N, as well as G. kunthiana seedlings in treatments N and C, were negatively related to most biometric and physiological parameters, indicating deleterious effects of these treatments. The growth and physiology of species Aspidosperma polyneuron were the least responsive to the treatments, being located very close to the intersection of the components.
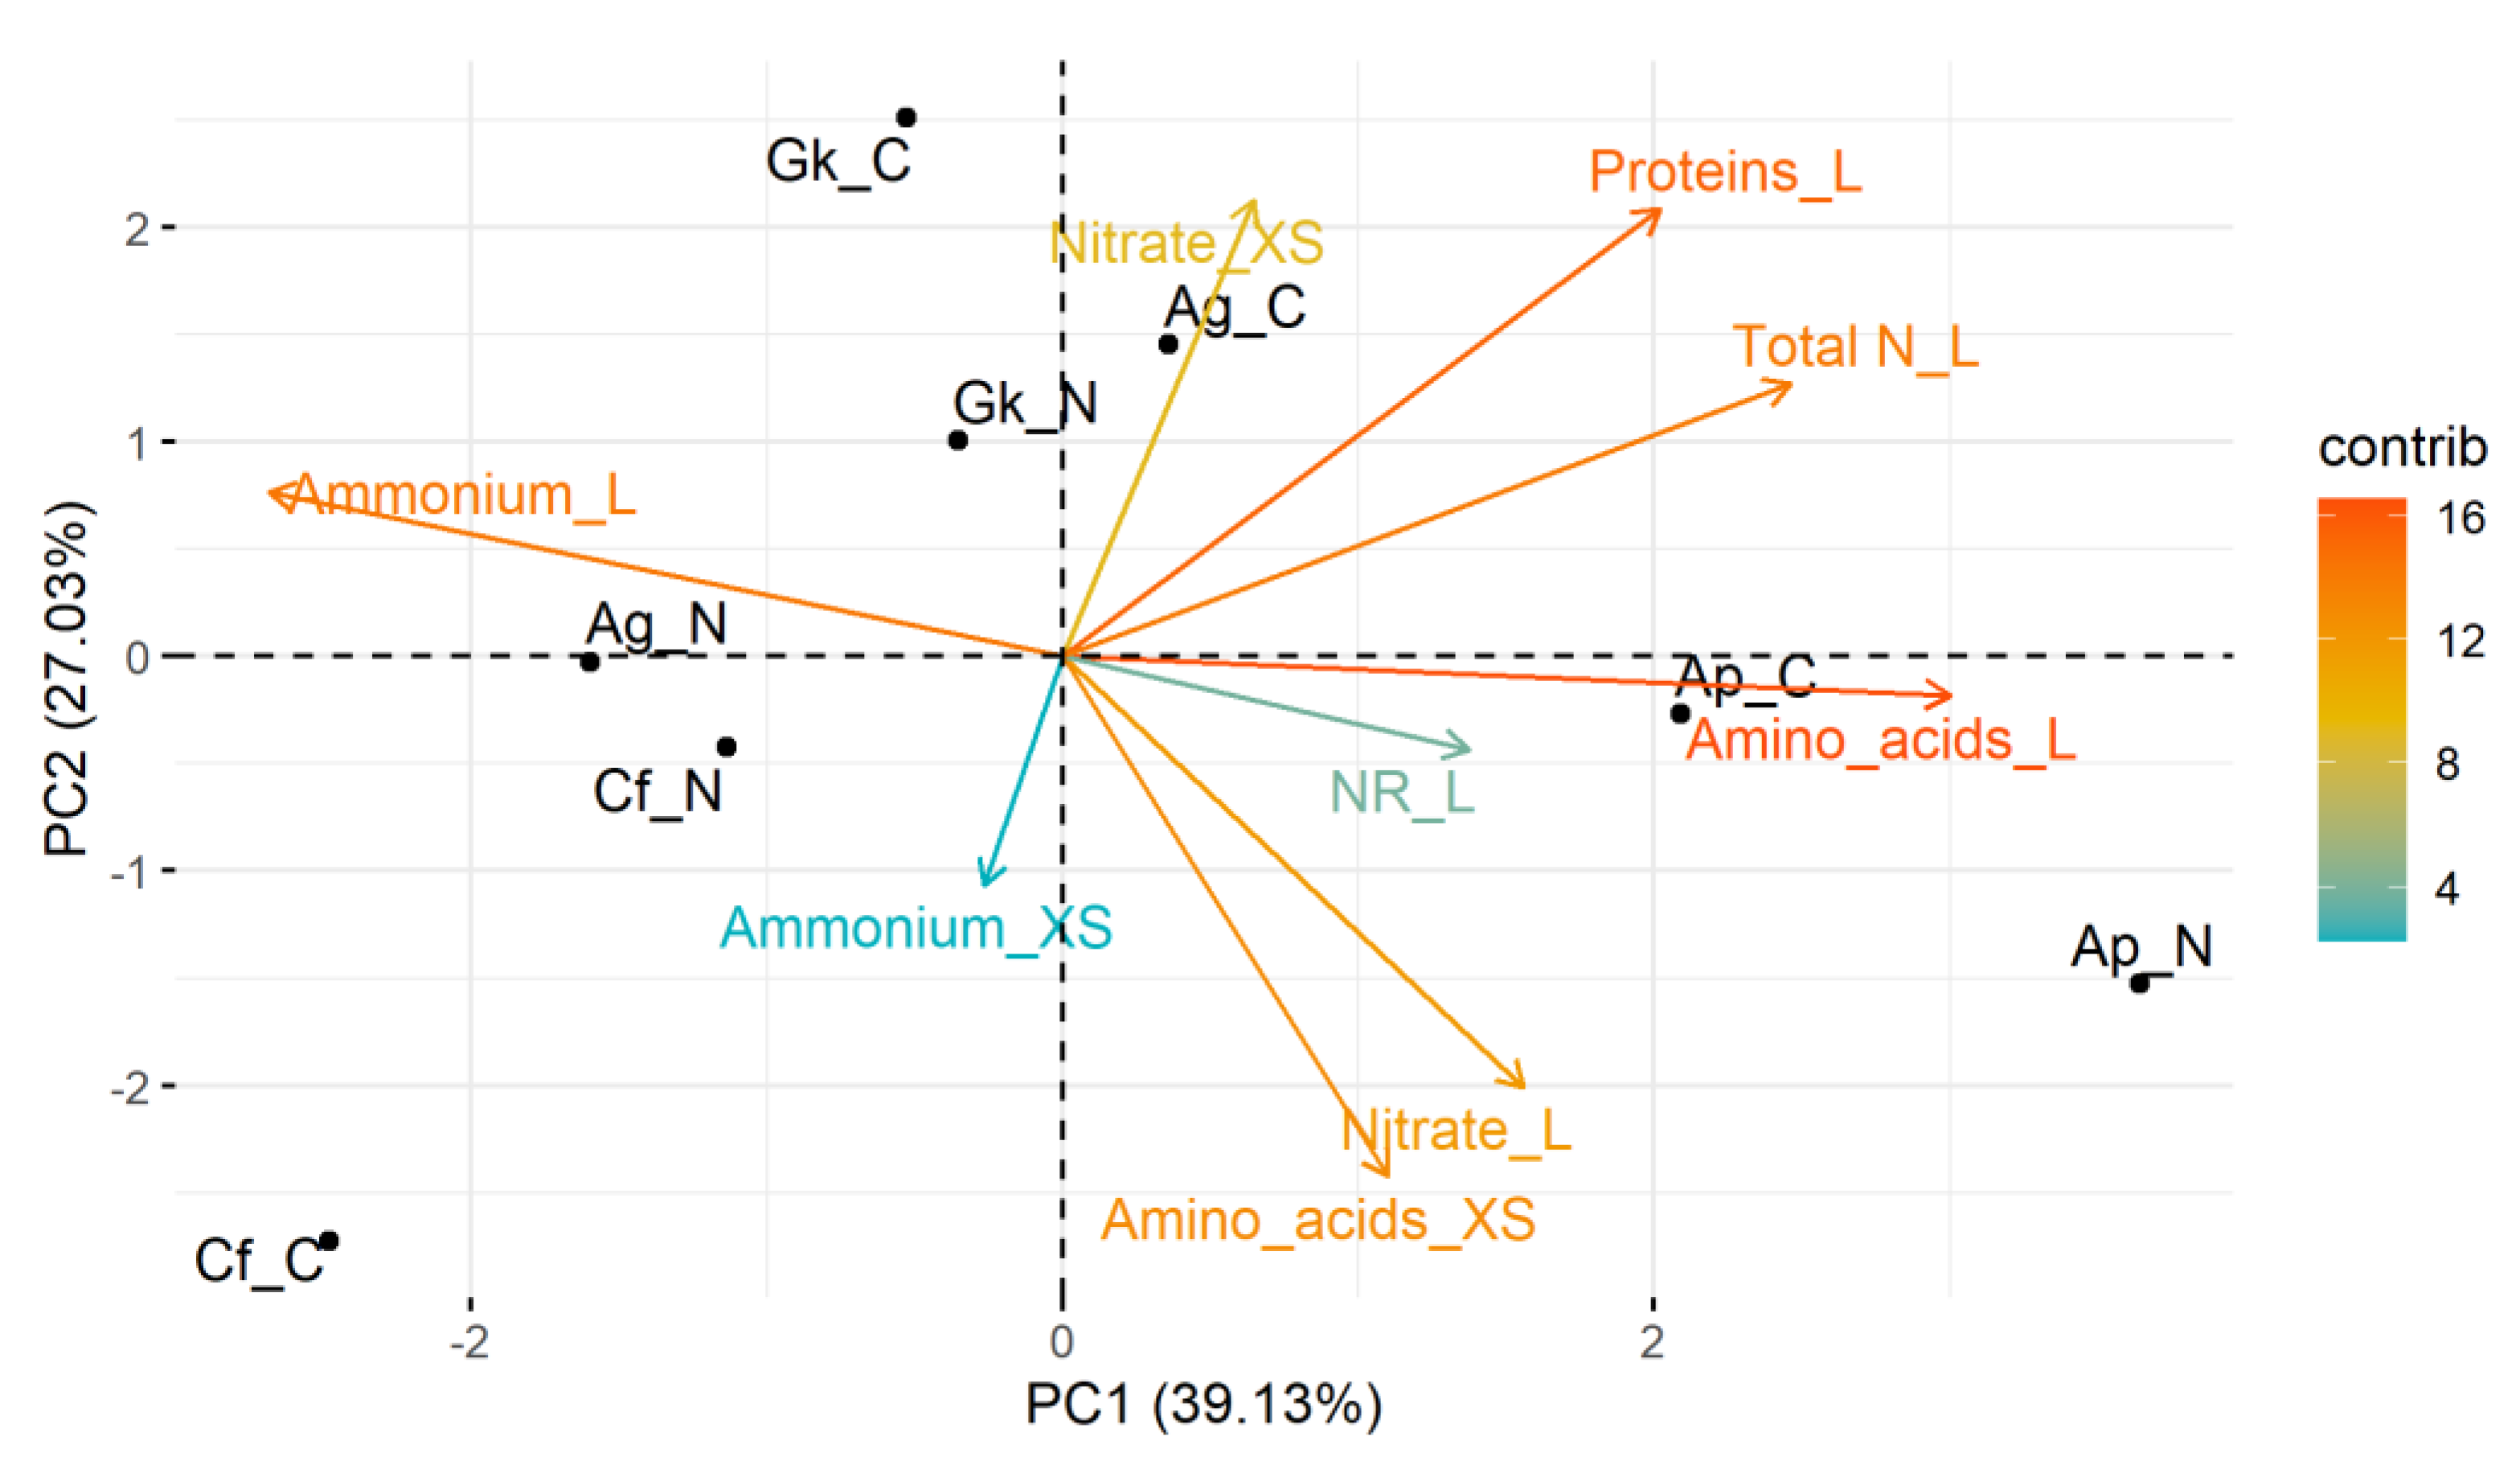
In the PCA performed with metabolic data (Figure 4), the two main components explained approximately 66% of the data variance (PC1 = 39.1%; PC2 = 27.0%). All variables (except the ammonium content in the leaves and xylem sap) were on the positive side of component 1, and correlated positively with A. polyneuron seedlings submitted to treatments C and N. Thus, A. polyneuron stood out as the most metabolically responsive species to the treatments. Considering treatment C, there was a strong negative relationship between the response of C. floribundus seedlings with the content of nitrate in the xylem sap and with total N and protein in the leaves. Of note, the variable content of ammonium in the xylem sap had the least contribution to the PCA, followed by NR activity in the leaves.

4. Discussion

The seedling responses to the addition of N to the soil are consistent with the shade tolerance of the species. Croton floribundus (shade-intolerant) responded to the soil N addition with an increase in growth and leaf gas exchange parameters. In contrast, the growth and physiology of the most shade-tolerant species (A. polyneuron) were not affected by treatment N, although seedlings grown in this treatment presented metabolic alterations that indicate N accumulation in the tissues. Guarea kunthiana and A. graveolens exhibited intermediate responses.
There were differences in the seedling responses to the addition of N alone or with other nutrients to the soil. The species C. floribundus was most affected by the N addition to the soil, in terms of growth and physiological responses. Although the addition of N alone triggered positive effects on biometric and physiological parameters, the responses were more intense when other nutrients were added together with N. In C. floribundus seedlings, there was greater investment in shoots in both treatments N and C, together with an increase in the specific leaf area, which indicates an alteration in biomass allocation and leaf morphology to increase the use of light energy [38,39]. Thus, in the short term, C. floribundus could be favored by the increase in N content in the soil, resulting in faster shoot growth. However, in the long term, this greater investment in shoots, which is not followed by investment in roots (as indicated by the lower root/shoot ratio), could hinder the performance of this species in conditions of water deficit in the soil [40].
In the moderately shade-intolerant species A. graveolens, treatment N decreased shoot length, while treatment C induced an increase in many growth and physiological parameters. Similar to C. floribundus, A. graveolens seedlings also invested more in shoot than root when treated with all nutrients, indicating that some of the nutrients (and not just N) must have limited the root growth. Astronium graveolens seedlings grown in both treatments N and C had a lower transpiration rate and stomatal conductance, which led to a higher WUE, suggesting that they were able to compensate the larger leaf area and lower root/shoot ratio exhibited by these seedlings [41].
In G. kunthiana, treatment N decreased the stem dry mass and net photosynthesis, indicating negative effects of the addition of N alone (similar to A. graveolens). Coherent with these results, Wang et al. [42] recently reported the effect of N addition to the soil in inhibiting the growth and photosynthesis of two shade-tolerant woody species in a subtropical forest. Mao et al. [19] also observed a decrease in the photosynthetic rate of moderately shade-tolerant species when adding high amounts of N to the soil. The increased availability of N can also result in nutritional imbalance, limiting the uptake of nutrients such as K, Ca, and Mg by the roots. Studies have shown that photosynthetic capacity decreases when there is a decrease in the leaf content of Ca and Mg [19]. However, when N was added with other nutrients, there was no difference in growth, although net photosynthesis, stomatal conductance, and transpiration decreased. Therefore, other nutrients may be partially offsetting the negative effect of the increased N in G. kunthiana.
Aspidosperma polyneuron seedlings did not exhibit changes in biometric parameters in response to treatments N and C. As a highly shade-tolerant species, it has a slow metabolism, low photosynthetic rate, low carbon gain, and slow growth [43,44], as well as low nutrient demand, so that the nutrient content of the reference soil was sufficient for the growth in the conditions of the experiment. Despite not presenting significant changes in biometric and physiological parameters, A. polyneuron was the species that exhibited more metabolic alterations due to the addition of N and other nutrients to the soil. As A. polyneuron has a slower metabolism, the surplus of nitrate, proteins, and total N accumulated in the leaves, which occurred in both treatments N and C. The accumulation of nitrate can enhance NR activity in the leaf [45,46,47], as well as being involved in osmotic adjustment, in which the accumulation of solutes decreases the cellular osmotic and water potential, favoring water entry into the cells [48].
In C. floribundus, treatment N increased the nitrate content in the xylem sap and in the leaves, indicating translocation of this ion from the roots to the leaves, where N is preferentially assimilated in this pioneer, shade-intolerant species [24,26,27,28]. Despite this, N addition to the soil did not increase the content of soluble proteins and total N in the leaves of C. floribundus, which may have occurred due to the use of these metabolites for the formation of new tissues and growth.
In G. kunthiana, there was an increase in total N and amino acid content in the leaves of seedlings grown in treatment N. Similar results were recorded for seedlings of Cryptocarya chinensis (Hance) Hemsl., considered mid-tolerant to shade [49], which also enhanced the amino acid content in the leaves due to increased N [19]. In the seedlings grown in treatment C, the decrease in the content of amino acids in xylem sap and the increase in the protein content in leaves indicate greater N assimilation in leaves.
In A. graveolens seedlings exposed to soil N addition, the ammonium content in the xylem sap and protein content in the leaves were enhanced. Similar results were obtained by Mao et al. [19], who verified an increase in the protein content in the leaves of Cryptocarya concinna Hance and C. chinensis trees submitted to N deposition. In A. graveolens seedlings grown in treatment C, the contents of ammonium in the leaves and amino acids in the xylem sap decreased, while the amino acid content in the leaves, as well as total N and NR activity increased.
Overall, the analysis of the metabolic parameters indicates that A. polyneuron could be a good bioindicator species of increased N in the soil, since it was the most responsive species, accumulating nitrogen compounds mainly in the leaves. Therefore, it could be used in field assessments in forest fragments to verify if the increase in N in the soil due to human activities is affecting the plant community. It is noteworthy that A. polyneuron seedlings are very abundant in the forest understory and this species is widely distributed in Seasonal Forests [50], which contributes to its value as a potential bioindicator species. In addition, it would be interesting to investigate whether other highly shade-tolerant species follow this pattern of response to N addition, which would increase the number of alternatives of bioindicator species.
Croton floribundus, on the other hand, exhibited very different responses between treatments N and C, besides having less accumulation of N compounds. Our study highlights the importance of assessing more parameters of the N metabolism in addition to total N in leaves because, in many situations, the leaf total N was not affected by the increase in N in the soil, as seen here for C. floribundus and reported by Roth et al. [51] for other broad-leaved trees. This species did not present changes in the leaf total N in treatments N or C, but when analyzing different metabolic parameters, an increase in nitrate was found in the leaves. In addition, the analysis of xylem sap is also relevant, as it provides relevant information about the N translocation in the plant.
The functional group and phenology of the species should also be considered, as C. floribundus and A. polyneuron represent contrasting strategies in terms of leaf production and maintenance. While C. floribundus is a deciduous species with rapid leaf turnover, which produces new leaves acclimated to the new condition (as evidenced by the SLA change in N treatments), A. polyneuron is a slow-growing, evergreen species, with slower leaf production, which stores surplus N from the soil in its leaves. Evergreen woody species tend to be slow-growing and show resource-conservative behaviors [52], while deciduous trees with a slow leaf life span have comparatively less N stored in the leaves [53]. Thus, it should be taken into account that the contrasting responses demonstrated by these two species can be influenced by the differences in their phenologies and in the functional groups to which they belong. For a more adequate comparison of responses between pioneer and late-successional neotropical species to N addition, more species should be added to the study.
The content of ammonium in the xylem sap was not very responsive to the treatments, as this ion is very little translocated and accumulated by the plant due to its toxicity [7,54]. Thus, it should not be indicated as a biomarker, or of NR activity. Nitrate is less toxic than ammonium and the plant can accumulate and translocate high amounts of nitrate in the xylem sap, which suggests that it could be a good biomarker in the studied species. The integrated analysis of several metabolic parameters allows a broader view of N metabolism than simply assessing total N in the leaves, which is more common in the literature.

5. Conclusions

In summary, growth changes in response to N addition occurred only in the fast-growing, shade-intolerant species, especially C. floribundus, which also showed increased photosynthesis rate in treatment with complete nutrient solution. Astronium graveolens and the two shade-tolerant species (G. kunthiana and A. polyneuron) presented metabolic alterations with increasing N, but in A. polyneuron the responses were more remarkable. Therefore, A. polyneuron is recommended as the best bioindicator of N increase in the soil among the four evaluated tree species, due to its noteworthy response to high N content in the soil, accumulating nitrogen compounds in the leaves.

Supplementary Materials

The following supporting information can be downloaded at: https://www.mdpi.com/article/10.3390/f14061111/s1, Table S1: Metabolic traits of Croton floribundus (Cf), Astronium graveolens (Ag), Guarea kunthiana (Gk), and Aspidosperma polyneuron (Ap) seedlings treated with nitrogen (N) or complete nutrient solution (C) in the soil. Reference plants (R) were irrigated solely with water. Nitrate_XS: nitrate content in the xylem sap; Nitrate_L: nitrate content in the leaf; Ammonium_XS: ammonium content in the xylem sap; Ammonium_L: ammonium content in the leaf; Amino acid_XS: total content of amino acids in the xylem sap; Amino acid_L: total content of amino acids in the leaf; Protein_L: total content of soluble proteins in the leaf; NR_L: nitrate reductase activity in the leaf; Total N_L: total N content in the leaf; FM: fresh mass; DM: dry mass. Data are mean ± SE (n = 4). Equal letters for the same species indicate values that do not differ according to ANOVA followed by Fisher’s test (p < 0.05).

Author Contributions

L.R.B., J.M.D.T., R.S.-M., E.B., J.A.P. and H.C.O. designed the research. L.R.B., T.V.D., K.S. and A.B.L.R. carried out the experiments. L.R.B., T.V.D. and H.C.O. analyzed the data. L.R.B., A.B.L.R. and H.C.O. drafted the manuscript. All authors have read and agreed to the published version of the manuscript.

Funding

This research was funded by the Conselho Nacional de Desenvolvimento Científico e Tecnológico (H.C.O., Fellowships 306583/2017-8, 311034/2020-9; H.C.O., R.S.-M., J.M.D.T., J.A.P. and E.B., Grant PELD 441540/2016-3, 441510/2020-5) and Fundação Araucária de Apoio ao Desenvolvimento Científico e Tecnológico do Paraná (H.C.O., R.S.-M., J.M.D.T., J.A.P. and E.B., Grant PELD 155/2017). This study was financed in part by the Coordenação de Aperfeiçoamento de Pessoal de Nível Superior—Brasil (CAPES)—Finance Code 001 (L.R.B., T.V.D., K.S.). The APC was funded by CAPES/PDPG-CONSOLIDACAO-3-4 (2070/2022/88881.709798/2022-01).

Data Availability Statement

Data is available upon request to the corresponding authors.

Conflicts of Interest

The authors declare no conflict of interest.

References

  1. Galloway, J.N.; Townsend, A.R.; Erisman, J.W.; Bekunda, M.; Cai, Z.; Freney, J.R.; Martinelli, L.A.; Seitzinger, S.P.; Sutton, M.A. Transformation of the Nitrogen Cycle: Recent Trends, Questions, and Potential Solutions. Science 2008, 320, 889–892. [Google Scholar] [CrossRef] [PubMed]
  2. Bebber, D.P. The gap between atmospheric nitrogen deposition experiments and reality. Sci. Total Environ. 2021, 801, 149774. [Google Scholar] [CrossRef] [PubMed]
  3. Matson, P.A.; McDowell, W.H.; Townsend, A.R.; Vitousek, P.M. The globalization of N deposition: Ecosystem consequences in tropical environments. Biogeochemistry 1999, 46, 67–83. [Google Scholar] [CrossRef]
  4. Wang, L.; Huang, D. Nitrogen and phosphorus losses by surface runoff and soil microbial communities in a paddy field with different irrigation and fertilization managements. PLoS ONE 2021, 16, e0254227. [Google Scholar] [CrossRef]
  5. Liu, D.; Song, C.; Fang, C.; Xin, Z.; Xi, J.; Lu, Y. A recommended nitrogen application strategy for high crop yield and low environmental pollution at a basin scale. Sci. Total Environ. 2021, 792, 148464. [Google Scholar] [CrossRef]
  6. Britto, D.T.; Kronzucker, H. NH4+ toxicity in higher plants: A critical review. J. Plant Physiol. 2002, 159, 567–584. [Google Scholar] [CrossRef]
  7. Vega-Mas, I.; Cukier, C.; Coleto, I.; González-Murua, C.; Limami, A.M.; González-Moro, M.B.; Marino, D. Isotopic labelling reveals the efficient adaptation of wheat root TCA cycle flux modes to match carbon demand under ammonium nutrition. Sci. Rep. 2019, 9, 8925. [Google Scholar] [CrossRef]
  8. Gilliam, F.S. Responses of Forest Ecosystems to Nitrogen Deposition. Forests 2021, 12, 1190. [Google Scholar] [CrossRef]
  9. Gundale, M.J. The impact of anthropogenic nitrogen deposition on global forests: Negative impacts far exceed the carbon benefits. Glob. Chang. Biol. 2022, 28, 690–692. [Google Scholar] [CrossRef]
  10. Li, W.; Zhang, H.; Huang, G.; Liu, R.; Wu, H.; Zhao, C.; McDowell, N.G. Effects of nitrogen enrichment on tree carbon allocation: A global synthesis. Glob. Ecol. Biogeogr. 2020, 29, 573–589. [Google Scholar] [CrossRef]
  11. Lu, X.K.; Mo, J.M.; Gilliam, F.S.; Zhou, G.Y.; Fang, Y.T. Effects of experimental nitrogen additions on plant diversity in an old-growth tropical forest. Glob. Chang. Biol. 2010, 16, 2688–2700. [Google Scholar] [CrossRef]
  12. Schulte-Uebbing, L.; De Vries, W. Global-scale impacts of nitrogen deposition on tree carbon sequestration in tropical, temperate, and boreal forests: A meta-analysis. Glob. Chang. Biol. 2018, 24, e416–e431. [Google Scholar] [CrossRef] [PubMed]
  13. Schulte-Uebbing, L.F.; Ros, G.H.; de Vries, W. Experimental evidence shows minor contribution of nitrogen deposition to global forest carbon sequestration. Glob. Chang. Biol. 2021, 28, 899–917. [Google Scholar] [CrossRef] [PubMed]
  14. Jiang, L.; Tian, D.; Ma, S.; Zhou, X.; Xu, L.; Zhu, J.; Jing, X.; Zheng, C.; Shen, H.; Zhou, Z.; et al. The response of tree growth to nitrogen and phosphorus additions in a tropical montane rainforest. Sci. Total Environ. 2018, 618, 1064–1070. [Google Scholar] [CrossRef]
  15. Santiago, L.S.; Wright, S.J.; Harms, K.E.; Yavitt, J.B.; Korine, C.; Garcia, M.N.; Turner, B.L. Tropical tree seedling growth responses to nitrogen, phosphorus and potassium addition. J. Ecol. 2012, 100, 309–316. [Google Scholar] [CrossRef]
  16. Cárate-Tandalla, D.; Leuschner, C.; Homeier, J. Performance of Seedlings of a Shade-Tolerant Tropical Tree Species after Moderate Addition of N and P. Front. Earth Sci. 2015, 3, 75. [Google Scholar] [CrossRef]
  17. Pasquini, S.C.; Santiago, L.S. Nutrients limit photosynthesis in seedlings of a lowland tropical forest tree species. Oecologia 2012, 168, 311–319. [Google Scholar] [CrossRef]
  18. Mao, Q.; Lu, X.; Wang, C.; Zhou, K.; Mo, J. Responses of understory plant physiological traits to a decade of nitrogen addition in a tropical reforested ecosystem. For. Ecol. Manag. 2017, 401, 65–74. [Google Scholar] [CrossRef]
  19. Mao, Q.; Lu, X.; Mo, H.; Gundersen, P.; Mo, J. Effects of simulated N deposition on foliar nutrient status, N metabolism and photosynthetic capacity of three dominant understory plant species in a mature tropical forest. Sci. Total Environ. 2018, 610–611, 555–562. [Google Scholar] [CrossRef]
  20. Mo, J.; Li, D.; Gundersen, P. Seedling growth response of two tropical tree species to nitrogen deposition in southern China. Eur. J. For. Res. 2008, 127, 275–283. [Google Scholar] [CrossRef]
  21. Tripathi, S.N.; Raghubanshi, A.S. Seedling growth of five tropical dry forest tree species in relation to light and nitrogen gradients. J. Plant Ecol. 2014, 7, 250–263. [Google Scholar] [CrossRef]
  22. Gargallo-Garriga, A.; Wright, S.J.; Sardans, J.; Pérez-Trujillo, M.; Oravec, M.; Večeřová, K.; Urban, O.; Fernández-Martínez, M.; Parella, T.; Peñuelas, J. Long-term fertilization determines different metabolomic profiles and responses in saplings of three rainforest tree species with different adult canopy position. PLoS ONE 2017, 12, e0177030. [Google Scholar] [CrossRef] [PubMed]
  23. Liu, N.; Wu, S.; Guo, Q.; Wang, J.; Cao, C.; Wang, J. Leaf nitrogen assimilation and partitioning differ among subtropical forest plants in response to canopy addition of nitrogen treatments. Sci. Total Environ. 2018, 637–638, 1026–1034. [Google Scholar] [CrossRef] [PubMed]
  24. Aidar, M.P.M.; Schmidt, S.; Moss, G.; Stewart, G.R.; Joly, C.A. Nitrogen use strategies of neotropical rainforest trees in threatened Atlantic Forest. Plant Cell Environ. 2003, 26, 389–399. [Google Scholar] [CrossRef]
  25. Kronzucker, H.J.; Siddiqi, M.Y.; Glass, A.D.M.; Britto, D.T. Root ammonium transport efficiency as a determinant in forest colonization patterns: An hypothesis. Physiol. Plant. 2003, 117, 164–170. [Google Scholar] [CrossRef]
  26. Oliveira, H.C.; da Silva, L.M.I.; de Freitas, L.D.; Debiasi, T.V.; Marchiori, N.M.; Aidar, M.P.M.; Bianchini, E.; Pimenta, J.A.; Stolf-Moreira, R. Nitrogen use strategies of seedlings from neotropical tree species of distinct successional groups. Plant Physiol. Biochem. 2017, 114, 119–127. [Google Scholar] [CrossRef]
  27. Debiasi, T.V.; Calzavara, A.K.; da Silva, L.M.I.; da Silva, J.G.; Bianchini, E.; Pimenta, J.A.; Stolf-Moreira, R.; Aidar, M.P.M.; Sodek, L.; Oliveira, H.C. Nitrogen metabolism of Neotropical tree seedlings with contrasting ecological characteristics. Acta Physiol. Plant. 2019, 41, 131. [Google Scholar] [CrossRef]
  28. Debiasi, T.V.; Calzavara, A.K.; Sodek, L.; Oliveira, H.C. Nitrogen use plasticity in response to light intensity in neotropical tree species of distinct functional groups. Physiol. Plant. 2021, 172, 2226–2237. [Google Scholar] [CrossRef]
  29. Díaz-Álvarez, E.A.; Lindig-Cisneros, R.; de la Barrera, E. Biomonitors of atmospheric nitrogen deposition: Potential uses and limitations. Conserv. Physiol. 2018, 6, coy011. [Google Scholar] [CrossRef]
  30. FAO—Food and Agriculture Organization of the United Nations. Soil Map of the World; FAO-UNESCO: Rome, Italy, 1994. [Google Scholar]
  31. Oliveira, H.C.; Sodek, L. Effect of oxygen deficiency on nitrogen assimilation and amino acid metabolism of soybean root segments. Amino Acids 2013, 44, 743–755. [Google Scholar] [CrossRef]
  32. Miranda, K.M.; Espey, M.G.; Wink, D.A. A Rapid, Simple Spectrophotometric Method for Simultaneous Detection of Nitrate and Nitrite. Nitric Oxide 2001, 5, 62–71. [Google Scholar] [CrossRef] [PubMed]
  33. McCullough, H. The determination of ammonia in whole blood by a direct colorimetric method. Clin. Chim. Acta 1967, 17, 297–304. [Google Scholar] [CrossRef] [PubMed]
  34. Yemm, E.W.; Cocking, E.C.; Ricketts, R.E. The determination of amino-acids with ninhydrin. Analyst 1955, 80, 209–214. [Google Scholar] [CrossRef]
  35. Bradford, M.M. A rapid and sensitive method for the quantitation of microgram quantities of protein utilizing the principle of protein-dye binding. Anal. Biochem. 1976, 72, 248–254. [Google Scholar] [CrossRef] [PubMed]
  36. Stewart, G.R.; Popp, M.; Holzapfel, I.; Stewart, J.A.; Dickie-Eskew, A. Localization of nitrate reduction in ferns and its relationship to environment and physiological characteristics. New Phytol. 1986, 104, 373–384. [Google Scholar] [CrossRef]
  37. Willis, R.B.; Montgomery, M.E.; Allen, P.R. Improved Method for Manual, Colorimetric Determination of Total Kjeldahl Nitrogen Using Salicylate. J. Agric. Food Chem. 1996, 44, 1804–1807. [Google Scholar] [CrossRef]
  38. Santos, J.B.; Procópio, S.O.; Silva, A.A.; Costa, L.C. Captação e aproveitamento da radiação solar pelas culturas de soja e do feijão e por plantas daninhas. Bragantia 2003, 62, 147–153. [Google Scholar] [CrossRef]
  39. Liu, M.; Chen, S.; Korpelainen, H.; Zhang, H.; Wang, J.; Huang, H.; Yi, L. Nitrogen addition affects eco-physiological interactions between two tree species dominating in subtropical forests. Plant Physiol. Biochem. 2021, 162, 150–160. [Google Scholar] [CrossRef]
  40. Gessler, A.; Schaub, M.; McDowell, N.G. The role of nutrients in drought-induced tree mortality and recovery. New Phytol. 2017, 214, 513–520. [Google Scholar] [CrossRef] [PubMed]
  41. Mott, K.A.; Franks, P.J. The role of epidermal turgor in stomatal interactions following a local perturbation in humidity. Plant Cell Environ. 2001, 24, 657–662. [Google Scholar] [CrossRef]
  42. Wang, J.; Hui, D.; Ren, H.; Liu, N.; Sun, Z.; Yang, L.; Lu, H. Short-term canopy and understory nitrogen addition differ in their effects on seedlings of dominant woody species in a subtropical evergreen broadleaved forest. Glob. Ecol. Conserv. 2021, 31, e01855. [Google Scholar] [CrossRef]
  43. Kitajima, K. Relative importance of photosynthetic traits and allocation patterns as correlates of seedling shade tolerance of 13 tropical trees. Oecologia 1994, 98, 419–428. [Google Scholar] [CrossRef] [PubMed]
  44. Pascual, J.; Rahikainen, M.; Kangasjärvi, S. Plant Light Stress; John Wiley & Sons: Hoboken, NJ, USA, 2017; pp. 1–6. [Google Scholar] [CrossRef]
  45. Kaiser, W.M.; Huber, S.C. Post-translational regulation of nitrate reductase: Mechanism, physiological relevance and environmental triggers. J. Exp. Bot. 2001, 52, 1981–1989. [Google Scholar] [CrossRef] [PubMed]
  46. Ali, A. Nitrate assimilation pathway in higher plants: Critical role in nitrogen signalling and utilization. Plant Sci. Today 2020, 7, 182–192. [Google Scholar] [CrossRef]
  47. Baslam, M.; Mitsui, T.; Sueyoshi, K.; Ohyama, T. Recent Advances in Carbon and Nitrogen Metabolism in C3 Plants. Int. J. Mol. Sci. 2021, 22, 318. [Google Scholar] [CrossRef]
  48. Chaves-Filho, J.T.; Stacciarini-Seraphin, E. Alteração no potencial osmótico e teor de carboidratos solúveis em plantas jovens de lobeira (Solanum lycocarpum St.-Hil) em resposta ao estresse hídrico. Braz. J. Bot. 2001, 24, 199–204. [Google Scholar] [CrossRef]
  49. Ma, L.; Lian, J.; Lin, G.; Cao, H.; Huang, Z.; Guan, D. Forest dynamics and its driving forces of sub-tropical forest in South China. Sci. Rep. 2016, 6, 22561. [Google Scholar] [CrossRef]
  50. Carvalho, P.E.R. Espécies Arbóreas Brasileiras; Embrapa Informação Tecnológica: Brasília, Brazil, 2003; Volume 1, Available online: https://www.embrapa.br/florestas/publicacoes/especies-arboreas-brasileiras (accessed on 8 January 2022).
  51. Roth, M.; Günther, K.; Michiels, H.-G.; Puhlmann, H.; Sucker, C.; Hauck, M. Nitrogen deposition is positively correlated to foliar nitrogen content in Vaccinium myrtillus and other understory species in temperate forests on acidic soil. Acta Oecologica 2021, 110, 103696. [Google Scholar] [CrossRef]
  52. Poorter, H.; Niinemets, Ü.; Poorter, L.; Wright, I.J.; Villar, R. Causes and consequences of variation in leaf mass per area (LMA): A meta-analysis. New Phytol. 2009, 182, 565–588. [Google Scholar] [CrossRef]
  53. Khan, A.; Yan, L.; Hasan, M.M.; Wang, W.; Zou, G.; Liu, X.D.; Fang, X.W. Leaf traits and leaf nitrogen shift photosynthesis adaptive strategies among functional groups and diverse biomes. Ecol. Indic. 2022, 141, 109098. [Google Scholar] [CrossRef]
  54. Britto, D.T.; Siddiqi, M.Y.; Glass, A.D.M.; Kronzucker, H.J. Futile transmembrane NH4+ cycling: A cellular hypothesis to explain ammonium toxicity in plants. Proc. Natl. Acad. Sci. USA 2001, 98, 4255–4258. [Google Scholar] [CrossRef] [PubMed]
Figure 1. (A) Net photosynthesis (A), (B) transpiration (E), (C) water use efficiency (WUE), (D) stomatal conductance (gs), and (E) intercellular CO2 concentration (Ci) of Croton floribundus (Cf), Astronium graveolens (Ag), Guarea kunthiana (Gk), and Aspidosperma polyneuron (Ap) seedlings treated with water (reference: R), solely with nitrogen (N), and with complete nutrient solution (C). Data are mean ± SE (n = 10). Equal letters for the same species indicate values that do not differ according to ANOVA followed by Fisher’s test (p < 0.05).
Forests 14 01111 g001
Figure 2. Metabolic responses of (A) Croton floribundus (Cf), (B) Astronium graveolens (Ag), (C) Guarea kunthiana (Gk), and (D) Aspidosperma polyneuron (Ap) seedlings to the addition of nitrogen (N) and complete nutrient solution (C), in relation to the reference without nutrient addition. Nitrate_XS: nitrate content in the xylem sap; Nitrate_L: nitrate content in the leaf; Ammonium_XS: ammonium content in the xylem sap; Ammonium_L: ammonium content in the leaf; Amino acid_XS: total content of amino acids in the xylem sap; Amino acid_L: total content of amino acids in the leaf; Protein_L: total content of soluble proteins in the leaf; NR_L: nitrate reductase activity in the leaf; Total N_L: total N content in the leaf. Areas above and below 0 indicate, respectively, an increase and decrease in the trait in relation to the reference. Asterisks indicate significant difference between the treatment and the reference according to ANOVA followed by Fisher’s test (p < 0.05).
Forests 14 01111 g002
Figure 3. Principal component analysis based on the response of biometric and physiological traits of Croton floribundus (Cf), Astronium graveolens (Ag), Guarea kunthiana (Gk), and Aspidosperma polyneuron (Ap) seedlings to the addition of nitrogen (N) and complete nutrient solution (C), in relation to reference without nutrient addition. A: net photosynthesis; Ci. intercellular CO2 concentration; E: transpiration; gs: stomatal conductance; LA. leaf area; LDM. leaf dry mass; RDM. root dry mass; RSR. root-to-shoot dry mass ratio; SDM. stem dry mass; SL. shoot length; SLA. specific leaf area; WUE. water use efficiency. Contrib is the contribution value (in percentage) of each variable to the principal components.
Forests 14 01111 g003
Figure 4. Principal component analysis based on the response of metabolic traits of Croton floribundus (Cf), Astronium graveolens (Ag), Guarea kunthiana (Gk), and Aspidosperma polyneuron (Ap) seedlings to the addition of nitrogen (N) and complete nutrient solution (C), in relation to reference without nutrient addition. Nitrate_XS: nitrate content in the xylem sap; Nitrate_L: nitrate content in the leaf; Ammonium_XS: ammonium content in the xylem sap; Ammonium_L: ammonium content in the leaf; Amino acid_XS: total content of amino acids in the xylem sap; Amino acid_L: total content of amino acids in the leaf; Protein_L: total content of soluble proteins in the leaf; NR_L: nitrate reductase activity in the leaf; Total N_L: total N content in the leaf. Contrib is the contribution value (in percentage) of each variable to the principal components.
Forests 14 01111 g004
Table 1. Biometric traits of Croton floribundus (Cf), Astronium graveolens (Ag), Guarea kunthiana (Gk), and Aspidosperma polyneuron (Ap) seedlings treated with nitrogen (N) or complete nutrient solution (C) in the soil. Reference plants (R) were irrigated solely with water. LA, leaf area; LDM, leaf dry mass; RDM, root dry mass; RSR, root-to-shoot dry mass ratio; SDM, stem dry mass; SL, shoot length; SLA, specific leaf area. Data are mean ± SE (n = 10). Equal letters for the same species indicate values that do not differ according to ANOVA followed by Fisher’s test (p < 0.05).
SpeciesCfAgGkAp
TreatmentRNCRNCRNCRNC
RDM (g)0.306 ± 0.025 a0.329 ± 0.020 a0.345 ± 0.029 a0.045 ± 0.004 a0.042 ± 0.005 a0.052 ± 0.006 a0.393 ± 0.030 a0.343 ± 0.028 a0.372 ± 0.026 a0.120 ± 0.009 a0.156 ± 0.011 a0.141 ± 0.008 a
SDM (g)0.258 ± 0.019 b0.343 ± 0.021 b0.548 ± 0.043 a0.033 ± 0.003 a0.024 ± 0.002 a0.088 ± 0.032 a0.260 ± 0.017 a0.223 ± 0.011 b0.258 ± 0.018 a0.092 ± 0.008 a0.076 ± 0.007 a0.076 ± 0.004 a
LDM (g)0.361 ± 0.039 c0.492 ± 0.036 b0.601 ± 0.036 a0.027 ± 0.003 b0.028 ± 0.002 b0.102 ± 0.013 a0.300 ± 0.033 a0.241 ± 0.033 a0.300 ± 0.046 a0.056 ± 0.015 a0.054 ± 0.008 a0.072 ± 0.014 a
RSR (g g−1)0.504 ± 0.019 a0.405 ± 0.030 b0.302 ± 0.018 c0.945 ± 0.239 a0.894 ± 0.129 a0.324 ± 0.043 b0.748 ± 0.084 a0.769 ± 0.070 a0.731 ± 0.095 a0.778 ± 0.090 a0.957 ± 0.104 a0.907 ± 0.984 a
SL (cm)16.32 ± 0.674 b18.3 ± 0.957 b23.53 ± 1.123 a9.717 ± 1.045 b5.164 ± 0.377 c12.52 ± 0.767 a11.64 ± 0.483 a11.76 ± 0.476 a12.81 ± 0.426 a9.68 ± 0.409 a10.8 ± 0.423 a10.96 ± 0.296 a
LA (cm2)137.4 ± 15.71 c193.4 ± 16.25 b262.0 ± 13.42 a7.576 ± 0.799 b8.466 ± 0.668 b33.24 ± 4.589 a58.92 ± 6.317 a48.84 ± 7.546 a61.12 ± 10.73 a25.97 ± 2.38 a20.18 ± 2.13 a26.41 ± 2.035 a
SLA (cm2 g−1)378.4 ± 10.29 c400.3 ± 7.889 b446.3 ± 6.680 a283.9 ± 15.51 a281.1 ± 11.71 a308.8 ± 10.34 a195.3 ± 4.509 a195.6 ± 6.093 a194.3 ± 4.862 a615.2 ± 283.9 a407.9 ± 34.73 a343.1 ± 55.66 a
Disclaimer/Publisher’s Note: The statements, opinions and data contained in all publications are solely those of the individual author(s) and contributor(s) and not of MDPI and/or the editor(s). MDPI and/or the editor(s) disclaim responsibility for any injury to people or property resulting from any ideas, methods, instructions or products referred to in the content.