Article

Assessing Wildfire Hazard in the Wildland–Urban Interfaces (WUIs) of Central Portugal

by
Adélia N. Nunes
1,2,3,*,
Albano Figueiredo
1,2,3,
Carlos Pinto
1,3 and
Luciano Lourenço
1,2,3
1
Department of Geography and Tourism, University of Coimbra, 3004-530 Coimbra, Portugal
2
CEGOT—Centre of Studies of Geography and Spatial Planning, University of Coimbra, 3004-530 Coimbra, Portugal
3
NICIF—Centre of Scientific Investigation for Forest Fires, University of Coimbra, 3004-530 Coimbra, Portugal
*
Author to whom correspondence should be addressed.
Forests 2023, 14(6), 1106; https://doi.org/10.3390/f14061106
Submission received: 12 May 2023 / Revised: 23 May 2023 / Accepted: 24 May 2023 / Published: 26 May 2023
(This article belongs to the Special Issue Forest Fires: Latest Advances and Perspectives)

Abstract

:
In Portugal, the rapid growth in housing in and near wildland–urban interfaces (WUIs) increases the wildfire risk to lives and structures. The goal of our study was to assess wildfire hazard in the Central Region of Portugal and in the contact areas of the 60,373 km of WUIs existing in the study area. The degree to which wildfire is a hazard to the landscape and the different urban interfaces areas was assessed using the spatial arrangement of land use/land cover (LULC), topography, and historical incidence of burnt area. The results show that in more than half of the Central Region territory, the wildfire hazard is high or very high; however, most WUIs are in contact with low or very low hazard classes in a total of 87% of the segments. The LULC analysis in the different wildfire hazard classes in WUI contact areas shows that agricultural crops are predominant in the low and very low hazard classes, while in the very high and high hazard classes shrub communities, coniferous and scrub forests dominate, respectively. These results can assist in designing appropriate prevention measures and improving the effectiveness of fire prevention.

1. Introduction

Fire is a vital part of many ecosystems and the Earth system as a whole [1]; however, in the last few decades, the increase in large fires recorded in various parts of the world has caused major concern about their important environmental, economic, and social impacts. When wildfires do occur in the vicinity of settlements, the consequences from a human perspective are much greater than when they occur far from settlements [2]. Consequently, in North America, Australia, and Western European countries, increasing attention is being given to the wildland–urban interface (WUI), defined as the area where wildfires pose the greatest risk to people due to the proximity of flammable vegetation [3,4,5,6,7]. This WUI vegetation, which is not always properly managed (thanks to a lack of regulations in some countries or a lack of their enforcement when they do exist), can act as a vector facilitating fire propagation from the wildland to structures (and then possibly from structure to structure, evolving into a conflagration) but also from the WUI towards the wildland. On the other hand, the WUI is where more wildfires occur due to human fires, since most fires are human-induced [1,8,9]. Thus, wildfires occurring in WUIs, or in their vicinity, often present a severe risk to human life, cause significant damage to human-made structures and property, and lead to human casualties [6,10]. In the last twenty years, the expansion of urban and WUI areas has increased the density of fires and related risks [11,12,13,14], as well as the cost of protecting houses from fire [15]. Several disasters are strong reminders of such events, such as the 2005 and 2017 wildfires in Portugal [16,17,18], the 2009 Victorian bushfires [19], the 2018 Camp Fire in Northern California [20,21], the Australian bushfires [22,23], and the wildfires in Eastern Attica, Greece [24]. The increasing frequency of such events shows that there is an urgent need to understand these phenomena and the existing risks so as to predict their consequences and implement adequate mitigation measures, thereby increasing the resilience of the community and the built environment [25].
In Europe, Portugal has historically been one of the most affected countries and has experienced great material and human losses. In June 2017, in the Pedrogão Grande fire, in Central Portugal, 66 civilian fatalities were recorded, and 253 other people were injured. In this catastrophic event, more than 450 houses were destroyed, and over 49 companies were directly affected by the fire. In total, 53,000 hectares of land burned, including 20,000 hectares of forest. In the same year, in October, 41 people died after hundreds of fires (more than 500) resulting from extremely dry conditions and strong winds from Hurricane Ophelia, and more than 800 houses and 500 companies were affected, mainly in the center of Portugal.
In Portugal and elsewhere, the increase in WUIs results from two main factors, namely the growing suburbanization and the abandonment of traditional rural lifestyles. Pereira et al. [26] concluded that among the southern European countries, Portugal had the highest rates of changes in land use in the 2000–2006 period. This period was marked by a significant increase in urban areas and sclerophyllous vegetation and a decrease in forest areas and natural grasslands, because of urbanization, rural abandonment, and wildfires. The demographic pressure, mainly in Portugal’s coastal region, with high population density and unbalanced land-use planning options, has led to the spread of urban areas, which have become closer and closer to the forest areas. This urban growth has not always been continuous but is scattered around the area due to the absence of public programs, and its occupation occurred under the auspices of private initiatives that which were not always interlinked. As a result, buildings and groups of buildings have emerged in areas intended to be urban but lacking proper planning and were in the vicinity of forest areas and hence exposed to relevant fire risks. Simultaneously, rural areas have been abandoned in recent years, which has contributed to the lack of management of forest areas [27,28,29], and the greater accumulation of fuel biomass. Wild and agricultural land tends to be replaced by urban areas close to the forest, and this significantly increases the threats that wildfires present to urban areas [28,30,31,32].
WUI fires in Mediterranean Europe, as in all WUI fire-prone areas, pose enormous management challenges in terms of civil protection and fire mitigation. These fires often exceed the capacities of firefighters, who have to respond simultaneously to wildfire suppression, community evacuation, and protection of structures. In this context, scientists have been focusing more on the interfaces, paying particular attention to their characterization and mapping and evaluating the risk of fires in these areas [6,13,29,33,34,35,36,37,38,39,40,41]. According to Caballero [34], WUI problems have at least three different scales that must be approached in different ways, but consistently between them are landscape, settlement, and house levels. Similar to other forms of risk management, the management of wildfire risks begins with an assessment of the probability of a wildfire event and the susceptibility of highly valued resources and assets to wildfire [38,39]. In fact, spatially defining the WUI and assessing different levels of wildfire hazard is essential to provide decision-makers with accurate and defensible hazard data.
In this context, the main objective of this work is to evaluate the probability of and susceptibility to wildfires in the Central Region of Portugal. It is also intended to characterize the predominant typologies of WUIs in the study area and to evaluate the degree of hazard in the areas in contact with the different urban interfaces. As the vegetation (land use/land cover, LULC) is a well-known hazard factor due to the range of types and intensity of human activities in different LULCs in and outside WUIs, the main LULC types were analyzed considering the different hazard levels and WUI typologies. The final goal is to produce maps that identify the municipalities with the largest extents of WUIs in contact with high and very high wildfire hazards in order to identify areas that are in more need of urgent interventions in terms of fuel management, thus enabling the reduction in the fire risk and therefore preventing catastrophic fires such those that occurred in 2005 and, more recently, in 2017.

2. Materials and Methods
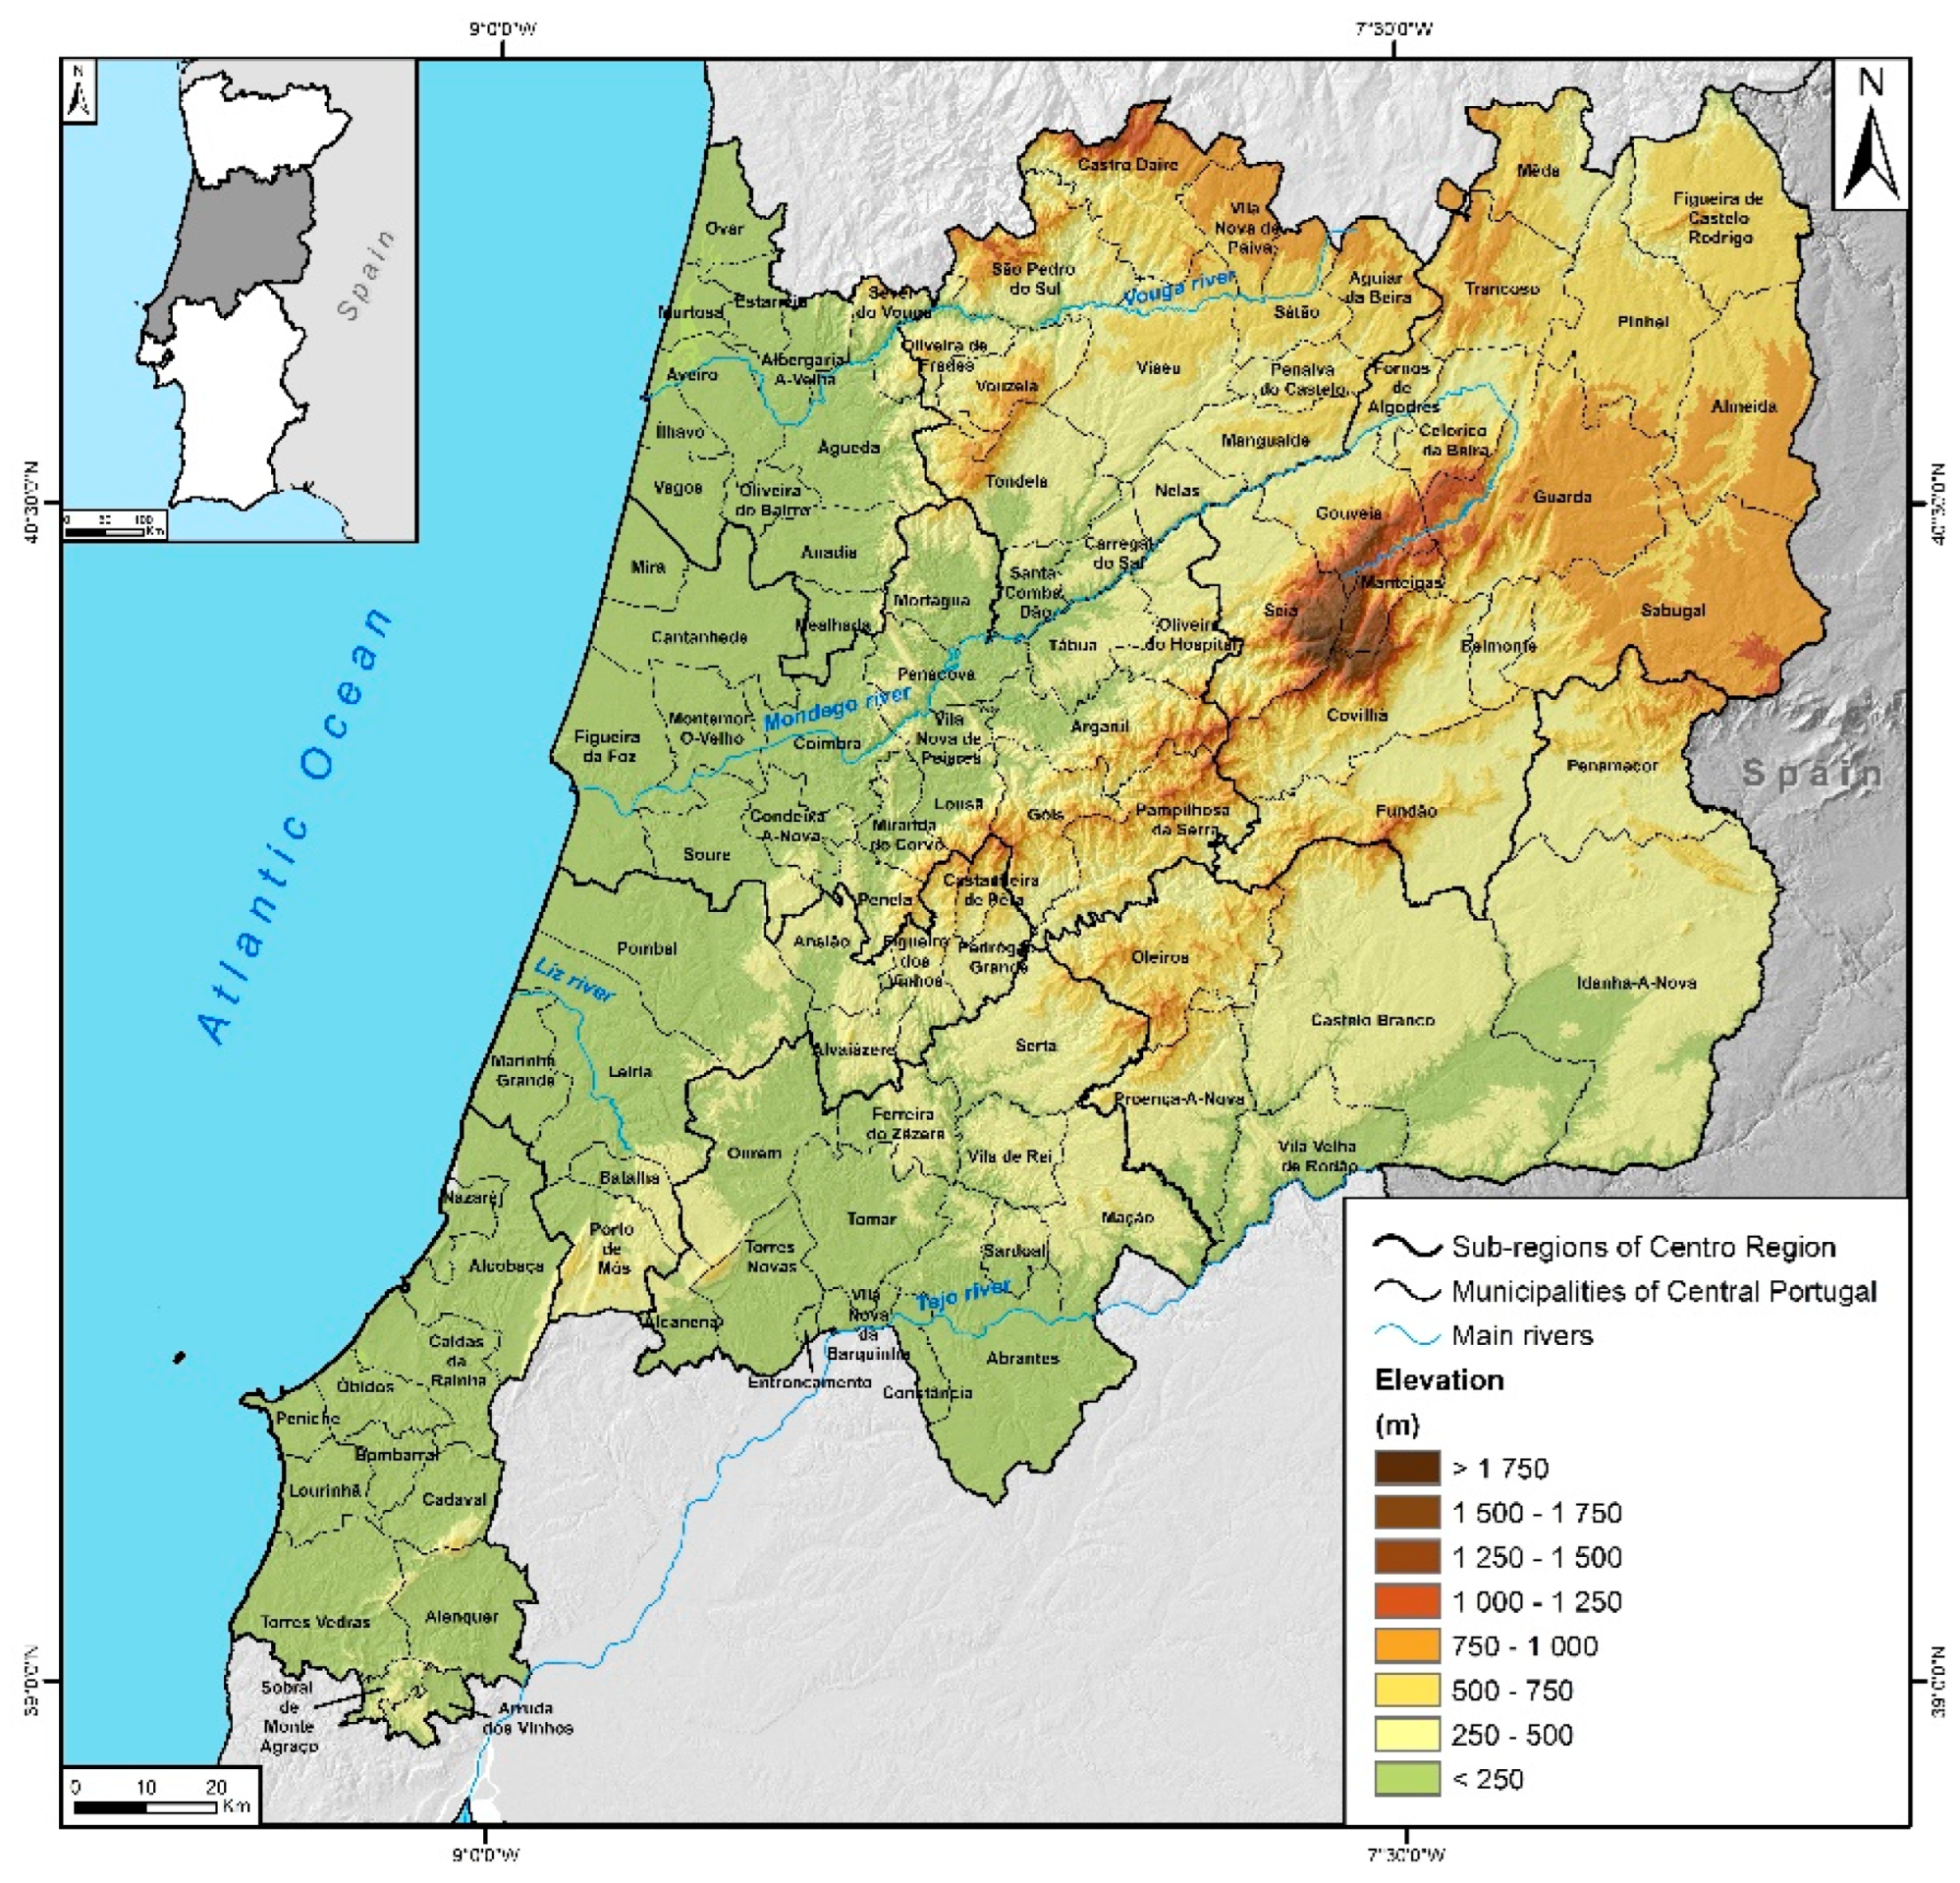
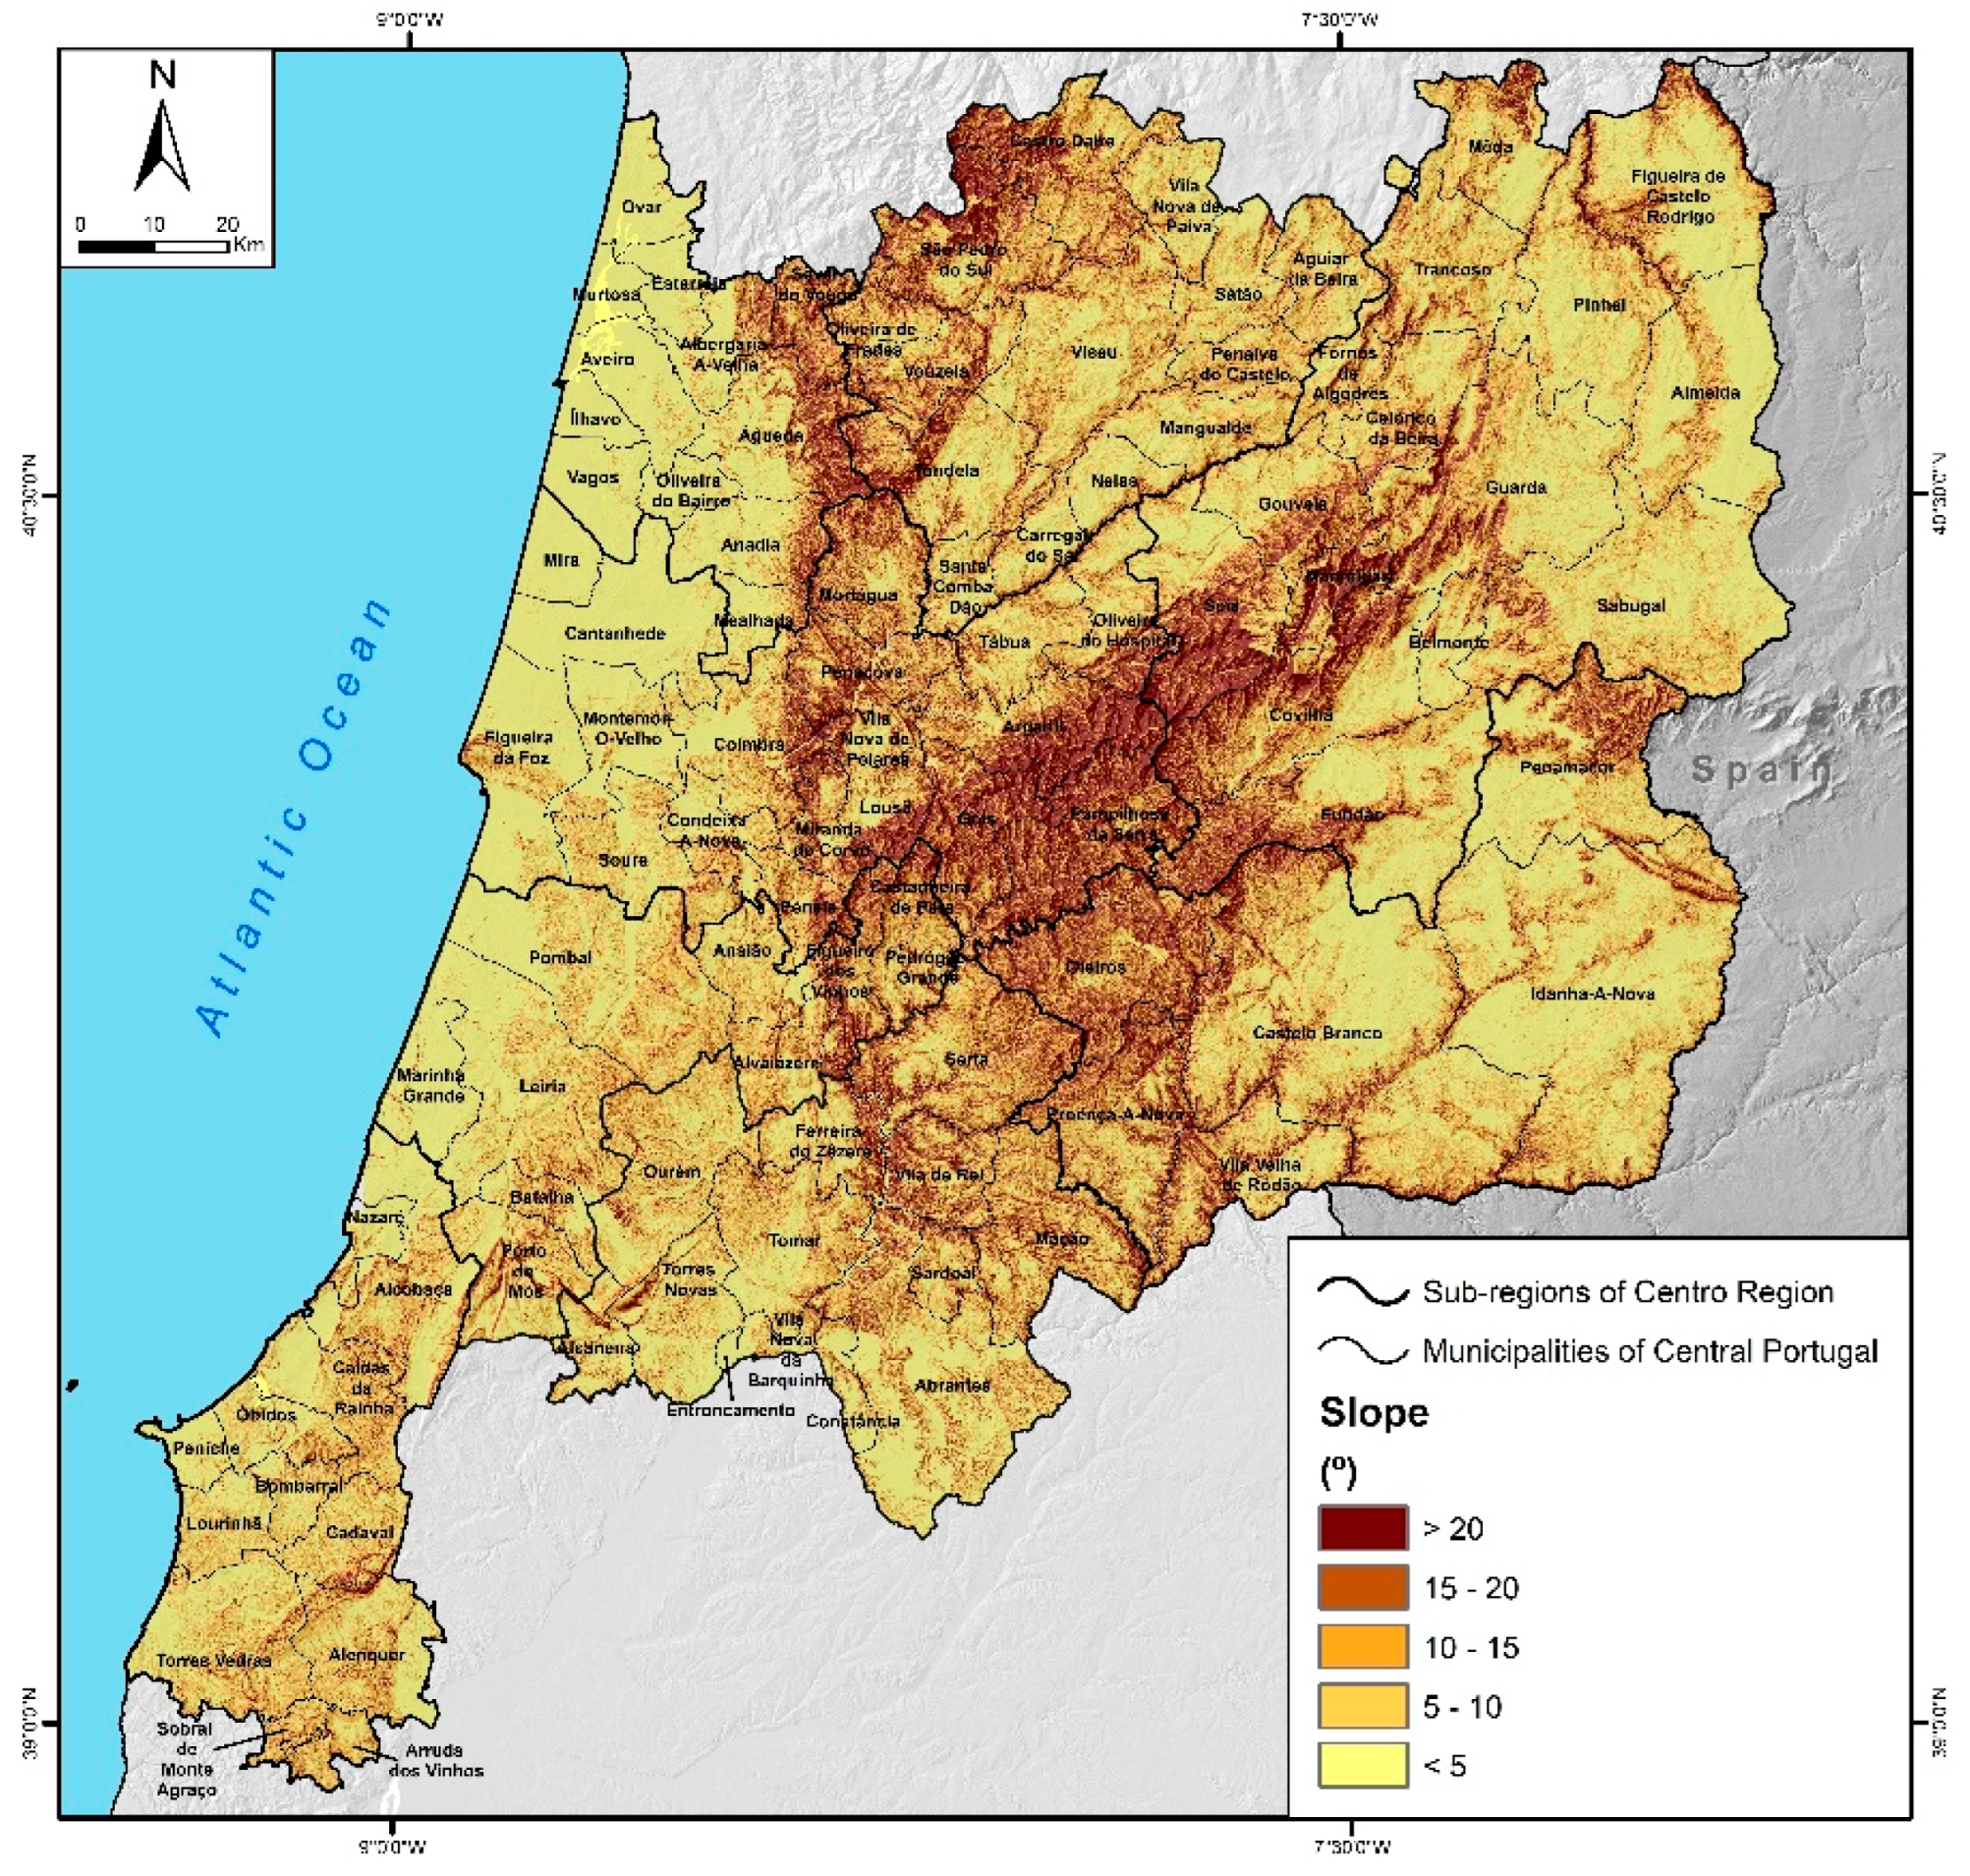
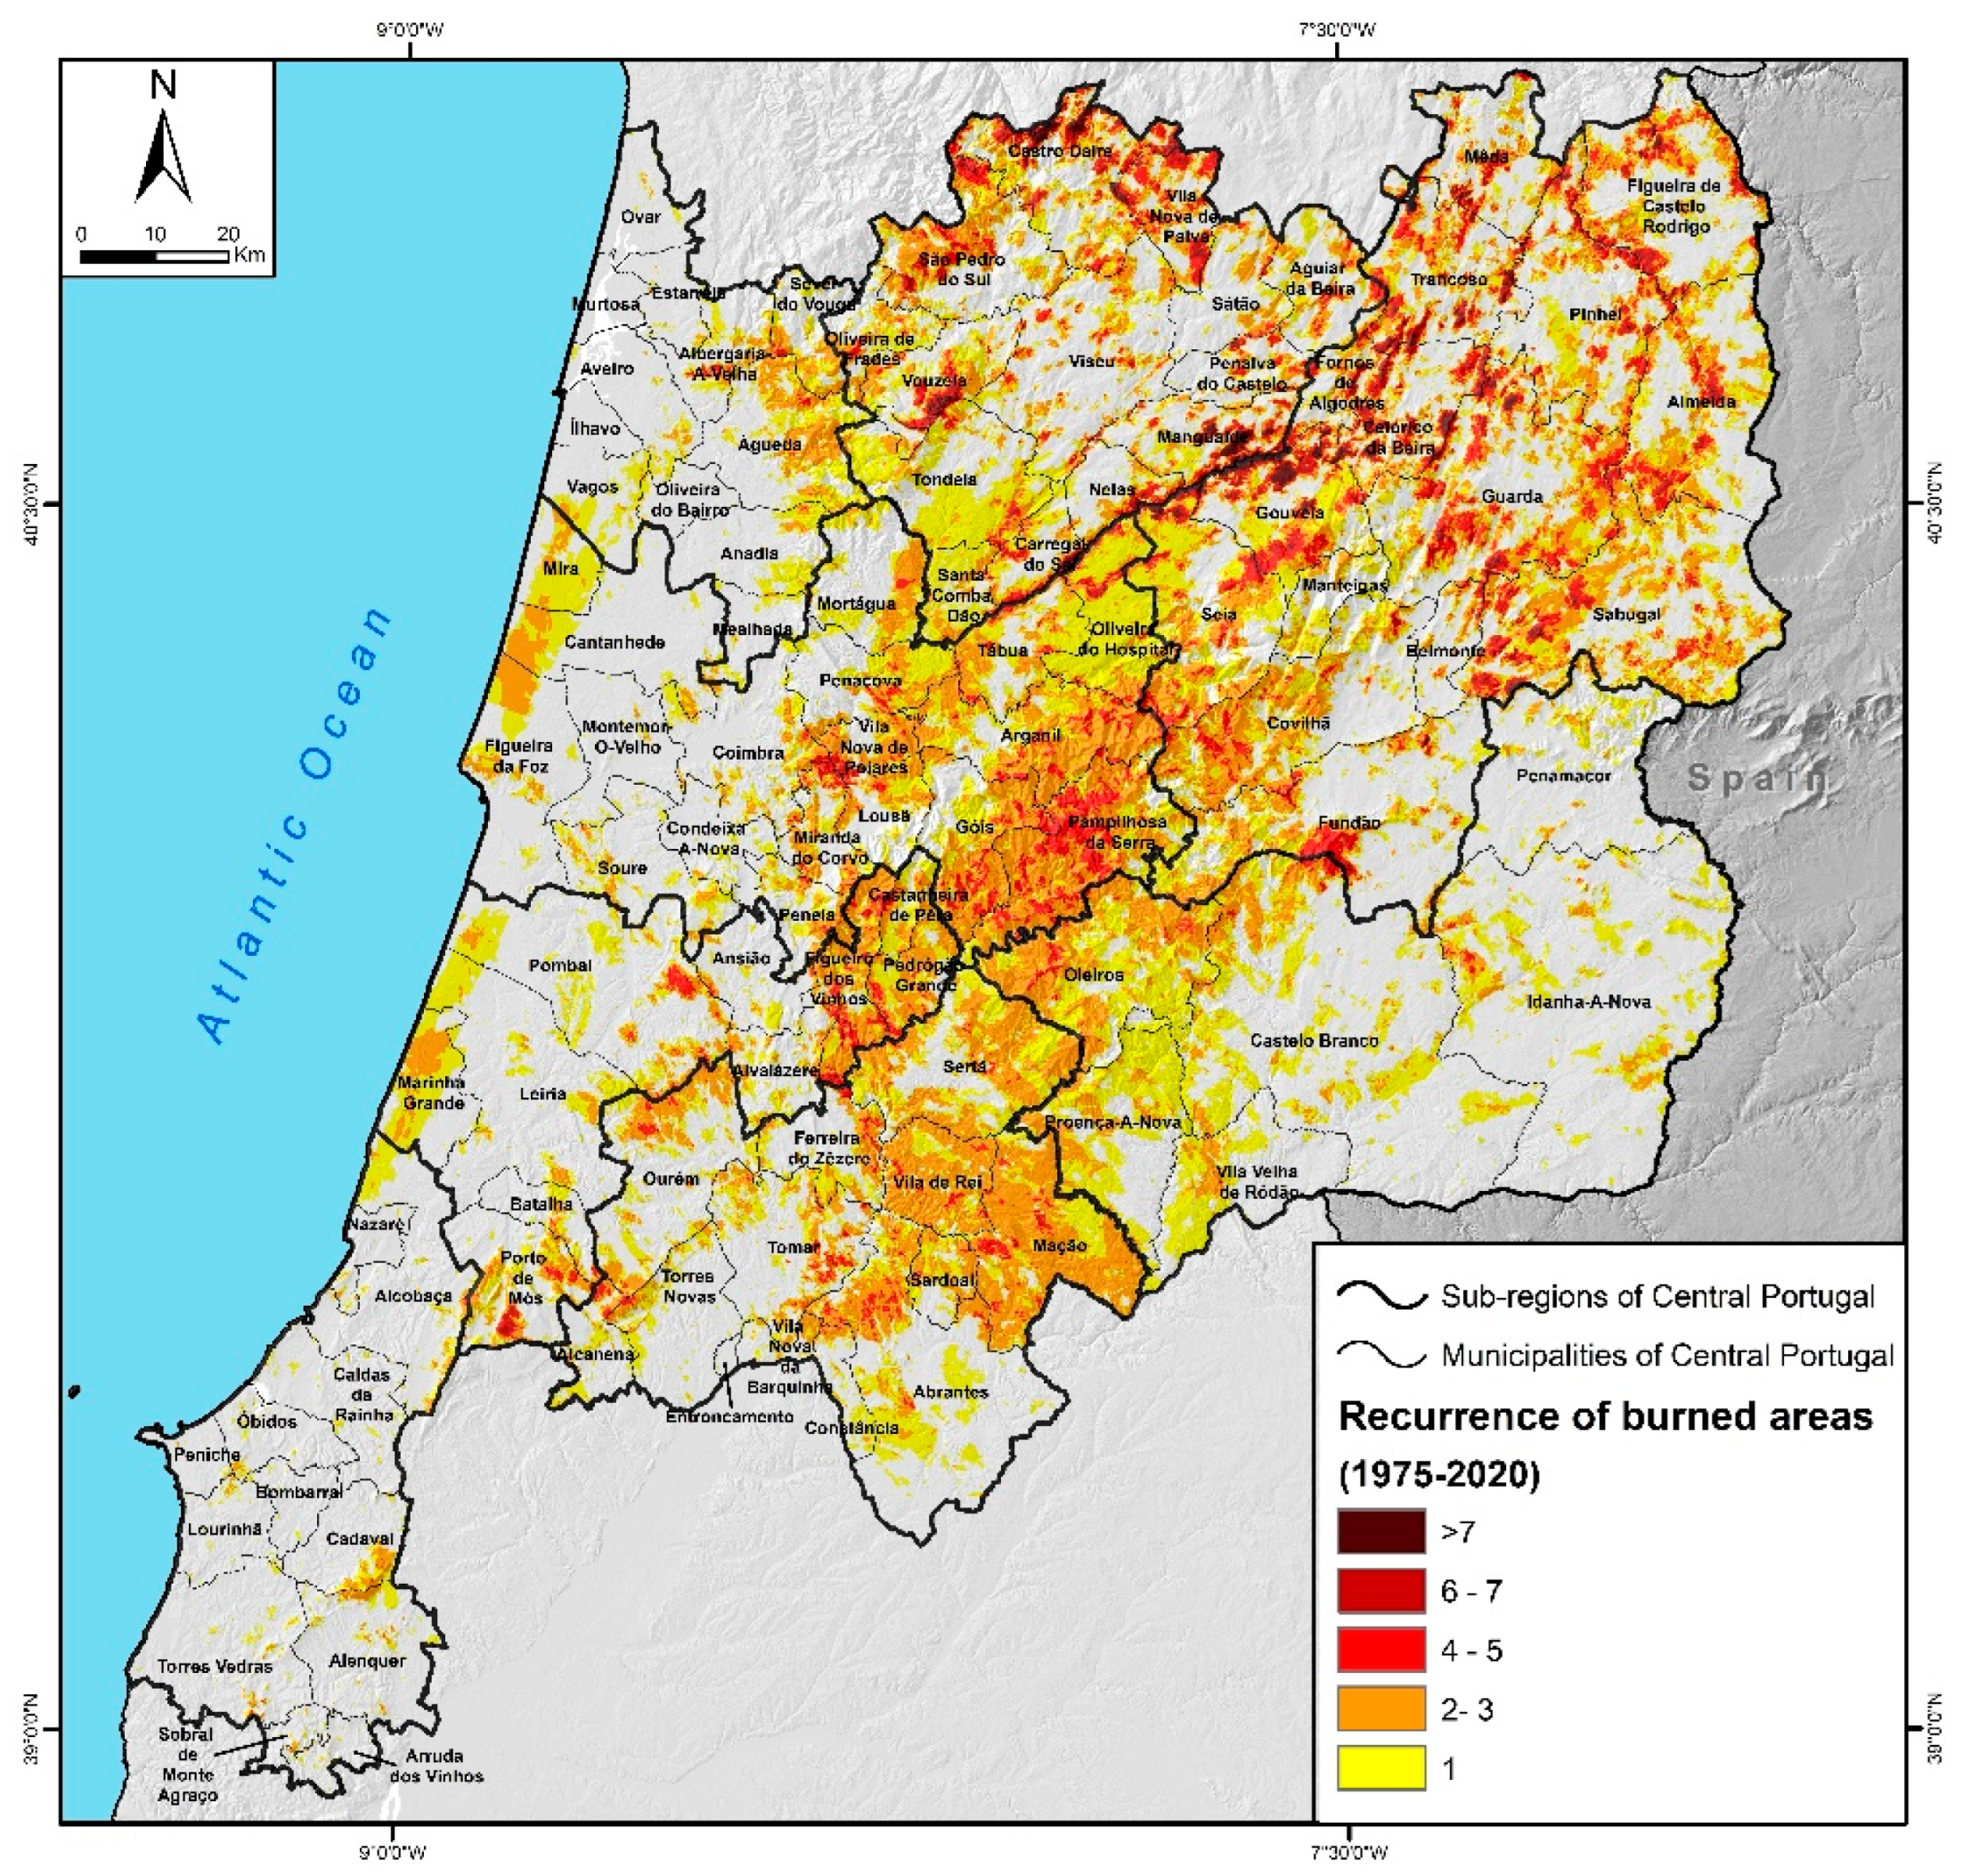
2.1. Study Area

The Central Region of Portugal covers an area of 28,199 km2 and is composed of 100 municipalities. With quite variable altitudes (Figure 1), Central Portugal is a rather rugged territory, especially its central block, where the mountains of the Cordilheira Central are located, and further west, the mountains nearer the coastline. The maximum altitude is found in the Serra da Estrela and reaches 1993 m. It is also in this sector that the most rugged slopes are found (Figure 2). Nearer the coast, altitudes are relatively low and slopes are less steep. In the inland areas, on the Beira plateaus north of Serra da Malcata, the altitude varies between 400 and 800 m, while to the south, on the Castelo Branco plain, the altitude is around 500 m. In both areas, the slopes are relatively gentle.
In recent decades, the Central Region has seen major changes in land use and land cover (Figure 3 and Table 1). According to the 2018 Land Cover map (Figure 3), the most typical use class is the Pinus pinaster (maritime pine) forests at 22.4%, followed by eucalyptus forests at 17.2%, and native scrubland at 13.3%. In evolutionary terms, considering the period from 1995 to 2018, some of these changes result from the little spatial relevance featured in the 1990s (1995), one example being the invasive species forests (mainly Acacia species) (Table 1), whose coverage percentage increased very significantly. However, the most significant changes occurred in eucalyptus forests, whose area doubled and which currently occupy more than 6000 km2. Meanwhile, the areas taken up by pasture land and maritime pine forests declined (−60% and −22%, respectively).
Central Portugal has been the region most affected by wildfires since records began. The morphological contrasts, the heterogeneous climate features, and an unbalanced demographic occupation have made this region highly susceptible to wildfires [42]. It should be noted that the fires of 2003 (425,000 ha), 2005 (338,000 ha), and 2017 (540,000 ha) mostly affected the Central Region. Considering the history of wildfire, which results from the overlapping of burnt areas from 1975 to 2020, we can say that the Central Region is strongly affected by wildfires, particularly in the more mountainous areas and the northern and north-eastern interior districts (Figure 4). In fact, fire has already struck most of the territory in the region at least once (20.7%), but there are vast areas that have been devastated by fire 2 or 3 times in recent years (18.8%). It is also possible to identify areas that have been burnt 6 or more times in the last 45 years. The areas most affected by fires are in the municipalities in the mountainous areas of Central Portugal, especially Gouveia, Celorico da Beira, Mangualde, and Fornos de Algodres. Some of the municipalities in the north-eastern part also report extensive areas that have been affected by wildfire more than once in the last four decades. The municipalities of Castro Daire and Vila Nova de Paiva in the north should also be mentioned, along with Pampilhosa da Serra, Arganil, Castanheira de Pera, Figueiró dos Vinhos, and Sertã, located in the last part of the chain of mountains that make up the Cordilheira Central.

2.2. Wildland–Urban Interface Definition

The definition of urban–forestry interfaces for the Central Region resulted from the adaptation of the Built Environment Charter 2018 and the Urban-Rural Interface Charter 2018 (Carta de Áreas Edificadas 2018 and Carta da Interface Urbano-Rural de 2018), produced by the Directorate-General of the Territory (DGT). In line with these maps, the WUI is defined as an area where structures and wildland vegetation are in direct contact or in close proximity, separated by a clearly defined boundary [43], defined as the perimeter (or the segment) of the built-up area. In order to introduce detail to the interfaces identified in the aforementioned products, we decided to reorder it in only 4 types of infrastructure (Table 2), although in this work, only continuous built-up areas, discontinuous built-up areas, and industrial areas were incorporated, as they are more sensitive to the loss of people and goods.

2.3. Wildfire Hazard

The method used for assessing the wildfire hazard resulted from adapting the methodological proposal presented by Oliveira et al. [44]. This method is divided into three steps: (i) assessment of wildfire susceptibility, (ii) calculation of wildfire probability, and (iii) determination of the wildfire hazard as the product of multiplying probability by susceptibility. All of the elaborated maps have a spatial resolution of 10 by 10 m.
Inputs for assessing susceptibility included the variable slopes, altimetry, and land cover. The land use and land cover maps (LULCM) came from the Directorate-General of the Territory and had a scale of 1:25,000; they cover the years 1995, 2007, 2010, 2015, and 2018. The areas burned between 1975 and 2020 were included as a dependent variable.
The proposed methodology includes the Likelihood Ratio (LR), a fairly common component that is based on Bayesian statistics and used by several other authors [45,46,47]. After reclassifying the variables slopes, the altitude, and the various land use and land cover classes contained in the Land Use and Land Cover Maps, the Likelihood Ratio of the Variable (LRi), for each class i of each variable was calculated according to the following formula:
LRi = (Si/S)/(Ni/N)
Si = Number of burnt pixels corresponding to class i,
S = Total burnt pixels
Ni = Number of pixels of the class i
N = Total pixels of the study area
The burnt area information from 1975 to 2019 was considered for the altimetry and slope variables, apart from 2005 and 2020, which were used to validate the model. Regarding the land use and land cover variable, the procedure differed slightly from that used by Oliveira et al. [44], since for each land cover map, a series of years of burnt area, successive up to a maximum of 9, was used, according to the following proposal: LULCM 1995, burnt areas from 1995 to 2003; LULCM 2007, burnt areas from 2006 to 2009; LULCM 2010, burnt areas from 2010 to 2014; LULCM from 2015, burnt areas from 2015 to 2017; LULCM from 2018, burnt areas from 2018 and 2019.
Taking into account the dynamics that affect the land use and land cover throughout the period under analysis, the use of reference years close to the year when the land use and land cover map was created permits greater accuracy in assessing the predisposition of each class to the occurrence of a fire. Naturally, over time, the classification that was assigned to a particular area when preparing the land use and cover maps changes and can result in something quite different from what was previously classified. Therefore, no burnt areas are considered beyond 9 years after the date of land use and cover maps, in order to reduce the possibility that, at a more distant point in time, the present land cover class is no longer up to date, which may result in some bias in the LR results.
According to the proposal by Oliveira et al. [44], LRi scores below 1.0 indicate a negative correlation between variable (x/y class) and burnt areas. On the other hand, higher values indicate a positive correlation, which increases in parallel with the value of LRi.
The final product of the susceptibility, for each pixel, results from the sum of the likelihood ratios associated with its classes in the variables landcover, slope, and elevation. The product obtained for susceptibility is afterward combined with probability to give the final product, i.e., the hazard.
The probability that a wildfire will burn a given point or area for a specified period of time was the assumption adopted in this study, instead of the probability that a fire would start at a given location and time. In fact, the number of ignitions in Portugal is very high, and they occur mainly in areas of higher population density [48] and to some extent within or near wildland–urban interfaces. However, a small percentage of fires are responsible for the large number of burnt areas in the Central Region of Portugal, and it is these significant wildfires (with burnt areas of 10,000 to 20,000 ha) that put people and their property at risk. For this reason, we considered that the burnt area is the most suitable variable when analyzing the wildfire hazard in Portugal.
In calculating the probability variable, the overlapping of burnt areas in the study area was accounted for. For this purpose, the data from the shapefiles provided by the Portuguese Institute for Conservation of Nature and Forests ((ICNF, https://www.icnf.pt/ (accessed on 10 January 2022) were transformed into raster format. This process resulted in a raster for each year, with each burnt pixel in the burnt area being assigned a value of 1. Summing the rasters made it possible to spatialize the recurrence of fires in the 1975 to 2020 period. Subsequently, these data were reclassified to obtain the annual probability of wildfire as a result of dividing the number of times a pixel has burnt by the number of years in the series. The areas that did not burn during the study period were assigned a value of 0.01, which corresponds to an annual probability of 1%, thus allowing their inclusion in multiplication operations.
Subsequently, 5 classes were defined for the final model, adopting the following assumptions: (i) the “very high” class had to validate 50% of burnt area, and the “very low” class could not incorporate the burnt area, in the years used for result validation, 2005 and 2020. The remaining classes were defined considering the following assumptions: (i) model data, (ii) validated burnt area, (iii) breaks in the model success curve, and (iv) the trend lines of the segments between these breaks (Table 3 and Figure 5). From this point onwards, with these fractions, the model line that translates this relationship between Hazard values and burnt area was drawn, making it possible to arrive at the breaks of this line and obtain the classes in question. Simply put, the accumulated fraction was calculated for the number of pixels with a hazard value x and for the number of pixels burnt in that score x. From this point onwards, with these fractions, the model line was drawn that translates this relationship between the hazard values and the burnt area, allowing one to reach the breaks of this line and obtain the classes (Figure 5).
Finally, the SDMtoolbox (v2.5 for ArcMap 10.0), a python-based ArcGIS toolbox, was used to validate the model by calculating the AUC (Area Under the Curve). This evaluation summarizes the ROC (Receiver Operating Characteristic) curve in a value that basically allows the quality of a model’s predictions to be measured; i.e., if a model’s predictions is 100% correct, the AUC value would be 1. The results for the Central Region of Portugal point to a good model performance, with an AUC greater than 0.80 (Figure 6).
To identify the contacts between different types of WUI and Hazard classes, at landscape scale, an intersection of the WUI was made with the final Hazard raster, thus enabling the identification of the most recurrent contacts and the location of the most problematic interfaces in terms of hazard. Finally, the predominant LULCs in contact with the different types of interface were identified.

3. Results

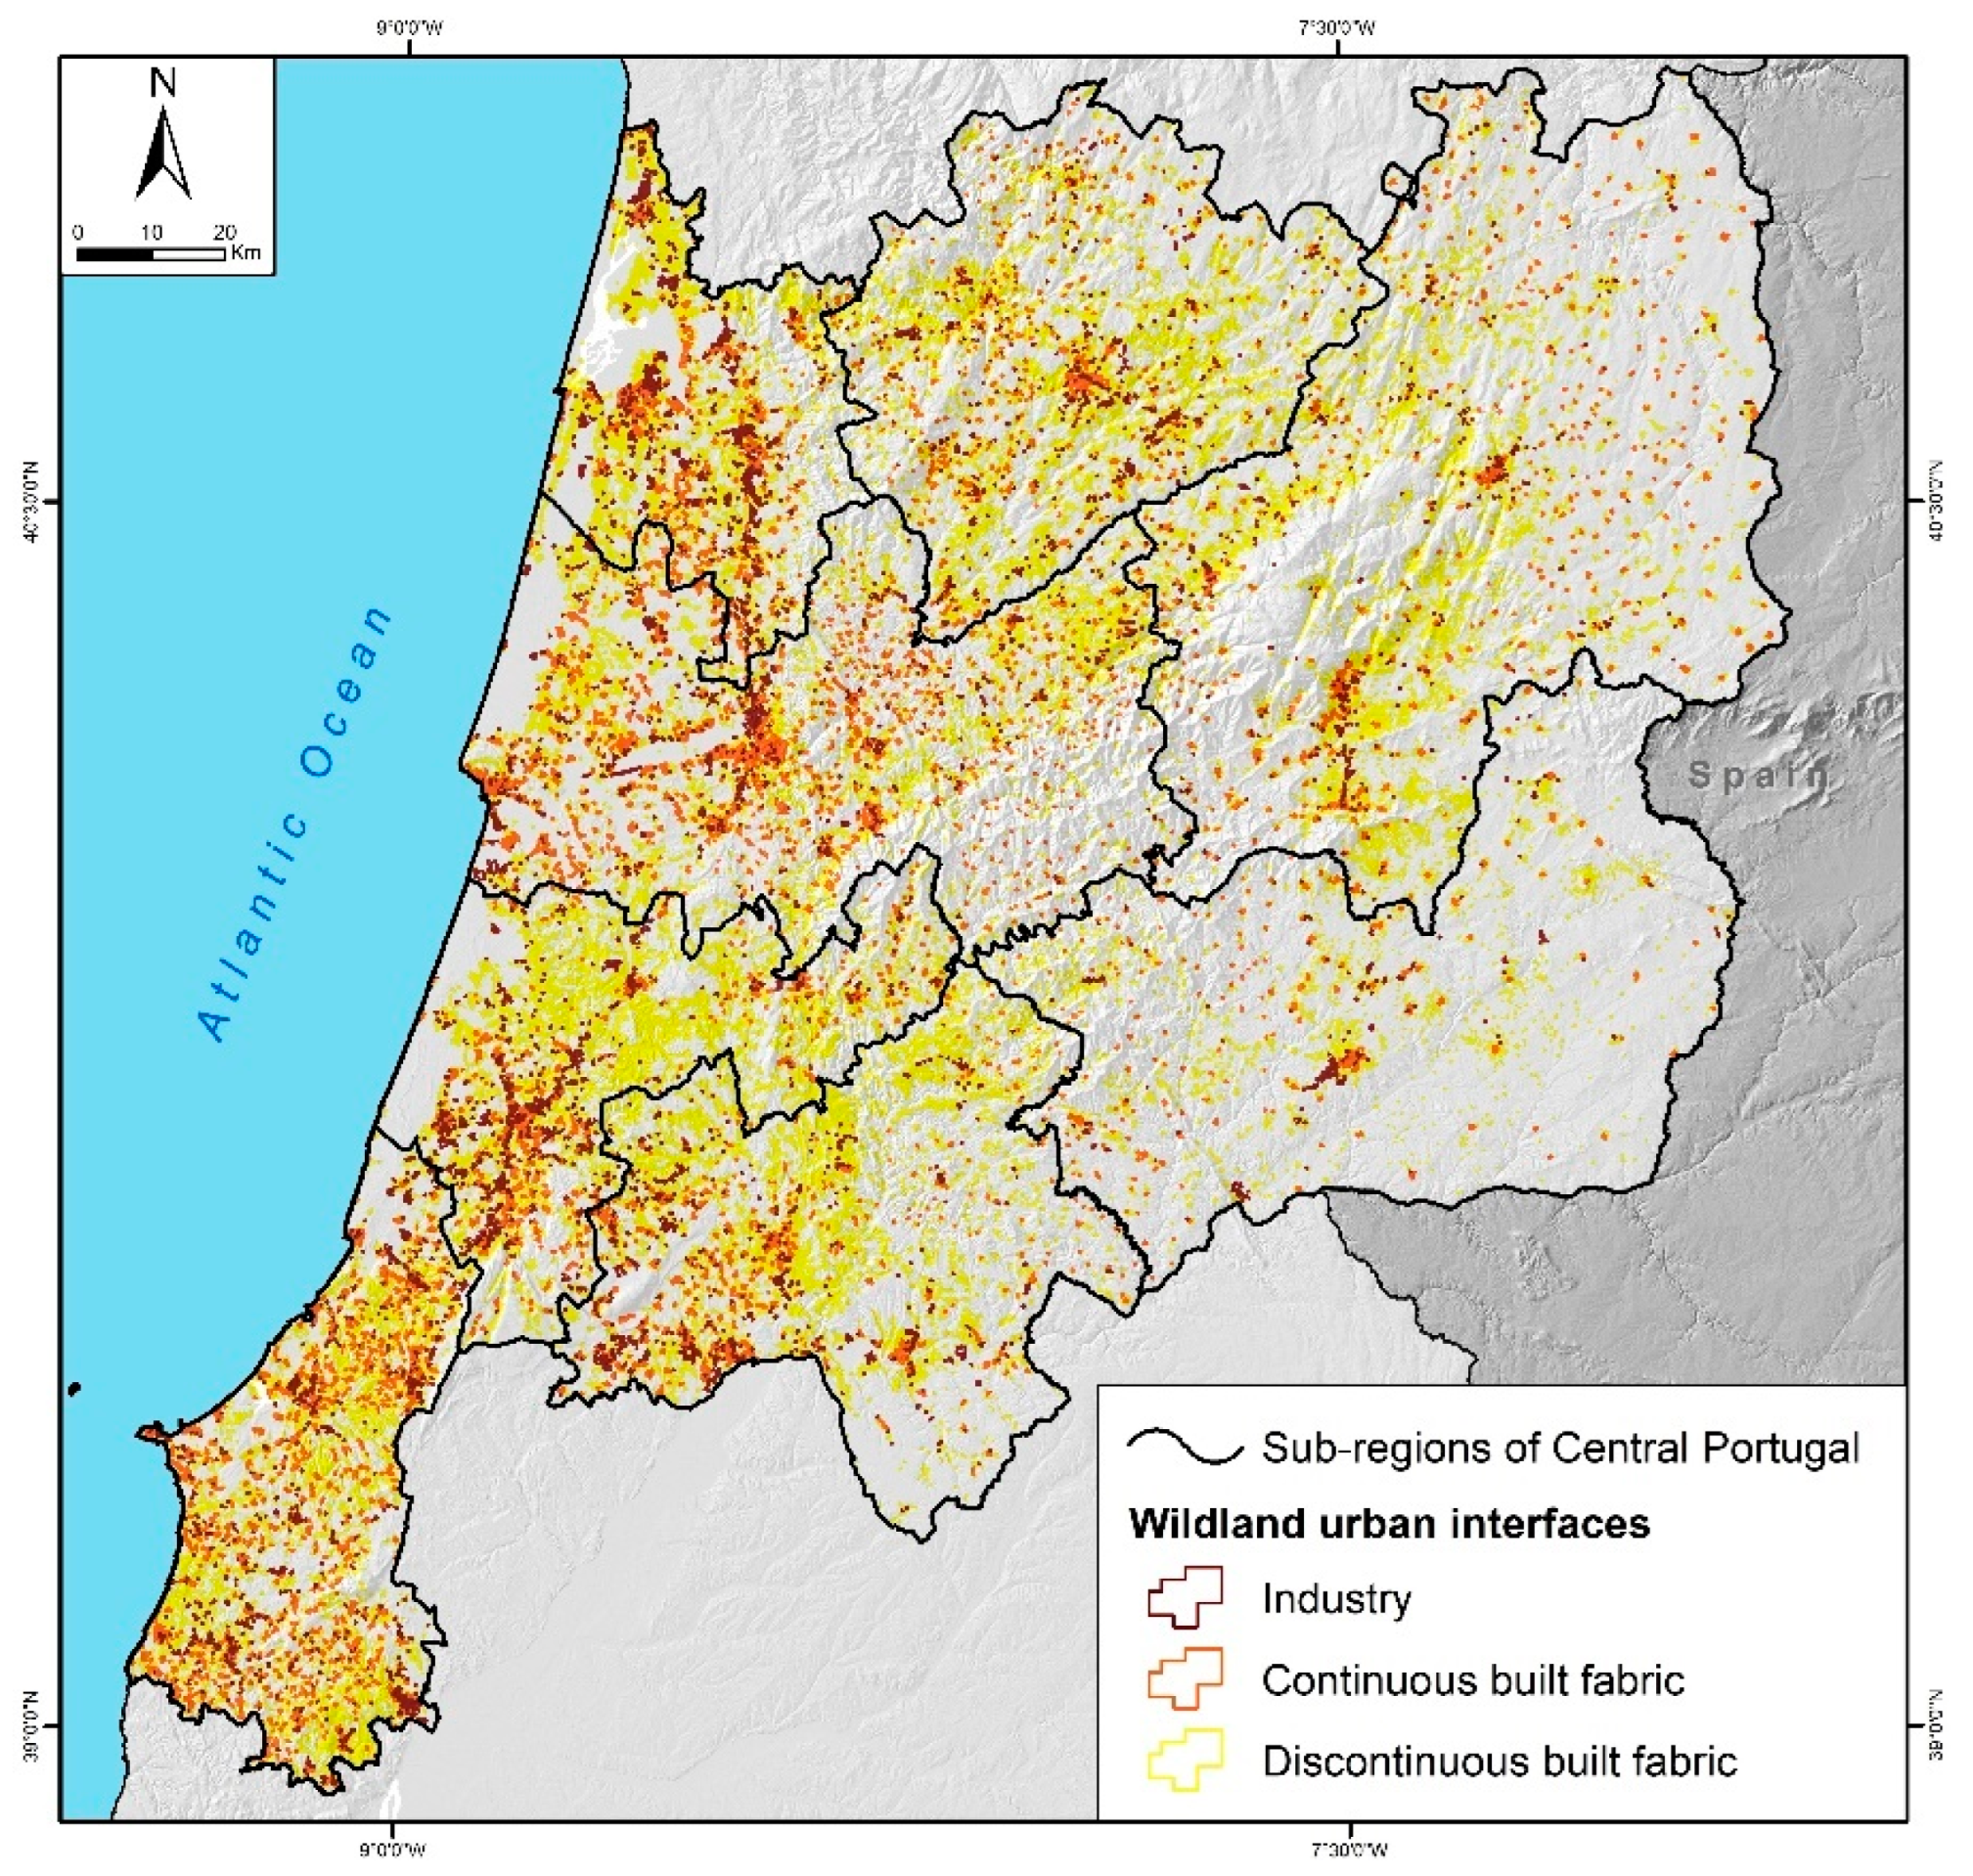
3.1. WUIs in the Central Region

The central region of Portugal is made up of WUI totaling 60,373 km in length, the predominant typology being discontinuous built-up area (80.6%), followed by continuous built-up area (13.1%) and, finally, industry (6.3%) (Figure 7). Spatially, the contrasts between the municipalities of the coast and the interior are evident. In effect, the inland municipalities have the lowest interface proportions (km/km2), with 14 municipalities with less than 1 km of interface/km2. On the other hand, it is in the coastal region in which the density of interfaces shows the highest values, with 15 municipalities registering more than 4 km of WUI/km2.

3.2. Wildfire Hazard at Landscape Scale

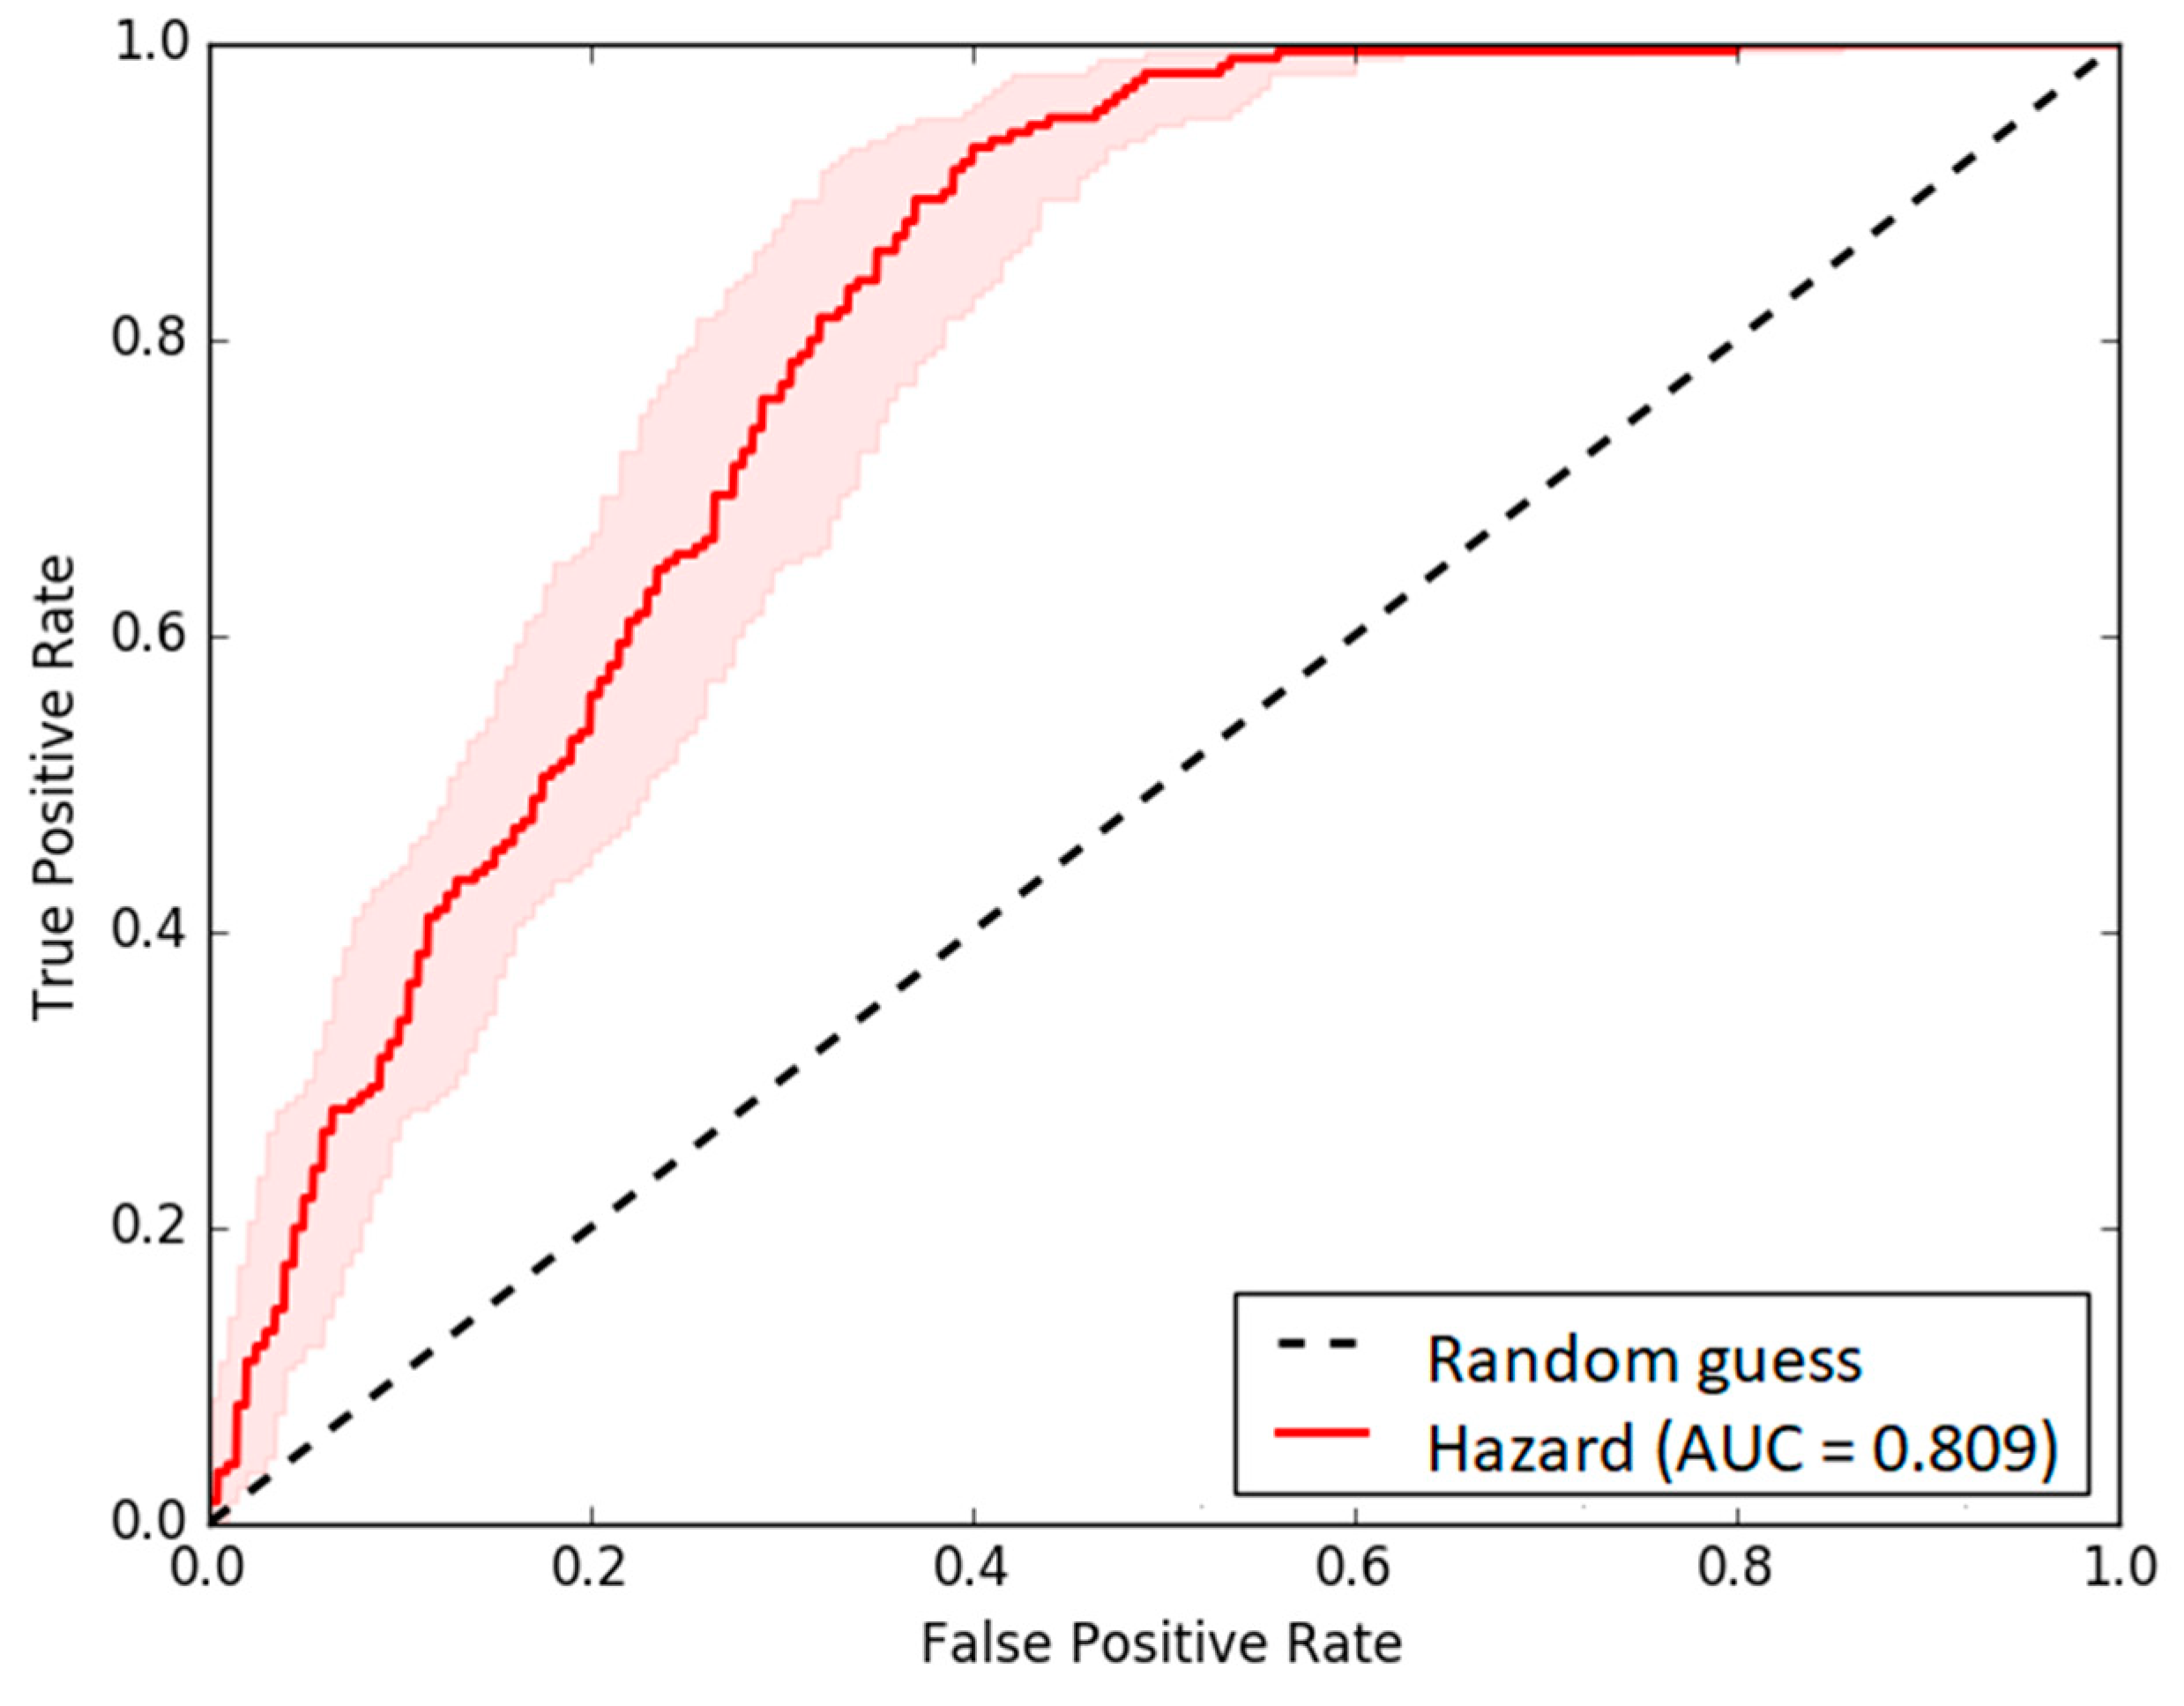
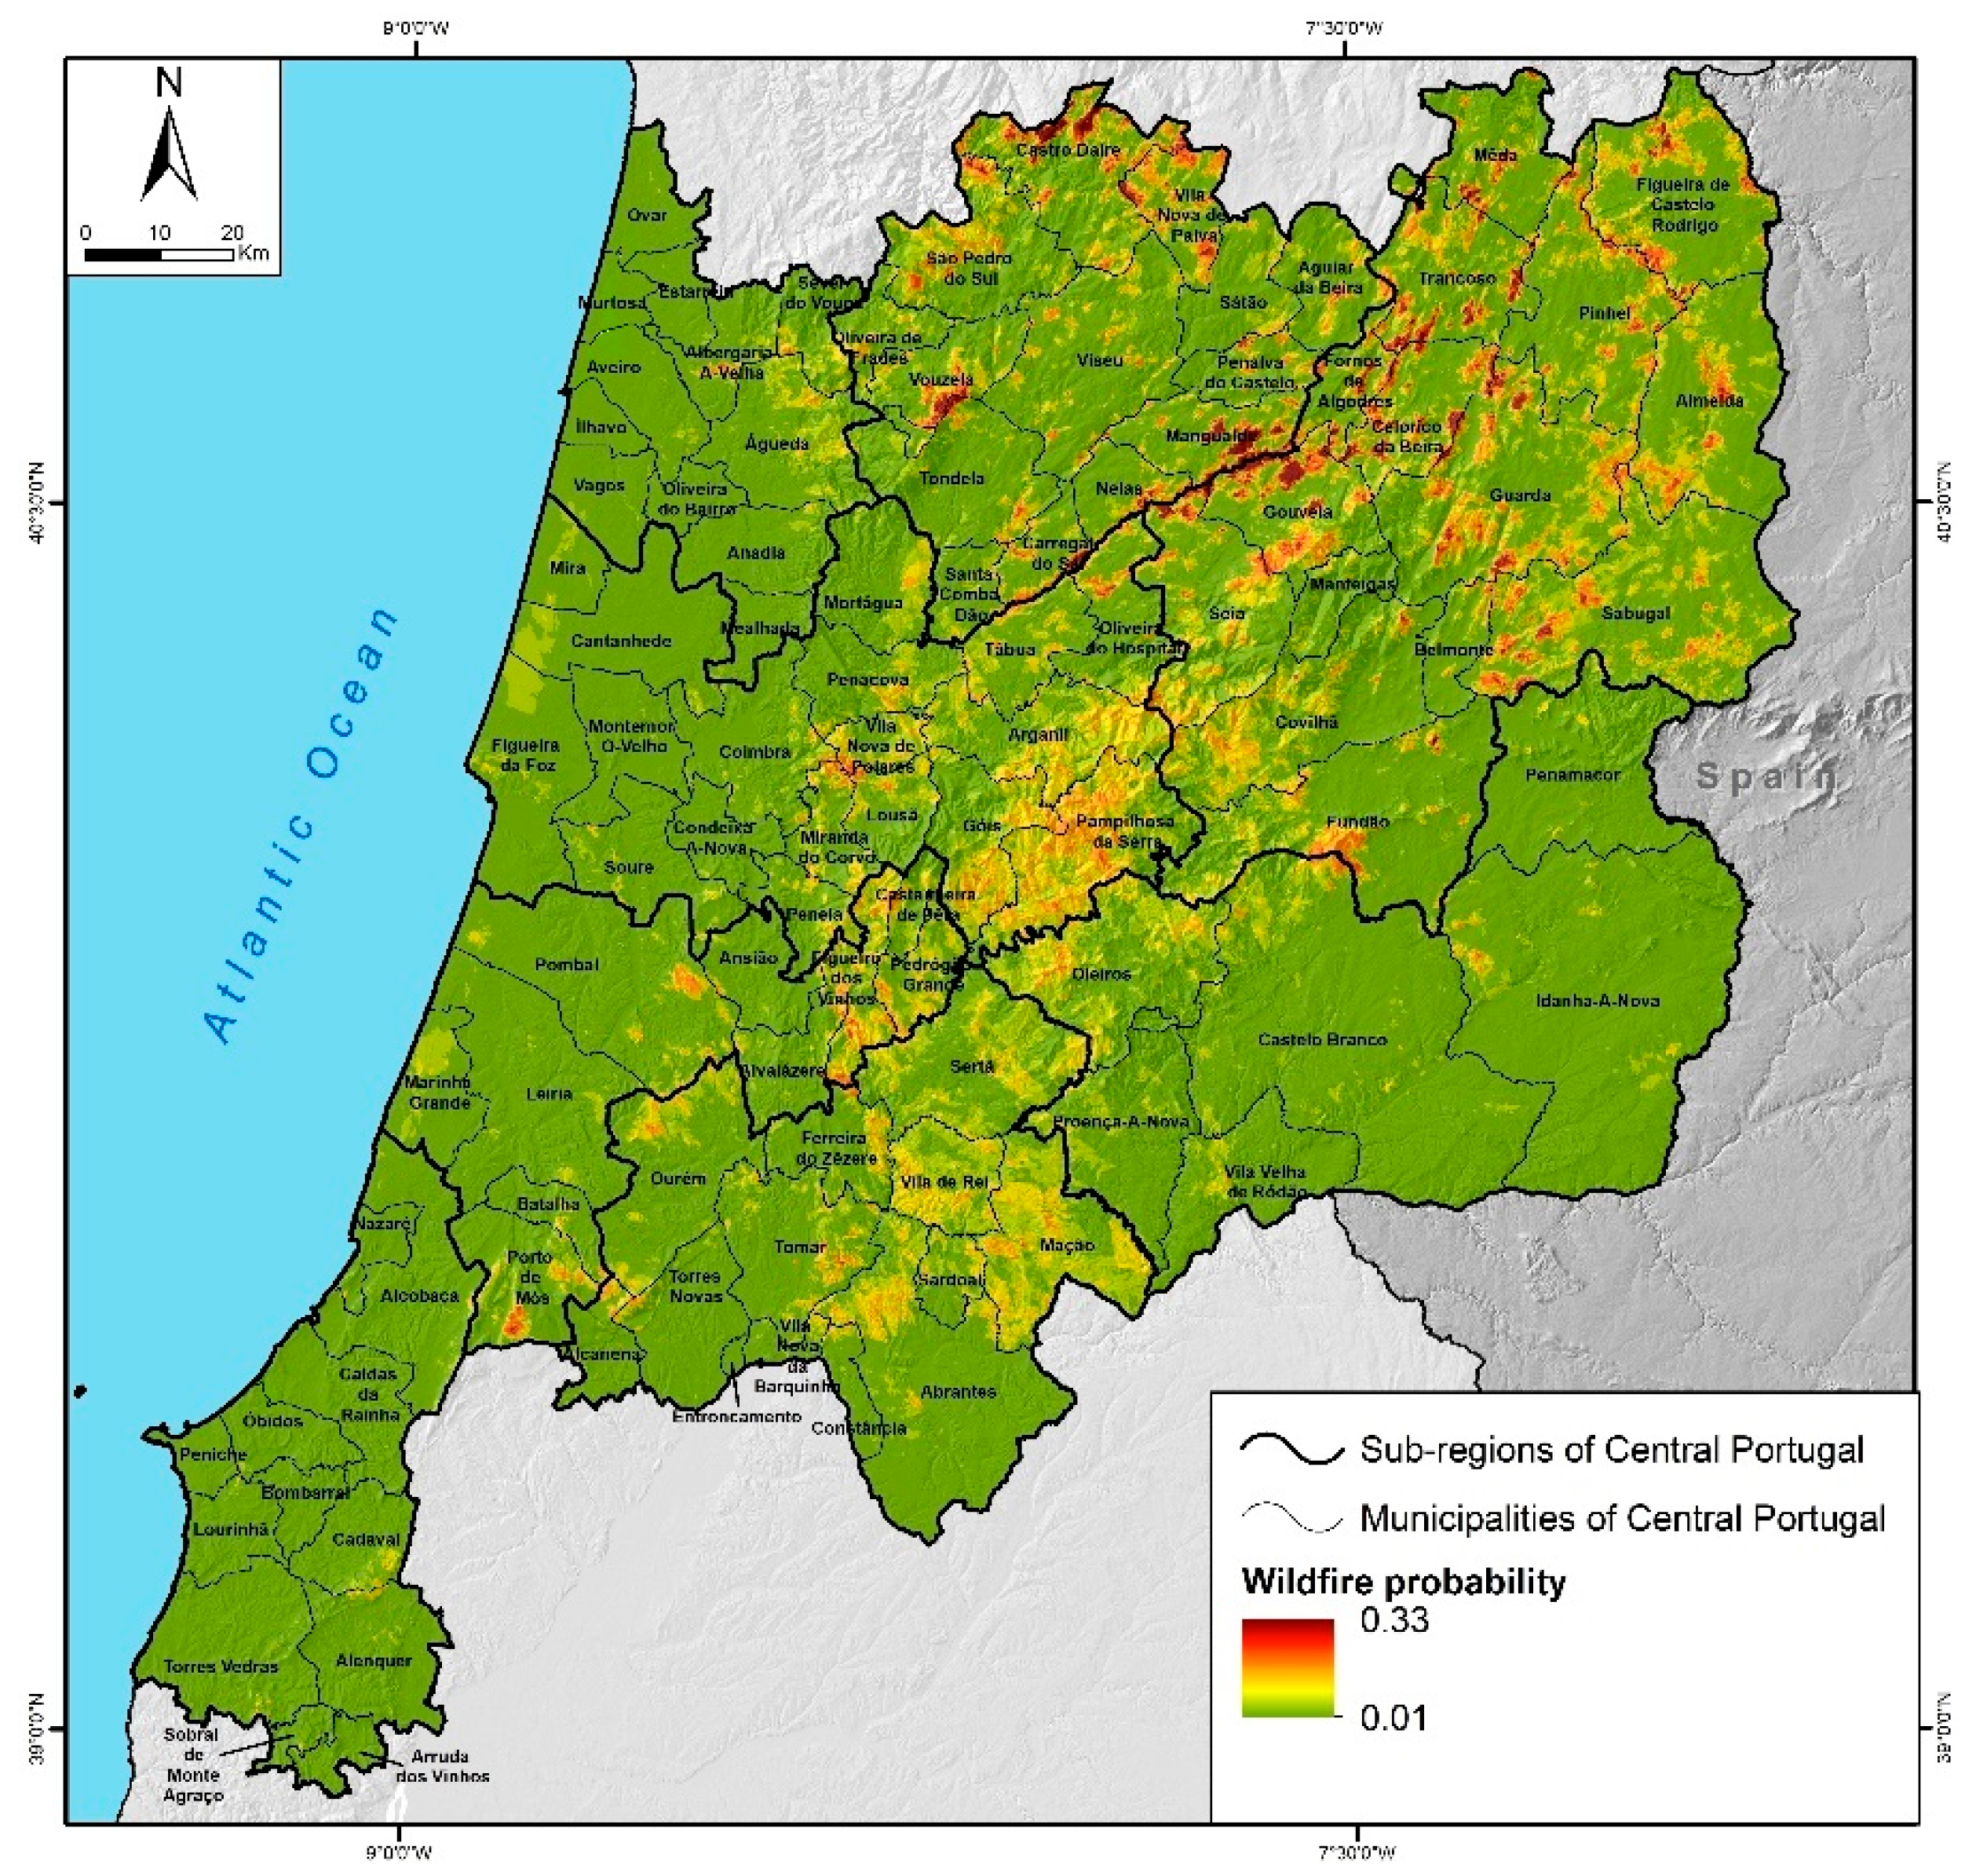
3.2.1. Wildfire Susceptibility and Probability

The fire susceptibility map results from the favorability scores were obtained through LRi for the three variables integrated into the model. Thus, the areas with an altitude between 400 and 1500 m (especially for those between 800 and 1500 m altitude) (Table 4) with slopes greater than 15° and occupied by brush, sparse vegetation, oak forests, and maritime pine are those with a higher susceptibility to wildfires (Table 5 and Table 6). Spatially, the maximum values of wildfire susceptibility occur in the mountainous regions of central Portugal, as well as in the most inland areas of the Central Region (Figure 8). On the contrary, in a strip along the coast, where the altitude and slopes are dominantly low, the susceptibility to wildfires is quite low.
The probability map (Figure 9), based on the recurrence of burnt areas in the 1975–2020 period, shows a maximum value of 0.33 (33%). Thus, the areas classified with this value, taking into account the period of 45 years used, might have burned more than a dozen times. The areas with the highest probability of burning occurring are in the north-east of the Central Region. The central mountain range (Cordilheira Central), consisting of several mountains, also shows a high probability of the occurrence of wildfires, with extensive burnt areas.

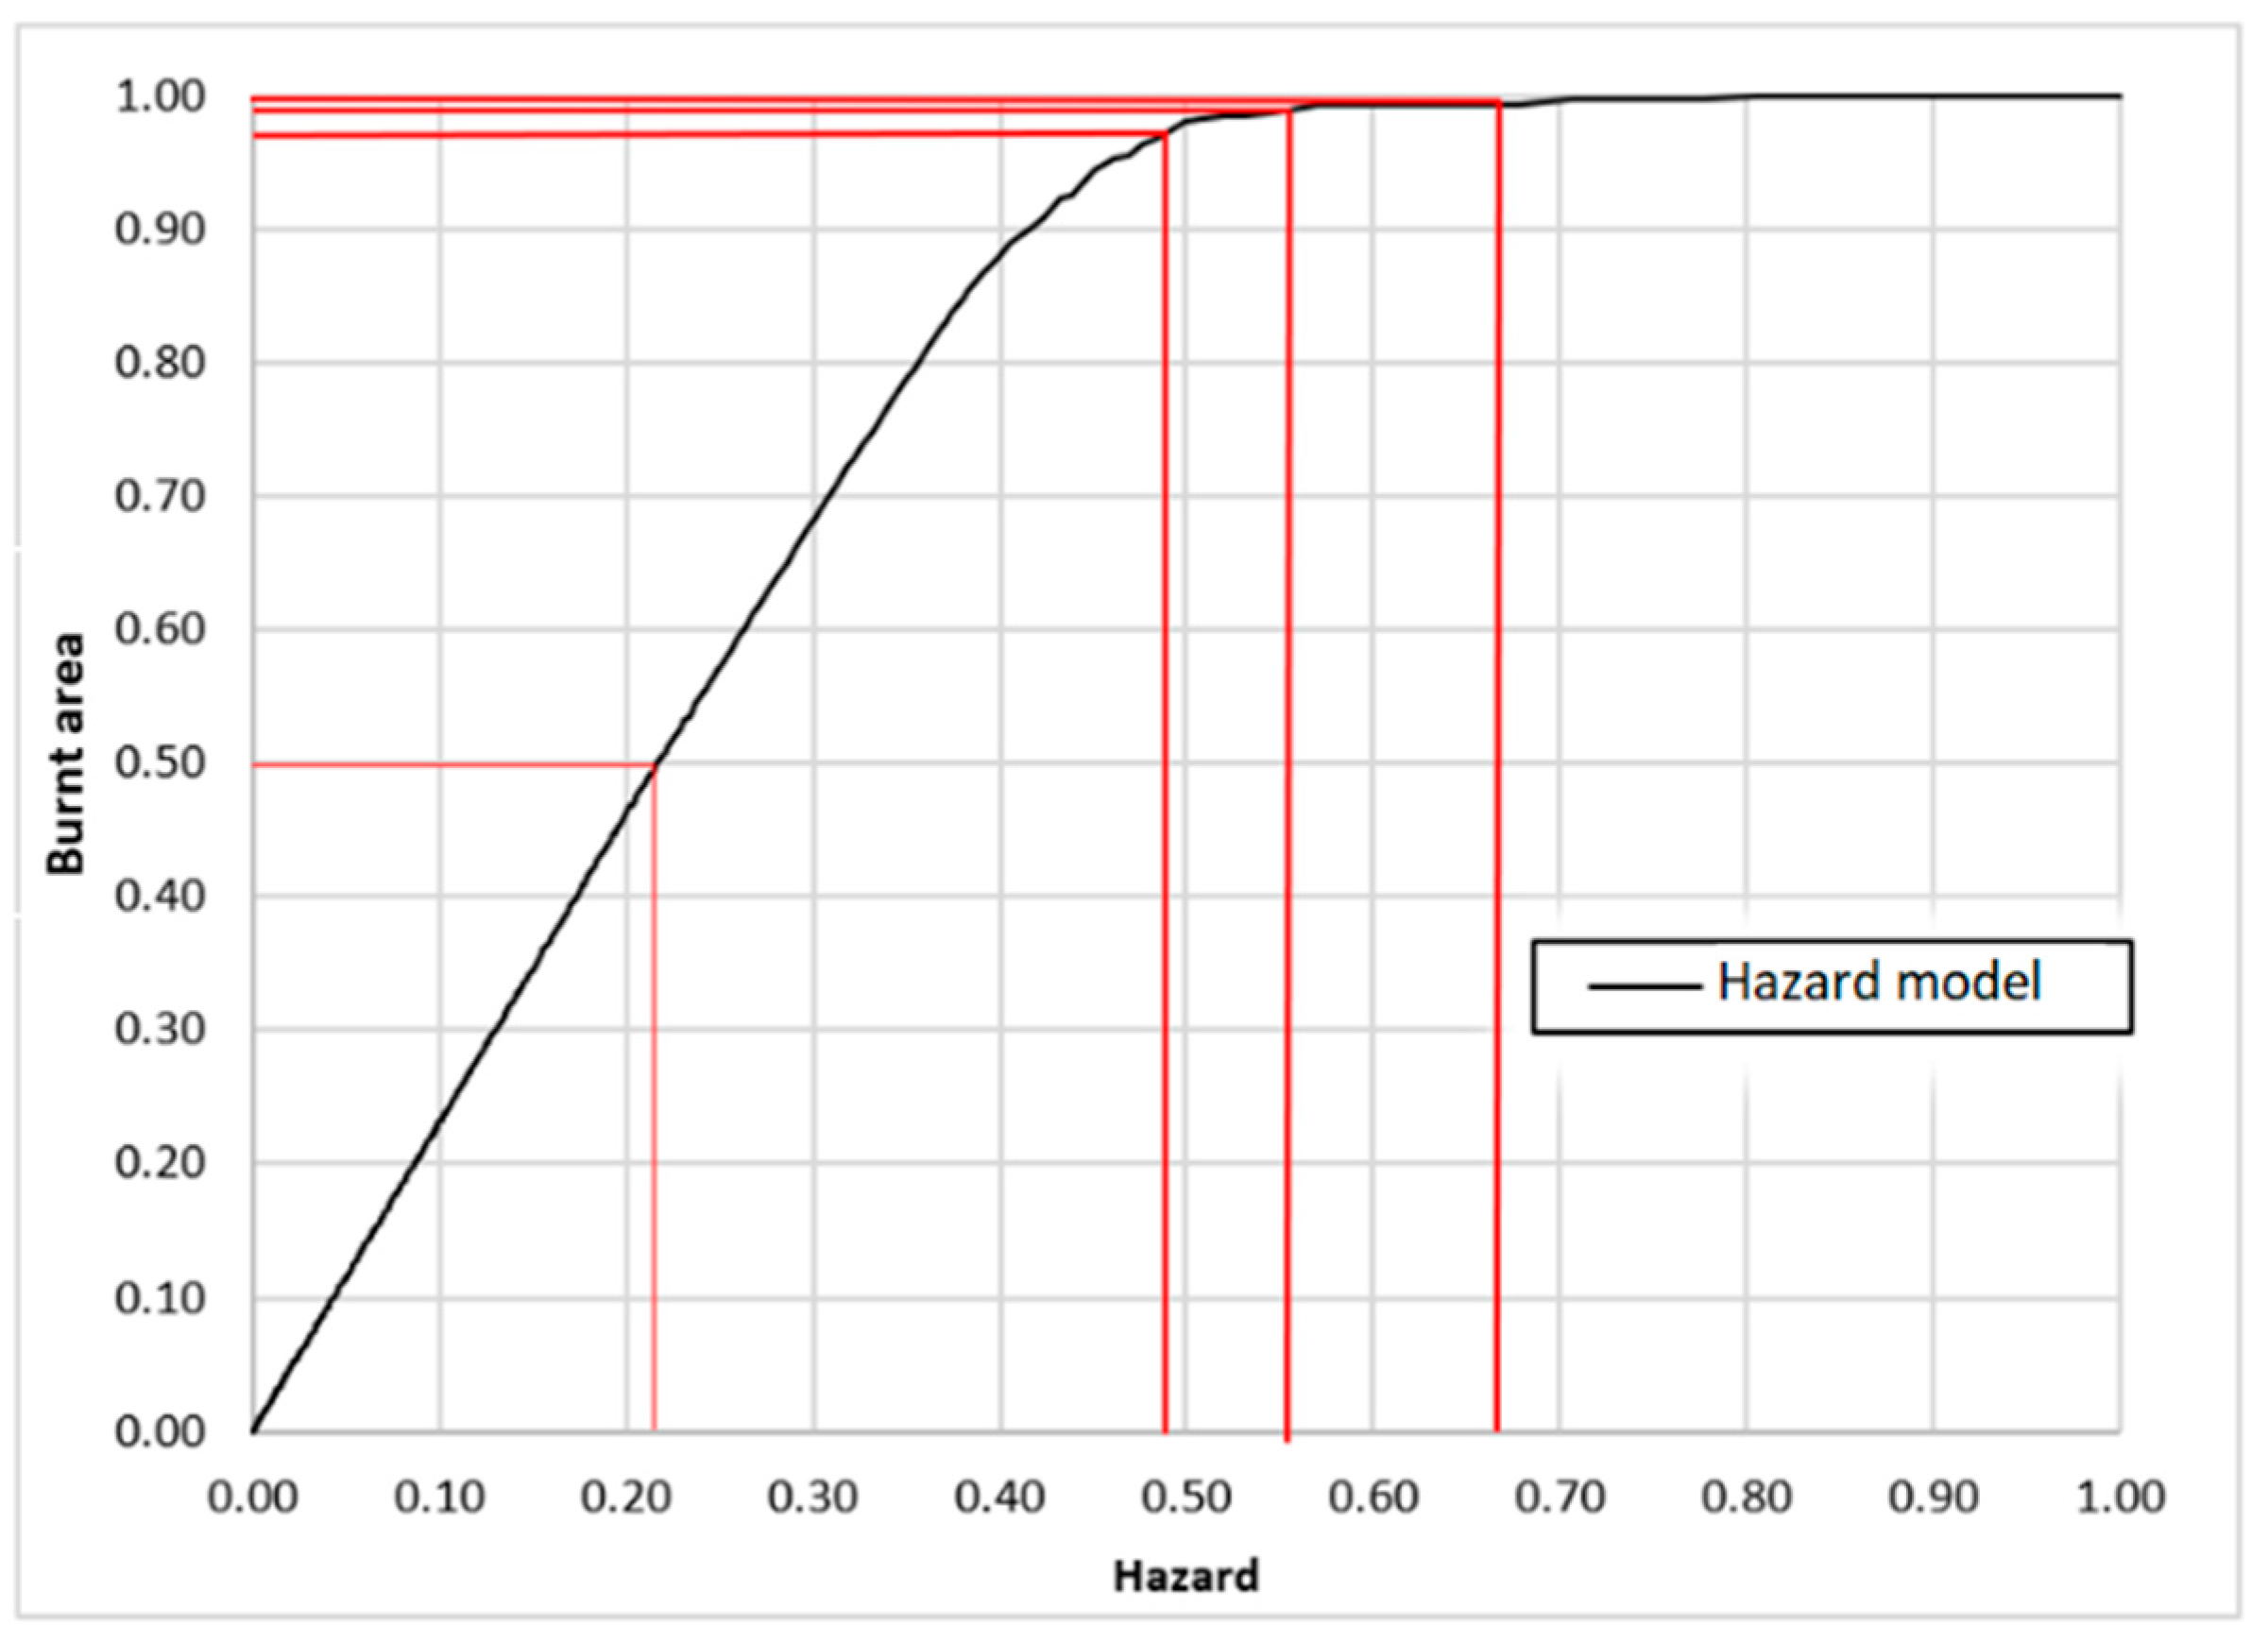
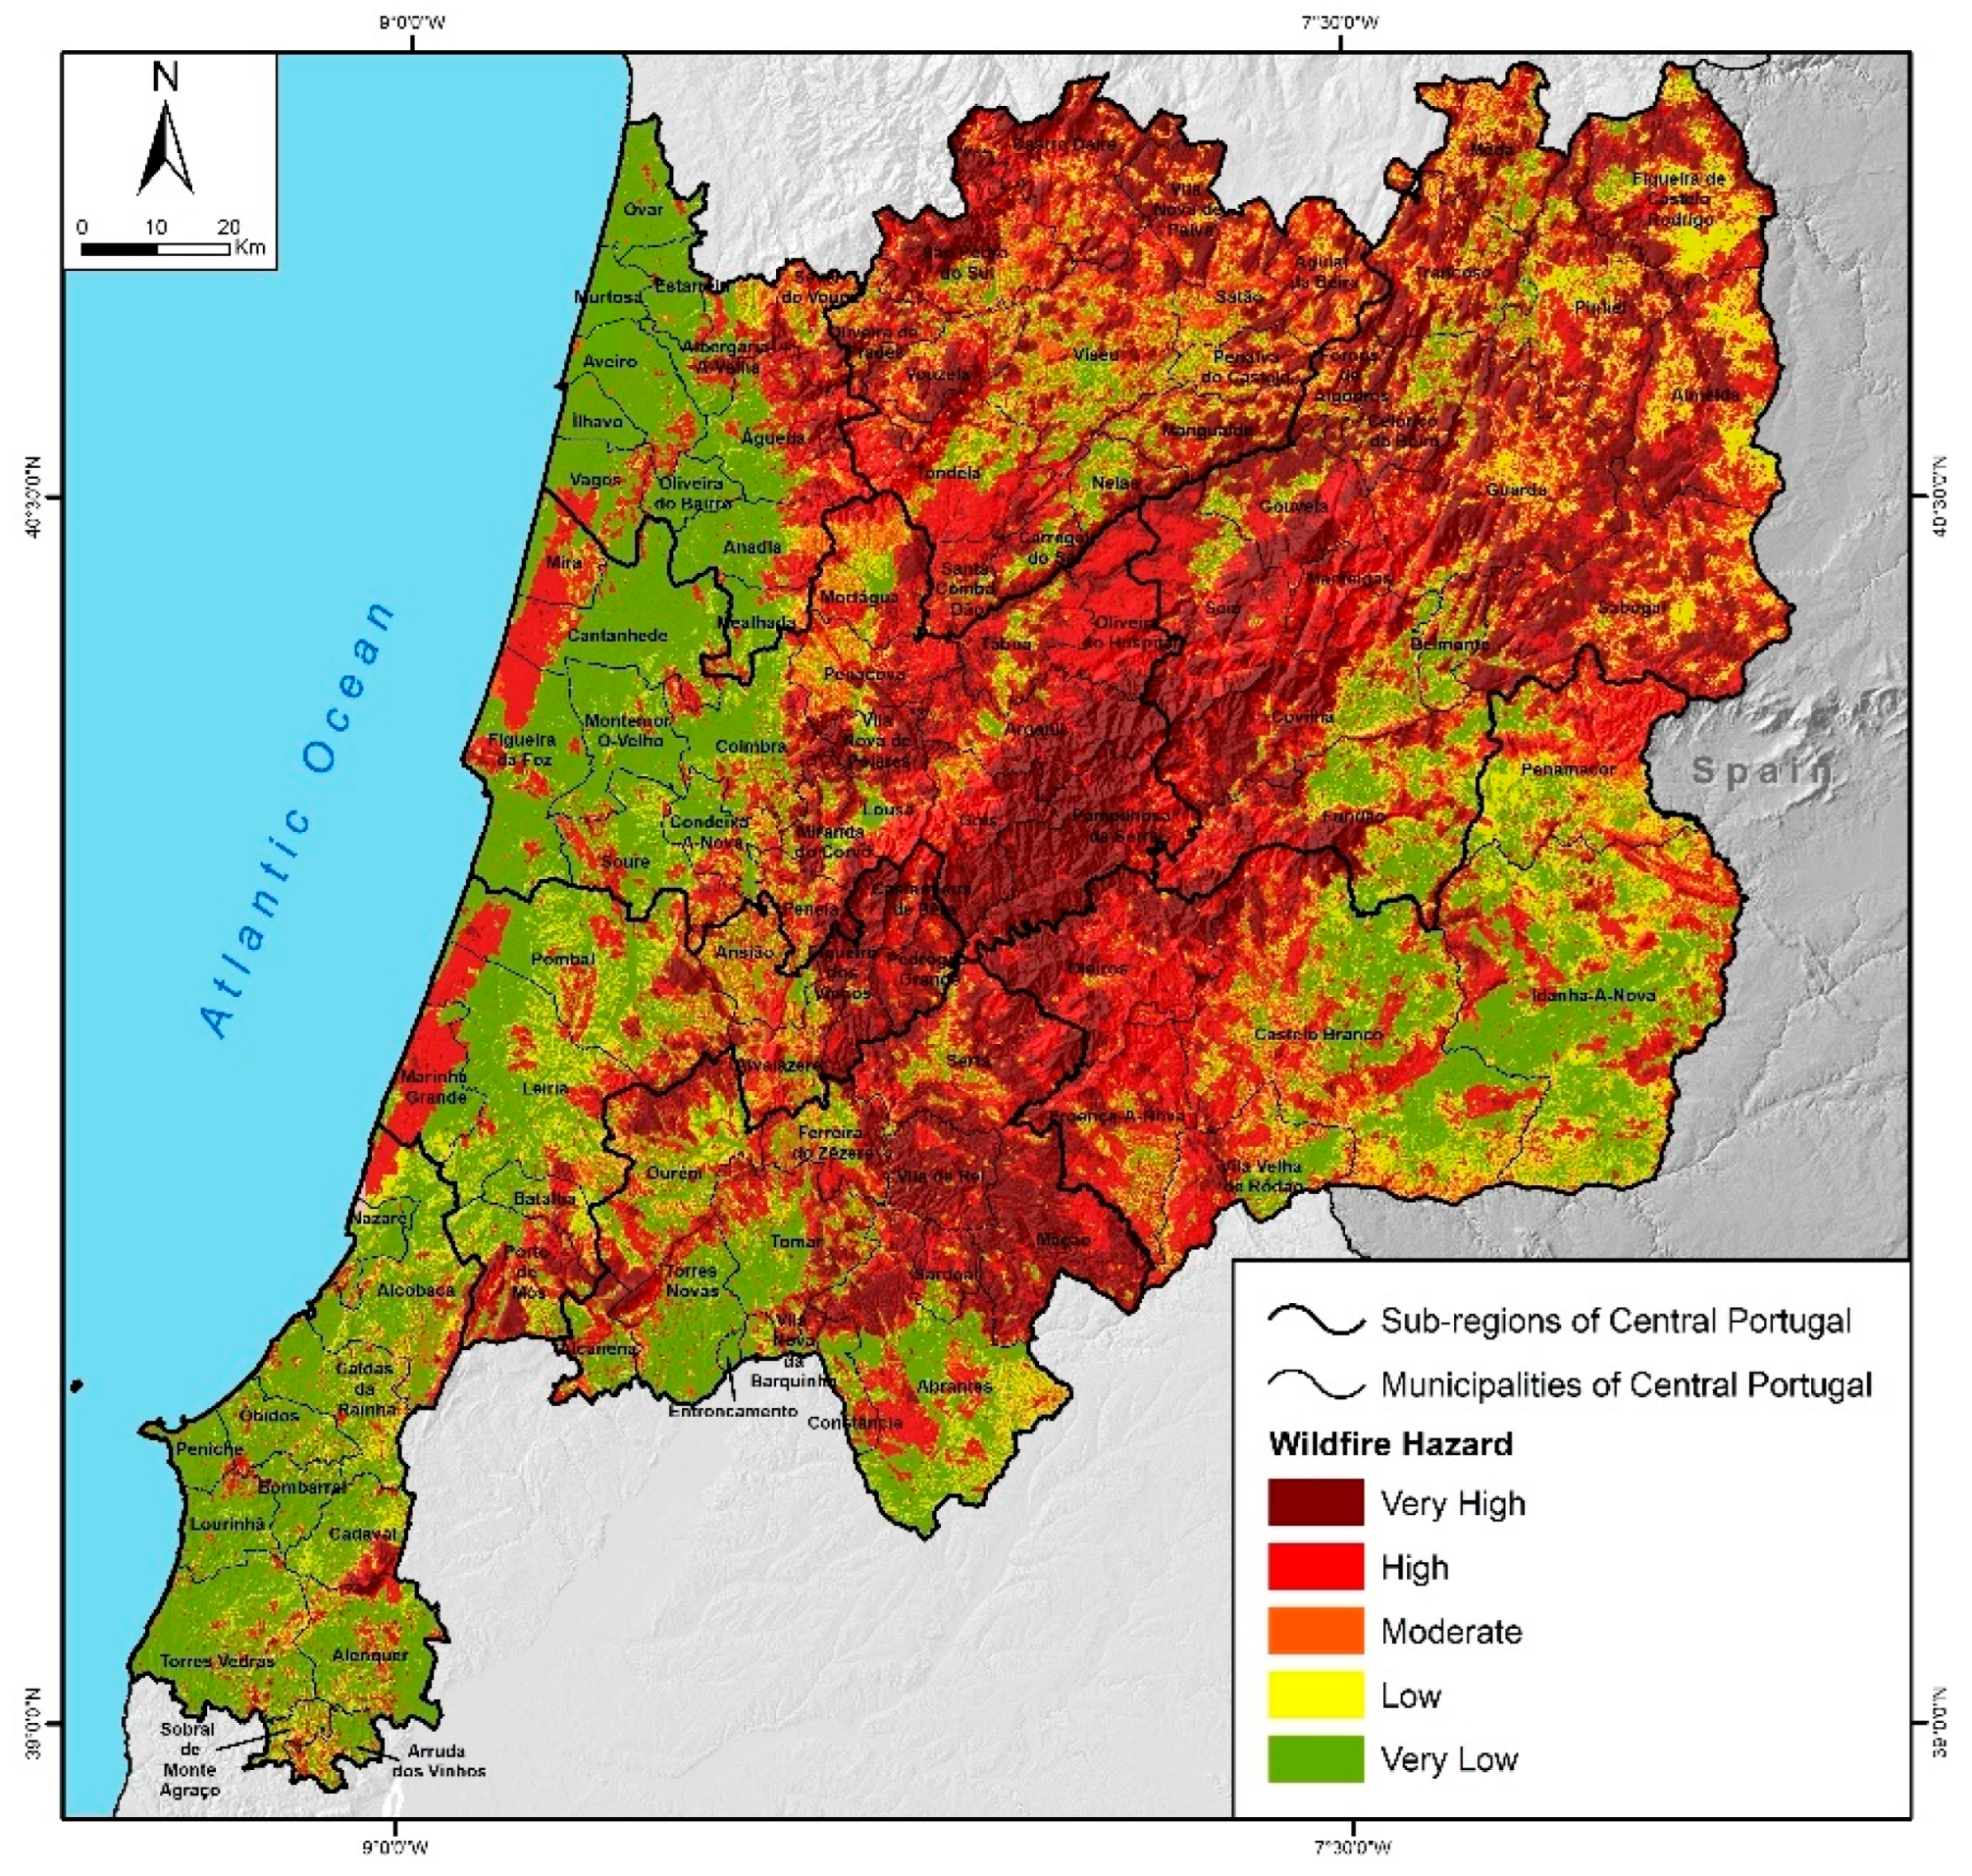
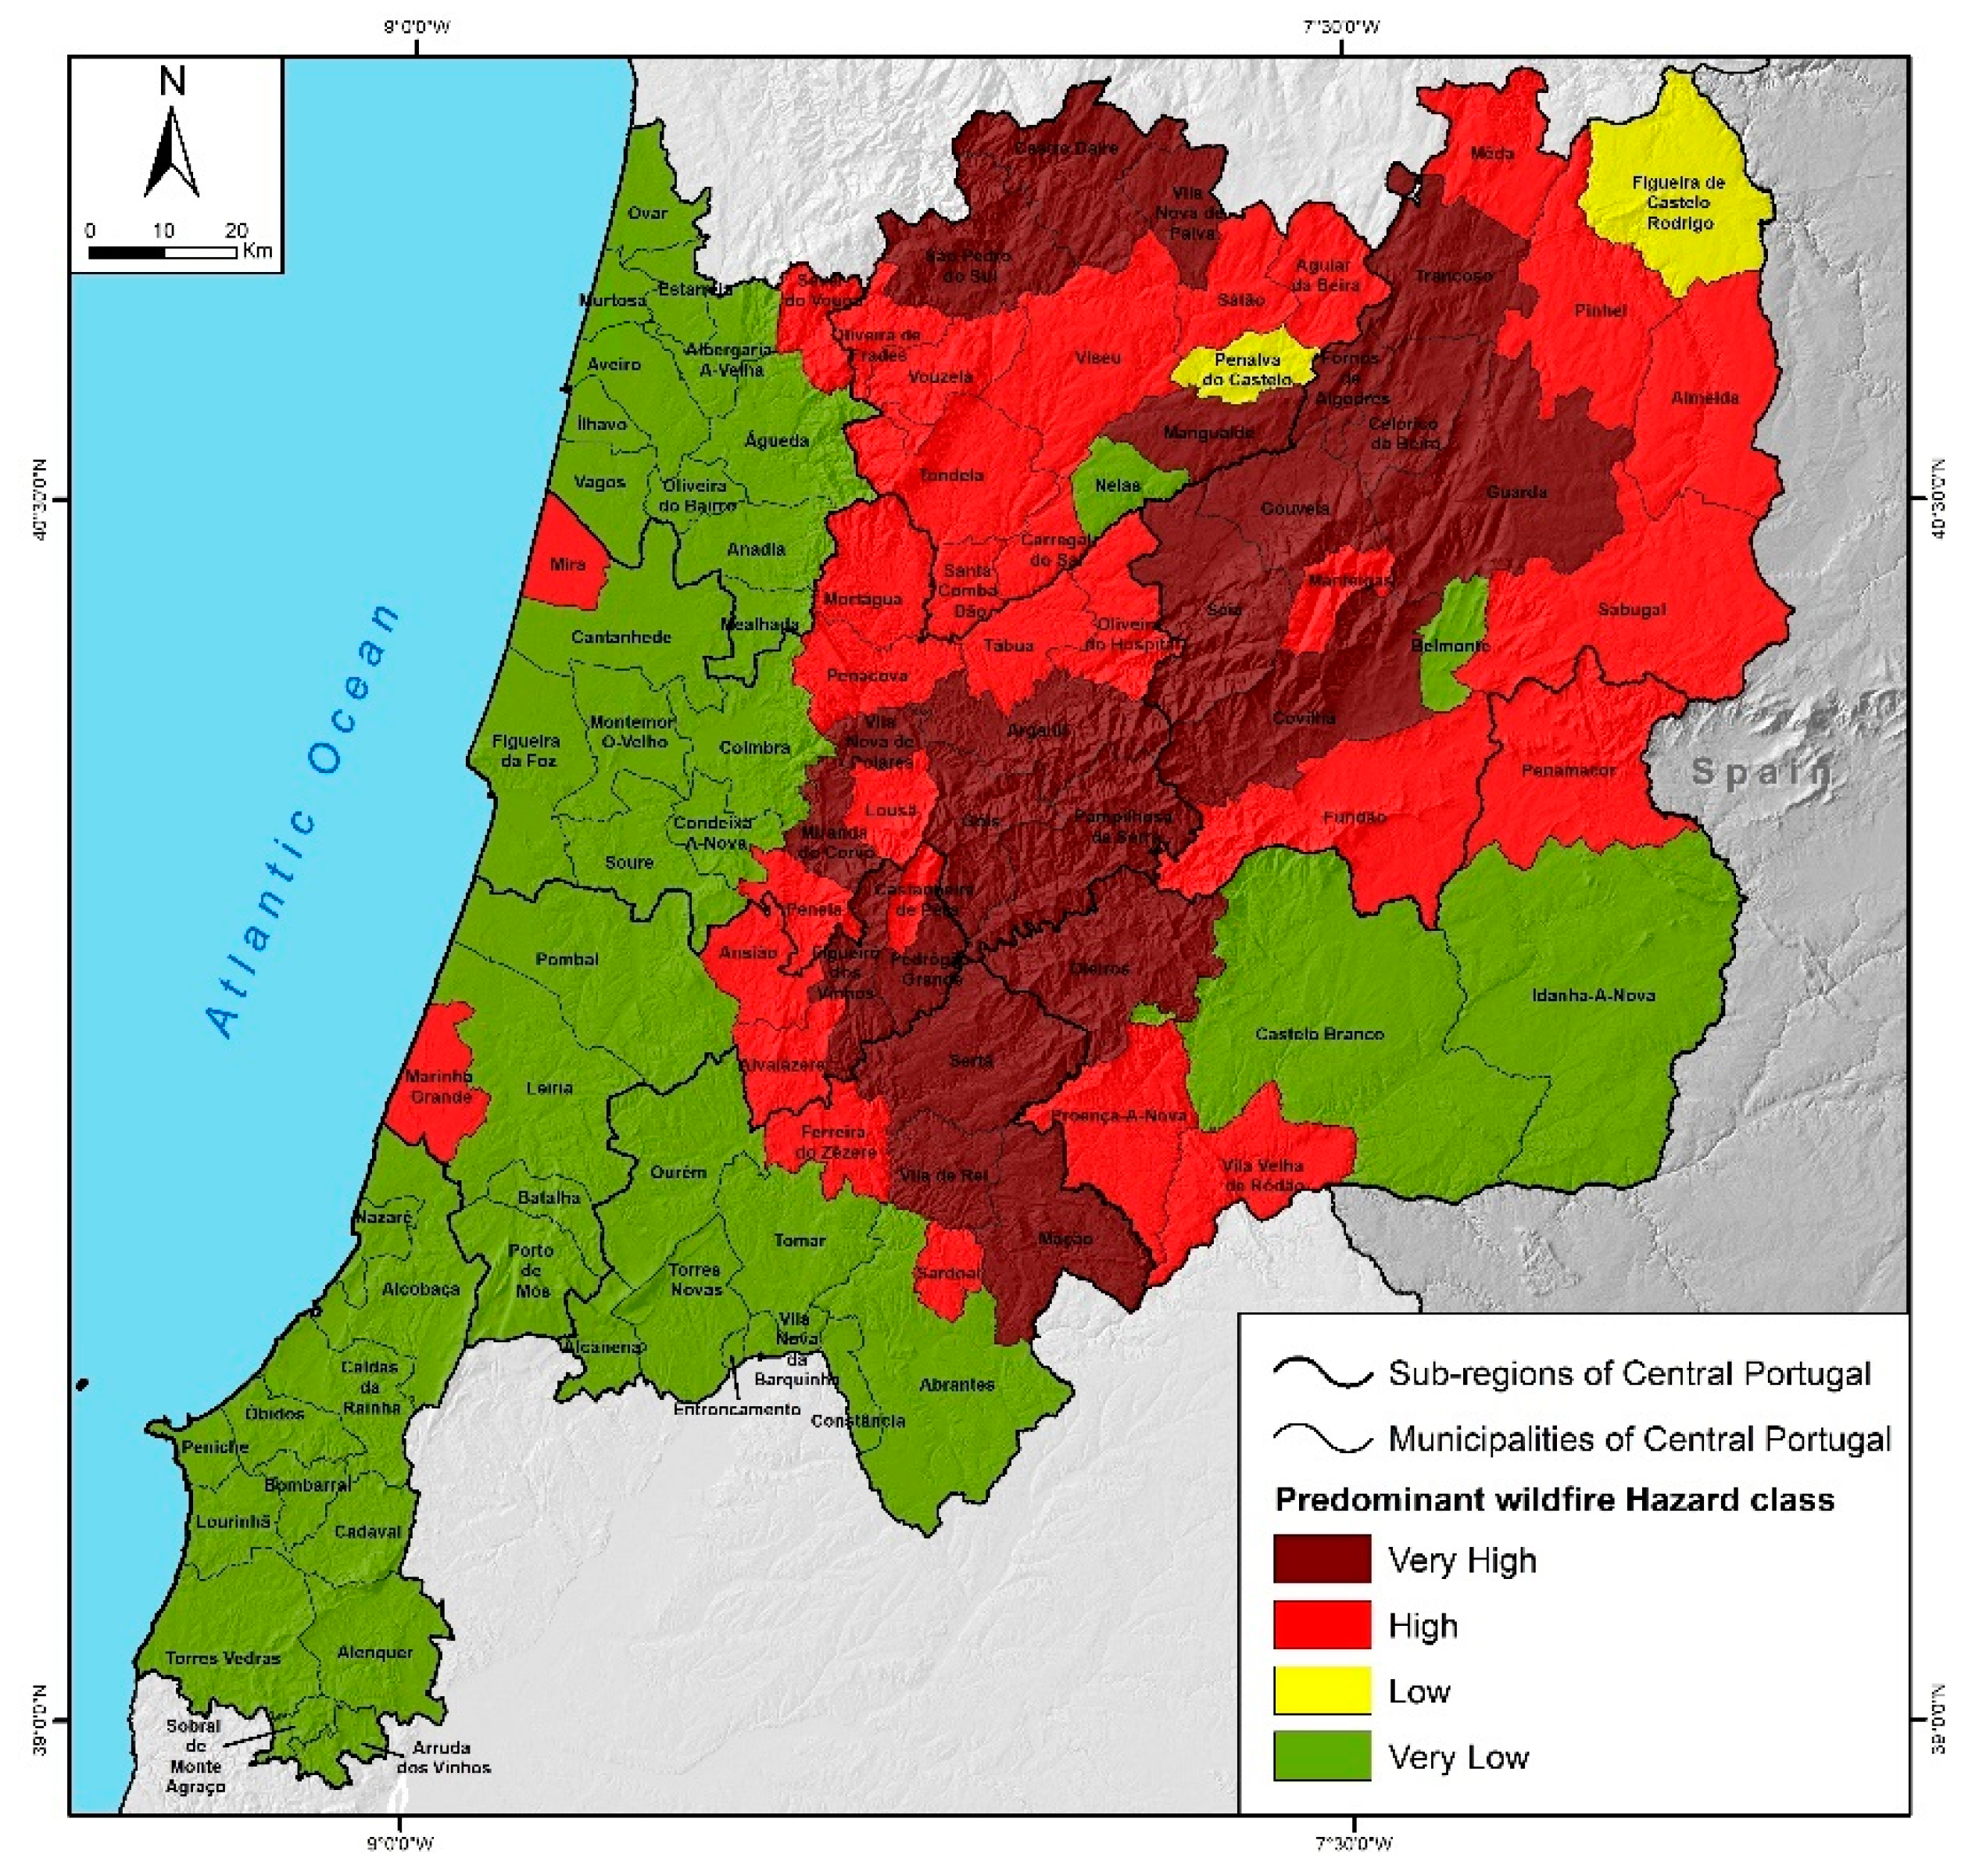
3.2.2. Wildfire hazard

Spatially, in the Central Region, the hazard classes with the most representation are high and very low, both with values around 29%, followed by very high (21.6%), low (13.7%), and finally, moderate (6.1%). These results show that in more than half the territory of the Central Region, the wildfire hazard is high or very high (Figure 10). The analysis at the municipal level shows that 20 municipalities are distinguished by the predominance of the very high hazard class (Figure 11). They tend to be located from north-east to south-west and include the most mountainous areas of the Central Region. The high class includes 34 municipalities in the central and northern interior of the Central Region. However, the municipalities where the low hazard class predominates follow the western coastal strip and the more southern interior of the Central Region.

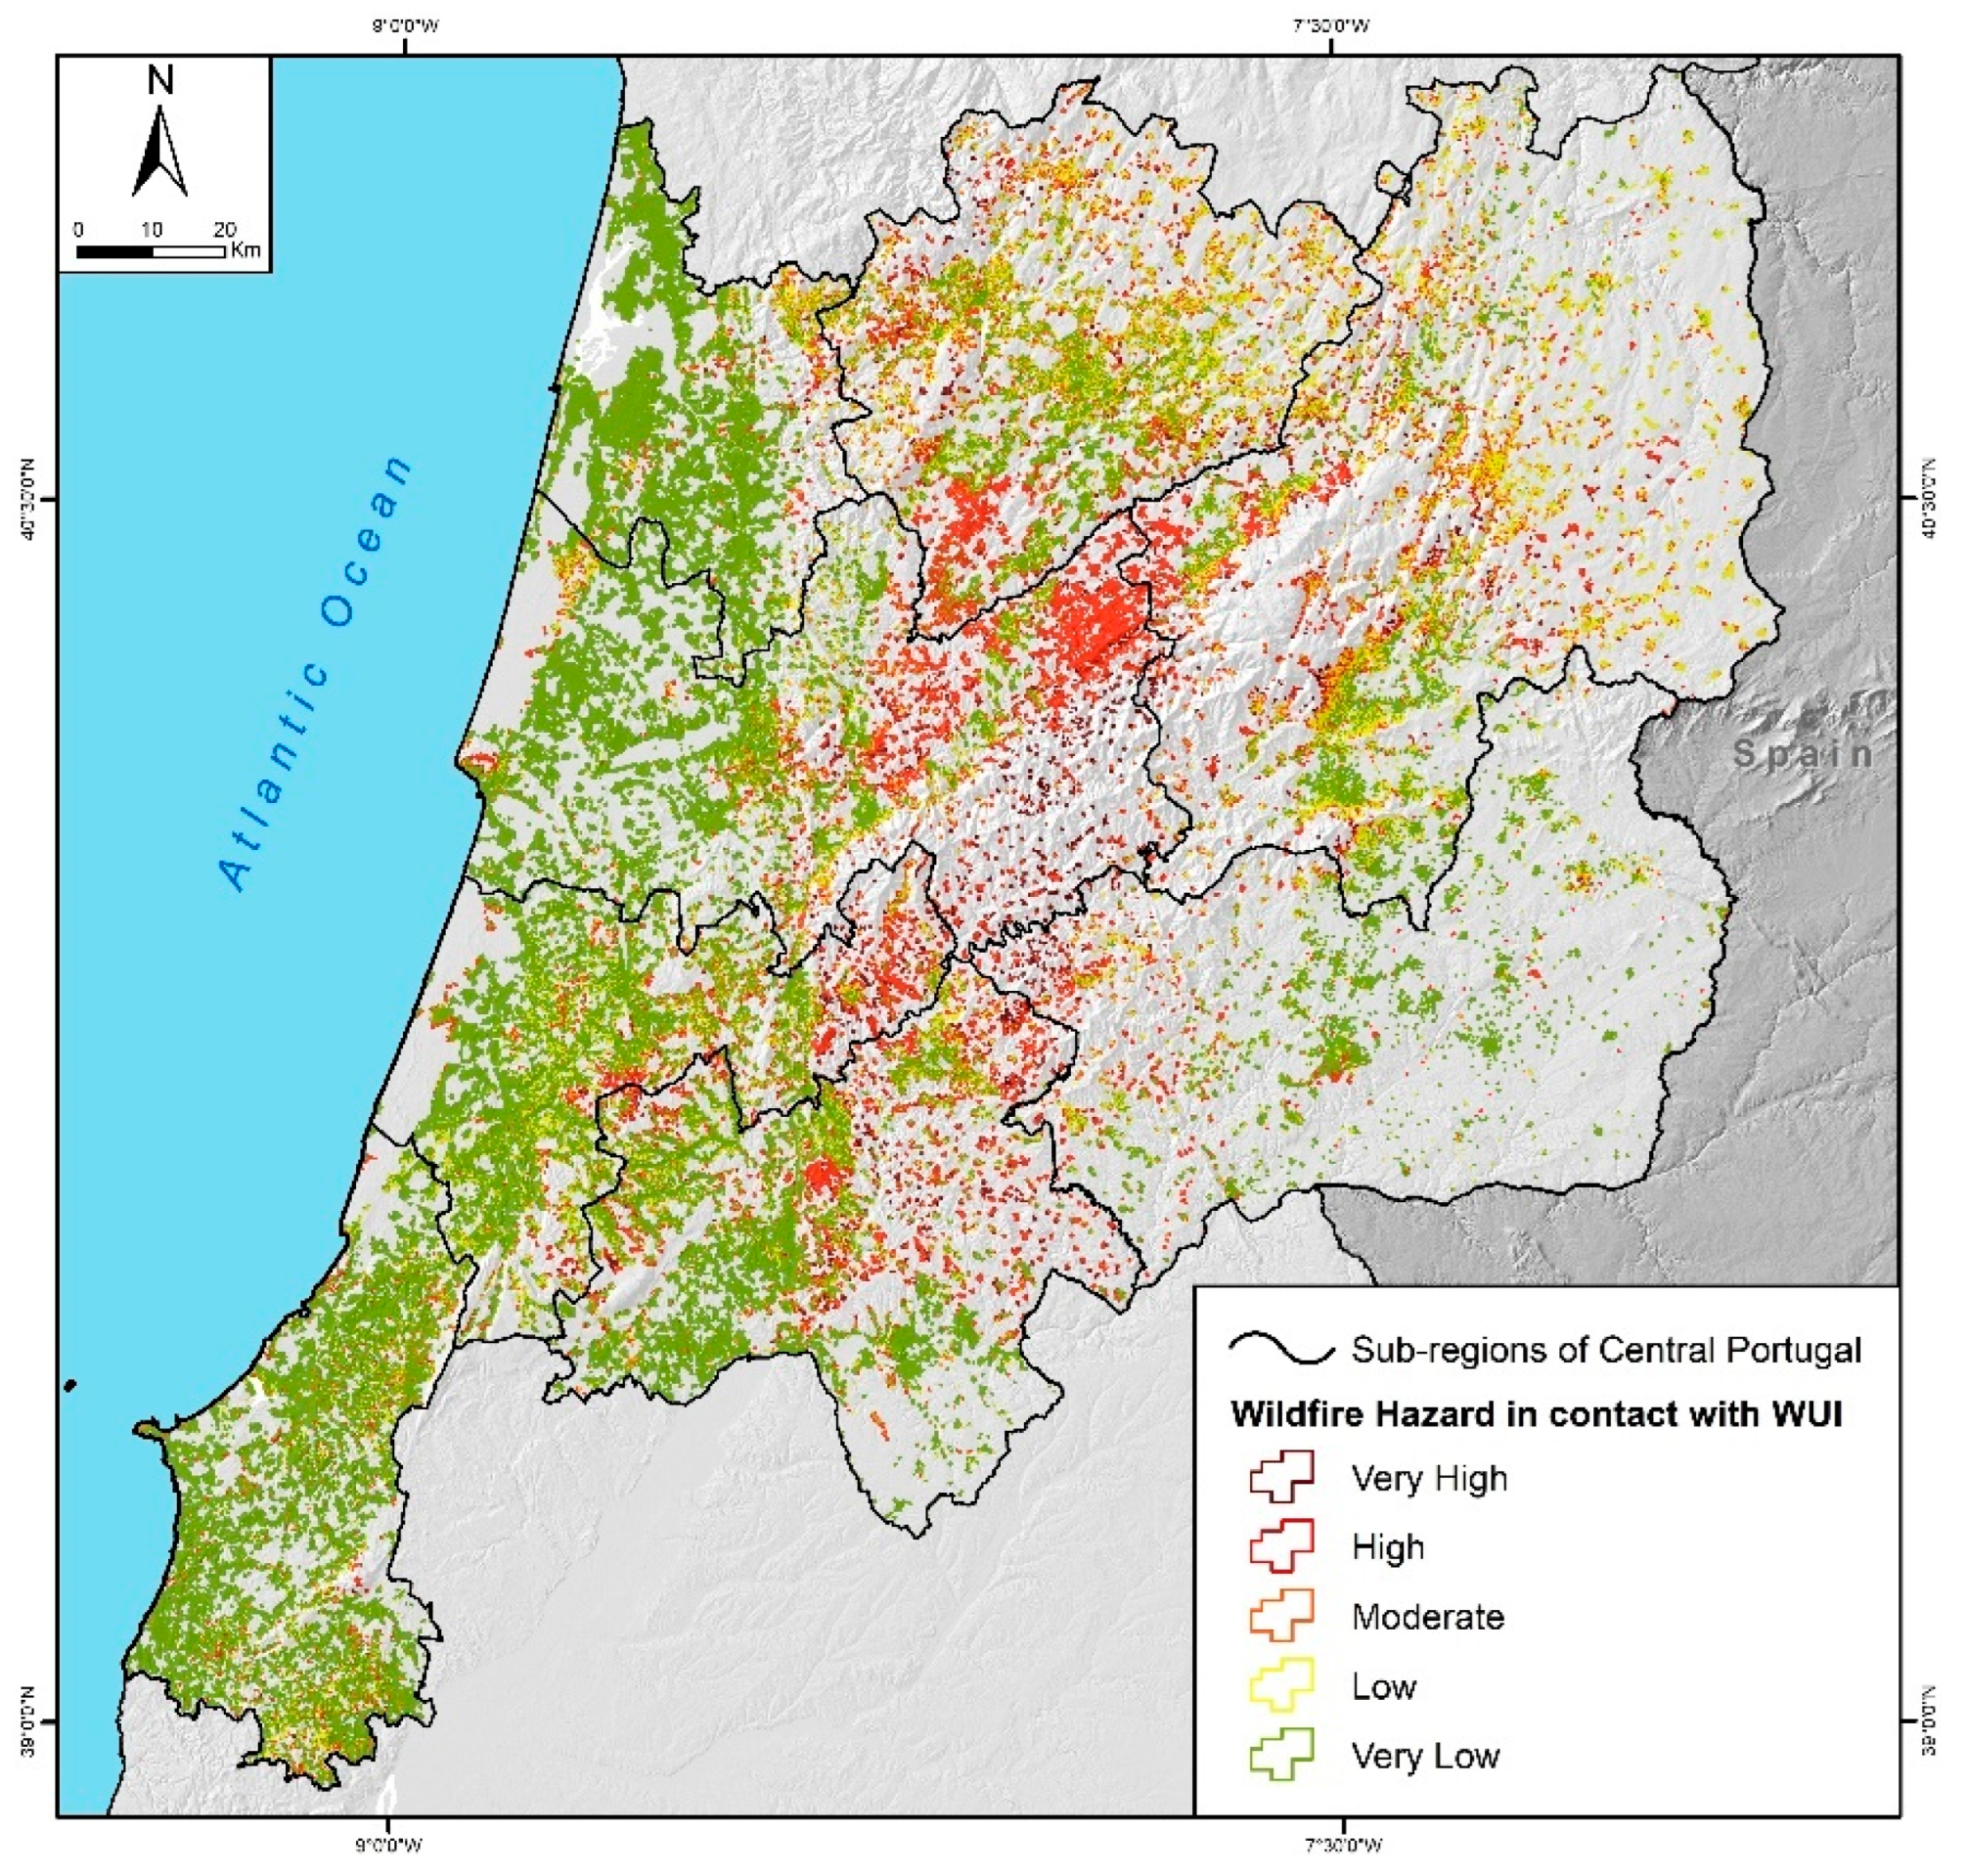
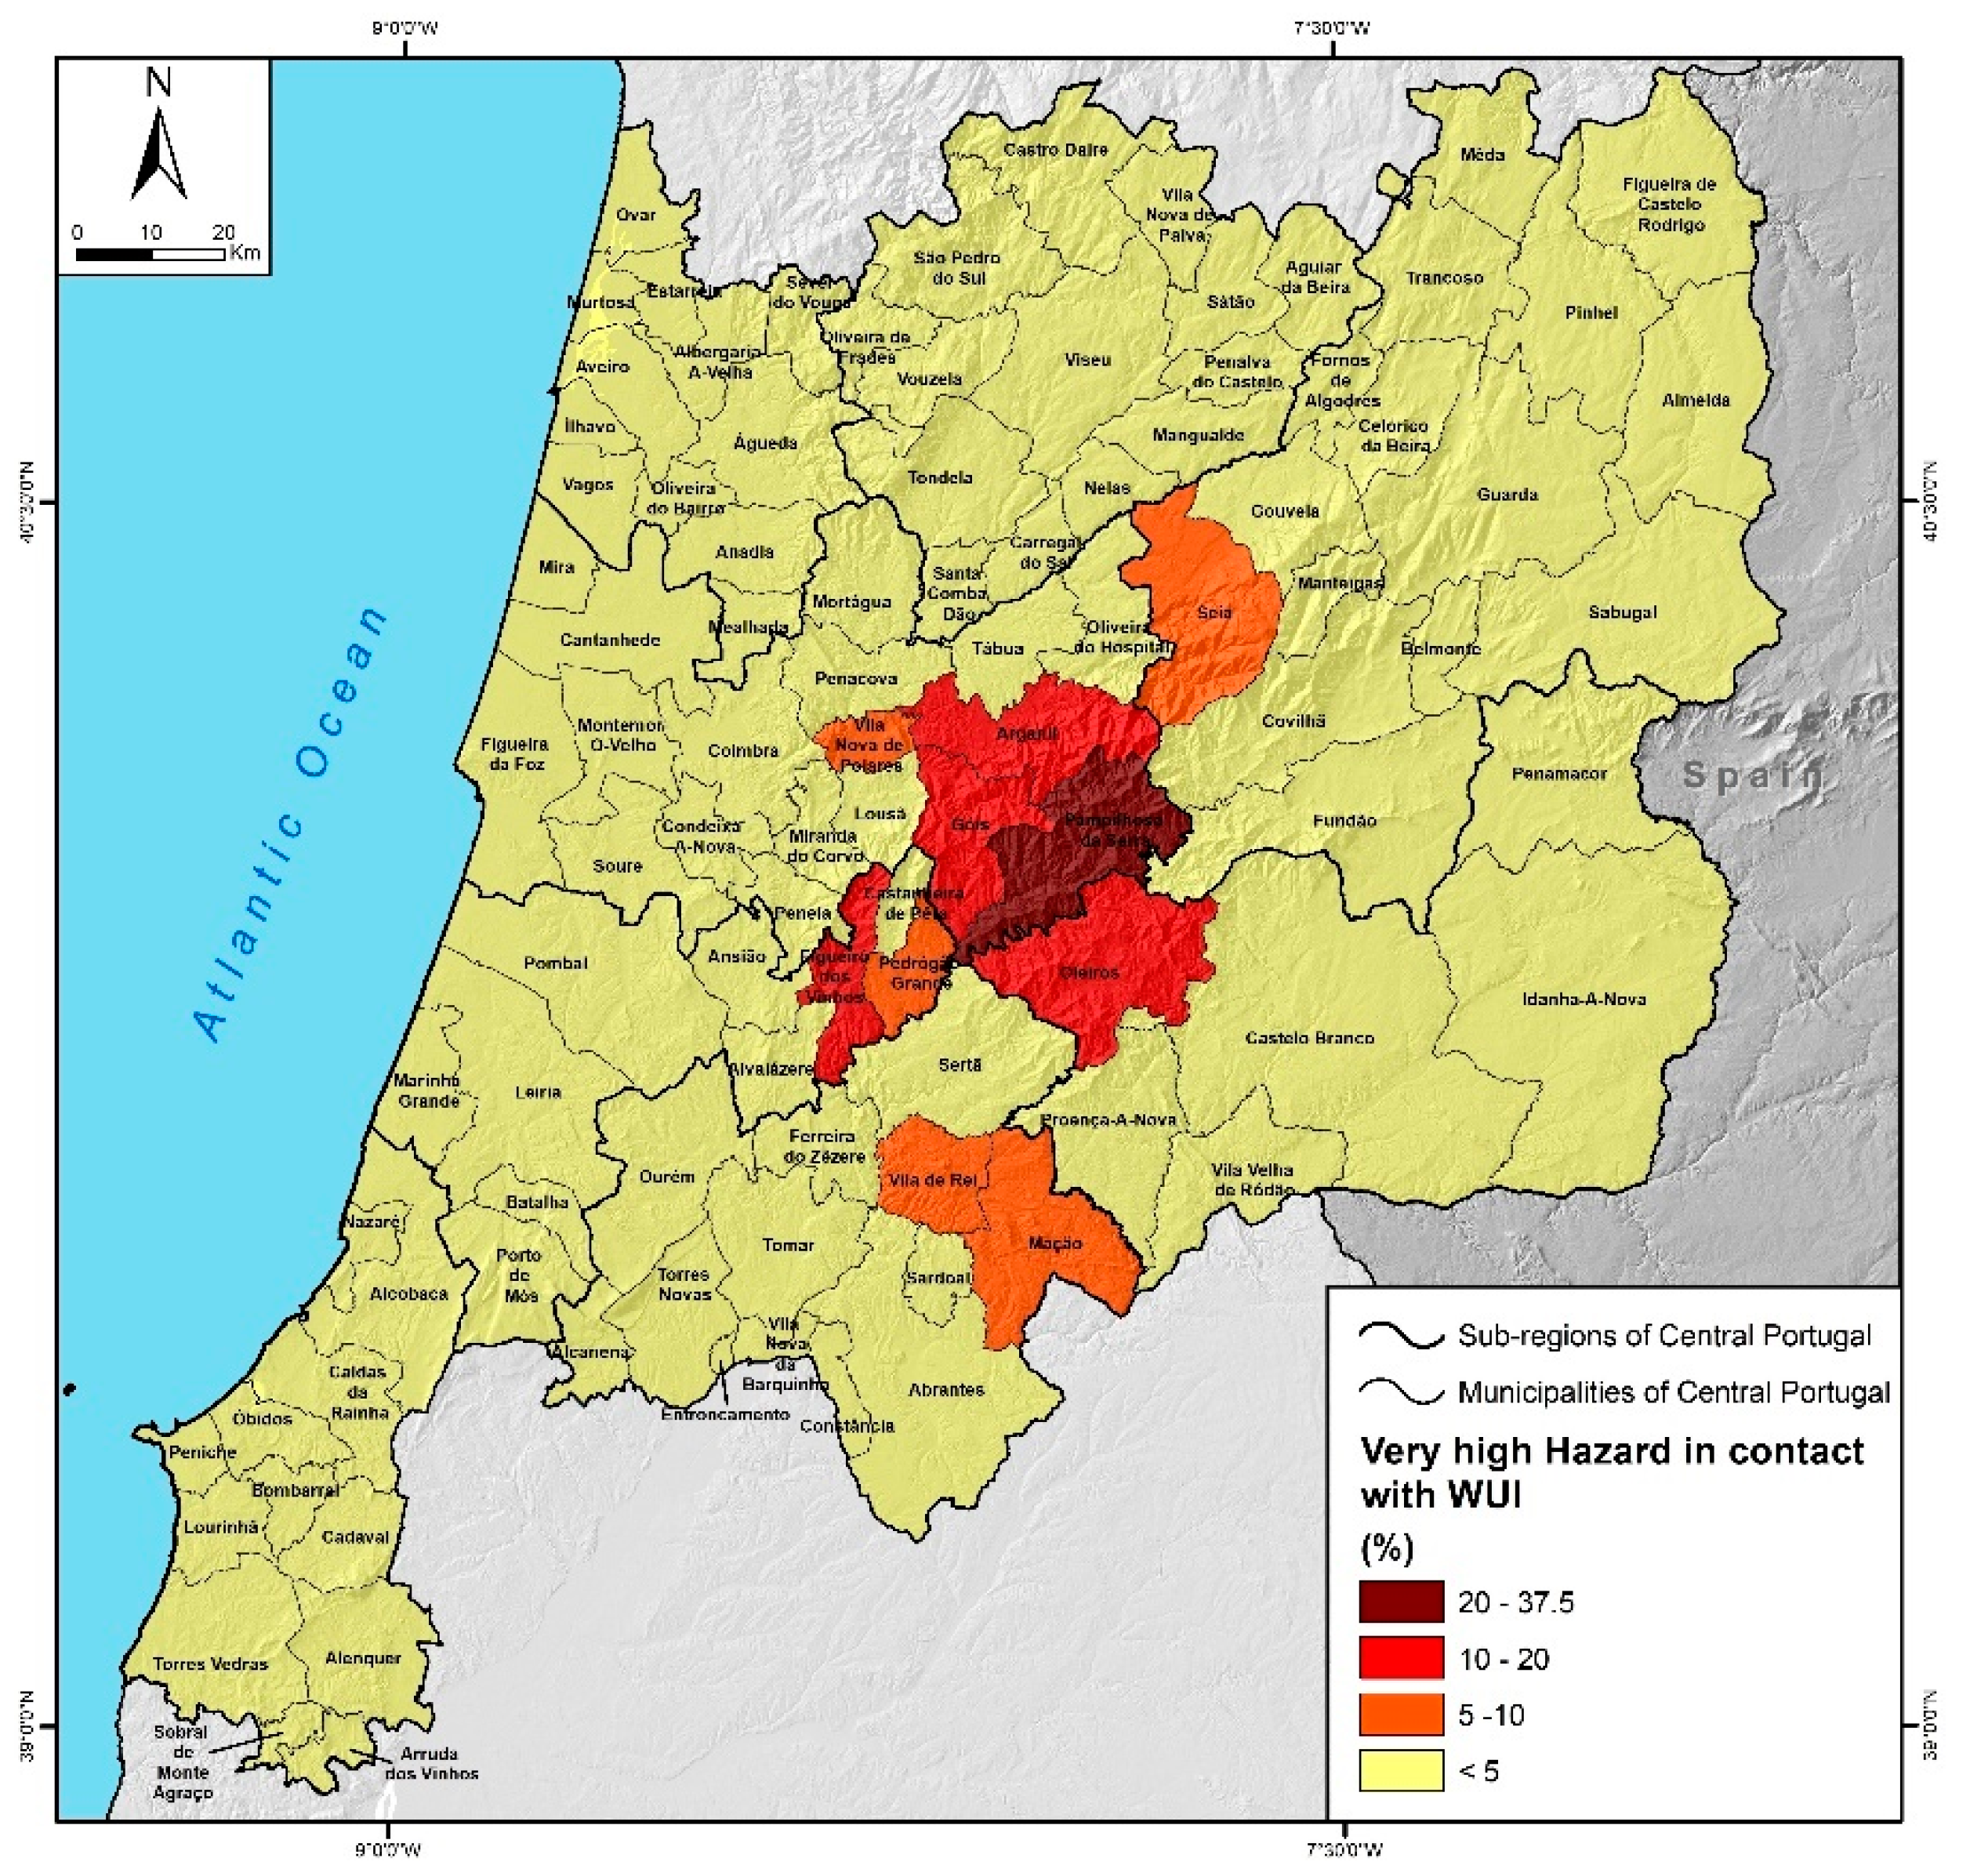
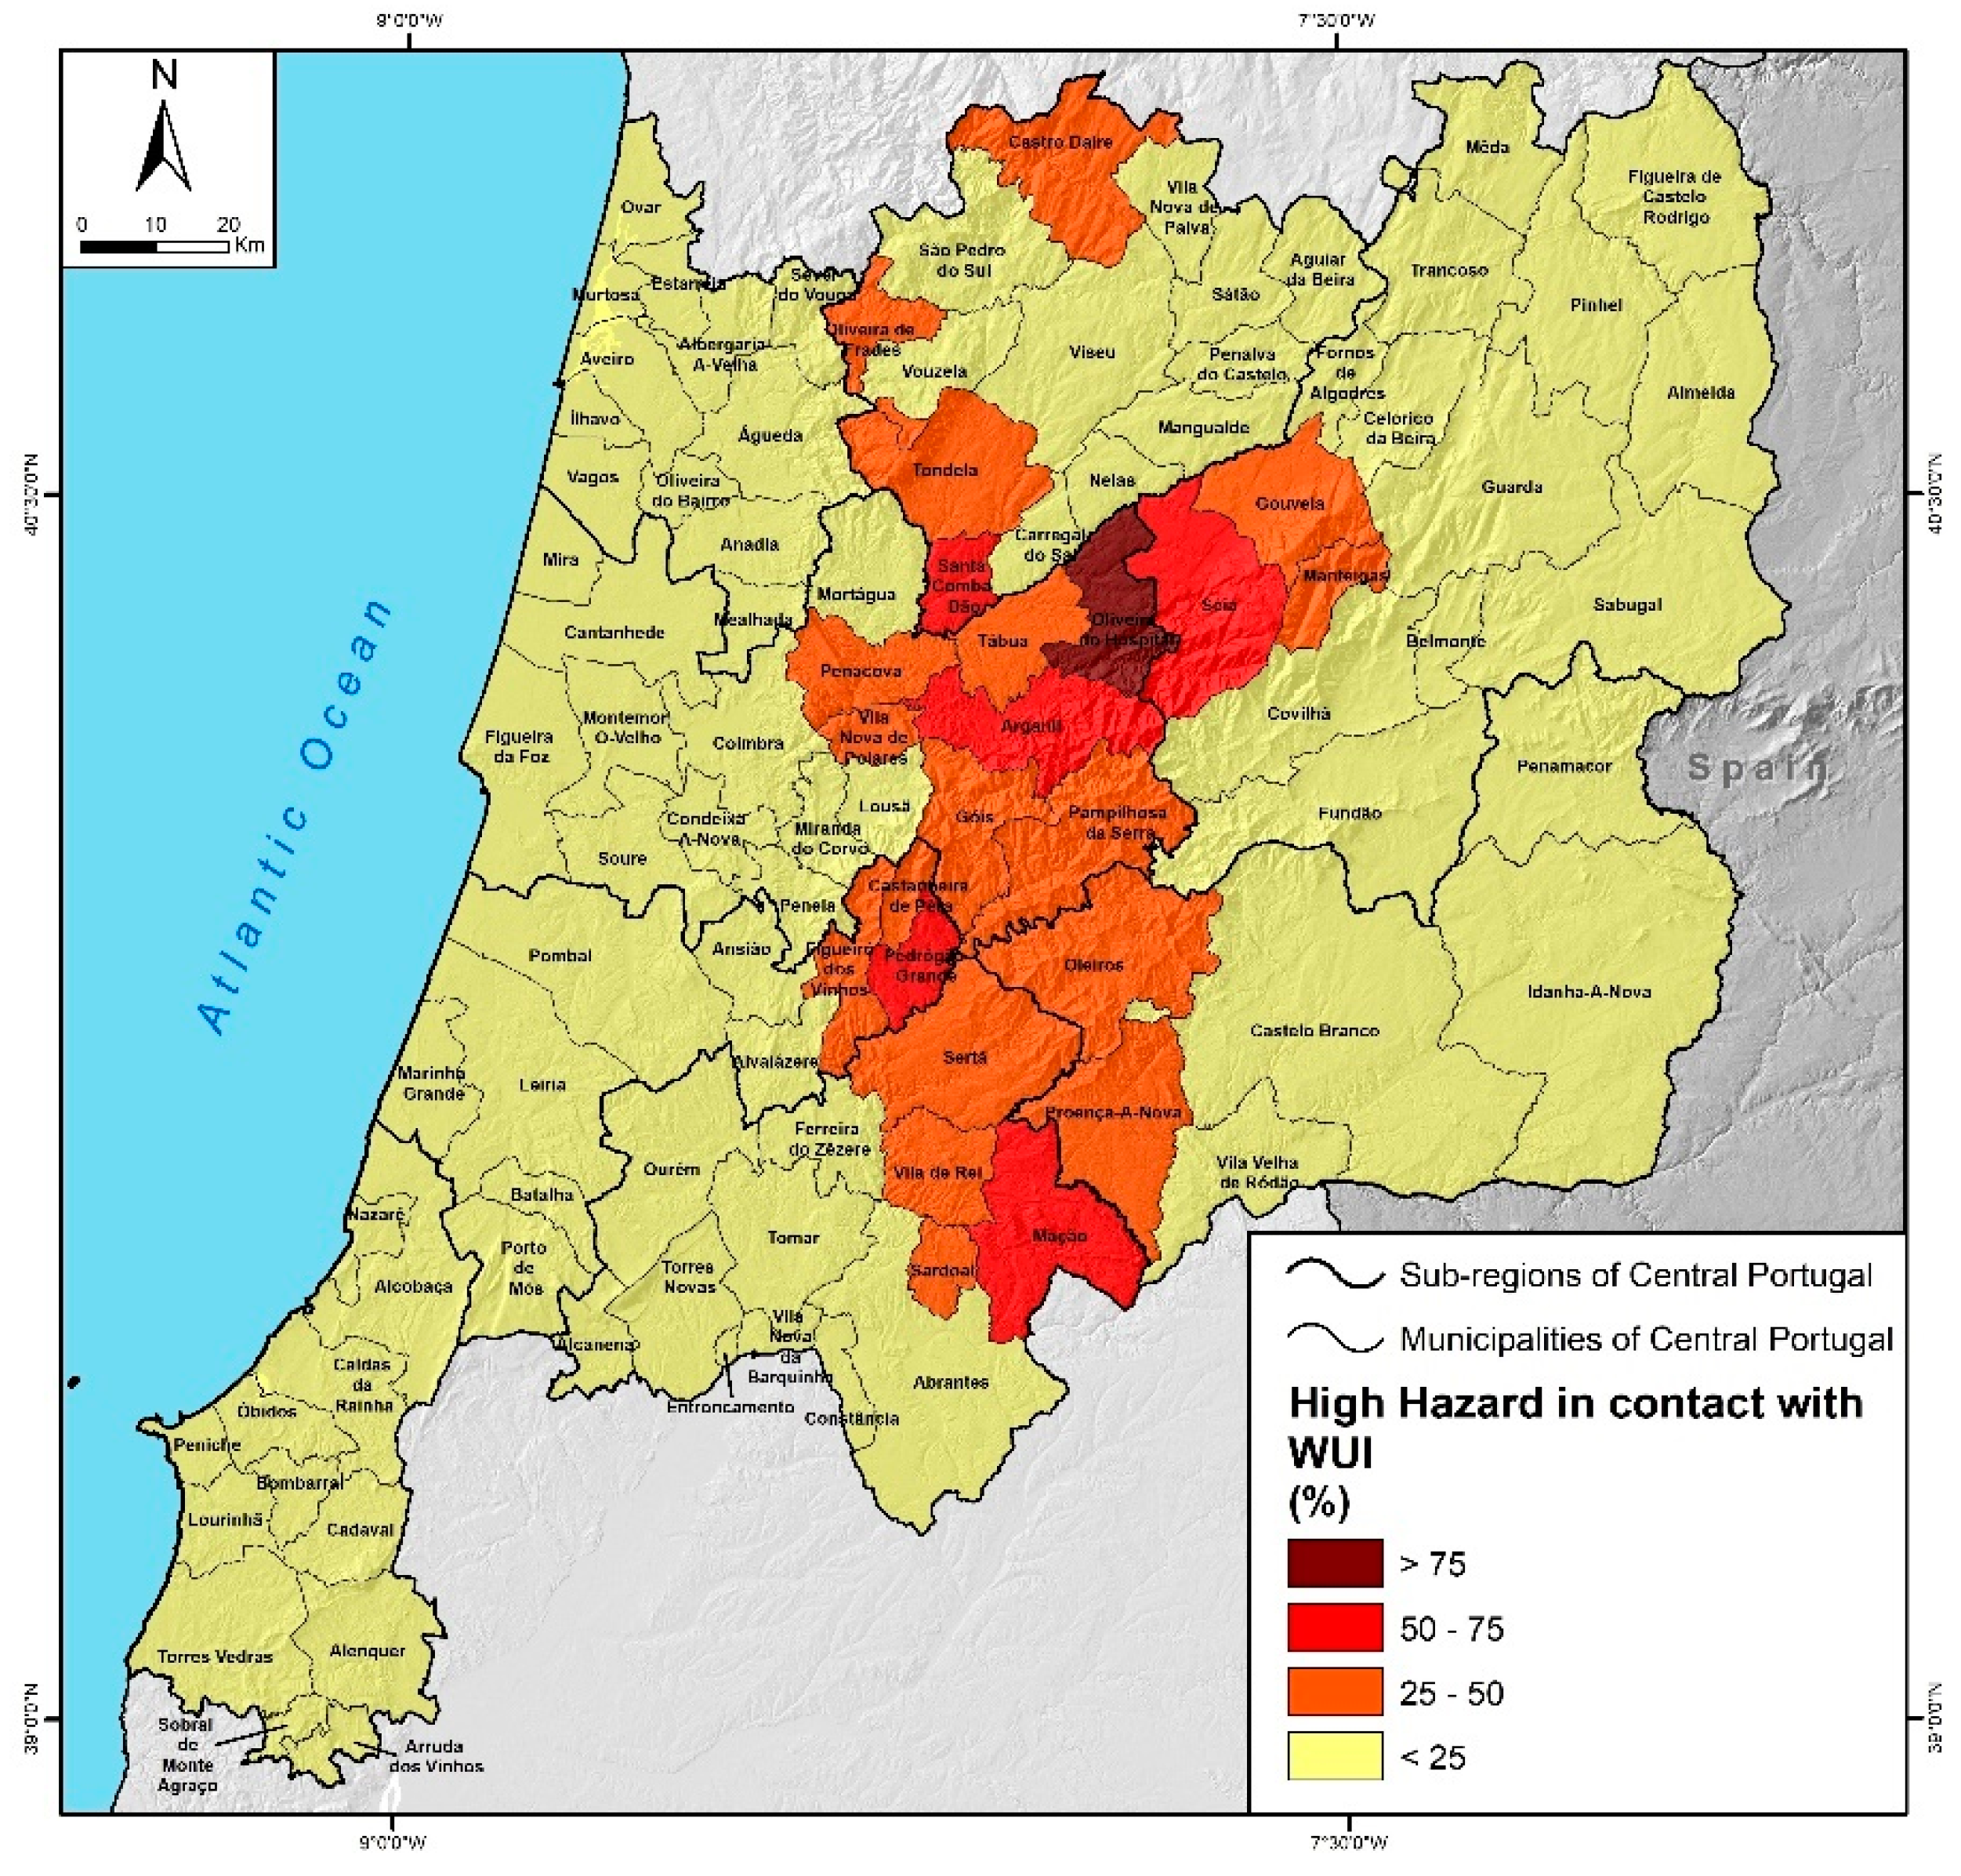
3.3. Wildfire Hazard in WUI in the Central Region

The intersection of the different wildfire hazard classes at the Central Region level with the different kinds of WUI means that we can confirm that most of them are in contact with low or very low hazard classes in a total of 87% of the segments (Figure 12). On the other hand, the high and very high hazard classes represent 3.9% and 0.3%, respectively, although the high hazard class is in contact with about 9% of the WUIs classed as discontinuous urban built-up.
Considering this analysis at the municipality level, it is possible to identify, however, municipalities where the high or very high wildfire hazard classes in contact with WUIs are of more concern (Figure 13 and Figure 14). Thus, with the highest percentage of WUIs in contact with very high wildfire hazard, the Pampilhosa da Serra municipality stands out, with 37.5% of the interfaces (Figure 13). This is followed by neighboring municipalities such as Arganil, Góis, and Oleiros, where the contact ranges between 10 and 20%. If we consider the high-hazard class, the Oliveira do Hospital municipality is notable for having about 96% of its WUIs in contact with this class, followed by Seia (50.3%), Mação (50.8%), Arganil (52.8%), Santa Comba Dão (53%), and Pedrogão Grande (58%) (Figure 14). In general, these municipalities take in the southern part of the range of mountains of Central Portugal, but also a zone known as the interior pine forest, which, as the name indicates, is characterized by the predominance of coniferous forests and is highly inflammable.
The analysis of the type of LULC present in the various classes of wildfire hazard in WUI contact areas shows that in the classes of low and very low hazard, agricultural crops predominate, while in the highest classes, i.e., very high and high, shrub communities and coniferous forests and bushes predominate, respectively. Note that in the WUI contacts where the hazard is very high, scrubland is present in around 60% of the segments. Fast-growing woodlands dominated by eucalyptus forests are not very well represented in WUI contacts with high or very high hazard classes, ranging as they do between 20 and 30% (Figure 15).
When land cover, the degree of hazard, and the different kinds of WUIs are assessed, it is found that agricultural crops predominate in all interface types (Figure 16), though there is a clear presence of a significant percentage of scrubland and bushes in contact with interfaces where the urban built-up is discontinuous and the hazard is high or very high. Despite being less abundant, scrubland also emerges in contact with the continuous built-up area whose hazard is high.

4. Discussion

Wildfires in Portugal affect extensive areas of the territory and often threaten urban areas, from the edges of large cities and towns to the small rural villages. The total length of the WUIs in the Central Region exceeds 60,000 km, with discontinuous built-up area being a dominating factor. According to the Land Cover Map (2018) specifications, this corresponds to built-up area mostly occupied by isolated residential buildings associated with mosaics of cultivated land and other areas with vegetation, predominantly scrub. The results also reflect substantial regional variations in the length and density of WUI, in direct correlation with population density. In fact, the coastal municipalities significantly increased their population in the past few decades, and nowadays, they have the highest population densities and urban concentrations. Around 2/3 of the Portuguese population lives in the urban and suburban areas of the coastal regions between the metropolitan areas of Lisbon and Porto [48]. At the same time, both the central inland municipalities and those in the northern and southern regions were severely affected by population exodus, leading to a reduction in the size of herds, the abandonment of farmlands, and a reduction in the amount of forest fuels consumed by grazing and being used as firewood [48,49,50,51].
Following the worldwide trend [4,52,53,54], the WUI areas are increasing in Portugal [55] as a result of the increasing mixture of urban settlements and woodland due to (i) urbanized spaces that are expanded to forested areas and (ii) scrubland and woodland that are colonizing rural areas due to the rural abandonment [41,55,56]. Moreover, areas where urban zones and wildlands meet or intermingle are shown to have a positive relationship with the risk of wildfires igniting [6,57,58]. Given the growth of WUIs in Central Portugal, mainly dominated by scattered and isolated houses, wildfire prevention measures are needed to reduce the hazard to and vulnerability of urban and rural areas. In the region under study, local variations in biophysical characteristics (altitude, slopes, and LULC) gave rise to significant differences in the wildfire hazard, showing that the most fire-prone regions are in the most mountainous areas. This agrees with the results obtained by Oliveira et al. [44] since the methodology used was broadly the same, the main difference only being in the land use types used. The relationship of wildfire hazard, at the landscape scale, with the WUIs showed that the vast majority of WUIs have contact with very low and low wildfire hazard classes, where agricultural land is the most widespread land use.
The less fire-proneness of agricultural areas has been recognized in various works in different areas [48,56,59,60]. Thus, farmland around isolated houses and villages can act as a buffer zone against wildfires, except in the case of extreme wildfire episodes, when fire selectivity in specific land cover types is drastically reduced [44,61].
However, in the vicinity of WUIs with high and very high classes of hazard, scrublands and pinewood were the most frequent LULC types in our study area. Several authors [44,48,50,61,62,63] found a positive relationship between shrubland-type vegetation and burned areas. Various studies performed in Mediterranean areas found that cropland and broadleaf forests are less prone to fire in comparison with shrubland, grassland, and coniferous forest [26,64,65]. In fact, shrubland and grassland vegetation can rapidly colonize abandoned farmland and areas affected by fire [26,50], growing every year, which is encouraged by the high levels of precipitation, mainly in the coastal region and in areas with higher elevation. The low profitability of shrublands [66] and the lack of incentives for their management at a time when wildfire hazard reduction through fuel management was not compulsory near houses and settlements explain the predominance of this land cover. The high flammability of Pinus pinaster is also recognized by several authors [66,67] and confirmed by the levels of LRi recorded for the period of 2010–2015.
Studies on experimental fuel management, such as decreasing the amount of fuel load per unit area, have proved effective in reducing fire risk by up to 50% in urban interfaces [68,69,70]. Two main actions can be taken, namely fuel reduction in the forest surrounding the WUI, to provide a “defensible space” or safe protection buffer for homes during a wildfire, and homeowners’ efforts to decrease the flammability of their property and its immediate surroundings.
This is in addition to ensuring accessibility for firefighters so that they can provide further protection [71]. Several approaches have been used to explore the optimal location for fuel treatment [72,73,74,75,76,77]. For example, Syphard et al. [73] and Miner [74] found significant benefits from reducing vegetation around 5–20 m from a structure, after which the protective effect of carrying out fuel treatments farther away was not evident. Gibbons et al. [72], in a coarse-scale analysis in Australia, conclude that the defensible space closest to the structure (i.e., within the first 40 m) was significantly more important than vegetation cover further away. Even though these studies advocate that reducing vegetation cover close to the built-up areas can diminish the potential for the loss of structures, extensive conclusions continue to be difficult to assess because the studies were carried out at various scales of analysis using different measurements and were limited to the unique geographies of the study regions [78]. In addition, the relative contribution of defensible space compared to other variables is still unclear, although some studies suggest its relative importance changes according to housing pattern, structural characteristics, location, and scale [73,79,80]. For example, Syphard et al. [73] observed that housing patterns and arrangements were more important than defensible space for explaining structure loss in southern California. This result is coherent with other studies that have mostly observed that housing arrangement and topographic variables are more influential in explaining structure loss than vegetation amount and configuration [81,82] or other proxies for vegetation [83].
The disastrous fires of 2003 and 2005 that occurred in Portugal led the national government to approve the Decree-Law 124/2006 of 28 June. This created a program of “measures and actions to be developed within the National Wildfire Defence System” with the objective of protecting and defending both people and property and forest resources. However, after the 2017 fire events, the law was changed by Decree-Law 10/2018, of 14 February, which revoked the aforementioned decree law, classified as “inefficient at containing fires progression and safeguarding the safety of people and property”. Under Decree-Law 10/2018, it is mandatory for isolated buildings and urban villages to have a protection buffer area, where fuel reduction or removal must be implemented. The land use in this buffer area must be restricted to low-fuel activities such as agriculture and grazing, and for which native or less flammable species, such as broadleaf trees, were prescribed. Its width varies from up to 50 m for isolated buildings and 100 m for settlements.
Although it holds that fuel management should be carried out in all rural and forest areas throughout the country and that all these places should be monitored, the government has established priority areas for monitoring, which coincide with the parishes known to have the highest level of wildfire hazard, which number more than one thousand at the national level. Fuel management is mandatory in these parishes, and their number is updated every year. Despite the mandatory fuel management zones around strategic locations where total or partial removal of existing biomass must be carried out every year between September and May, the level of implementation in Portugal has not yet been confirmed. Furthermore, LULC data do not provide information on the level of fuel management implemented. The most detailed official Portuguese LULC data is not released on a yearly basis, which implies that the urban–rural interface hazard map is often out of date.
In addition to the above-mentioned measures, the legislative changes prompted by the 2017 wildfire episodes also established the “Safe Village” and the “Safe People” programs under Resolution no. 157-A/2017. These programs consist of “settlements and forest protection” and aim at establishing ‘structural measures for people, goods, and buildings in the WUI’, with the implementation and management of protection zones for settlements and strategic infrastructure identification, such as critical points and places of refuge”. They also intend to develop awareness-raising actions and self-protection measures for the public in the event of a wildfire. However, at the national level, there is a lack of studies on the effectiveness of these programs, the constraints of their implementation, and whether these programs are changing the behaviors and attitudes of homeowners with respect to wildfire risk reduction, preparedness, and coping capacity should a fire occur.
The same resolution also approved a “Program to Reduce the Number of Fires”. The purpose was to involve society and the system’s agents in education programs about the forest and the use of fire and thus to change social habits and behavior by specifically targeting the different groups responsible for these fires. In Portugal, as well as in the Mediterranean region, most fire ignitions are human-induced, which is why understanding the spatial influence of human activities on the distribution of fire ignitions is essential for managing and mitigating ignition risk. Thus, future studies should focus on the human activities and motivations (deliberate or negligent ignitions) related to fires, the places where they occur (within or beyond WUIs), the topographic features, and the type of LULC, since these factors are essential to mitigating ignition risk and adjusting fire management measures, at both landscape and WUI scales.

5. Conclusions

Understanding the spatial variations in wildfire hazards at the landscape/municipal and WUI levels can assist in the design of suitable prevention measures and improve the effectiveness of fire prevention; it can also provide support for environmental and civil protection policies such as the allocation of firefighting resources.
This study led to the following findings:
(i)
The evaluation of wildfire hazard at the landscape scale, based on Oliveira et al.’s [44] methodology, showed that high and very high classes are dominant in more than half of the study area.
(ii)
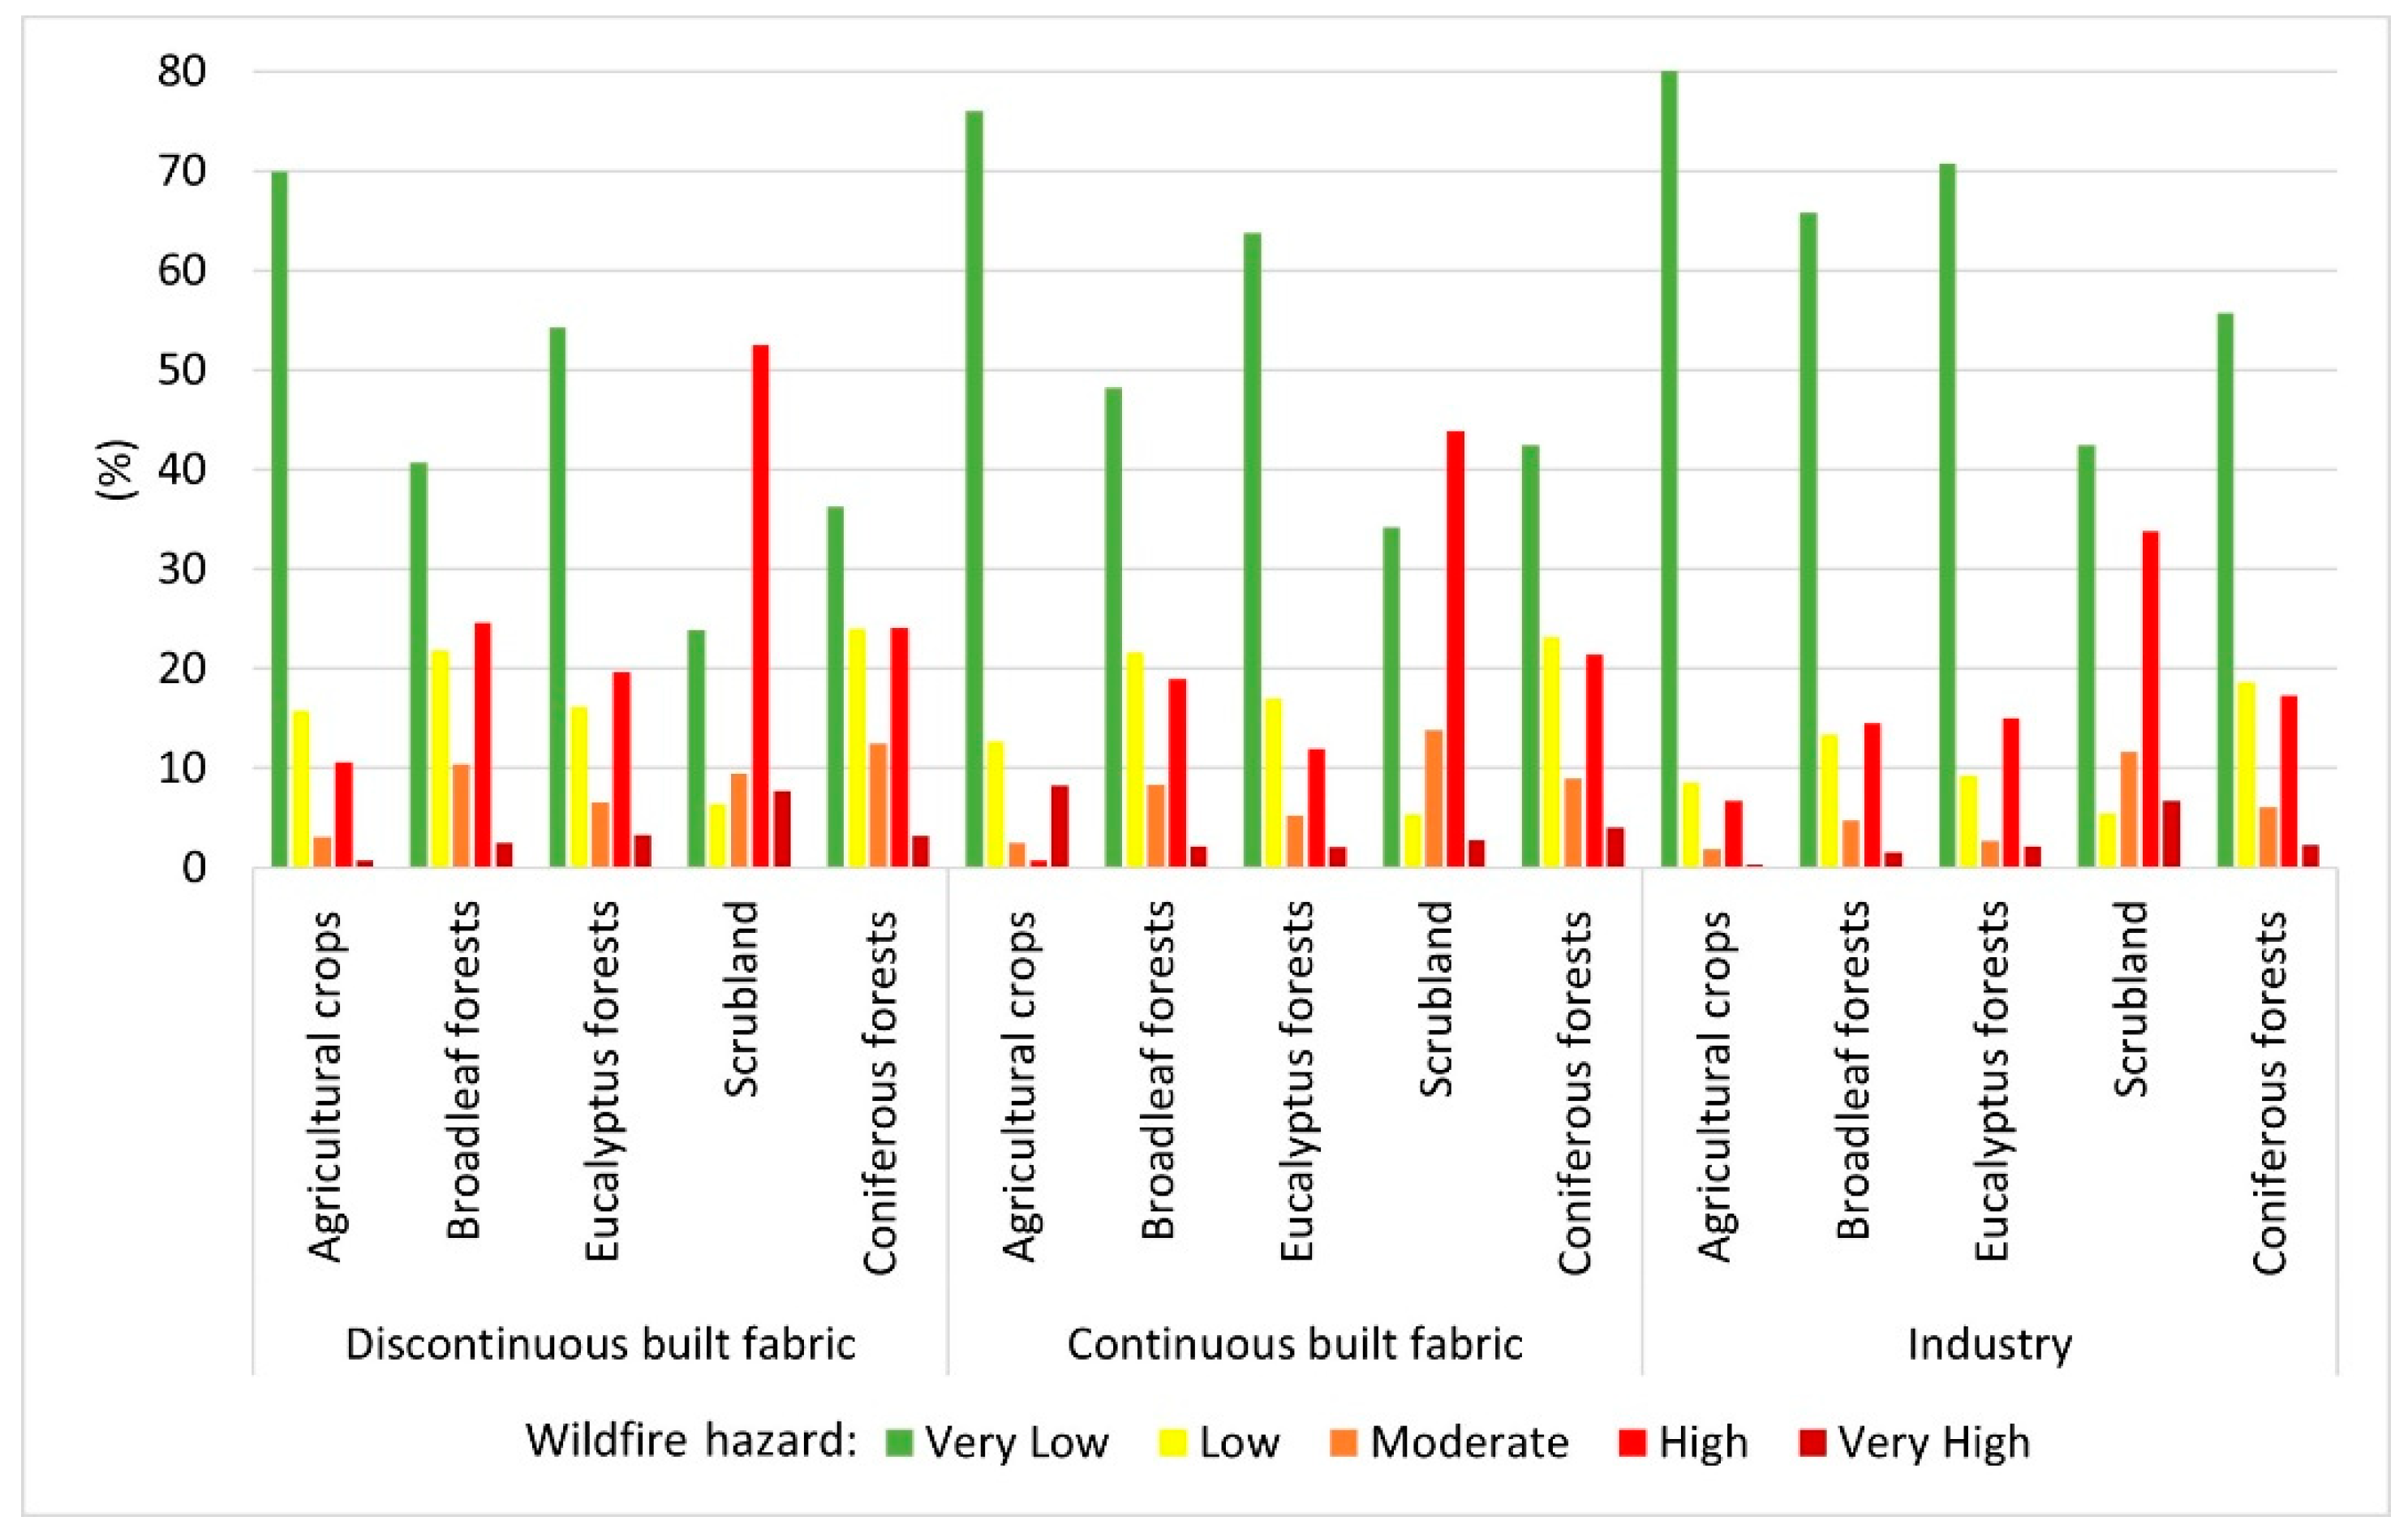
At the WUI scale, high and very high hazard classes predominate in 4.5% of the segments in direct contact with built-up areas; however, 9% of the WUIs classified as discontinuous urban built-up are in contact with high hazard classes.
(iii)
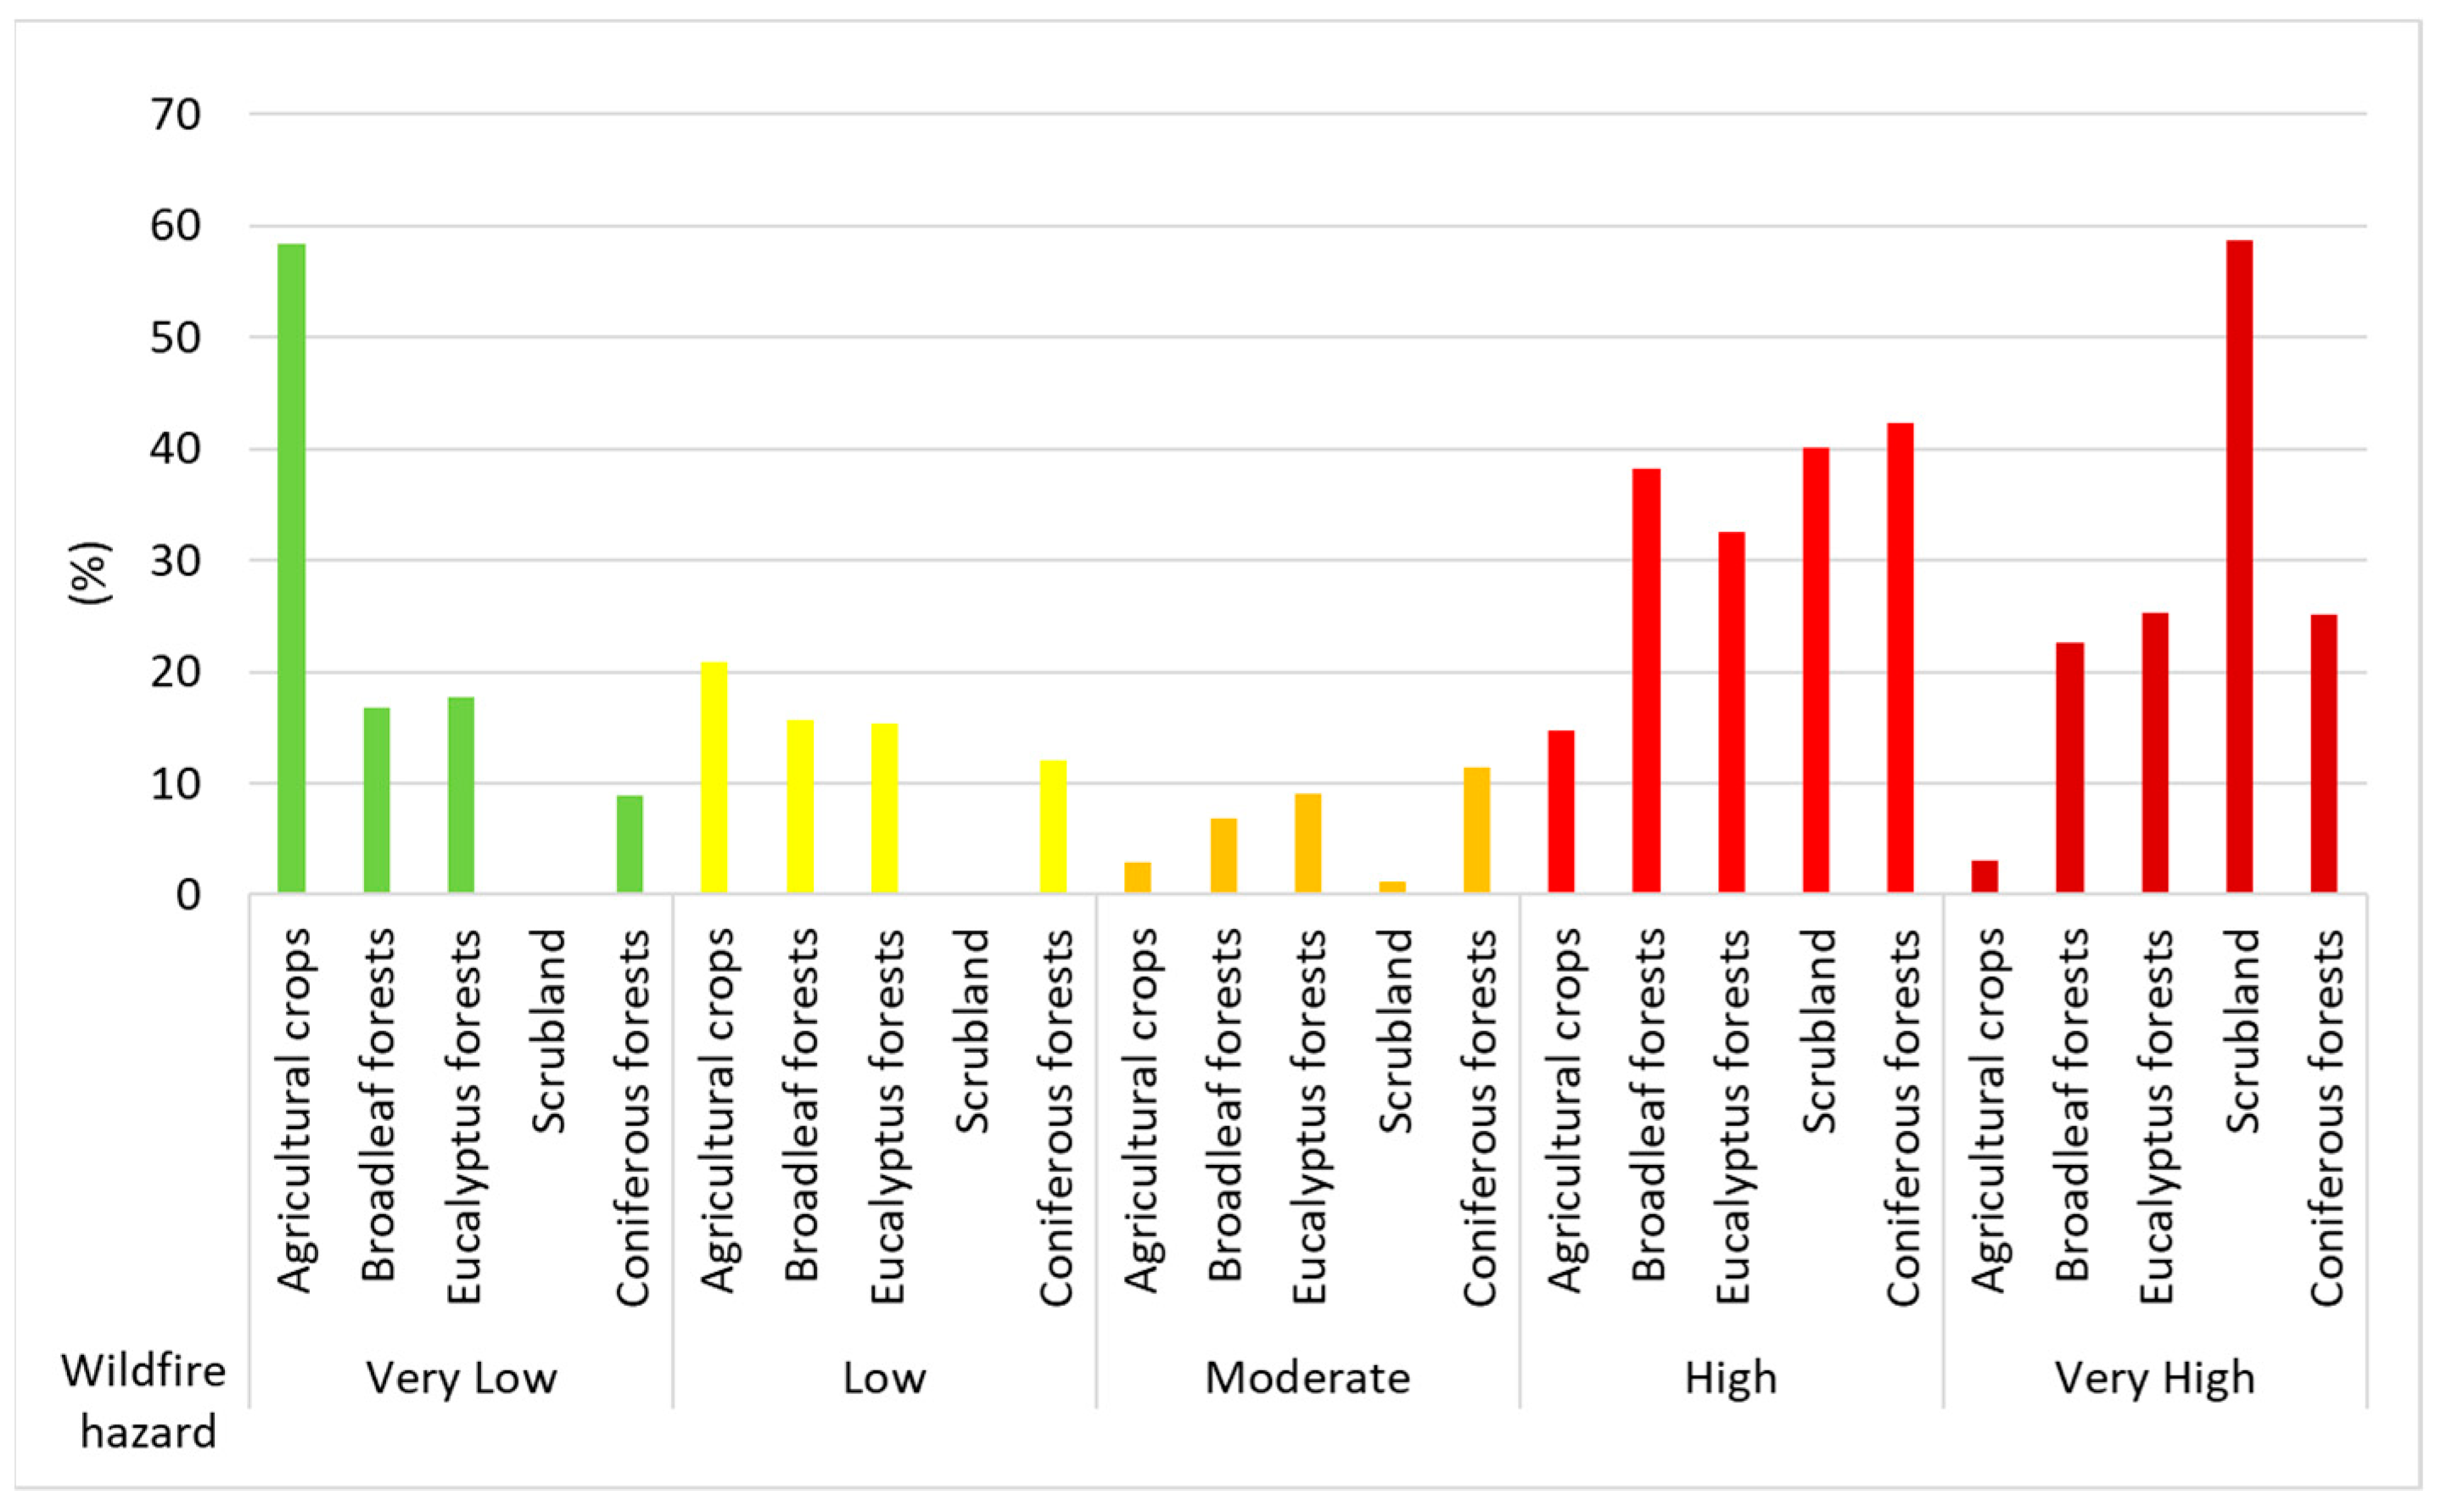
The municipalities with the highest wildfire hazard, at both landscape and WUI scales, are located in the inland and most mountainous areas of the Central Region, characterized by the predominance of shrubland and coniferous forests.
(iv)
The use of “the WUI” as a spatial risk analysis unit is an innovative approach in Portugal. It allows the identification of specific locations with higher levels of hazard to wildfire.
(v)
This approach could be critical in reducing wildfire risk, since understanding what influences such locations’ susceptibility to wildfires can provide enough detail and guide the design of spatially targeted strategies in the management, preparedness, and mitigation plans.
(vi)
LULC management seems to be the basic tool at our disposal to reduce the wildfire hazard at the landscape scale significantly and effectively, as well as the hazard in the WUI areas at the same time.
At the landscape scale, LULC management requires long-term commitment and investment, while at the WUI level, the responsibility for managing wildfire hazard falls on homeowners, who should actively create and maintain a home buffer area of reduced fire fuel with low flammability potential to burn. Creating wildfire-risk-reduction buffer zones at the perimeter of the home requires regular, ongoing maintenance to be effective.
However, wildfire risk at WUIs is not only a result of biophysical factors (topography and LULC), but it is also related to people and built environments, which present huge management challenges when it comes to fire mitigation and civil protection because of the exposed communities, houses, infrastructure, and ecosystems. Future studies should therefore pay attention to biophysical factors connected to vulnerability, which could include socioeconomic factors, type of construction, coping capacity, and other variables. Determining the location of the most vulnerable populations and the socioeconomic aspects that determine vulnerability is critical for reducing wildfire risks and for developing and enhancing policies to mitigate human impacts. In this context, more accurate analyses will be needed to better characterize WUIs, using accurate biophysical and socioeconomic and high-resolution data. The implementation of WUI fire mitigation measures in communities also requires effective communication from local authorities, tailored policies, education, and awareness of homeowners.
Moreover, the influence of the future climate in the Mediterranean region should not be forgotten, since climate change projections indicate longer dry, hot summers and more frequent and intense extreme weather events, leading to larger and more destructive fires. The expectation is that extreme weather conditions pose a higher wildfire risk, and the loss of human lives and property damage are likely to increase, highlighting the need for these changes to be quantified and integrated in risk analyses to support and anticipate for the adaptation of forest and fire management policies.

Author Contributions

Conceptualization, A.N.N., A.F., C.P. and L.L.; methodology, A.N.N., A.F., C.P. and L.L.; software, A.F. and C.P.; formal analysis, A.N.N., A.F. and L.L.; writing—original draft preparation, A.N.N., A.F. and L.L.; writing—review and editing, A.N.N., A.F. and L.L. visualization, A.F. and C.P. All authors have read and agreed to the published version of the manuscript.

Funding

This research was supported under the framework of the research project—INTERFACESEGURA—Segurança e Resiliência ao Fogo das Zonas e Interface Urbana-Florestal, under the reference PCIF/AGT/0062/2018, financed by Portuguese Foundation for Science and Technology (FCT) through National funds. This work also received support from The Centre of Studies in Geography and Spatial Planning (CEGOT), funded by national funds through the Foundation for Science and Technology (FCT) under the reference UIDP/GEO/04084/2020_UC.

Conflicts of Interest

The authors declare no conflict of interest.

References

  1. Bowman, D.M.J.S.; Balch, J.K.; Artaxo, P.; Bond, W.J.; Carlson, J.M.; Cohrane, M.A.; D’Antonio, C.M.; DeFries, R.S.; Doyle, J.C.; Harrison, S.P.; et al. Fire in the earth system. Science 2009, 324, 481–484. [Google Scholar] [CrossRef] [PubMed]
  2. Harrison, S.P.; Prentice, I.C.; Bloomfield, K.J.; Dong, N.; Forkel, M.; Forrest, M.; Ningthoujam, R.K.; Pellegrini, A.; Shen, Y.; Baudena, M.; et al. Understanding and modelling wildfire regimes: An ecological perspective. Environ. Res. Lett. 2021, 16, 125008. [Google Scholar] [CrossRef]
  3. Radeloff, V.C.; Hammer, R.B.; Stewart, S.I.; Fried, J.S.; Holcomb, S.S.; McKeefry, J.F. The Wildland-Urban Interface in the United States. Ecol. Appl. 2005, 15, 799–805. [Google Scholar] [CrossRef]
  4. Theobald, D.M.; Romme, W.H. Expansion of the US Wildland-Urban Interface. Landsc. Urban Plan. 2007, 83, 340–354. [Google Scholar] [CrossRef]
  5. Galiana-Martin, L.; Herrero, G.; Solana, J. A Wildland–Urban Interface Typology for Forest Fire Risk Management in Mediterranean Areas. Landsc. Res. 2011, 36, 151–171. [Google Scholar] [CrossRef]
  6. Radeloff, V.C.; Helmers, D.P.; Kramer, H.A.; Mockrin, M.H.; Alexandre, P.M.; Bar-Massada, A.; Butsic, V.; Hawbaker, T.J.; Martinuzzi, S.; Syphard, A.D.; et al. Rapid growth of the US wildland-urban interface raises wildfire risk. Proc. Natl. Acad. Sci. USA 2018, 115, 3314–3319. [Google Scholar] [CrossRef] [PubMed]
  7. Bento-Gonçalves, A.; Vieira, A. Wildfires in the wildland-urban interface: Key concepts and evaluation methodologies. Sci. Total Environ. 2020, 707, 135592. [Google Scholar] [CrossRef]
  8. Balch, J.; Bradley, B.; Abatzoglou, J.; Nagy, R.; Fusco, E.; Mahood, A. Human-started wildfires expand the fire niche across the United States. Proc. Natl. Acad. Sci. USA 2017, 114, 2–946. [Google Scholar] [CrossRef]
  9. Meira Castro, A.C.; Nunes, A.; Sousa, A.; Lourenço, L. Mapping the Causes of Forest Fires in Portugal by Clustering Analysis. Geosciences 2020, 10, 53. [Google Scholar] [CrossRef]
  10. Li, Z.; Angerer, J.P.; Wu, X.B. The impacts of wildfires of different burn severities on vegetation structure across the western United States rangelands. Sci. Total Environ. 2022, 845, 157214. [Google Scholar] [CrossRef]
  11. Fox, D.M.; Martin, N.; Carrega, P.; Andrieu, J.; Adnès, C.; Emsellem, K.; Ganga, O.; Moebius, F.; Tortorollo, N.; Fox, E.A. Increases in fire risk due to warmer summer temperatures and wildland urban interface changes do not necessarily lead to more fires. Appl. Geogr. 2015, 56, 1–12. [Google Scholar] [CrossRef]
  12. Gallardo, M.I.; Gómez, L.; Vilar, J.; Martínez-Veja, J.; Martín, M.P. Impacts of future land use/land cover on wildfire occurrence in the Madrid region (Spain). Reg. Environ. Chang. 2016, 16, 1047–1061. [Google Scholar] [CrossRef]
  13. Lampin-Maillet, C.; Jappiot, M.; Long, M.; Bouillon, C.; Morge, D.; Ferrier, J.P. Mapping wildland-urban interfaces at large scales integrating housing density and vegetation aggregation for fire prevention in the South of France. J. Environ. Manag. 2010, 91, 732–741. [Google Scholar] [CrossRef]
  14. Viedma, O.; Quesada, J.; Torres, I.; De Santis, A.; Moreno, J.M. Fire severity in a large fire in a Pinus pinaster forest is highly predictable from burning conditions, stand structure, and topography. Ecosystems 2015, 18, 237–250. [Google Scholar] [CrossRef]
  15. Pellizzaro, G.; Arca, B.; Pintus, G.V.; Ferrara, R.; Duce, P. Wildland-urban interface dynamics during the last 50 years in North East Sardinia. In Modelling Fire Behavior and Risk; Spano, D., Bacciu, V., Salis, M., Sirca, C., Eds.; Nuova Stampa Color Publisher: Turin, Italy, 2012; pp. 249–254. [Google Scholar]
  16. Independent Technical Commission (ITC). Análise e Apuramento dos Factos Relativos aos Incêndios que Ocorreram em Pedrogão Grande, Castanheira de Pera, Ansião, Alvaiázere, Figueiró dos Vinhos, Arganil, Góis, Penela, Pampilhosa da Serra, Oleiros e Sertã, entre 17 e 24 de Junho de 2017; Final Report; Assembly of the Portuguese Republic: Lisbon, Portugal, 2017; Available online: https://www.parlamento.pt/Documents/2017/Outubro/Relat%C3%B3rioCTI_VF%20.pdf (accessed on 21 September 2020).
  17. Independent Technical Commission (ICT). Avaliação dos Incêndios Ocorridos entre 14 e 16 de Outubro de 2017 em Portugal Continental, Relatório Final; Comissão Técnica Independente, Assembleia da República: Lisbon, Portugal, 2018; p. 274. Available online: https://www.parlamento.pt/Documents/2018/Marco/RelatorioCTI190318N.pdf (accessed on 21 September 2020).
  18. Chas-Amil, M.L.; García-Martínez, E.; Touza, J. Iberian Peninsula October 2017 wildfires: Burned area and population exposure in Galicia (NW of Spain). Int. J. Disaster Risk Reduct. 2020, 48, 101623. [Google Scholar] [CrossRef]
  19. Teague, B.; McLeod, R.; Pascoe, S. Victorian Bushfires Royal Commission; Final Report; Parliament of Victoria: Melbourne, Australia, 2009. [Google Scholar]
  20. Eavis, P.; Penn, I. California Says PG&E Power Lines Caused Camp Fire that Killed 85, New York Times (15 May 2019). 2018. Available online: https://www.nytimes.com/2019/05/15/business/pge-fire.html (accessed on 20 September 2020).
  21. Spearing, L.; Faust, A.; Kasey, M. Cascading system impacts of the 2018 Camp Fire in California: The interdependent provision of infrastructure services to displaced populations. Int. J. Disaster Risk Reduct. 2020, 50, 101822. [Google Scholar] [CrossRef]
  22. Mclennan, J.; Paton, D.; Wright, L. At-risk householders’ responses to potential and actual bushfire threat: An analysis of findings from seven Australian post-bushfire interview studies 2009–2014. Int. J. Disaster Risk Reduct. 2015, 12, 319–327. [Google Scholar] [CrossRef]
  23. Kwai, I. What to Read on Australia’s Bushfire Crisis. New York Times. 2020. Available online: https://www.nytimes.com/2020/01/10/world/australia/bushfire.html (accessed on 17 February 2020).
  24. Efthimiou, N.; Psomiadis, E.; Panagos, P. Fire severity and soil erosion susceptibility mapping using multi-temporal Earth Observation data: The case of Mati fatal wildfire in Eastern Attica, Greece. Catena 2020, 187, 104320. [Google Scholar] [CrossRef]
  25. Álvarez-Miranda, E.; Garcia-Gonzalo, J.; Ulloa-Fierro, F.; Weintraub, A.; Barreiro, S. A multicriteria optimization model for sustainable forest management under climate change uncertainty: An application in Portugal. Eur. J. Oper. Res. 2018, 269, 79–98. [Google Scholar] [CrossRef]
  26. Pereira, S.N.; Preißler, J.; Guerrero-Rascado, J.L.; Silva, A.M.; Wagner, F. Forest fire smoke layers observed in the free troposphere over Portugal with a multiwavelength Raman lidar: Optical and microphysical properties. Sci. World J. 2014, 2014, 421838. [Google Scholar] [CrossRef]
  27. Paniagua, A. Rurality, identity and morality in remote rural areas in northern Spain. J. Rural Stud. 2014, 35, 49–58. [Google Scholar] [CrossRef]
  28. Oliveira, F.P. A necessidade de uma concordância prática entre as normas da classificação dos solos para efeitos de ordenamento do território e da classificação dos solos para efeitos da defesa da floresta contra incêndios: Uma breve reflexão. In Estudos Comemorativos dos XX anos da Faculdade de Direito da Universidade do Porto; Universidade do Porto: Almedina, Portugal, 2018; Volume 1, ISBN 978-972-40-7318-7. [Google Scholar]
  29. Oliveira FP 2018. Algumas notas sobre as alterações ao Decreto-Lei n.º 124/2006, de 28 de junho, operadas pela Lei n.º 76/2017, de 17 de agosto, que define o Sistema de Defesa da Floresta Contra Incêndios. Rev. Eletrónica Direito Público e-Pública 2018, 4, 25–40. [Google Scholar]
  30. Mann, M.L.; Berck, P.; Moritz, P.M.; Batllori, E.; Baldwin, J.G.; Gately, C.K.; Cameron, D.R. Modelling residential development in California from 2000 to 2050: Integrating wildfire risk, wildland and agricultural encroachment. Land Use Policy 2014, 41, 438–452. [Google Scholar] [CrossRef]
  31. San-Miguel-Ayanz, J.; Moreno, J.M.; Camia, A. Analysis of large fires in Europe Medirterranean landscapes: Lessons learned and perspectives. For. Ecol. Manag. 2013, 294, 11–22. [Google Scholar] [CrossRef]
  32. Tedim, F.; Xanthopoulos, G.; Leone, V. Forest Fires in Europe: Facts and Challenges. In Widlfire Hazards, Risks and Disasters; Elsevier: Amsterdam, The Netherlands, 2015; pp. 77–99. [Google Scholar] [CrossRef]
  33. Caballero, D.; Beltran, I. Concepts and ideas of assessing settlement fire vulnerability in the W-UI zone. In Proceedings of the International Workshop Forest Fires in the Wildland-Urban Interface and Rural Areas in Europe, Athens, Greece, 15 May 2003; Available online: www.davidcaballero.com (accessed on 20 September 2022).
  34. Caballero, D. Conclusions of the Third WARM Workshop on Forest Fires in the Wildland-Urban Interface in Europe. Madrid, Spain, 26–27th of May. WARM Project, Final Report. European Commission. 2004. Available online: www.davidcaballero.com (accessed on 20 September 2022).
  35. Lampin-Maillet, C.; Jappiot, M.; Long, M.; Morge, D.; Ferrier, J.P. Characterization and mapping of dwelling types for forest fire prevention. Computers. Environ. Urban Syst. 2009, 33, 224–232. [Google Scholar] [CrossRef]
  36. Bar-Massada, A.; Radeloff, V.C.; Stewart, S.I. Biotic and Abiotic Effects of Human Settlements in the Wildland–Urban Interface. BioScience 2013, 64, 429–437. [Google Scholar] [CrossRef]
  37. Scott, J.H.; Thompson, M.P.; Calkin, D.E. A Wildfire Risk Assessment Framework for Land and Resource Management; General Technical Reports RMRS-GTR-315; USDA Forest Service, Rocky Mountain Research Station: Fort Collins, CO, USA, 2013. [Google Scholar]
  38. Thompson, M.P.; Calkin, D.E.; Finney, M.A.; Gebert, K.M.; Hand, M.S. A risk-based approach to wildland fire budgetary planning. For. Sci. 2013, 59, 63–77. [Google Scholar] [CrossRef]
  39. Darques, R. Mediterranean cities under fire. A Critical Approach Wildland-Urban Interface. Appl. Geogr. 2015, 59, 10–21. [Google Scholar] [CrossRef]
  40. Modugno, S.; Balzter, H.; Cole, B.; Borrelli, P. Mapping regional patterns of large forest fires in Wildland–Urban Interface areas in Europe. J. Environ. Manag. 2016, 172, 112–126. [Google Scholar] [CrossRef]
  41. Pereira, J.M.C.; Alexandre, P.; Campagnolo, M.; Bar-Massada, A.; Radeloff, V.; Silva, P. Defining and mapping the wildland-urban interface in Portugal. In Proceedings of the 8th International Conference on Forest Fire Research, Coimbra, Portugal, 9–16 November 2018; pp. 743–749. [Google Scholar]
  42. Nunes, A. Região Centro de Portugal: Duas décadas de incêndios florestais”. Territorium 2002, 9, 135–148. [Google Scholar] [CrossRef]
  43. Naderpour, N.; Rizeei, H.M.; Khakzad, N.; Pradhan, B. Forest fire induced Natech risk assessment: Survey of geospatial technologies. Reliab. Eng. Syst. Saf. 2019, 191, 106558. [Google Scholar] [CrossRef]
  44. Oliveira, S.; Gonçalves, A.; Zêzere, J.L. Reassessing wildfire susceptibility and hazard for mainland Portugal. Sci. Total Environ. 2020, 762, 143121. [Google Scholar] [CrossRef] [PubMed]
  45. Pradhan, B.M.; Suliman, B.A.M. Forest fire susceptibility and risk mapping using remote sensing and geographical information systems (GIS). Disaster Prev. Manag. 2007, 16, 344–352. [Google Scholar] [CrossRef]
  46. Rohde DCorcoran, J.; Chhetri, P. Spatial forecasting of residential urban fires: A Bayesian approach. Comput. Environ. Urban Syst. 2012, 34, 58–69. [Google Scholar] [CrossRef]
  47. Sevinc, V.; Kucuk, O.; Goltas, M.A. Bayesian network model for prediction and analysis of possible forest fire causes. For. Ecol. Manag. 2020, 457, 117723. [Google Scholar] [CrossRef]
  48. Nunes, A.N.; Lourenço, L.; Meira Castro, A.C. Exploring spatial patterns and drivers of forest fires in Portugal (1980–2014). Sci. Total Environ. 2016, 573, 1190–1202. [Google Scholar] [CrossRef]
  49. Rego, F.C. Land use changes and wildfires. In Responses of Forest Ecosystems to Environmental Changes; Teller, A., Mathy, P., Jeffers, J.N.R., Eds.; Springer: Dordrecht, The Netherlands, 1992. [Google Scholar] [CrossRef]
  50. Moreira, F.; Viedma, O.; Arianoutsou, M.; Curt, T.; Koutsias, N.; Rigolot, E.; Barbati, A.; Corona, P.; Vaz, P.; Xanthopoulos, G.; et al. Landscape--wildfire interactions in southern Europe: Implications for landscape management. J. Environ. Manag. 2011, 92, 2389–2402. [Google Scholar] [CrossRef]
  51. Nunes, A.N. Regional variability and driving forces behind forest fires in Portugal, an overview of the last three decades (1980–2009). Appl. Geogr. 2012, 34, 576–586. [Google Scholar] [CrossRef]
  52. Hammer, R.B.; Radeloff, V.C.; Fried, J.S.; Stewart, S.I. Wildland urban interface housing growth during the 1990s in California, Oregon, and Washington. Int. J. Wildl. Fire 2007, 16, 255–265. [Google Scholar] [CrossRef]
  53. Zhang, A.; Hong, S.H.; Yang, J. The wildland–urban interface dynamics in the southeastern U.S. from 1990 to 2000. Landsc. Urban Plan. 2008, 85, 155–162. [Google Scholar] [CrossRef]
  54. Montiel, C.; Herrero, G. Overview of policies and practices related to fire ignitions. In Towards Integrated Fire Management-Outcomes of the European Project Fire Paradox; European Forest Institute: Joensuu, Finland, 2010; pp. 35–46. [Google Scholar]
  55. Tonini, M.; Parente, J.; Pereira, M.G. Global assessment of rural–urban interface in Portugal related to land cover changes. Nat. Hazards Earth Syst. Sci. 2018, 18, 1647–1664. [Google Scholar] [CrossRef]
  56. Chas-Amil, M.L.; Touza, J.; García-Martínez, E. Forest fires in the wildland–urban interface: A spatial analysis of forest fragmentation and human impacts. Appl. Geogr. 2013, 43, 127–137. [Google Scholar] [CrossRef]
  57. Cardille, J.A.; Ventura, S.J.; Turner, M.G. Environmental and social factors influencing wildfires in the upper Midwest, United States. Ecol. Appl. 2001, 11, 111–127. [Google Scholar] [CrossRef]
  58. Syphard, A.D.; Radeloff, V.C.; Keeley, J.E.; Hawbaker, T.J.; Clayton, M.K.; Stewart, S.I.; Hammer, R.B. Human influence on California fire regimes. Ecol. Appl. 2007, 17, 1388–1402. [Google Scholar] [CrossRef]
  59. Oliveira, S.; Zêzere, J.L. Assessing the biophysical social drivers of burned area distribution at the local scale. J. Environ. Manag. 2020, 264, 110449. [Google Scholar] [CrossRef] [PubMed]
  60. Sil, A.; Fernandes, P.M.; Rodrigues, A.P.; Alonso, J.M.; Honrado, J.H.; Pereira, A.; Azevedo, J.C. Farmland abandonment decreases the fire regulation capacity and the fire protection ecosystem service in mountain landscapes. Ecosyst. Serv. 2019, 36, 100908. [Google Scholar] [CrossRef]
  61. Barros, A.M.; Pereira, J.M. Wildfire selectivity for land cover type: Does size matter? PLoS ONE 2014, 13, e84760. [Google Scholar] [CrossRef]
  62. Carmo, M.; Moreira, F.; Casimiro, P.; Vaz, P. Land use and topography influences on wildfire occurrence in northern Portugal. Landsc. Urban Plan. 2011, 100, 169–176. [Google Scholar] [CrossRef]
  63. Lampin-Maillet, C.; Long-Fournel, M.; Ganteaume, A.; Jappiot, M.; Ferrier, J.P. Land cover analysis in wildland-urban interfaces according to wildfire risk: A case study in the South of France. For. Ecol. Manag. 2011, 261, 2200–2213. [Google Scholar] [CrossRef]
  64. Oliveira, S.; Pereira, J.M.C.; San-Miguel-Ayanz, J.; Lourenço, L. Exploring the spatial patterns of fire density in Southern Europe using Geographically Weighted Regression. Appl. Geogr. 2014, 51, 143–157. [Google Scholar] [CrossRef]
  65. Rego, F.C.; Silva, J.S. Wildfires and landscape dynamics in Portugal: A regional assessment and global implications. In Forest Landscapes and Global Change; Azevedo, J., Perera, A., Pinto, M., Eds.; Springer: New York, NY, USA, 2014. [Google Scholar] [CrossRef]
  66. Calviño-Cancela, M.; Chas-Amil, M.L.; García-Martínez, E.D.; Touza, D. Wildfire risk associated with different vegetation types within and outside wildland-urban interfaces. For. Ecol. Manag. 2016, 372, 1–9. [Google Scholar] [CrossRef]
  67. Shakesby, R.A.; Boakes, D.J.; Coelho, C.O.A.; Gonçalves, A.J.B.; Walsh, R.P.D. Limiting the soil degradational impacts of wildfire in pine and eucalyptus forests in Portugal: A comparison of alternative postfire management practices. Appl. Geogr. 1996, 16, 337–355. [Google Scholar] [CrossRef]
  68. Stephens, S.L.; Moghaddas, J.J. Experimental fuel treatment impacts on forest structure, potential fire behavior, and predicted tree mortality in a California mixed conifer forest. For. Ecol. Manag. 2005, 215, 21–36. [Google Scholar] [CrossRef]
  69. Schmidt, D.; Taylor, A.; Skinner, C. The influence of fuels treatment and landscape arrangement on simulated fire behavior, Southern Cascade range, California. For. Ecol. Manag. 2008, 255, 3170–3184. [Google Scholar] [CrossRef]
  70. Safford, H.D.; Schmidt, D.A.; Carlson, C.H. Effects of fuel treatments on fire severity in an area of wildland–urban interface, Angora Fire, Lake Tahoe Basin, California. For. Ecol. Manag. 2009, 258, 773–787. [Google Scholar] [CrossRef]
  71. Kennedy, M.C.; Johnson, M.C. Fuel treatment prescriptions alter spatial patterns of fire severity around the wildland–urban interface during the Wallow Fire, Arizona, USA. For. Ecol. Manag. 2014, 318, 122–132. [Google Scholar] [CrossRef]
  72. Gibbons, P.; van Bommel, L.; Gill, A.; Cary, G.J.; Driscoll, D.A.; Bradstock, R.A.; Knight, E.; Moritz, M.A.; Stephens, S.L.; Lindenmayer, D.B. Land management practices associated with house loss in wildfires. PLoS ONE 2012, 7, e29212. [Google Scholar] [CrossRef] [PubMed]
  73. Syphard, A.D.; Brennan, T.J.; Keeley, J.E. The role of defensible space for residential structure protection during wildfires. Int. J. Wildl. Fire 2014, 23, 1165–1175. [Google Scholar] [CrossRef]
  74. Miner, A. Defensible Space Optimization for Preventing Wildfire Structure Loss in the Santa Monica Mountains; Johns Hopkins University: Baltimore, MD, USA, 2014. [Google Scholar]
  75. Platt, R.V. Wildfire hazard in the home ignition zone: An object-oriented analysis integrating LiDAR and VHR satellite imagery. Appl. Geogr. 2014, 51, 108–117. [Google Scholar] [CrossRef]
  76. Penman, S.H.; Price, O.F.; Penman, T.D.; Bradstock, R.A. The role of defensible space on the likelihood of house impact from wildfires in forested landscapes of south eastern Australia. Int. J. Wildl. Fire 2018, 28, 4–14. [Google Scholar] [CrossRef]
  77. Gibbons, P.; Gill, A.M.; Shore, N.; Moritz, M.A.; Dovers, S.; Cary, G.J. Options for reducing house-losses during wildfires without clearing trees and shrubs. Landsc. Urban Plan. 2018, 174, 10–17. [Google Scholar] [CrossRef]
  78. Syphard, A.D.; Rustigian-Romsos, H.; Keeley, J.E. Multiple-Scale Relationships between Vegetation, the Wildland–Urban Interface, and Structure Loss to Wildfire in California. Fire 2021, 4, 12. [Google Scholar] [CrossRef]
  79. Syphard, A.D.; Keeley, J.E. Factors associated with structure loss in the 2013–2018 California wildfires. Fire 2019, 2, 49. [Google Scholar] [CrossRef]
  80. Braziunas, K.H.; Seidl, R.; Rammer, W.; Turner, M.G. Can we manage a future with more fire? Effectiveness of defensible space treatment depends on housing amount and configuration. Landsc. Ecol. 2021, 36, 309–330. [Google Scholar] [CrossRef]
  81. Alexandre, P.M.; Stewart, S.I.; Mockrin, M.H.; Keuler, N.S.; Syphard, A.D.; Bar-Massada, A.; Clayton, M.; Radeloff, V.C. The relative impacts of vegetation, topography and spatial arrangement on building loss to wildfires in case studies of California and Colorado. Landsc. Ecol. 2016, 31, 415–430. [Google Scholar] [CrossRef]
  82. Alexandre, P.M.; Stewart, S.I.; Keuler, N.S.; Clayton, M.K.; Mockrin, M.H.; Bar-Massada, A.; Syphard, A.D.; Radeloff, V.C. Factors related to building loss due to wildfires in the conterminous United States. Ecol. Appl. 2016, 26, 2323–2338. [Google Scholar] [CrossRef] [PubMed]
  83. Syphard, A.D.; Rustigian-Romsos, H.; Mann, M.; Conlisk, E.; Moritz MAckerly, D. The relative influence of climate and housing development on current and projected future fire patterns and structure loss across three California landscapes. Glob. Environ. Chang. 2019, 56, 41–55. [Google Scholar] [CrossRef]
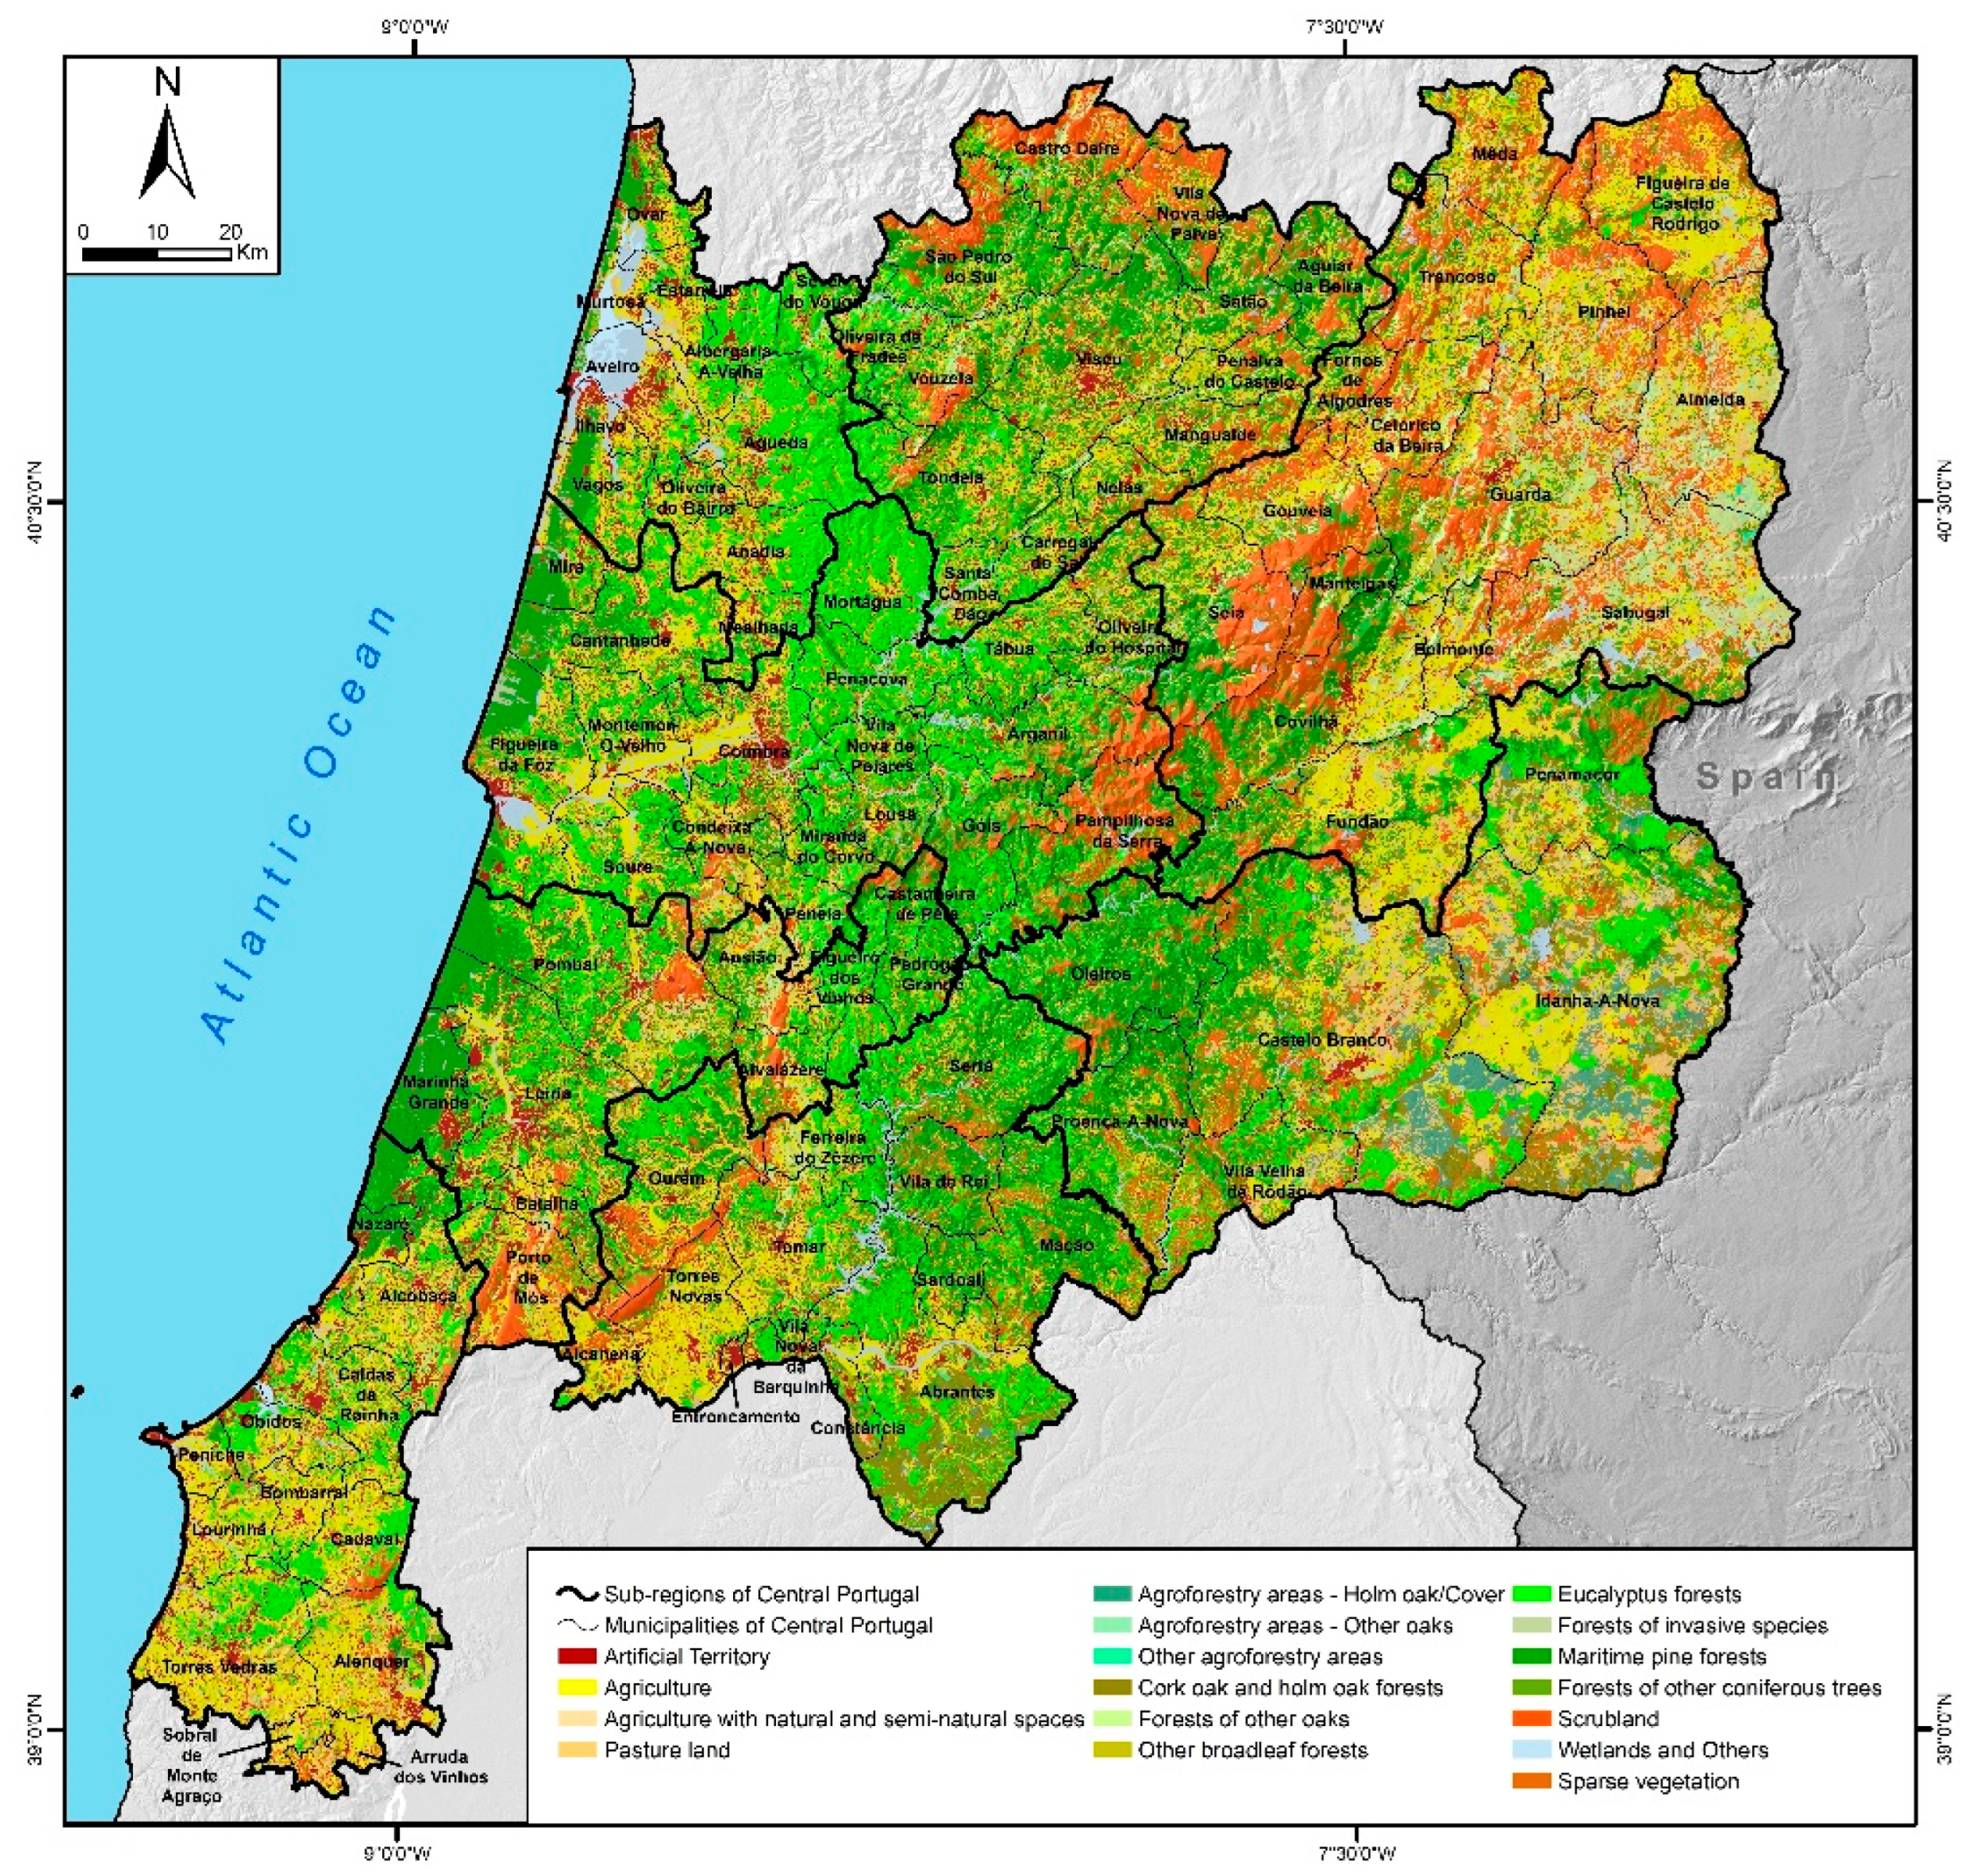
Figure 1. Location and hypsometric map of the Central Region.
Forests 14 01106 g001
Figure 2. Slopes in the Central Region.
Forests 14 01106 g002
Figure 3. Land Use and Cover 2018.
Forests 14 01106 g003
Figure 4. Recurrence of areas burned between 1975 and 2020 (Source: Portuguese Institute for Conservation of Nature and Forests, ICNF).
Forests 14 01106 g004
Figure 5. Hazard model success curve and definition of its classes.
Forests 14 01106 g005
Figure 6. Validation of the hazard model by calculating AUC.
Forests 14 01106 g006
Figure 7. Wildland urban interfaces in Central Portugal.
Forests 14 01106 g007
Figure 8. Wildfire susceptibility map.
Forests 14 01106 g008
Figure 9. Wildfire probability Map.
Forests 14 01106 g009
Figure 10. Wildfire hazard in Central Portugal.
Forests 14 01106 g010
Figure 11. Predominant wildfire hazard class by municipality.
Forests 14 01106 g011
Figure 12. Wildfire hazard in contact with the WUI.
Forests 14 01106 g012
Figure 13. Percentage of very high wildfire hazard in contact with WUI by municipality.
Forests 14 01106 g013
Figure 14. Percentage of high wildfire hazard in contact with WUI by municipality.
Forests 14 01106 g014
Figure 15. LULC classes in contact with the WUI depending on the wildfire hazard.
Forests 14 01106 g015
Figure 16. Wildfire hazard and LULC classes in the different kinds of WUIs.
Forests 14 01106 g016
Table 1. Changes in Land Use and Cover between 1995 and 2018.
Classes199520072010201520181995/2018
km2%km2%km2%km2%km2%Change (%)
Artificial Territory11614.11475.45.21522.25.31546.35.41578.55.536%
Agriculture5252.318.5637322.4636122.36104.821.4614121.617%
Agriculture with natural and semi-natural spaces705.62.5431.91.5443.21.6472.81.7501.11.8−29%
Pasture land2963.110.41354.84.813164.61460.65.11184.74.2−60%
Agroforestry areas—Holm oak/Cover3641.3359.81.3359.71.3355.31.2358.51.3−2%
Other agroforestry areas16.20.119.60.119.60.118.40.119.10.193%
Agroforestry areas—other oaks39.90.149.30.249.20.246.70.248.60.222%
Cork oak and holm oak forests712.12.5805.82.8803.92.8819.82.9842.73.035%
Forests of other oaks834.22.9921.23.2919.63.2929.23.3945.53.313%
Other broadleaf forests750.72.6837.12.9830.82.9836.22.9863.93.015%
Eucalyptus forests3251.611.44275.615.04390.815.44635.216.34906.617.251%
Forests of invasive species0.50.01130.4112.50.4111.30.41150.421769%
Maritime pine forests8116.628.56911.924.36795.623.96545.423.06364.222.4−22%
Forests of other coniferous trees128.50.5225.30.8226.20.8222.40.8234.70.8165%
Scrubland359612.63714.813.13713.313.03763.213.23774.913.35%
Sparse vegetation187.30.7190.80.7189.70.7236.60.8182.60.6−2%
Wetlands and others382.51.3402.61.4408.51.4357.71.3400.41.45%
Table 2. Types of Wildland–Urban Interface.
Type of InfrastructureWUI TypeCode and Name in Land Use Land Cover Map 2018
CBA (Continuous built-up area)1.1.1.1 Continuous built-up area, predominantly vertical
1.1.1.2 Continuous built-up area, predominantly horizontal
DBA (Discontinuous Built-up area)1.1.2.1 Discontinuous built-up area
1.1.2.2 Sparse discontinuous built-up area
1.1.3.1 Parking areas and sites
1.1.3.2 Empty spaces without construction
1.2.3.1 Agricultural facilities
1.5.3.1 Areas under construction
1.5.2.2 Rubbish and scrap
1.6.2.1 Campsites
1.6.4.1 Cemeteries
1.6.5.1 Other tourist facilities and equipment
1.7.1.1 Parks and gardens
Industry1.2.1.1 Industry
1.2.2.1 Trade
1.3.1.2 Non-renewable energy production infrastructure
1.3.2.2 Waste and wastewater treatment infrastructure
1.6.1.2 Sports facilities
1.6.2.2 Leisure facilities
Road Network1.4.1.1 Road network and associated spaces
Table 3. Hazard class properties.
Hazard ClassesHazard ScoresSuccess Curve TrendClass Area (%)Burnt Area (%)
Very High0.101–1.597y = 2.3106x + 8 × 10−621.550
High0.032–0.101y = 1.8899x + 0.105228.548.5
Moderate0.027–0.032y = 0.1584x + 0.90166.31.1
Low0.021–0.027y = 0.0215x + 0.979811.50.4
Very low0.009–0.021y = 0.0063x + 0.99432.20
Table 4. Likelihood ratio scores (LRi) for altitude.
Altitude (m)LRi (1975–2019)
0–1000.365
100–2000.69
200–3001.02
300–4001.06
400–5001.127
500–6001.375
600–7001.417
700–8001.486
800–10001.572
1000–15001.847
1500–20000.895
Table 5. Likelihood Ratio scores (LRi) for slope.
Slopes (°)LRi (1975–2019)
0–50.454
05–100.716
10–150.92
15–201.095
>201.211
Table 6. Likelihood Ratio scores (LRi) for the Land Use and Land Cover maps.
Classes19952007201020152018Weighted Average LRi
Artificial 0.0660.0790.0830.2810.0870.103
Agriculture0.4761.1850.7430.7150.7590.692
Agriculture with natural and
semi-natural spaces
0.2310.3320.2560.3700.2400.270
Pasture land0.4121.2080.6570.3640.5630.584
Agroforestry areas—Holm oak/cover2.4946.1102.4171.2790.7622.646
Other agroforestry areas0.2380.0150.1320.0810.0110.142
Agroforestry areas—other oaks0.1520.4050.2120.1780.0000.190
Cork oak and holm oak forests0.6582.6550.4280.3120.4130.809
Forests of other oaks0.8530.6480.5310.2070.0370.590
Other broadleaf forests1.4993.4711.8450.9110.7211.696
Eucalyptus forests0.5930.5970.9261.3670.3550.753
Forests of invasive species0.7710.3940.9141.3941.2170.878
Maritime pine forests0.0000.3970.8872.2970.2430.591
Forests of other coniferous trees1.0900.5330.9751.5261.5481.089
Scrubland0.3000.5000.5300.5880.2280.412
Sparse vegetation2.0353.2402.7341.3441.4722.213
Wetlands and others0.3260.8630.2110.2400.2110.351
Disclaimer/Publisher’s Note: The statements, opinions and data contained in all publications are solely those of the individual author(s) and contributor(s) and not of MDPI and/or the editor(s). MDPI and/or the editor(s) disclaim responsibility for any injury to people or property resulting from any ideas, methods, instructions or products referred to in the content.

