Article

Examining and Reforming the Rothermel Surface Fire Spread Model under No-Wind and Zero-Slope Conditions for the Karst Ecosystems

1
School of Biological, Guizhou Education University, Gaoxin St. 115, Guiyang 550018, China
2
Key Laboratory of Ecology and Management on Forest Fire in Universities of Guizhou Province, Guizhou Education University, Gaoxin St. 115, Guiyang 550018, China
*
Author to whom correspondence should be addressed.
Forests 2023, 14(6), 1088; https://doi.org/10.3390/f14061088
Submission received: 29 March 2023 / Revised: 17 May 2023 / Accepted: 21 May 2023 / Published: 24 May 2023
(This article belongs to the Special Issue Fire Ecology and Management in Forest)

Abstract

:
The Rothermel model, which has been widely used to predict the rate of forest fire spread, has errors that restrict its ability to reflect the actual rate of spread (ROS). In this study, the fuels from seven typical tree species in the Karst ecosystems in southern China were considered as the research objects. Through indoor burning simulation, three methods, namely directly using the Rothermel model, re-estimating the parameters of the Rothermel, and reforming the model, were evaluated for applicability in Karst ecosystems. We found that the direct use of the Rothermel model for predicting the ROS in the Karst ecosystems is not practical, and the relative error can be as high as 50%. However, no significant differences between the prediction effect of re-estimating the parameters of the Rothermel and the reformed model were found, but the reform model showed more evident advantages of being simpler, and the errors were lower. Our research proposes a new method that is more suitable for predicting the rate of forest fire spread of typical fuels in Karst ecosystems under flat and windless conditions, which is of great significance for further understanding and calculating the ROS of forest fires in the region.

1. Introduction

Rothermel’s model uses the principle of energy conservation to derive a formula for the rate of spread (ROS) [1]. The parameters of the model were obtained experimentally, which has the applicability of the physical model and the simplicity of the empirical model [2,3]. Rothermel’s fire spread model is the foundation for many applications supporting forest fire management worldwide, such as BehavePlus [4], FARSITE [5], FlamMap [6], NEXUS [7], and Fuel Management Analyst [8].
The Rothermel’s fire spread model under the condition of no-wind on the flat ground ( R O S 0 ) gives a measure of the combustibility of fuels, which serves as the basic value for calculating the ROS under wind and slope conditions [9]. It is important to obtain an accurate R O S 0 . The input parameters for the R O S 0 are only related to fuels and can be divided into two categories: fuel type, and physical and chemical properties of the fuel. For the specified fuel type, R O S 0 remains unaffected by topography and weather [1,10,11]. In practical application, the fuels in the model were assumed to be homogeneous for a small space and a short time [12], and the physical and chemical properties for a specific fuel that needs to be inputted into the model include fuel bed height, moisture content (MC), loading, heat value, surface area to volume (SAV) ratio, packing ratio, etc.
However, R O S 0 has errors in practical applications, mainly because of the uncertainty of the input parameters [9,13,14] Some fuel parameters in R O S 0 have been determined by defining a standard fuel model but owing to the different types of fuel and their different physical and chemical properties, these are not completely applicable [15]. Furthermore, because the R O S 0 model was derived under ideal conditions, there are inevitable differences between the predicted and measured values. These uncertainties result in uncertain outputs from the model, which may cause considerable economic losses and efficiency constraints in practice. This may lead to incorrect decisions regarding forest firefighting commands [12,16].
The causes for the uncertainty of the Rothermel model parameters include the following: (1) different physical and chemical properties of different fuel types, (2) proportions of various fuels in a heterogeneous fuel bed are unknown, and (3) parameters value (extinction MC, optimum packing ratio, etc.) in the model are unreasonable. To solve these problems, Ascoli et al. coupled the original Rothermel model with mathematical optimization (genetic algorithms) of the fuel model, resulting in better fitting and further reduced prediction errors. The root mean square errors of leave, grass, and shrub fuels decreased by 39%, 19%, and 26%, respectively, making them more effective [17]; however, this method was more obscure and difficult to apply. Sandberg et al. proposed to directly use the mean or medium value of the fuel bed measured in the field as the parameter value in the Rothermel model but did not verify this [18]. A simpler and stricter method is to correct the base of the Rothermel model [19], where the relationship between the characteristics of fuels and R O S 0 is obtained by a simulated burning experiment, and the prediction model is repeatedly reformed and corrected. Therefore, this study also used this method to reform the Rothermel model and improve the prediction accuracy of R O S 0 through indoor simulation of burning experiments.
The Karst forest ecosystems in southern China have a unique ecosystem in the world, which is apparently due to their characteristics that are different from those of other forest ecosystems. they have high heterogeneity of habitats, shallow and discontinuous soil layers, multiple levels of ecological space, and extreme fragility [20,21,22,23]. Moreover, the region is crisscrossed by agriculture and forestry, with large human disturbances and complex fire sources, which makes it extremely prone to forest fires that may cause serious impacts on the regional ecosystem, property security, and social stability [24]. However, little research has been conducted on the behavior of fuels in Karst zones. Although the Rothermel model has been successfully applied in related regions worldwide (developed in North America), it may not be directly applied in southern China due to the uniqueness of the Karst forest ecosystems there, which seriously hinders ecological restoration and forest fire prevention. Therefore, this study selected seven typical fuels of tree species in the Karst ecosystems as objects for indoor burning to solve the following scientific problems: (1) Is it reasonable to directly use the Rothermel model to predict R O S 0  in the Karst ecosystems? (2) Based on the original form of the Rothermel (in a physical sense), the fuel parameters for the Karst ecosystems were re-estimated, and the accuracy of the model was tested; and (3) reformed a new prediction model for R O S 0 in the Karst ecosystems and tested its accuracy. Through this study, we will extend our understanding of the burning characteristics of fuel in the Karst ecosystems, provide a direction for improving the accuracy of the Rothermel prediction model, and establish the importance of forest fire management and fighting to reduce the harm by formulating a fighting strategy for Karst ecosystems.

2. Method

2.1. Sample Collection Area

The sample collection area for the indoor burning simulation was located in Dalou Mountain, a southeast forest region of China that belongs to the typical Karst Forest ecosystems and is rich in resources, as shown in Figure 1. The study area has a subtropical humid monsoon climate with an annual mean temperature, relative humidity, and rainfall of approximately 15.1 °C, 76%, and 1116 mm, respectively. The main tree species include Pinus massoniana Lamb., Pinus yunnanensis, Pinus armandii, Platycladus orientalis, Quercus acutissima Carr., Phyllostachys edulis, and Cyclobalanopsis glauca (Thunb.) Oerst., and shrubs include Padus racemosa and Chimonanthus praecox (Linn.) Link, and Viburnum foetidum Wall. var. rectangulatum (Graebn.) Rehd. In 2004, a major forest fire occurred in the study area, with an area of 53.4 hectares. Although there have been no forest fires in recent years, under the background of climate change, the fuel loading continues to accumulate, increasing the probability of large and extraordinary fires [24].

2.2. Sample Plot Setting and Fuel Characteristics Investigation

Pinus massoniana Lamb., Pinus yunnanensis, Pinus armandii, Quercus glauca, Quercus acutissima, Cunninghamia lanceolata, and Phyllostachys edulis are typical tree species in Karst ecosystems in south China. Compared with other no-Karst ecosystems, the characteristics of fuels in these tree species are more complex. Therefore, in this study, a sample plot of 25.82 m × 25.82 m (one mu) was set for each representative tree species. The fire period in the study area ranged from October of the current year to May of the following year, in which February to April is the peak fire season. Due to the difference in physical and chemical properties of the fallen and withered fuel, to make this study practical, the fuel was collected from the standard sites of each tree species in the following year.
The fuels in the model were assumed to be homogeneous for a small space and in a short time when using the Rothermel model, so the fuel bed applied in this study should also meet this assumption as much as possible. Litter includes leaves, petals, cones, and so on. As the main component of litter, leaves are also the main carrier of forest fires. Therefore, in this study, fuel was the fallen leaves of each tree species. In February 2021, the leaves in the seven plots were collected by destructive methods, and the collected leaves were withered in the second year, ensuring the integrity of the leaf structure. In total, 30 samples of 20 cm × 20 cm size were randomly set in the sample plot of each tree species to investigate the characteristics of the sample plot and corresponding fuel (Table 1). To make the descriptions more concise, Pinus massoniana Lamb., Pinus yunnanensis, Pinus armandii, Quercus glauca, Quercus acutissima, Cunninghamia lanceolata, and Phyllostachys edulis are abbreviated as Pm, Py, Pa, Qg, Qa, Cl, and Pe, respectively.
When using the Rothermel model directly to calculate R O S 0 , the physical and chemical characteristics of the fuel need to be entered. Therefore, through a literature review and indoor measurements, the physical and chemical characteristics of the seven types of fuel were obtained (Table 2). Among them, the surface area to volume represents the ratio of leaf surface area to volume, and the measurement method is shown in [25]. The mean and measurement method of particle density can be found in [26]. The measurement method of total mineral content is to accurately weigh 3 g of leaf and place the sample in a muffle furnace at 450 °C for 24 h to obtain ash. The mineral content is calculated as the ratio of mineral (ash) mass to total oven-dry wight [27]. The effective mineral content represents the ratio of mineral content (silica-free) to total oven-dry weight [1], so it is necessary to determine the content of silica in mineral content, the measurement method is shown in [28]. The heat value represents the heat released by the complete burning of a unit mass of leaf in an absolute oven-dry state, the measurement method is shown in EN 14918:2009 Solid biofuels (determination of calorific value) [29]. These physical and chemical properties were measured 3 times and the arithmetic mean value was used as the final value.

2.3. Burning Experiment

The burning experiment on fire behavior was conducted indoors. Research has shown that the R O S 0 is mainly related to the physical and chemical properties of fuels. Therefore, according to the characteristics of the field fuel bed, fuel beds with different MC, heights, and loadings were evenly placed indoors for the burning experiment. Research shows that when the MC is below 35%, it is difficult to ignite and spread [30]. Therefore, to ensure the practical significance of this study, it is necessary to determine the maximum MC value. The burning experiment was conducted with a gradient of 5%, starting from an MC of 35%, until it could be ignited and spread. At this time, the MC is the maximum value for the burning experiment. The experiment results show that when the MC is 25%, only some cases are ignited and spread. Based on this, the maximum MC gradient in this study is set to 20%, and the MC was set with four gradients at 5%, 10%, 15%, and 20%; the bed height was set with four gradients at 2, 3, 5, and 9 cm; and the bed loading was set with four gradients at 4, 5, 6, and 8 t/ha. Due to the different combustibility of fuels of different tree species, the number of burning times of each tree species in the study area was also different. When the MC was 20%, some fuel beds of Pm and Qg did not burn; therefore, 60 and 48 burning experiments were performed, respectively. The loading of the fuel bed with Pe could not be set at 8 t/ha; therefore, 48 burning experiments were carried out, and 64 burning experiments were performed for other tree species.
A large oven was used to dry the fuel at 105 °C. During the drying process, the fuel MC was measured time to time using a rapid moisture apparatus (ML50, A&D Company, Tokyo, Japan), and the fuels were removed for the burning experiment when the fuel MC met the experimental setting conditions. The required fuel quality was calculated according to the load MC gradient set in the experiment, and fuels were evenly laid on a burning bed with a size of 2 m × 1 m according to the fuel height requirements. Then, at least 20 random points were selected on the burning bed to measure the height of the fuel bed and adjusted at any time if it did not meet the requirements. The mean value was taken to meet the fuel height required for the experiment.
The ignition slot was fixed at one end of the burning bed and ignited with alcohol to form a fire line that ignited the fuel bed. Each time the fire was ignited, the flames spread forward along a straight line. When the fire spread to a “quasi-steady” state, the ROS of the fire was recorded using poles on both sides of the burning bed [15]. The survey poles were distributed on the layers of the burning bed every 0.2 m (a total of 11 poles on each side). The time when the fire head reached two poles was recorded, and then the instantaneous speed of the forest fire spread between the two poles was calculated. The arithmetic mean of the multiple instantaneous speeds was taken as the ROS under this condition. To reduce the influence of the indoor air temperature and humidity on R O S 0 , the experiment was conducted under similar conditions. The mean temperature and humidity during the entire experiment were 22.8 and 69.8%, respectively, with a varying range of ± 10%. The burning experiment diagram is shown in Figure 2.

2.4. Statistical Analysis

2.4.1. Basic Information on R O S 0

For each kind of litter, the instantaneous speed of forest fire spread between the poles of the two surveys can be calculated by recording the time when the flames reach the poles of the two surveys. The arithmetic mean of the instantaneous speed after the fire head spread reached the “quasi-steady” state was considered ROS. The R O S 0 of fuel under seven typical forests in the Karst ecosystems was calculated, and a multiple comparison test was performed to observe any significant difference in R O S 0 among different tree species.

2.4.2. Applicability Analysis of Direct Rothermel Model

The formula and detailed information for calculating the R O S 0 under the condition of no-wind on flat ground is shown in the literature [1].
When the Rothermel model was directly used, the original set value of 0.3 was used for the extinction moisture content ( M x ). Then, according to Table 2 and the characteristics of the fuels set in the burning experiment, the values obtained by direct application of the Rothermel model were recorded as R 0 . Taking the measured value as the abscissa and the predicted value as the ordinate, we drew a 1:1 diagram and analyzed the prediction effect of using the Rothermel model directly. Furthermore, the mean absolute error (MAE) and mean relative error (MRE) were calculated directly using the Rothermel model.

2.4.3. Rothermel Model for Re-Estimating Parameters

The uncertainty of the fuel parameters is the reason for the error in the Rothermel model. According to the original Rothermel model, for a specific fuel type, the values of SAV ratio, mineral content, and heat content were fixed, and by simplifying the Rothermel model, Equation (1) was obtained:
R 0 = δ 0.174 H 1 S T S e 0.19 0.0591 + 2.926 σ 1.5 1 192 + 7.9095 σ 1 e 4.528 σ [ ( β β o p ) 8.9033 σ 0.7913 e 8.9033 σ 0.7913 1 β β o p + 0.792 + 3.7597 σ 0.5 β + 0.1 ] [ 1 2.59 M f M x + 5.11 M f M x 2 3.52 M f M x 3 581 + 2594 M f ]
where R 0 indicates the R O S 0 value obtained by directly using Rothermel model under the condition of no-wind on the flat ground (m/min); β indicates the packing ratio of the fuel (dimensionless); β o p indicates the optimal packing ratio (dimensionless); σ indicates the surface area to volume (cm2/cm3); S T indicates the total mineral content (dimensionless); H indicates the heat content (kj/kg); M f and M x indicate the moisture content and extinction moisture content of fuel, respectively (dimensionless); S e indicates the effective mineral content (dimensionless); and δ indicates the fuel height (m). The same below. The study area has a high incidence of fires from February to April each year. To ensure more meaningful results, the fall leaves of the second year were selected as experiment materials to measure the physical and chemical properties.
To preserve the original form of the Rothermel model, let:
a = 0.174 H 1 S T S e 0.19 0.0591 + 2.926 σ 1.5 1 192 + 7.9095 σ 1 e 4.528 σ
f β = ( β β o p ) 8.9033 σ 0.7913 e 8.9033 σ 0.7913 1 β β o p + 0.792 + 3.7597 σ 0.5 β + 0.1
g m = 1 2.59 M f M x + 5.11 M f M x 2 3.52 M f M x 3 581 + 2594 M f
b = 8.9033 σ 0.7913
c = 0.792 + 3.7597 σ 0.5
Then, the R O S 0 prediction model R 1 based on the re-estimated parameters of the Rothermel model is shown in Equation (7):
R 1 = δ a f β g m = δ a β β o p b e b 1 β β o p + c β + 0.1 [ 1 2.59 M f M x + 5.11 M f M x 2 3.52 M f M x 3 581 + 2594 M f ]
In the R 1 , b and c were determined by the SAV ratio of the fuel. Table 2 shows the SAV of various types of fuels, where b and c are known. a was determined by H , S T , S e , and σ , which are related only to the type of fuel. For a specific fuel type, β o p , M x , and a were fixed. Therefore, the parameters in the model included β o p , M x , and a , and the input variables are fuel height, packing ratio, and MC.
For each fuel type, the parameters β o p , M x , and a were obtained using indoor burning experiment data and an n-fold cross-validation method, and the MAE and MRE were calculated for each fuel type.

2.4.4. Reforming a New Prediction Model

According to the Rothermel model and fuel burning mechanism, it can be inferred that under the condition of no-wind on flat ground, the packing ratio has a double effect on the R O S 0 , while the MC is negatively related to the R O S 0 . Therefore, the ROS prediction model was reformed and recorded as R 2 by Equation (8), as follows:
R 2 = δ e d β f g M f + k
where d , f , g , k  indicate the parameters to be estimated in the model
The parameters in R 2 are d , f , g , and k , and the input variables were the same as R 1 , only the fuel height, packing ratio, and MC were changed. The parameters for each fuel type were obtained by nonlinear least square fitting, and the errors were calculated.

2.4.5. Model Validation and Comparison

A t-test was used to compare the prediction errors of the three models ( R 0 , R 1 , and R 2 ). Taking the measured value of the R O S 0 as the abscissa and the predicted value as the ordinate, a 1:1 diagram as drawn to compare the prediction effects of the R 1 and R 2 models. The fitting software used in this study was MATLAB, 2018a (The MathWorks, Inc., Natick, MA, USA).

3. Results

3.1. Basic Information on R O S 0

Figure 3 shows the basic information and multiple comparison results of R O S 0 . It can be seen that under flat and windless conditions, the variation range of for typical tree species in the southern Karst ecosystems was 0.042–0.556 m/min. According to the multiple comparison test, the mean R O S 0 of typical tree species in the Karst ecosystems has a Py, Pa, Pe, Cl, Pm, Qa, and Qg from high to low. Among them, Py, Pa, and Pe were significantly (p < 0.05) higher than those in other forests but had no significant difference between them. The R O S 0 of Qg was significantly lower than that of other forests.

3.2. Applicability Analysis of Direct Use of Rothermel Model

The mean values of MAE and MRE for typical forest fuel in the Karst ecosystems using the Rothermel model were 0.113 m/min and 53.760%, respectively. The minimum and maximum values of relative error (RE) when using the Rothermel model directly to predict R O S 0 were 1.647% and 160.488%, respectively (Figure 4).
When the Rothermel model was directly used, the predicted R O S 0 values of Pm, Py, Pa, Qg, Qa, and Cl were all on the higher side, while for Pe, the measured R O S 0 value was lower than 0.3 m/min, and the predicted value was higher. When it is higher than 0.3 m/min, it is underestimated (Figure 5).

3.3. Parameters and Errors of R O S 0 Prediction Model

Table 3 gives the results of the Rothermel model for re-estimating parameters; the MAE range was 0.024–0.093 m/min. The minimum MRE value was for Pe at 15.3% and maximum MRE value was for Py at 21.6%.
Table 4 lists the parameters and results of the reformed prediction model. It can be observed that when the reformed model was used for R O S 0 prediction of typical forests in the Karst ecosystems, the minimum value of MAE was only 0.013 m/min, which was for Qg. The MRE of all fuel types was within 15.0%, and the minimum value was only 13.3%.

3.4. Comparison of Model Prediction Error

3.4.1. Multiple Comparison Results of MRE of Different Models

Except for Pe, the MRE of the other fuel types by directly using the R 0 model were significantly higher than those of R 1 and R 2 . The MRE of R 1 for Pa and Qg was significantly different from that of R 2 . The prediction errors of R 1 and R 2 for all forests did not differ significantly, but errors in R 2 were lower than that in R 1 (Figure 6).

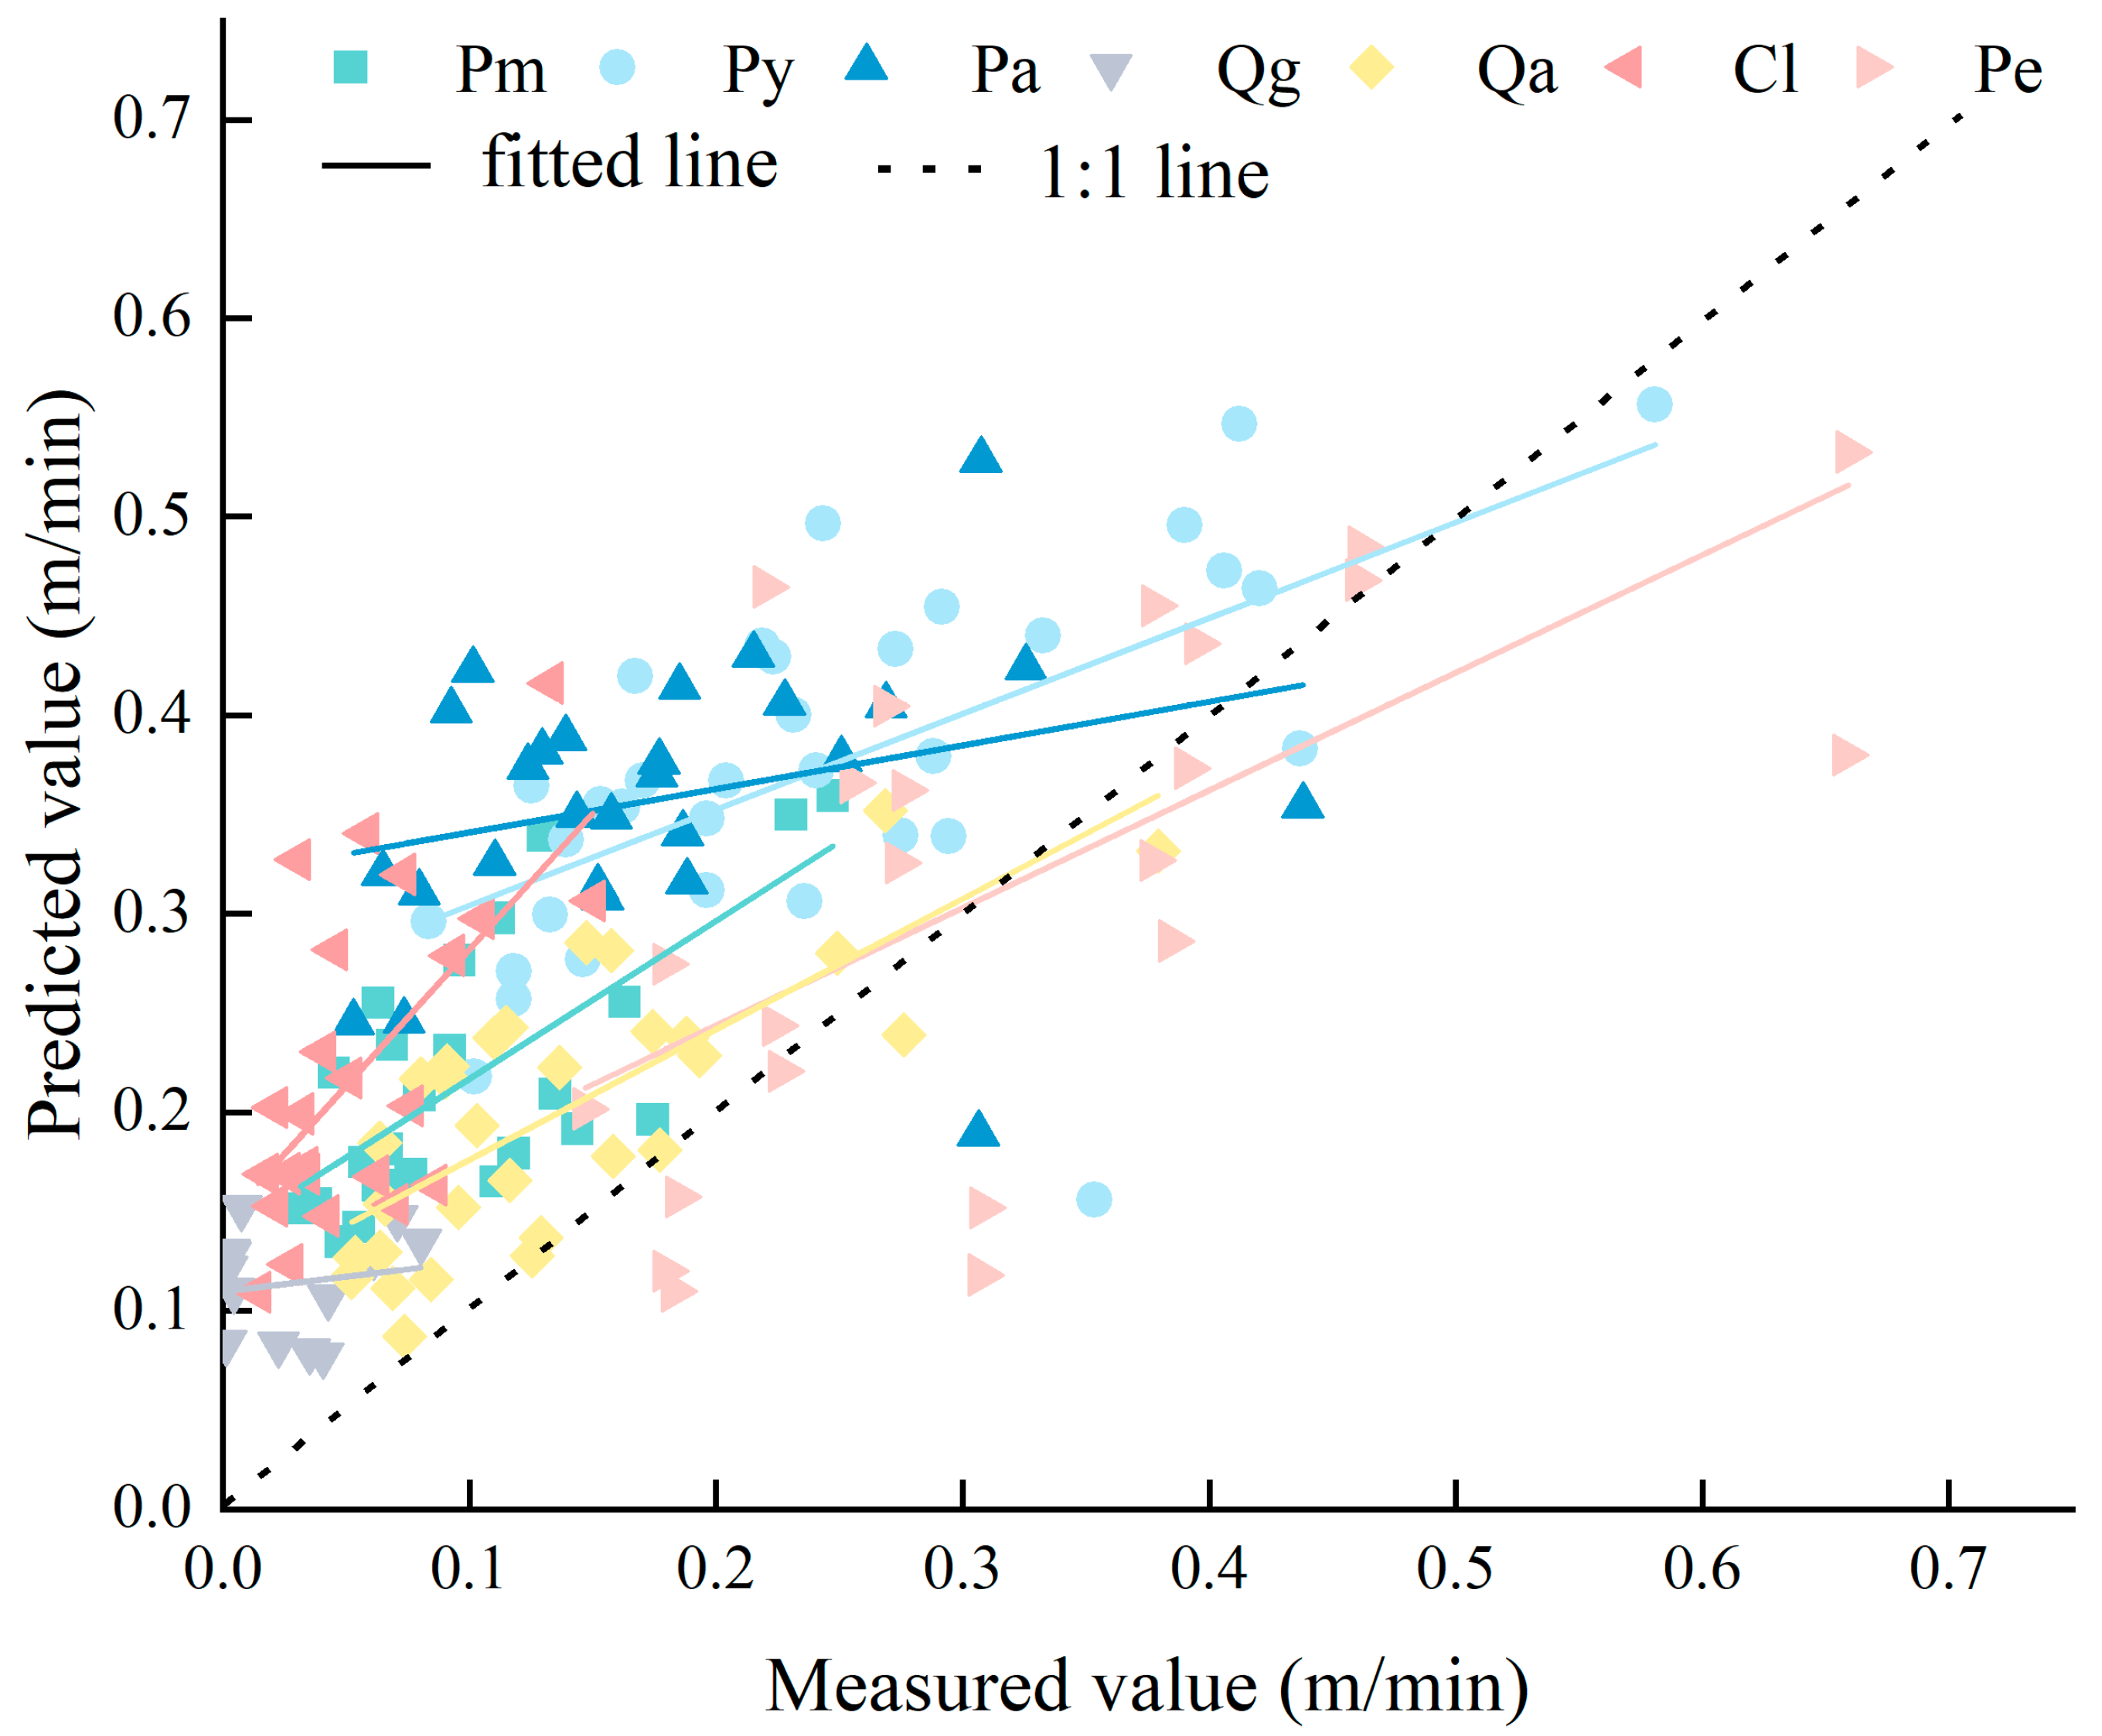
3.4.2. Comparison between Predicted and Measured Values

For the R 1 model, the predicted values of Pa were overestimated, and the predicted and measured values of the other fuel types were evenly distributed on both sides of the 1:1 line. For the R 2 model, the measured and predicted values of all fuel types were evenly distributed on both sides of the 1:1 line, except for Pm, while other fuel types were slightly underestimated (Figure 7).

4. Discussion

4.1. Basic Information on ROS0

Under the same experimental conditions, the significant difference in R O S 0 of different fuel beds under flat and windless conditions is mainly due to the different physical and chemical properties of the fuels, especially the SAV ratio of the fuels, which determines the heat transfer during the burning process [1,31]. The larger the value, the more conductive is the heat transfer and the more it will promote burning. Sandberg et al. research has shown that when the SAV ratio is below around 100 cm2/cm3, the effective heat number increases linearly with the SAV ratio, when it exceeds 100 cm2/cm3, the increasing trend is slow [16]. In this study, the SAV ratio of fuel of Qg was the smallest at only 57.783 cm2/cm3; therefore, its R O S 0 value was the lowest. The SAV ratio of fuels of Pe, Py, Pa, Qa, Pm, Cl, and Qg were in order of high to low, which was basically the same as that of their R O S 0 . There is no difference in R O S 0 between Pe, Py and Pa, but it is significantly higher than other fuels. This further confirm that even under the same conditions, when the SAV ratio is below a certain value, the impact of SAV ratio on R O S 0 is significant, consistent with the results of Sandberg et al. [16].

4.2. Applicability Analysis of Rothermel Model

The Rothermel model is a semi-physical model in which the parameters are obtained through experiments and statistical methods, and the errors are mainly caused by the model parameter uncertainty. For example, M x in the model represents the maximum MC at which the fuel can maintain flames under the action of a fire source [32,33]. It is a constant value in the model and is approximately 0.3 [34]. However, the M x of the fuel bed is significantly related to the physical and chemical properties and bed structure of the fuel itself. The unified use of 0.3 will inevitably lead to prediction errors. When using Rothermel model directly, some tree species were overestimated and some were underestimated, which was also due to unreasonable parameter settings and the interaction between physical and chemical properties of fuel. It further confirms that although the Rothermel model has certain universality, further reforming is needed for different tree species [31]. Therefore, the Rothermel model cannot be directly used to predict R O S 0 in the Karst ecosystems of our study area, and the model needs to be corrected or reformed.

4.3. Analysis of Model Parameters

Reducing the number of unknown parameters reduces the error caused by parameter uncertainty [35]. To preserve the original framework of the Rothermel model, the model is integrated with only one parameter and two variables to be estimated ( a ,   M x , and β o p ). Parameter a is mainly related to the physical and chemical properties of the fuel and is affected by the heating value, and total and effective mineral contents. For the seven typical forests in the Karst ecosystems of the south, R O S 0 showed a downward trend with an increase in a . The packing ratio indicates the compactness of the fuel monomer in the bed; the higher the packing ratio, the tighter is the fuel in the bed [1]. This situation is conducive to heat transfer and combustible gas accumulation but also reduces the oxygen concentration in the combustion zones and inhibits burning [36]. Therefore, the effects of the bed packing ratio on R O S 0 under flat and windless conditions are dual, and there is an optimal packing ratio. In the Rothermel model, β o p is only related to the surface area and volume of the fuel. Therefore, the current study took it as a variable to be estimated in the model through the burning experiment and has more practical significance. The result of this model for β o p is higher than that calculated based on the SAV ratio. Furthermore, the M x of seven typical forests in the southern Karst ecosystems under experimental conditions were obtained using this model, with a mean value of 0.226, which is lower than the fixed value of 0.3. Therefore, the results obtained by this model are more in line with the actual situation. For example, the fuels of Qg are rich in wax, are not easy to burn, and, therefore, have the lowest M x value at only 0.184.
By fully considering the impact factors, this study reformed the model and established a new R O S 0 prediction model for the south Karst ecosystems: R 2 = δ e d β f g M f + k , including four parameters to be estimated. where the parameters f and k g represent the β o p and M x , respectively. The mean values of the two variables obtained by selecting this model were 0.099 and 0.327, respectively. The model does not have typical combustion physical characteristics, such as in R 0 and R 1 ; therefore, the physical significance of the parameter results is weak, but to some extent, it also reveals the effect of the bed packing ratio and M x on R O S 0 .

4.4. Prediction Effect of Model

The R 1 and R 2 prediction model can explain approximately 57.86% and 70.00% of the R O S 0 variation, respectively, on average. Man et al. used a reformed model to obtain a variation range of R O S 0 11%–29% [31], and the MRE value obtained by Ross et al. was approximately 32% [9]. The results of this study are lower than those of the other studies. The prediction effect of R 1 and R 2 models was significantly better than that of using the Rothermel model directly. Although there was no significant difference in the prediction error between R 1 and R 2 , the MRE of R 2 was lower than R 1 , and for all tree species, the MRE of R 2 was lower than 15%, which was within the acceptable range [26]. Although the physical meaning of the R 2 model is less than R 1 and R 0 , it is simple and practical.
The main purpose of this study was to examine the applicability of the Rothermel model and reforming the core model. Therefore, only no-wind and zero-slope conditions were considered, which reduces the efficiency of the model application in the natural stands. In future studies, it will be necessary to increase the field validation experiments and consider the impact of meteorological factors and topographic conditions to establish a more comprehensive R O S prediction model for typical forests in the Karst ecosystems in southern China. Furthermore, for a specific study area, the empirical model may be more effective because it focuses on the prediction effect and practicability. Therefore, in future research, simple empirical methods can be used to predict R O S 0 , and a variety of methods can be compared, which is of great significance for further understanding the R O S 0 and obtaining a high-precision prediction model.

5. Conclusions

It is not suitable to directly use the Rothermel model to predict the R O S 0 value of typical forests in the Karst ecosystems in southern China under flat land and windless conditions. The uncertainty of the parameters is one of the main sources of error and may cause errors of up to 50%. Based on an indoor burning experiment of typical forests in the southern Karst ecosystems, the model parameters were re-estimated, the error was significantly reduced, and the resultant prediction effect was good. The reformed model has the best prediction effect, and its form is simpler and easier to use. It can be popularized and applied in Karst ecosystems in southern China. This study was conducted indoors to reduce the impact of unstable field environment on the test results. However, there are differences between indoor and actual field conditions.

Author Contributions

Y.Z. conceived the idea and supervised the project and interpreted results and drafted the manuscript. L.T. processed the experiments and performed the analysis. All authors have read and agreed to the published version of the manuscript.

Funding

This research was jointly supported by the Science and Technology Support Program of Guizhou Province [grant number: Qianke Support (2022) General 249]; the China National Natural Science Foundation [grant number: 32201563]; and the Youth Science and Technology Talent Development Project of Education Department in Guizhou Province [grant number: QJHKY (2021) 251].

Data Availability Statement

The data are not publicly available due to the incomplete completion of the fund project.

Conflicts of Interest

The authors declare that the research was conducted in the absence of any commercial or financial relationships that could be construed as potential conflicts of interest.

References

  1. Rothermel, R.C. A Mathematical Model for Predicting Fire Spread in Wildland Fuels; Research Paper INT-115; USDA Forest Service, Intermountain Forest and Range Experiment Station: Ogden, UT, USA, 1972.
  2. Albini, F.A. Wild-land fire spread by radiation—A model including fuel cooling by natural convection. Combust. Sci. Technol. 1986, 45, 101–113. [Google Scholar] [CrossRef]
  3. Sullivan, A.L. Wildland surface fire spread modeling, 1990–2007. 1: Physical and quasi-physical models. Int. J. Wildland Fire 2009, 18, 349–368. [Google Scholar] [CrossRef]
  4. Andrews, P.L. BehavePlus fire modeling system: Past, present, and future. In Proceedings of the 7th Symposium on Fire and Forest Meteorology, Bar Harbor, ME, USA, 23–25 October 2007; Brown, T.J., Potter, B.E., Larkin, N., Anderson, K., Eds.; American Meteorological Society: Boston, MA, USA,, 2007. Available online: http://ams.confex.com/ams/pdfpapers/126669.pdf (accessed on 13 January 2023).
  5. Finney, M.A. FARSITE: Fire Area Simulator-Model Development and Evaluation; Research: Paper RMRS-RP-4; USDA Forest Service, Rocky Mountain Research Station: Ogden, UT, USA, 1998.
  6. Finney, M.A. An overview of FlamMap fire modeling capabilities. In Proceedings of the Fuels Management—How to Measure Success [Conference Proceedings], RMRS-P-41; Portland, OR, USA, 28–30 March 2006, PAndrews, L., Butler, B.W., Eds.; USDA Forest Service, Rocky Mountain Research Station: Fort Collins, CO, USA, 2006; pp. 213–220. [Google Scholar]
  7. Scott, J.H.; Reinhardt, E.D. Assessing Crown Fire Potential by Linking Models of Surface and Crown Fire Behavior; Research: Paper RMRS-RP-29; USDA Forest Service, Rocky Mountain Research Station: Fort Collins, CO, USA, 2001.
  8. Carlton, D. Fuels Management Analyst Plus Software; Version 3; Fire Program Solutions LLC: Estacada, OR, USA, 2005; Available online: http://www.fireps.Com/fmanalyst3/index.htm (accessed on 10 April 2023).
  9. Rossa, C.G. The effect of fuel moisture content on the spread rate of forest fires in the absence of wind or slope. Int. J. Wildland Fire 2017, 26, 24–31. [Google Scholar] [CrossRef]
  10. Cheney, N.P.; Gould, J.S.; Catchpole, W.R. The influence of fuel, weather and fire shape variables on fire-spread in grasslands. Int. J. Wildland Fire 1993, 3, 31–44. [Google Scholar] [CrossRef]
  11. Burrows, N.D. Fire behaviour in Jarrah forest fuels: 1. Laboratory Experiments. Calmscience 1999, 3, 31–56. [Google Scholar]
  12. Jimenez, E.; Hussaini, M.Y.; Goodrick, S. Quantifying parametric uncertainty in the rothermel model. Int. J. Wildland Fire 2008, 17, 638–649. [Google Scholar] [CrossRef]
  13. Finney, M.A.; Grenfell, I.C.; McHugh, C.W.; Seli, R.C.; Trethewey, D.; Stratton, R.D.; Brittain, S. A method for ensemble wildland fire simulation. Environ. Model. Assess. 2011, 16, 153–167. [Google Scholar] [CrossRef]
  14. Liu, Y.; Jimenez, E.; Hussaini, M.Y.; Ökten, G.; Goodrick, S. Parametric uncertainty quantification in the rothermel model with randomized Quasi-Monte Carlo methods. Int. J. Wildland Fire 2015, 24, 307–316. [Google Scholar] [CrossRef]
  15. Zhang, J.L.; Liu, B.F.; Di, X.Y.; Chu, T.F.; Jin, S. Fire behavior of Mongolian oak leaves fuel bed under no-wind and zero-slope conditions. analysis of the factors affecting flame length and residence time and related prediction models. Chin. J. Appl. Ecol. 2012, 23, 3149–3156. [Google Scholar]
  16. Cova, T.J.; Dennison, P.E.; Kim, T.H.; Moritz, M.A. Setting wildfire evacuation trigger points using fire spread modeling and GIS. Trans. GIS 2005, 9, 603–617. [Google Scholar] [CrossRef]
  17. Ascoli, D.; Vacchiano, G.; Motta, R.; Bovio, G. Building rothermel fire behaviour fuel models by genetic algorithm optimisation. Int. J. Wildland Fire 2015, 24, 317–328. [Google Scholar] [CrossRef]
  18. Sandberg, D.V.; Riccardi, C.L.; Schaaf, M.D. Reformulation of rothermel’s wild-land fire behaviour model for heterogeneous fuelbeds. Can. J. For. Res. 2007, 37, 2438–2455. [Google Scholar] [CrossRef]
  19. Anderson, W.R.; Cruz, M.G.; Fernandes, P.M.; McCaw, L.; Vega, J.A.; Bradstock, R.A.; Fogarty, L.; Gould, J.; McCarthy, G.; Marsden-Smedley, J.B.; et al. A generic, empirical-based model for predicting rate of fire spread in shrublands. Int. J. Wildland Fire 2015, 24, 443–460. [Google Scholar] [CrossRef]
  20. Yang, H.K.; Cheng, S.Z. Study on Biomass of the Karst Forest Community in Maolan, Guizhou Province. Acta Ecol. Sin. 1991, 11, 307–312. [Google Scholar]
  21. Hu, Z.L.; Pan, G.X.; Li, L.Q.; Du, Y.X.; Wang, X.Z. Changes in pools and heterogeneity of soil organic carbon, nitrogen and phosphorus under different vegetation types in Karst mountainous area of Central Guizhou Province, China. Acta Ecol. Sin. 2009, 29, 4187–4195. [Google Scholar]
  22. Sheng, M.Y.; Xiong, K.N.; Cui, G.Y.; Liu, Y. Plant diversity and soil physical-chemical properties in karst rocky desertification ecosystem of Guizhou, China. Acta Ecol. Sin. 2015, 35, 434–448. [Google Scholar]
  23. Zhang, Y.L.; Guo, Y.; Hu, H.Q. Characteristics of forest fire data in Southwest China during 2001–2017. J. Northwest For. Univ. 2021, 36, 179–186. [Google Scholar]
  24. United Nations Environment Programme. Predicting Like Wildfire: The Rising Threat of Extraordinary Landscape Fires; United Nations Environment Programme: Nairobi, Kenya, 2022. [Google Scholar]
  25. Niu, S.K.; He, Q.T.; Chen, F.; Wang, S.; Xu, G.X.; Sun, W. Spatial continuity of fuels in major coniferous forests in Beijing mountainous area: Fuel horizontal continuity and crown fire spread. J. Beijing For. Univ. 2012, 34, 1–9. [Google Scholar]
  26. Zhang, Y. Modeling the drying process of Masson pine needle fuel beds under different packing ratios based on two-phase models in the laboratory. PeerJ 2022, 10, e14484. [Google Scholar] [CrossRef]
  27. Garlough, E.C.; Keyes, C.R. Influences of moisture content, mineral content and bulk density on smouldering combustion of ponderosa pine duff mounds. Int. J. Wildland Fire 2011, 20, 589–596. [Google Scholar] [CrossRef]
  28. He, R.; Qiu, J.; Luo, B. Analysis of ash and silica content of six bamboo species. World Bamboo Ratt. 2016, 14, 1–4. [Google Scholar]
  29. Luke, R.H.; Mcarthur, A.G.; Brown, A.G.; Mcarthur, A.G.; Hillis, W.E. Bushfires in Australia; Australian Government Publishing Service: Canberra, Australia, 1978. [Google Scholar]
  30. EN 15289:2011; Solid Biofuels. Determination of Total Content of Sulfur and Chlorine. ISO: Geneva, Switzerland, 2010.
  31. Man, Z.Y.; Sun, L.; Hu, H.Q. Prediction model of the spread rate of eight typical surface dead fuel in Southern China under windless and flat land. Sci. Silvae Sin. 2019, 55, 197–204. [Google Scholar]
  32. Burgan, R.E.; Rothermel, R.C. BEHAVE: Fire Behavior Prediction and Fuel Modeling System—FUEL Subsystem; Technical Report PMS; USDA Forest Service, Intermountain Forest and Range Experiment Station: Ogden, UT, USA, 1984; Volume 439-1.
  33. Hu, H.Q. Forest Fire Ecology and Management; China Forestry Publishing House: Beijing, China, 2005.
  34. Bradshaw, L.S.; Deeming, J.E.; Burgan, R.E. The 1978 National Fire-Danger Rating System: Technical Documentation; General Technical Report INT-169; USDA Forest Service, Intermountain Forest and Range Experiment Station: Ogden, UT, USA, 1983.
  35. Cruz, M.G.; Alexander, M.E. Uncertainty associated with model predictions of surface and crown fire rates of spread. Environ. Model. Softw. 2013, 47, 16–28. [Google Scholar] [CrossRef]
  36. Sun, P.; Zhang, Y.L.; Sun, L.; Hu, H.; Guo, F.; Wang, G.; Zhang, H. Influence of fuel moisture content, packing ratio and wind velocity on the ignition probability of fuel beds composed of Mongolian oak leaves via cigarette butts. Forests 2018, 9, 507. [Google Scholar] [CrossRef]
Figure 1. Basic overview of the study area.
Forests 14 01088 g001
Figure 2. Burning experiment diagram.
Forests 14 01088 g002
Figure 3. Basic information and multiple comparison result of R O S 0 . Letters a, b and c indicate a significant difference in Rate of spread (at the 0.05 level).
Forests 14 01088 g003
Figure 4. Prediction results of using the Rothermel model directly.
Forests 14 01088 g004
Figure 5. 1:1 diagram of predicted and measured values directly using Rothermel model.
Forests 14 01088 g005
Figure 6. Results of multiple comparison of MRE of the three models.
Forests 14 01088 g006
Figure 7. 1:1 diagram of predicted and measured values by two models.
Forests 14 01088 g007
Table 1. Basic information of sample plot and fuel.
Tree SpeciesSlope (°)LocationRange of the Fuel Height (cm)Range of the Fuel Loading (t ha−1)Canopy DensityMean Height (m)Mean DBH (cm)
Pm5Upper2.1–8.84.2–8.70.7818.6320.61
Py9Downhill3.6–9.25.3–8.30.8217.9919.88
Pa7Upper1.8–8.75.2–8.80.8519.2321.76
Qg16Middle3.3–11.63.6–8.10.6113.6612.09
Qa13Middle 2.9–9.13.3–7.60.6413.1114.07
Cl3Downhill3.6–10.94.9–9.70.7210.5613.23
Pe26Downhill1.8–7.62.3–6.3---------
Table 2. Physical and chemical characteristics of fuels.
Tree Species σ (cm2/cm3)
Surface Area to Volume
ρ p   ( kg / m 3 )
Particle Density
S T   ( % )
Total Mineral Content
S e   ( % )
Effective Mineral Content
H (kj/kg)
 Heat Value
Pm66.084262.5252.4201.82020,907.222
Py126.638245.6384.0003.29117,598.608
Pa94.200239.2033.8003.12721,369.512
Qg57.783311.0769.6908.90019,659.639
Qa90.060350.9116.3004.15119,328.418
Cl62.257201.6325.1604.61018,667.645
Pe148.380243.50210.2901.84019,289.666
Mean92.520264.9275.9523.96319,545.816
Table 3. Re-estimated parameters and prediction results of the Rothermel model.
Tree Species a β o p M x R 2 MAE (m/min)MRE (%)
Pm187.8660.0140.2470.5790.03516.1
Py74.6540.0060.2420.4620.07021.6
Pa57.6860.0120.2030.5230.09324.6
Qg83.7540.0180.1840.5190.02424.8
Qa128.4740.0080.2330.6290.03416.1
Cl192.9930.0140.2340.5650.04017.9
Pe69.6730.0040.2150.7730.05015.3
Note: Pinus massoniana Lamb., Pinus yunnanensis, Pinus armandii, Quercus glauca, Quercus acutissima, Cunninghamia lanceolata, and Phyllostachys edulis are abbreviated as Pm, Py, Pa, Qg, Qa, Cl, and Pe, respectively. The same below.
Table 4. Parameter-wise prediction results by reformed model.
Tree SpeciesdfgkR2MAE (m/min)MRE (%)
Pm−416.790.073−34.71312.0700.7230.03114.1
Py−352.4660.080−34.21711.6410.7060.05514.4
Pa−78.2320.146−29.8049.9600.7130.05114.1
Qg−133.2610.155−58.53418.4540.5560.01314.3
Qa−285.2330.070−28.2769.7730.6630.03214.8
Cl−295.3550.092−43.63413.2100.7750.03214.9
Pe−301.8410.080−58.56317.8610.7380.05213.3
Disclaimer/Publisher’s Note: The statements, opinions and data contained in all publications are solely those of the individual author(s) and contributor(s) and not of MDPI and/or the editor(s). MDPI and/or the editor(s) disclaim responsibility for any injury to people or property resulting from any ideas, methods, instructions or products referred to in the content.

