

Stand-Level Biomass and Leaf Trait Models for Young Naturally Regenerated Forests of European Hornbeam
 ,
,  , and
, and
Abstract
1. Introduction
2. Materials and Methods
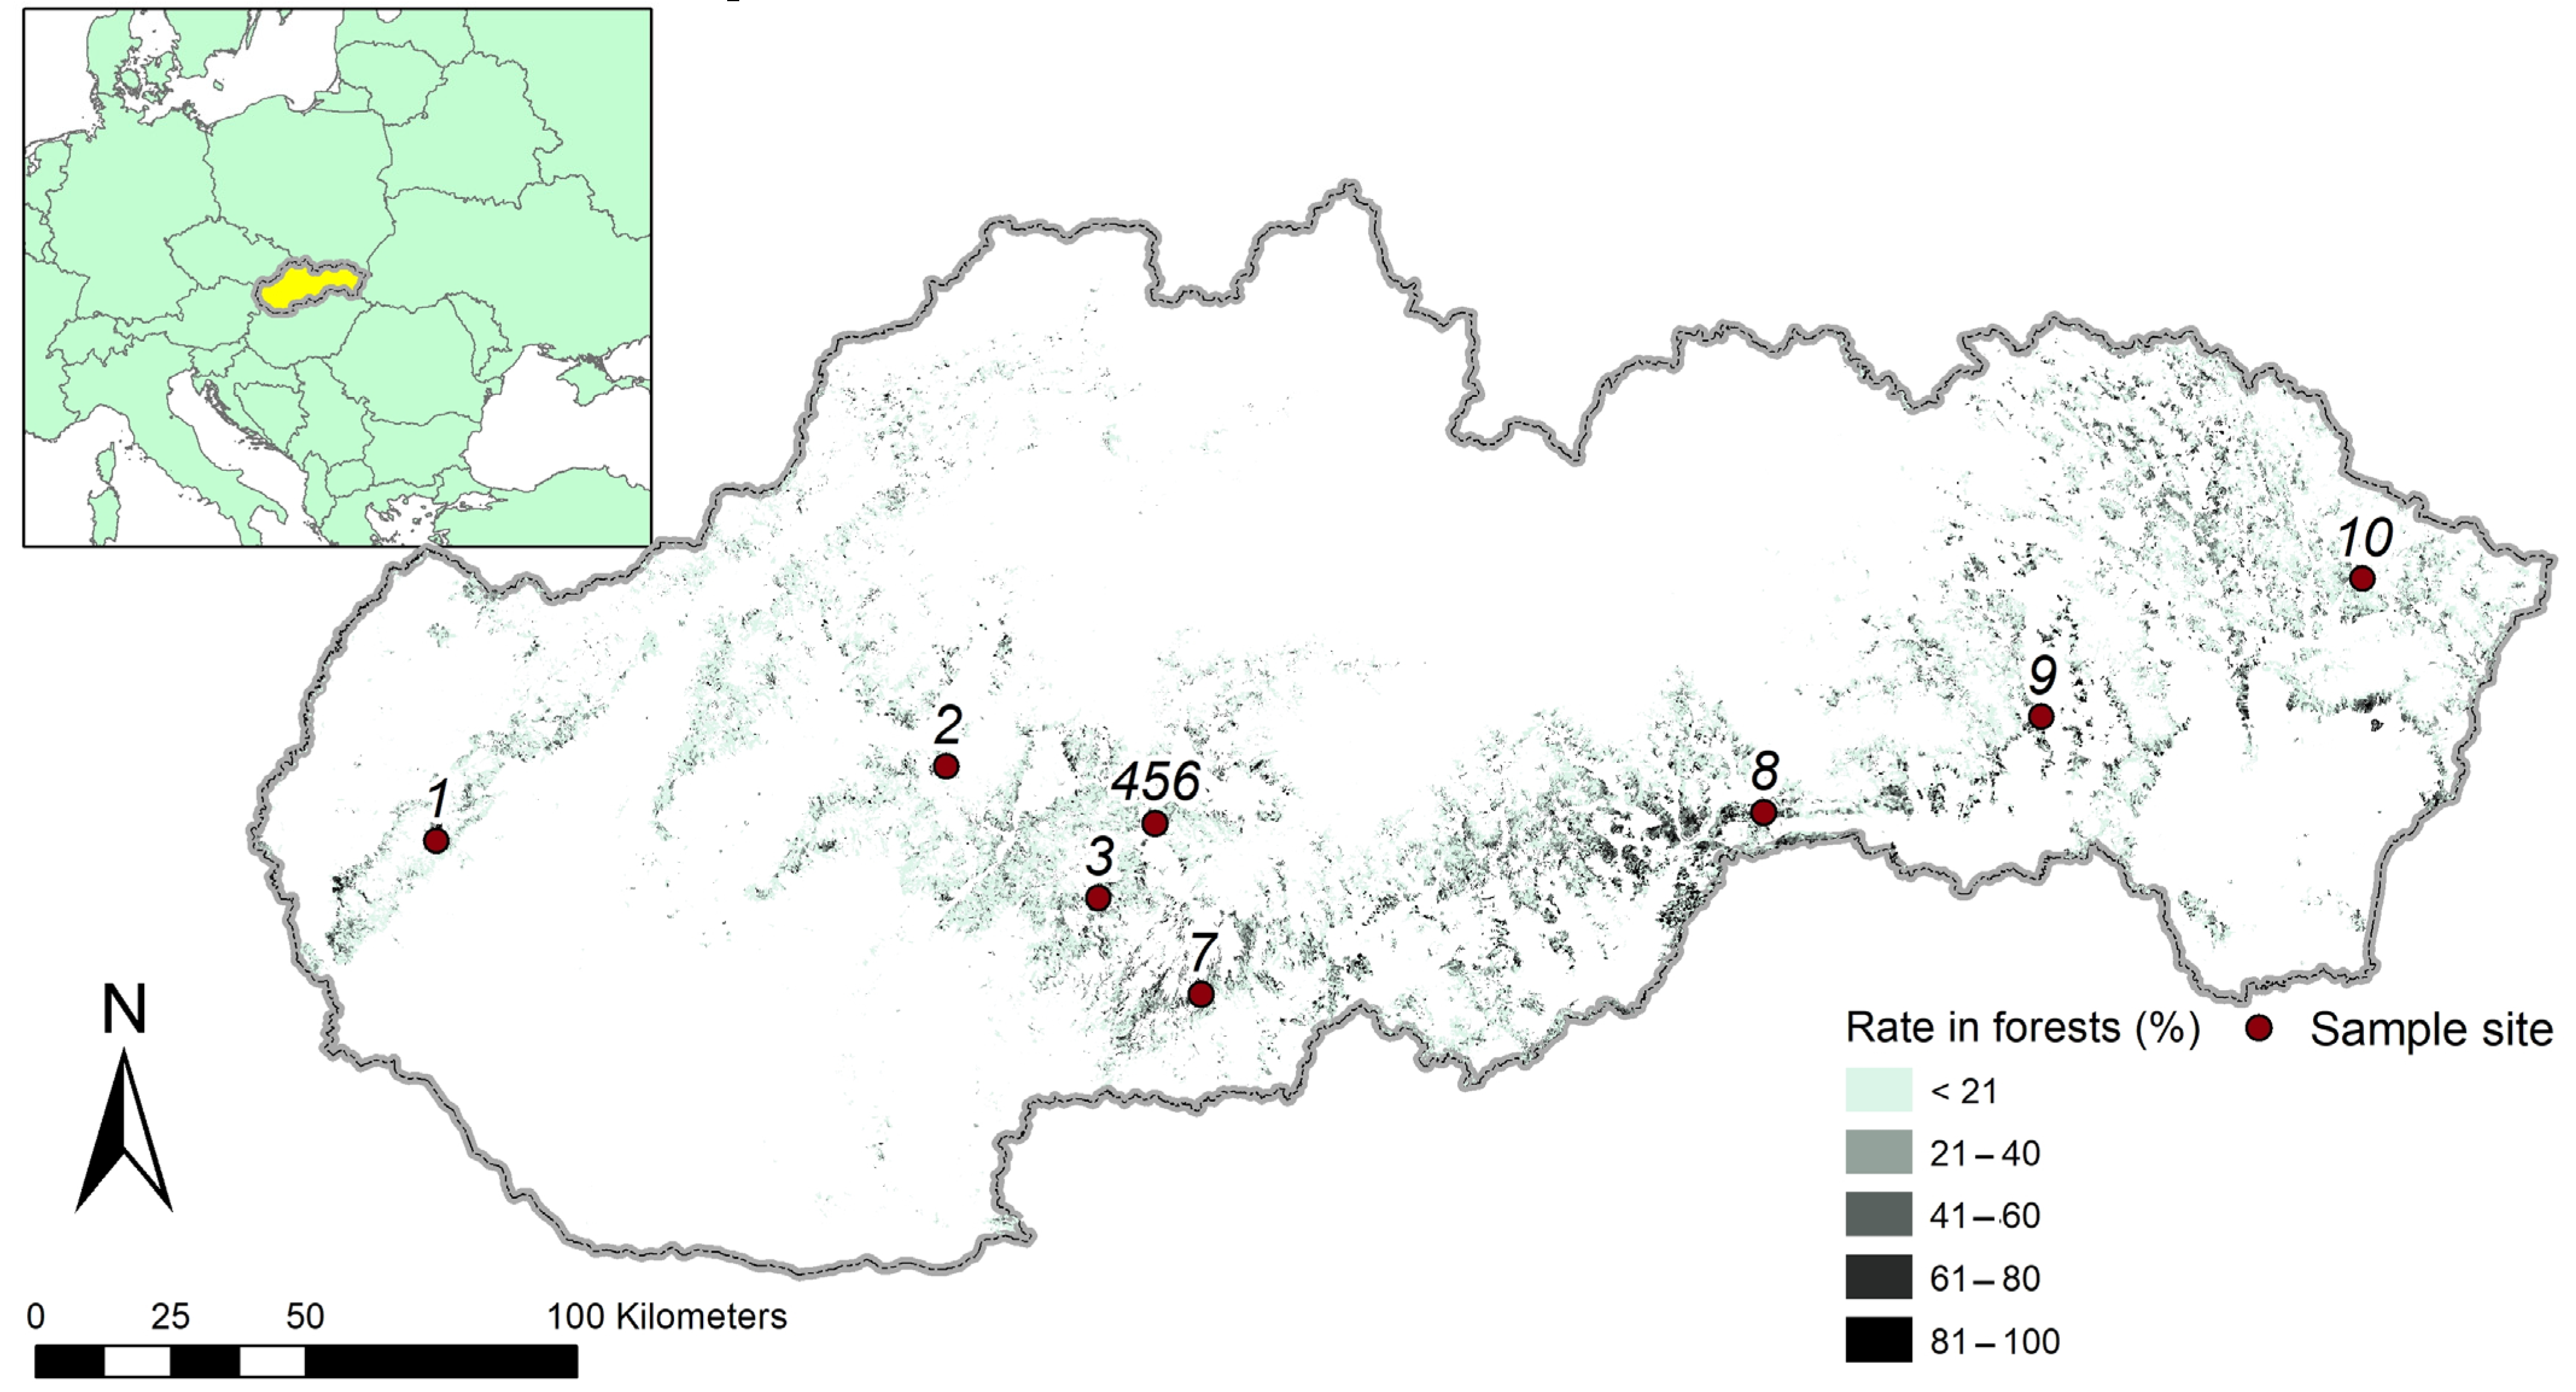
2.1. Stand Selection and Tree Sampling
2.2. Calculations at Leaf, Tree and Stand Levels
- SSE—sum of squares error;
- SST—sum of squares total;
- —predicted value of y;
- —mean value of observed y.
3. Results
4. Discussion
4.1. Stand Biomass—Quantity, Structure and Carbon Context
4.2. Importance of Leaf Traits
5. Conclusions
Author Contributions
Funding
Institutional Review Board Statement
Informed Consent Statement
Conflicts of Interest
Appendix A

| Tree Characteristic | Mean | SD | Min. | Max. | 25% | 75% |
|---|---|---|---|---|---|---|
| Diameter D0 (mm) | 17.84 | 13.94 | 0.90 | 81.20 | 7.90 | 23.3 |
| Height (m) | 2.68 | 1.83 | 0.07 | 7.56 | 1.10 | 3.88 |
| Leaf biomass (g) | 31.18 | 59.22 | 0.03 | 346.34 | 1.78 | 35.67 |
| Branch biomass (g) | 56.10 | 138.84 | 0.01 | 935.15 | 1.65 | 43.15 |
| Bark biomass (g) | 34.82 | 59.61 | 0.01 | 391.55 | 2.67 | 35.15 |
| Stem under bark biomass (g) | 263.27 | 596.14 | 0.03 | 4038.19 | 9.60 | 191.30 |
| Root biomass (g) | 78.40 | 185.46 | 0.04 | 1473.50 | 5.83 | 60.50 |
| Aboveground biomass (g) | 346.45 | 713.01 | 0.06 | 4329.52 | 12.70 | 284.95 |
| Tree biomass (g) | 414.91 | 858.13 | 0.10 | 5399.22 | 19.44 | 341.31 |
| Tree Component | b0 | S.E. | p | b1 | S.E. | p | b2 | S.E. | p | R2 | MSE | λ | S.D. |
|---|---|---|---|---|---|---|---|---|---|---|---|---|---|
| Leaves | −5.423 | 0.366 | <0.001 | 3.008 | 0.177 | <0.001 | −0.599 | 0.152 | <0.001 | 0.893 | 0.463 | 1.211 | 0.696 |
| Branches | −5.514 | 0.291 | <0.001 | 2.893 | 0.140 | <0.001 | 0.029 | 0.123 | 0.816 | 0.946 | 0.296 | 1.143 | 0.594 |
| Bark | −2.026 | 0.106 | <0.001 | 1.396 | 0.051 | <0.001 | 0.965 | 0.045 | <0.001 | 0.971 | 0.109 | 1.055 | 0.353 |
| Stem under bark | −1.486 | 0.106 | <0.001 | 1.841 | 0.051 | <0.001 | 0.896 | 0.044 | <0.001 | 0.993 | 0.041 | 1.021 | 0.220 |
| Roots | −3.348 | 0.174 | <0.001 | 2.424 | 0.084 | <0.001 | −0.114 | 0.073 | 0.121 | 0.991 | 0.041 | 1.018 | 0.183 |
| Whole tree | −1.445 | 0.121 | <0.001 | 2.165 | 0.058 | <0.001 | 0.433 | 0.050 | <0.001 | 0.990 | 0.049 | 1.024 | 0.226 |
| Site | Site | Plot | Diameter D0 (mm) | Tree Height (m) | Basal Area * | Tree Density | ||
|---|---|---|---|---|---|---|---|---|
| Code | Name | (A–C) | Mean | SD | Mean | SD | (cm2 per m2) | (pcs m−2) |
| Píla | A | 13.85 | 5.43 | 2.06 | 0.78 | 18.73 | 11 | |
| 1 | Píla | B | 33.44 | 17.29 | 4.76 | 1.57 | 101.98 | 9 |
| Píla | C | 29.05 | 18.18 | 3.38 | 1.84 | 32.82 | 7 | |
| Rudica | A | 13.45 | 15.35 | 1.84 | 1.14 | 49.40 | 15 | |
| 2 | Rudica | B | 10.01 | 5.68 | 1.42 | 0.93 | 14.49 | 14 |
| Rudica | C | 11.21 | 5.70 | 2.01 | 0.94 | 20.47 | 17 | |
| Antol | A | 26.91 | 14.75 | 4.61 | 1.36 | 93.63 | 13 | |
| 3 | Antol | B | 30.70 | 13.34 | 4.59 | 1.37 | 94.80 | 11 |
| Antol | C | 27.23 | 15.33 | 4.08 | 1.46 | 70.20 | 9 | |
| Dol. Breziny | A | 25.91 | 11.96 | 4.58 | 1.41 | 52.32 | 8 | |
| 4 | Dol. Breziny | B | 26.82 | 13.99 | 4.73 | 1.69 | 47.56 | 7 |
| Dol. Breziny | C | 25.01 | 12.45 | 4.71 | 1.51 | 81.58 | 13 | |
| Šariny | A | 9.94 | 6.96 | 1.44 | 1.05 | 17.78 | 15 | |
| 5 | Šariny | B | 13.93 | 9.91 | 1.99 | 1.30 | 19.31 | 8 |
| Šariny | C | 12.49 | 6.20 | 2.15 | 1.07 | 26.62 | 18 | |
| Hor. Breziny | A | 3.99 | 1.66 | 0.45 | 0.18 | 34.68 | 237 | |
| 6 | Hor. Breziny | B | 3.88 | 1.81 | 0.44 | 0.18 | 26.12 | 183 |
| Hor. Breziny | C | 4.36 | 1.95 | 0.42 | 0.21 | 24.00 | 134 | |
| Cerovo | A | 13.64 | 7.13 | 1.89 | 0.99 | 40.14 | 22 | |
| 7 | Cerovo | B | 17.73 | 9.52 | 2.85 | 0.98 | 61.53 | 19 |
| Cerovo | C | 12.88 | 5.24 | 2.22 | 0.75 | 56.17 | 37 | |
| Soroška | A | 14.88 | 8.50 | 1.64 | 0.70 | 23.32 | 10 | |
| 8 | Soroška | B | 16.71 | 7.14 | 2.26 | 0.58 | 32.88 | 13 |
| Soroška | C | 18.18 | 8.57 | 2.26 | 0.77 | 29.11 | 9 | |
| Budimír | A | 30.55 | 16.26 | 4.45 | 1.23 | 86.20 | 9 | |
| 9 | Budimír | B | 24.79 | 11.12 | 3.95 | 1.06 | 67.98 | 12 |
| Budimír | C | 27.78 | 16.07 | 4.12 | 1.43 | 99.81 | 12 | |
| Zubné | A | 22.05 | 10.83 | 3.57 | 1.30 | 63.08 | 13 | |
| 10 | Zubné | B | 21.52 | 11.21 | 3.41 | 1.23 | 54.13 | 12 |
| Zubné | C | 18.86 | 8.45 | 3.06 | 0.89 | 61.46 | 18 | |
| Related Variables | (Equation) | NSE | RMSE | PBIAS | IOA | AIC | BIC |
|---|---|---|---|---|---|---|---|
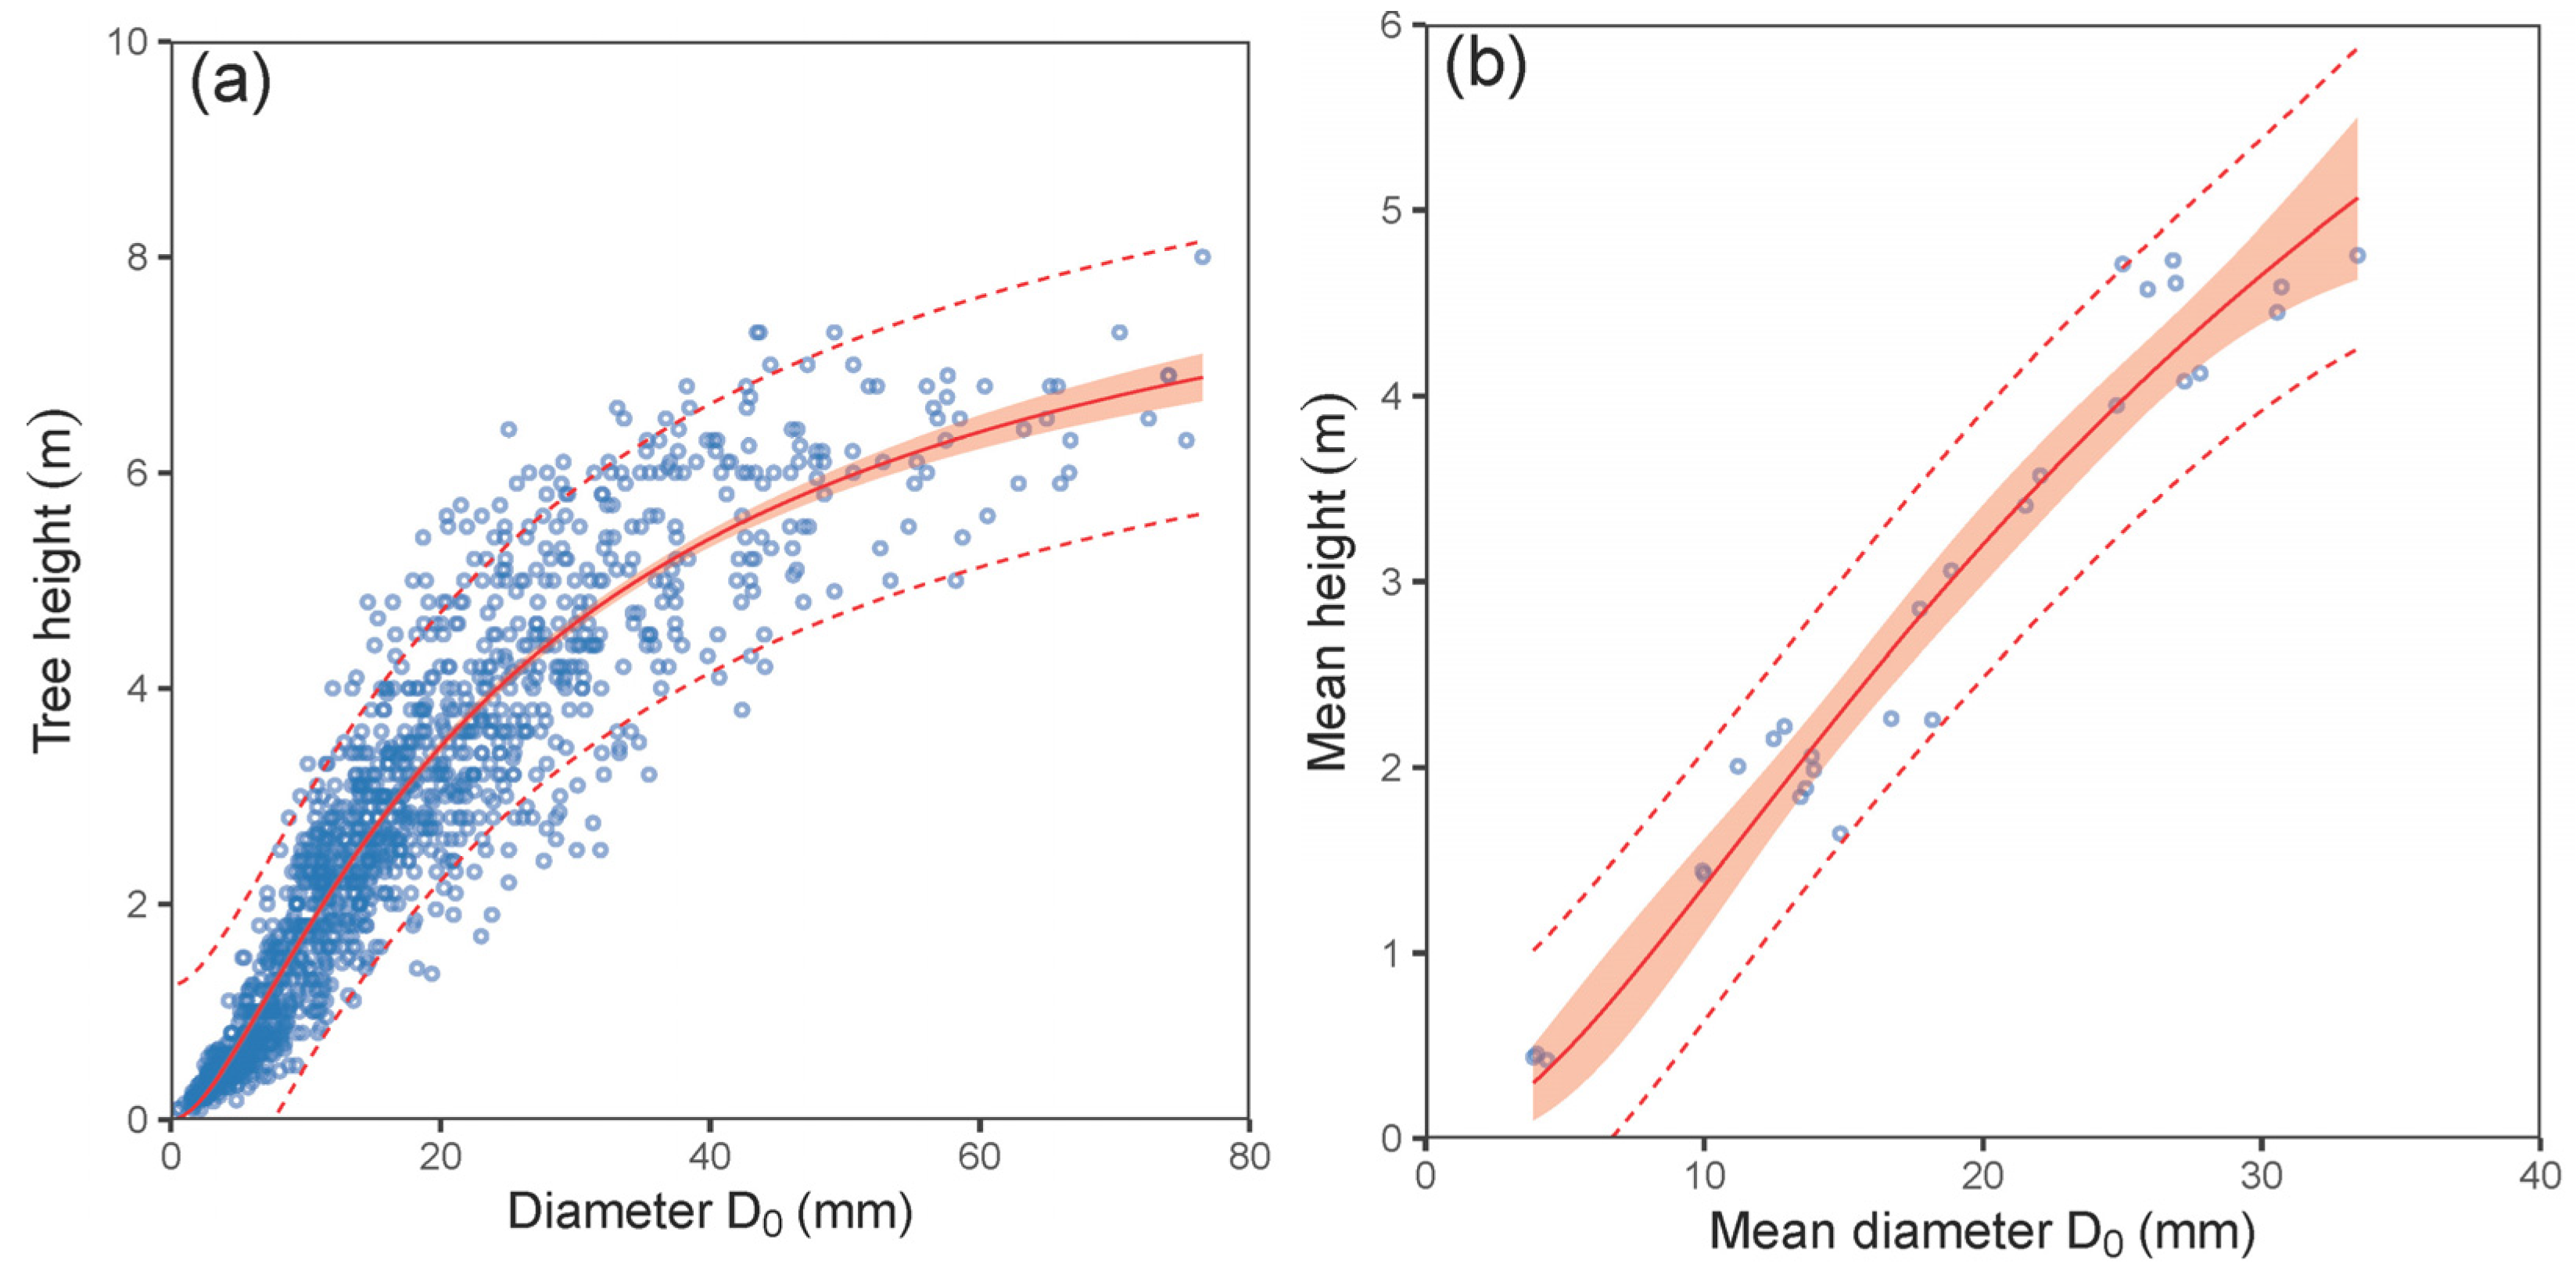
| H vs. D0—tree level | (1) | 0.88 | 0.63 | 0.03 | 0.97 | 2680 | 2701 |
| mean H vs. mean D0—plot level | (1) | 0.95 | 0.32 | 0.38 | 0.99 | 23 | 29 |
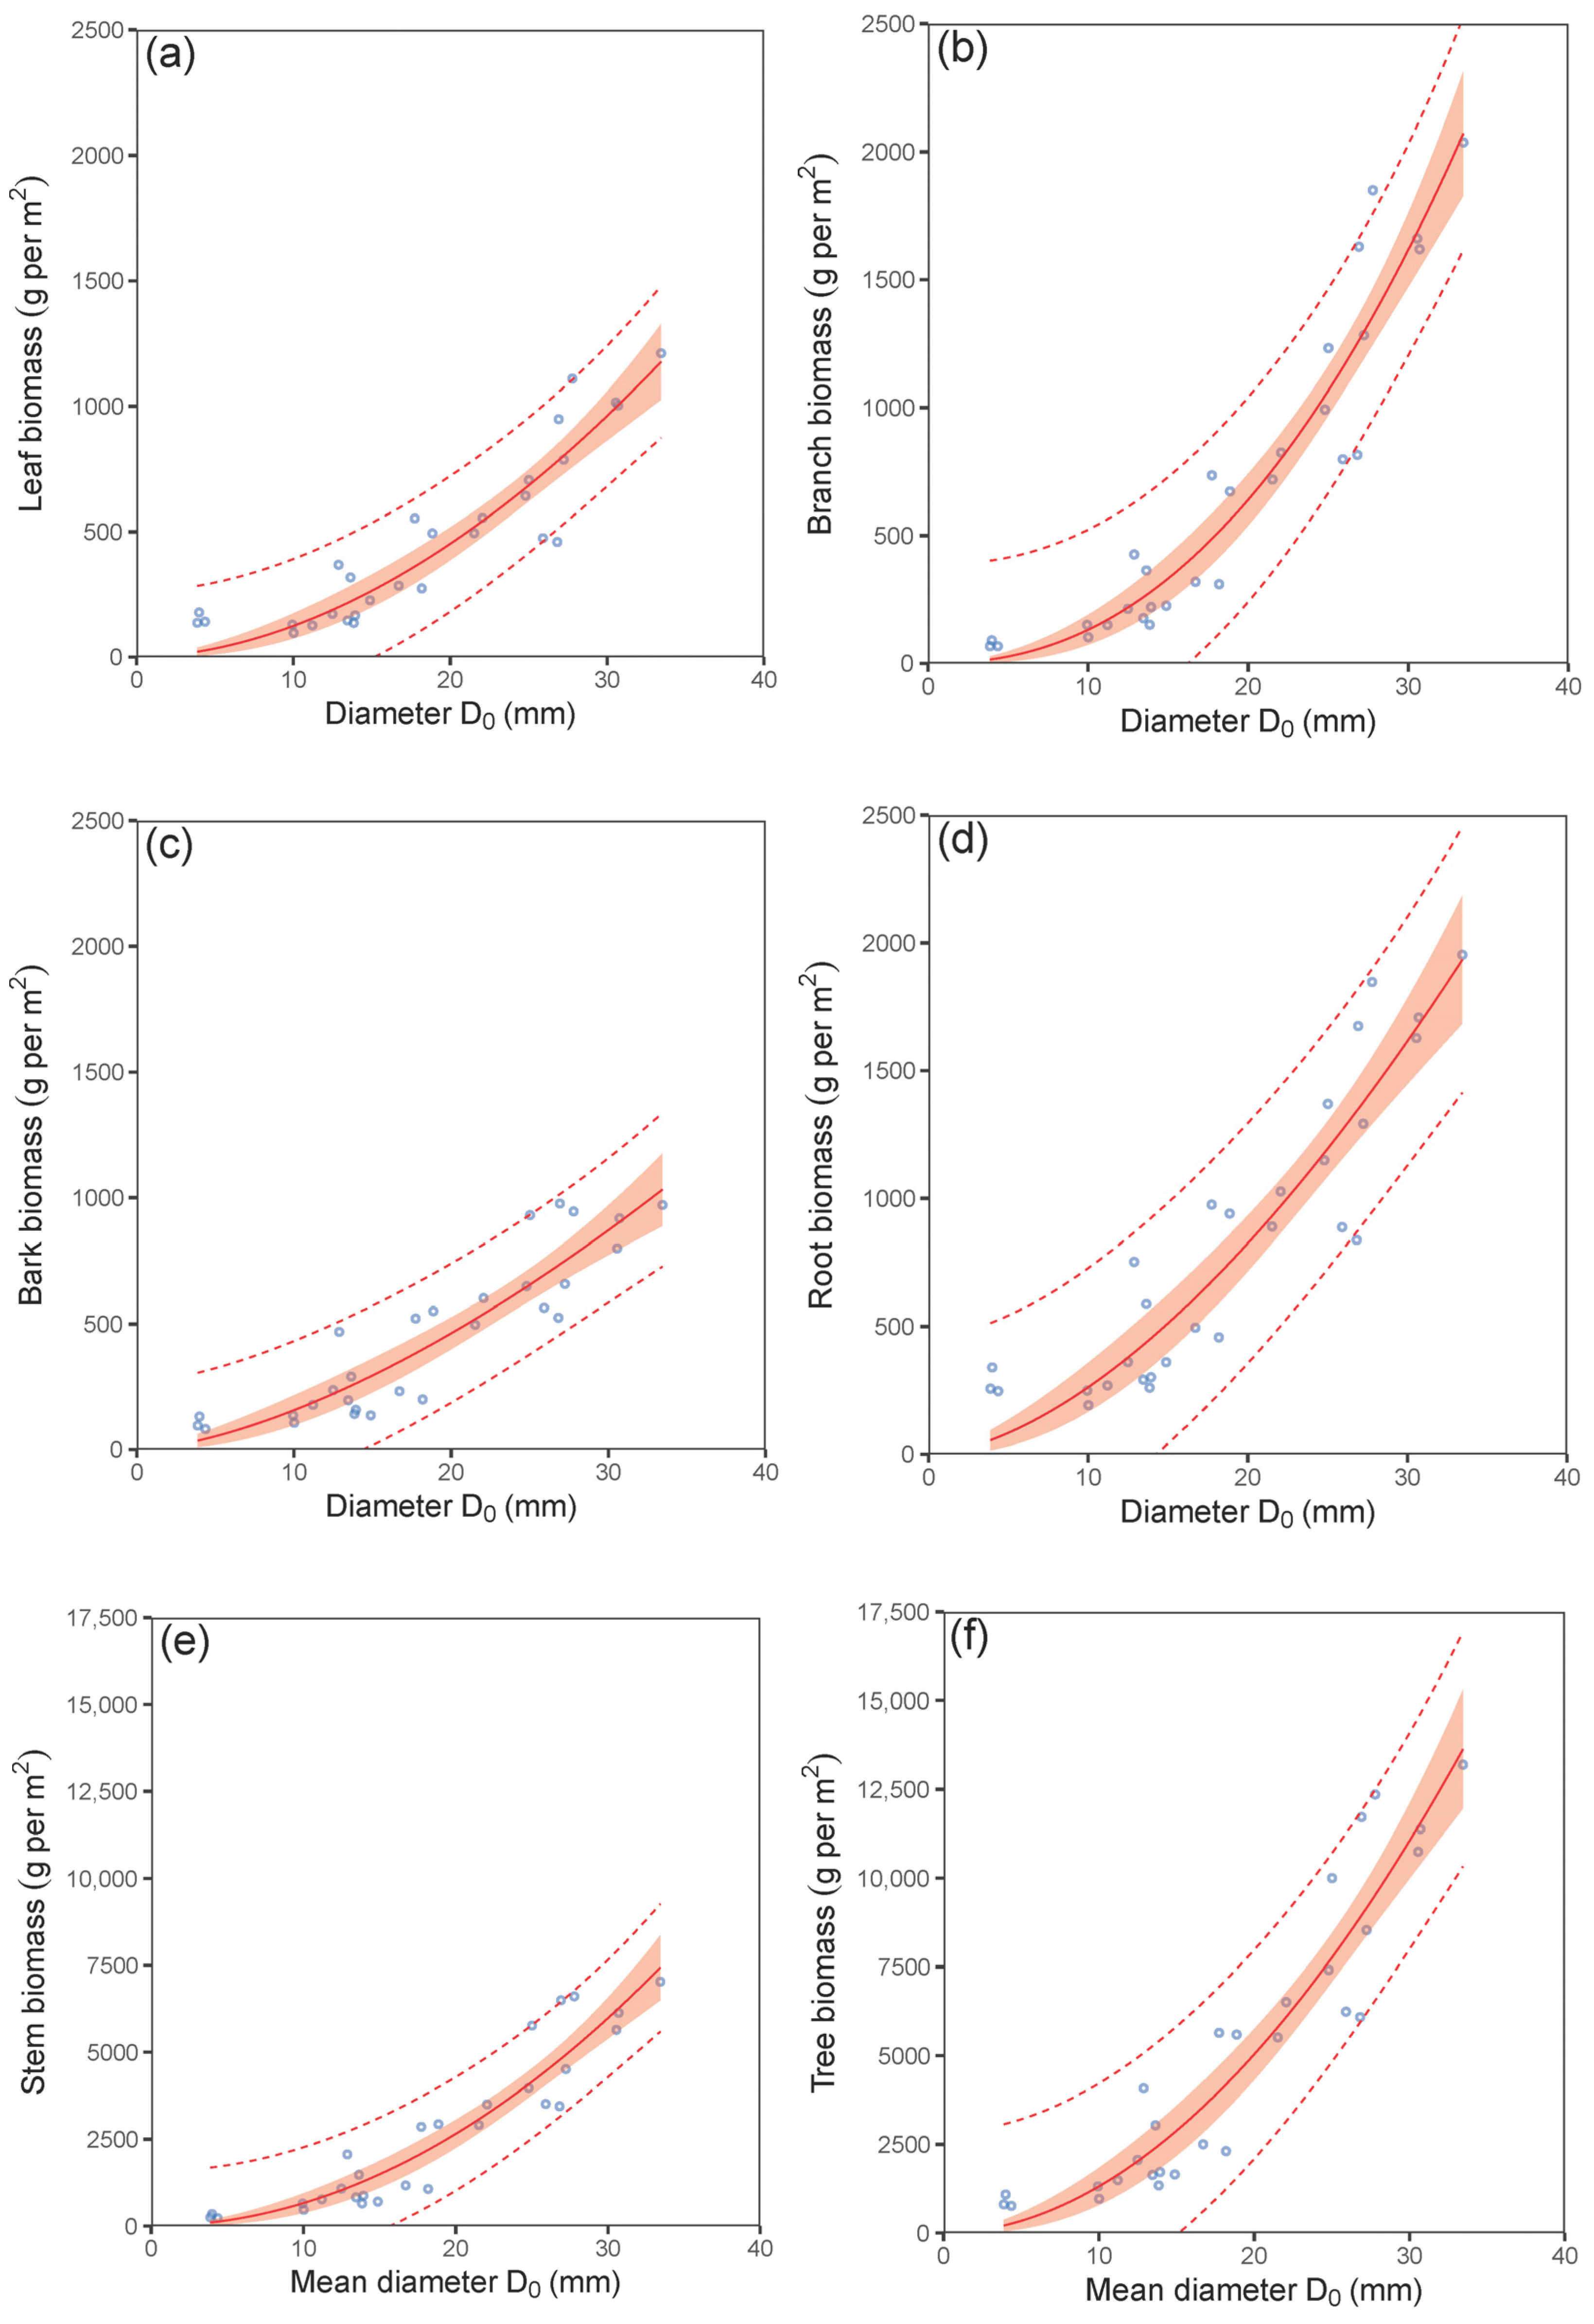
| leaf biomass vs. mean D0 | (2) | 0.86 | 123.47 | 2.54 | 0.96 | 368 | 372 |
| branch biomass vs. mean D0 | (2) | 0.91 | 181.88 | 0.57 | 0.98 | 390 | 394 |
| bark biomass vs. mean D0 | (2) | 0.83 | 126.52 | 0.62 | 0.95 | 369 | 373 |
| root biomass vs. mean D0 | (2) | 0.85 | 214.82 | 2.03 | 0.96 | 400 | 404 |
| stem biomass vs. mean D0 | (2) | 0.89 | 744.81 | −0.20 | 0.97 | 472 | 476 |
| total biomass vs. mean D0 | (2) | 0.89 | 1342.86 | 0.69 | 0.97 | 506 | 510 |
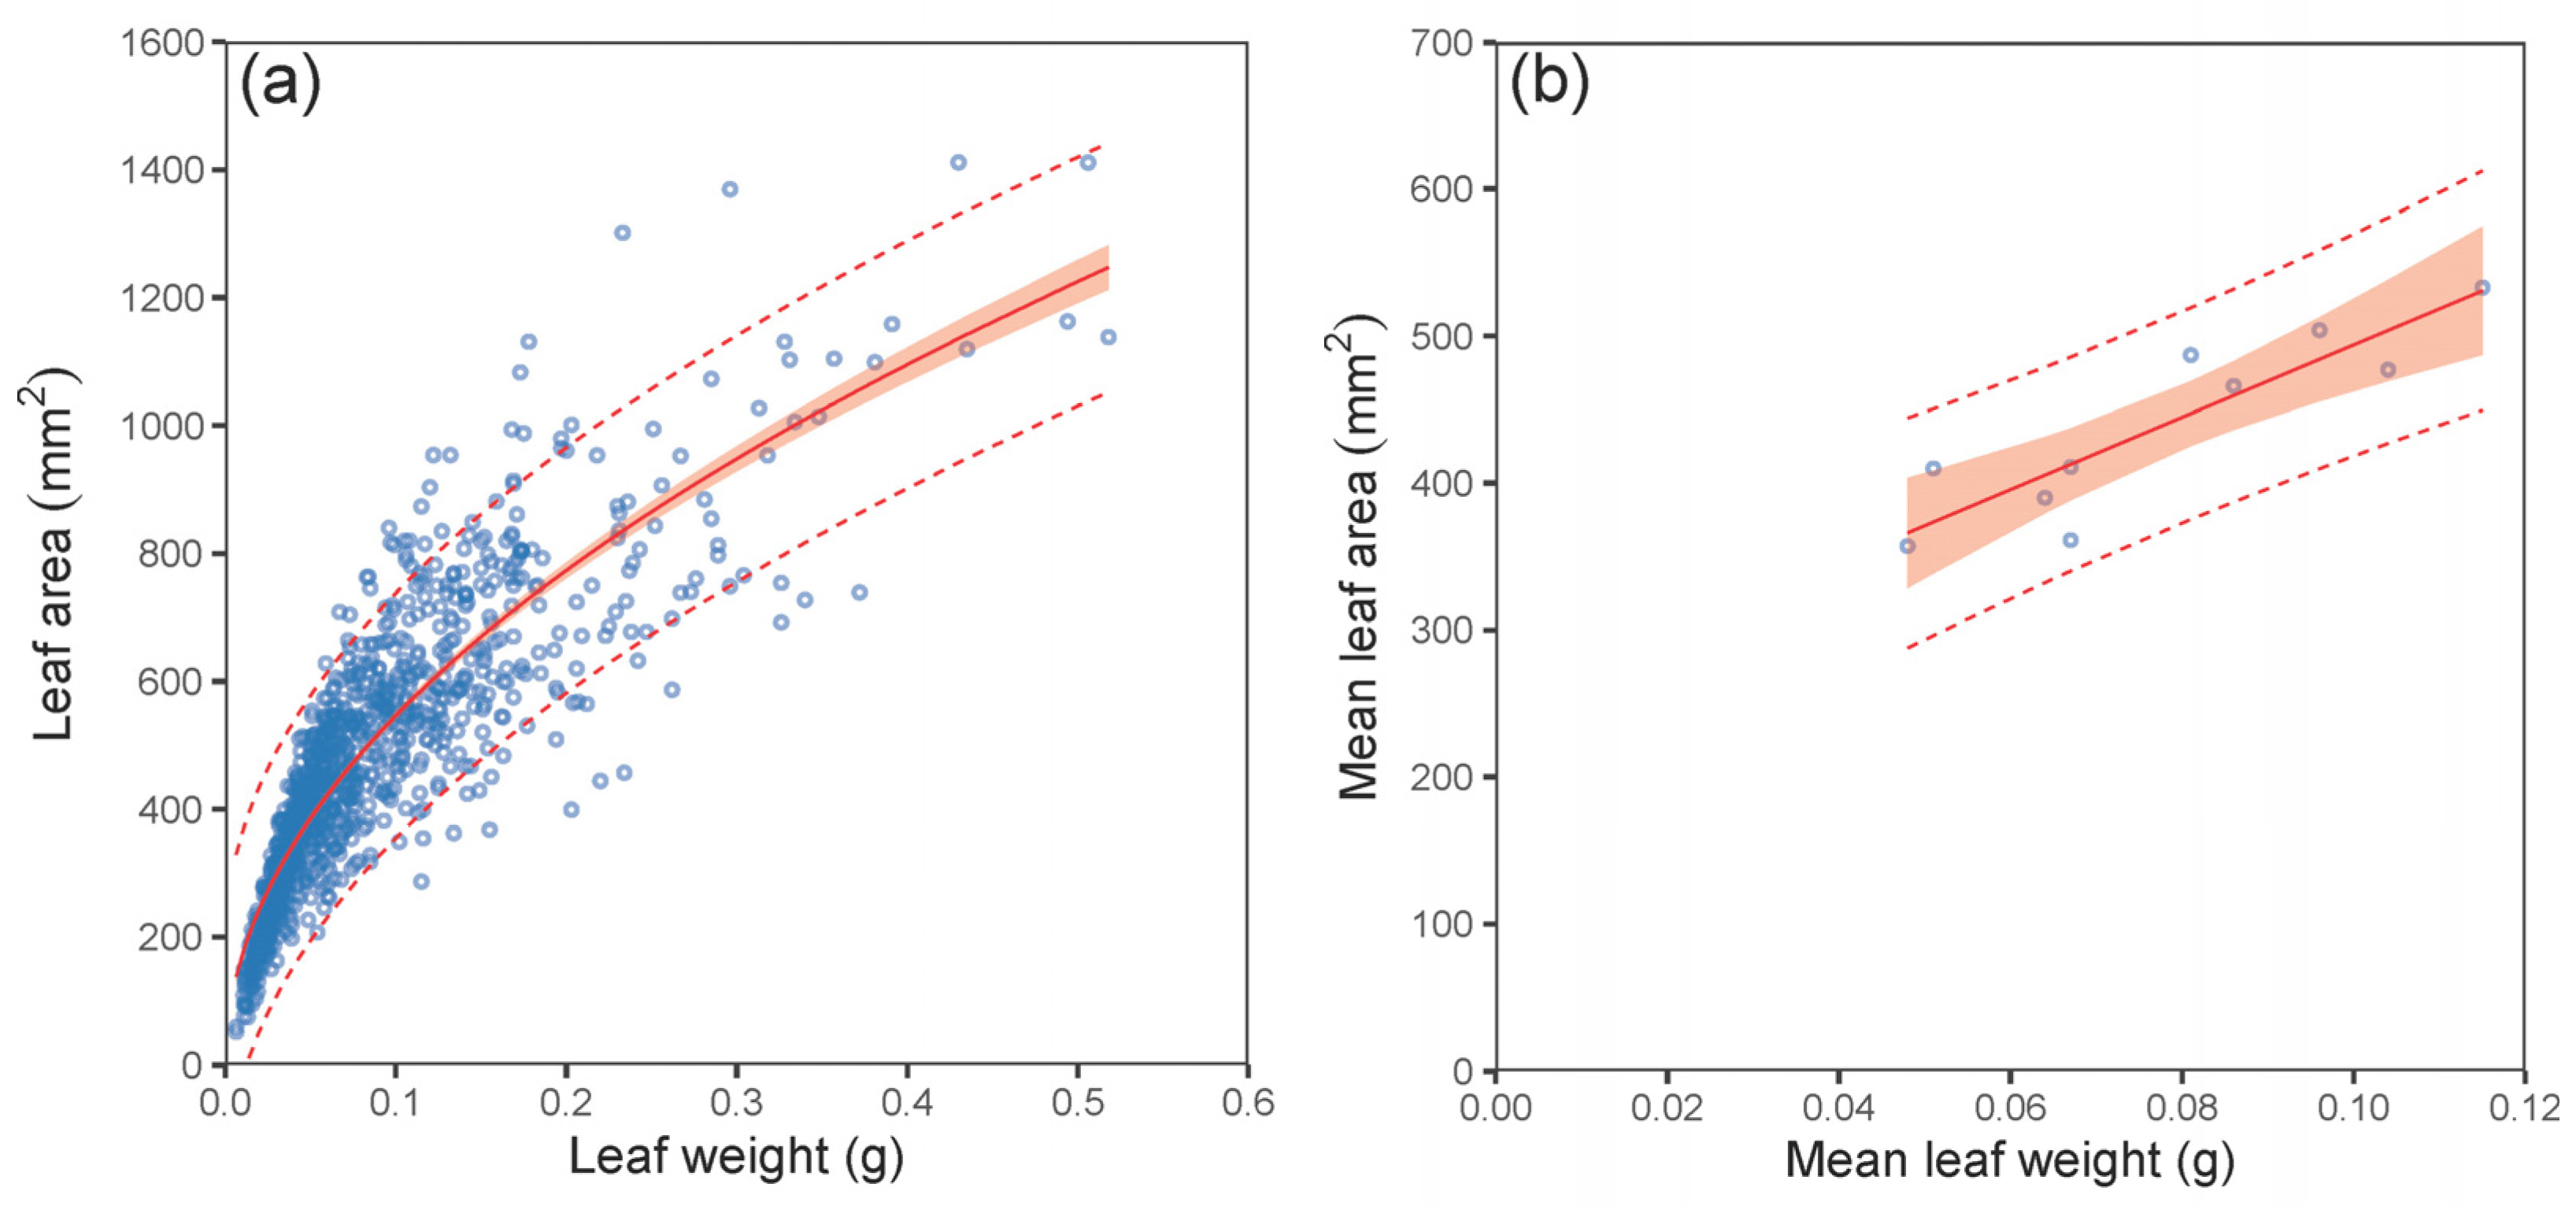
| LA vs. LW—leaf level | (3) | 0.78 | 97.57 | −0.48 | 0.93 | 13,181 | 13,196 |
| LA vs. LW—stand level | (4) | 0.79 | 26.62 | −1.97 × 10⁻¹⁶ | 0.94 | 100 | 101 |
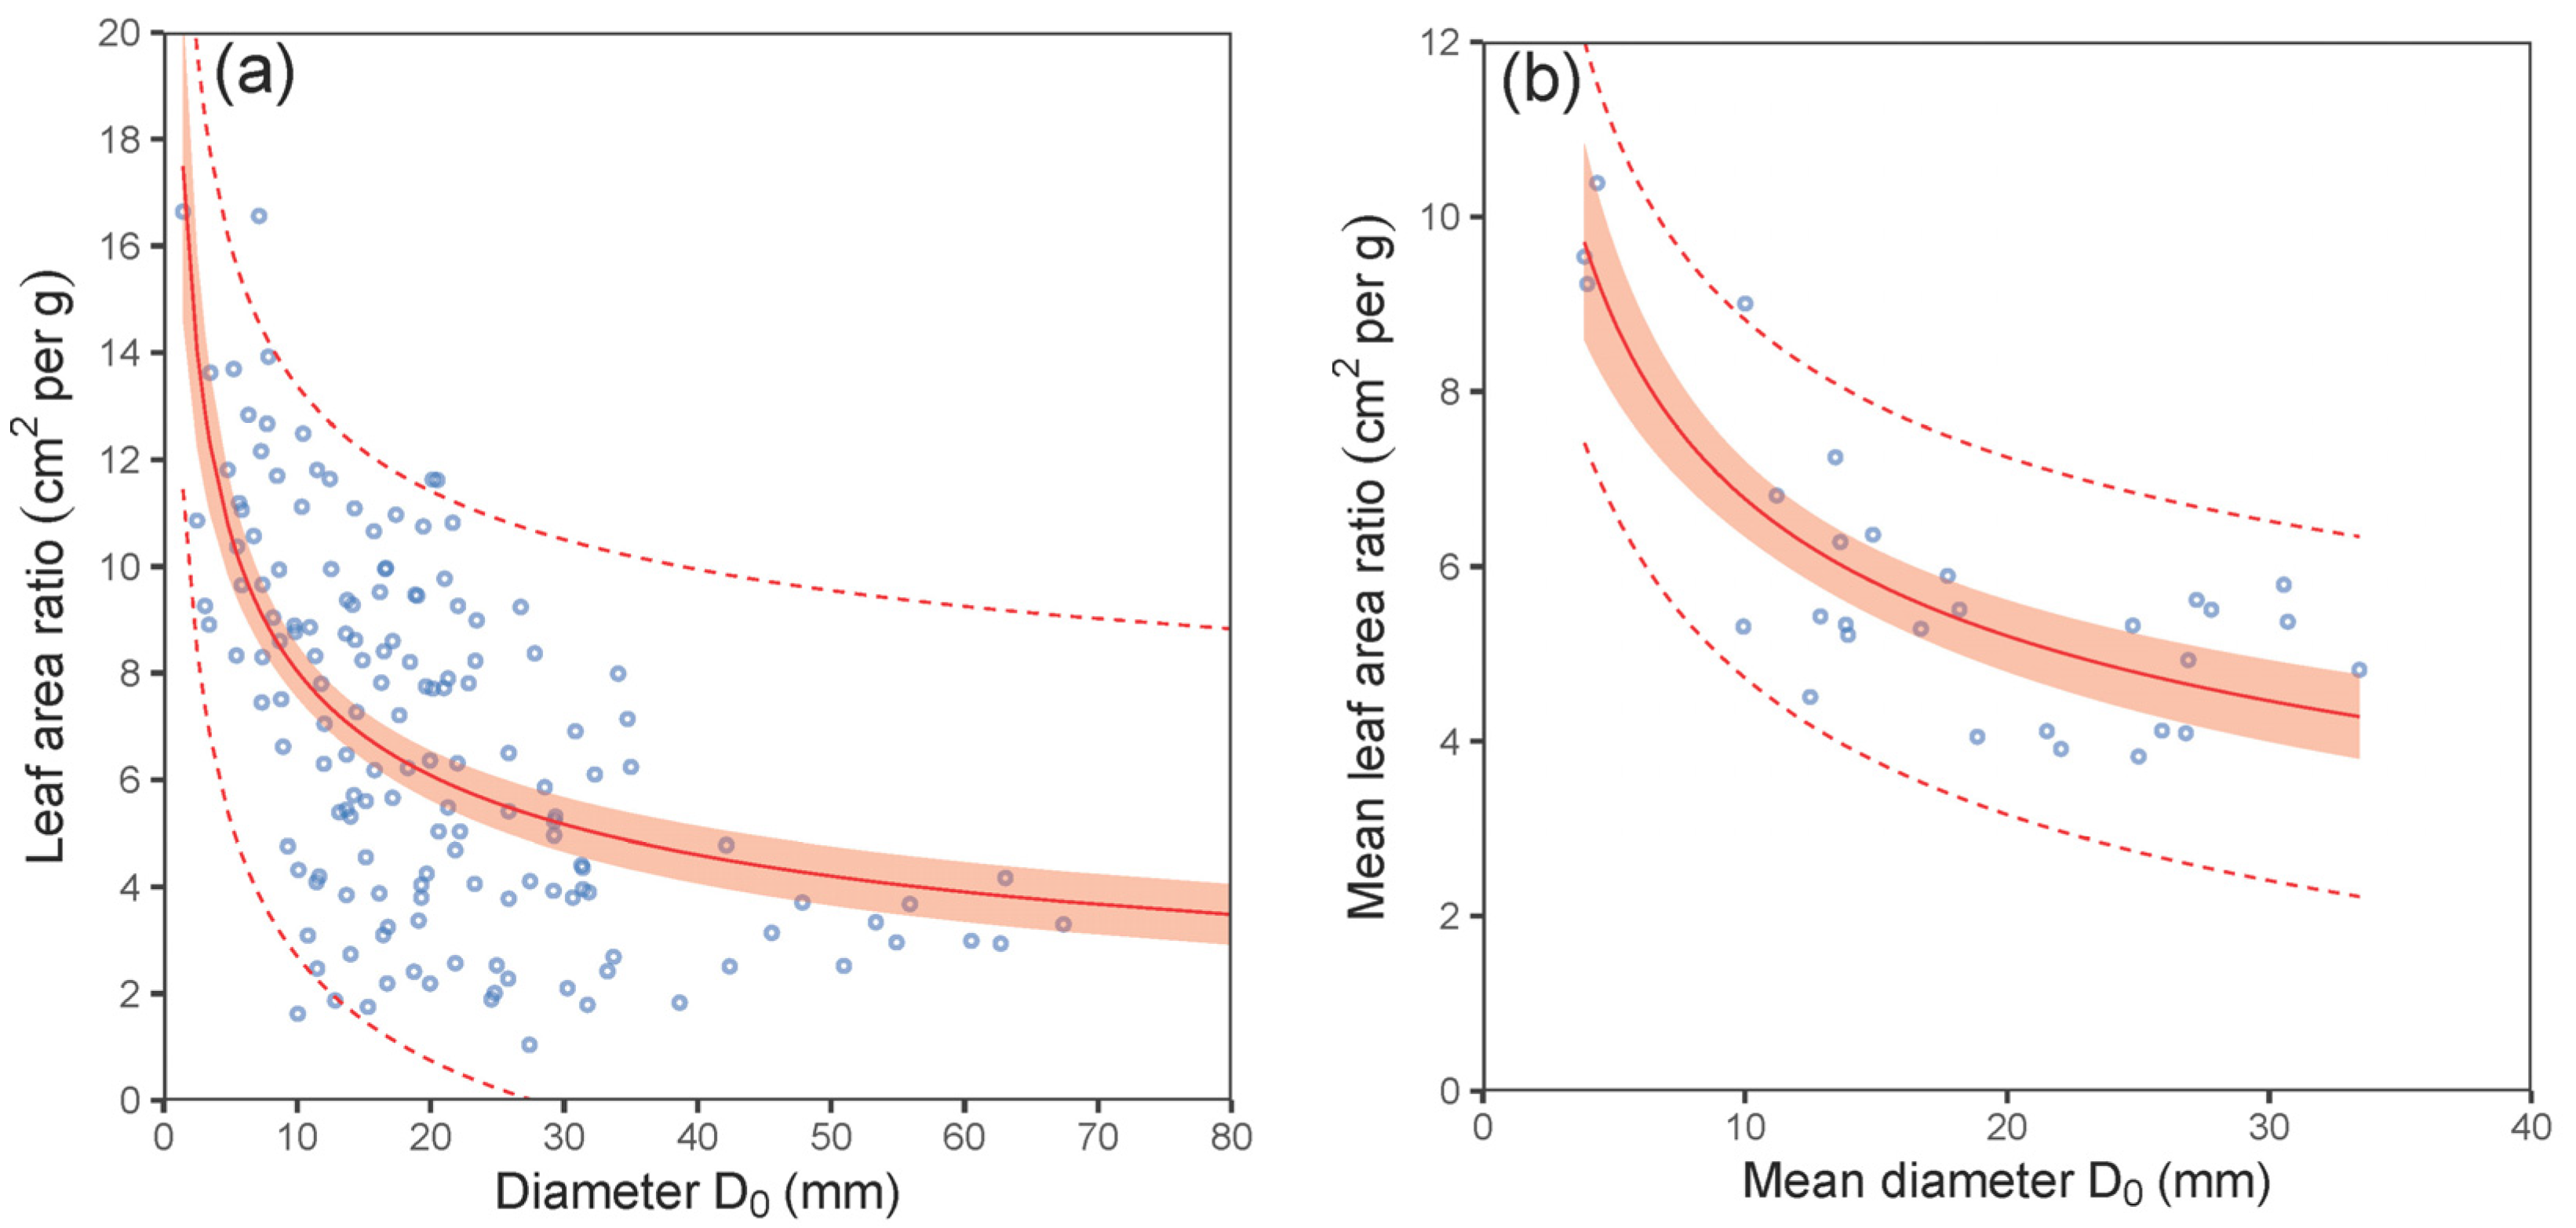
| LAR vs. D0—tree level | (5) | 0.39 | 2.67 | −0.35 | 0.73 | 751 | 760 |
| LAR vs. D0—plot level | (5) | 0.70 | 0.94 | 0.10 | 0.91 | 85 | 89 |
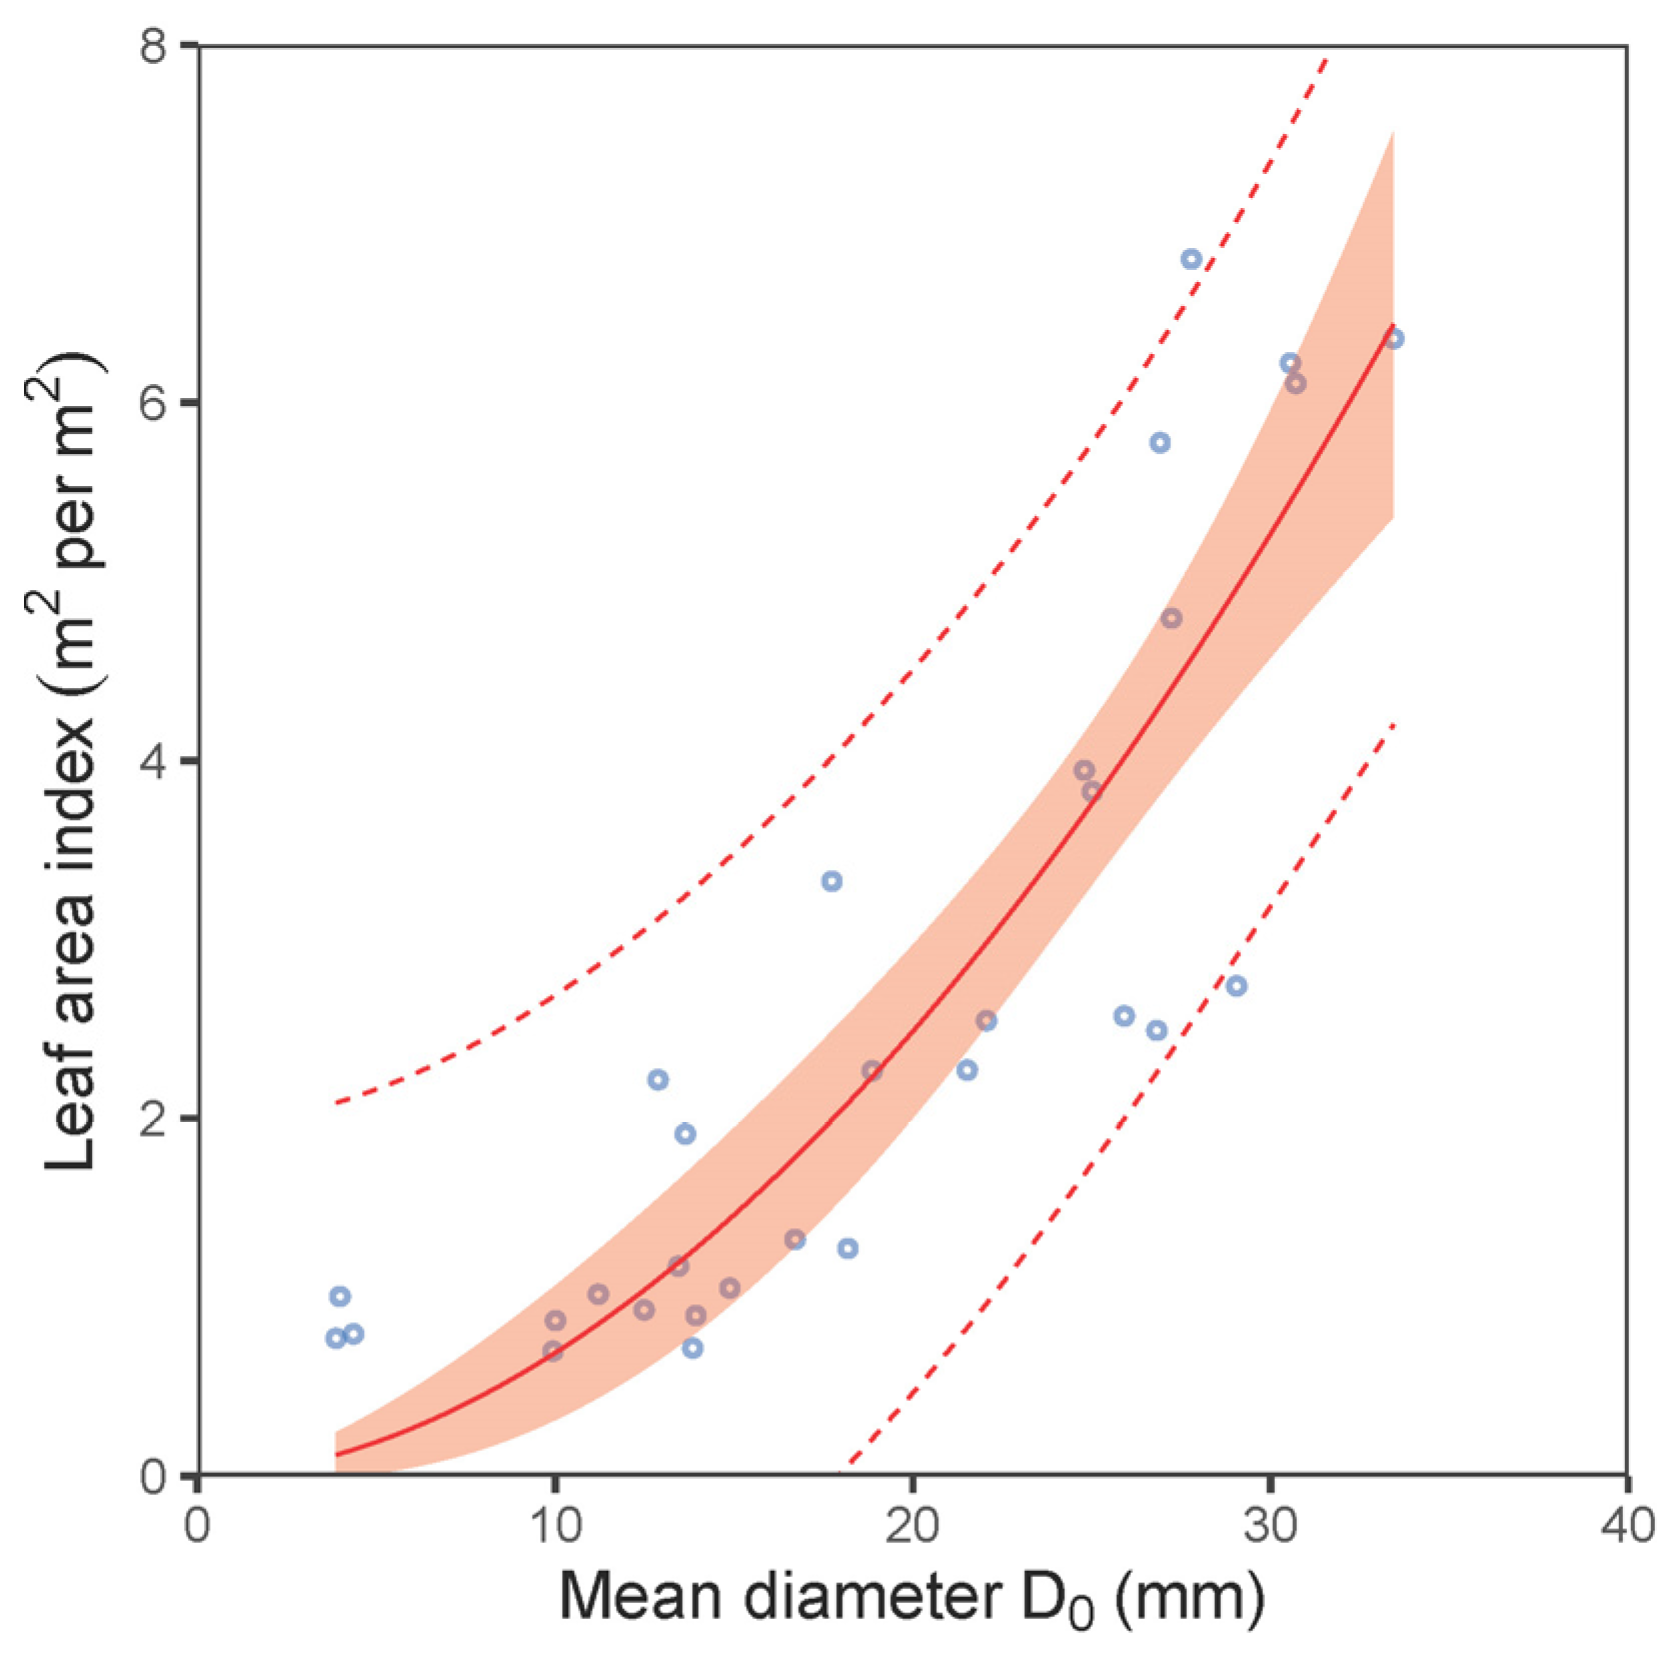
| LAI vs. D0—plot level | (6) | 0.77 | 0.93 | 2.84 | 0.94 | 87 | 91 |
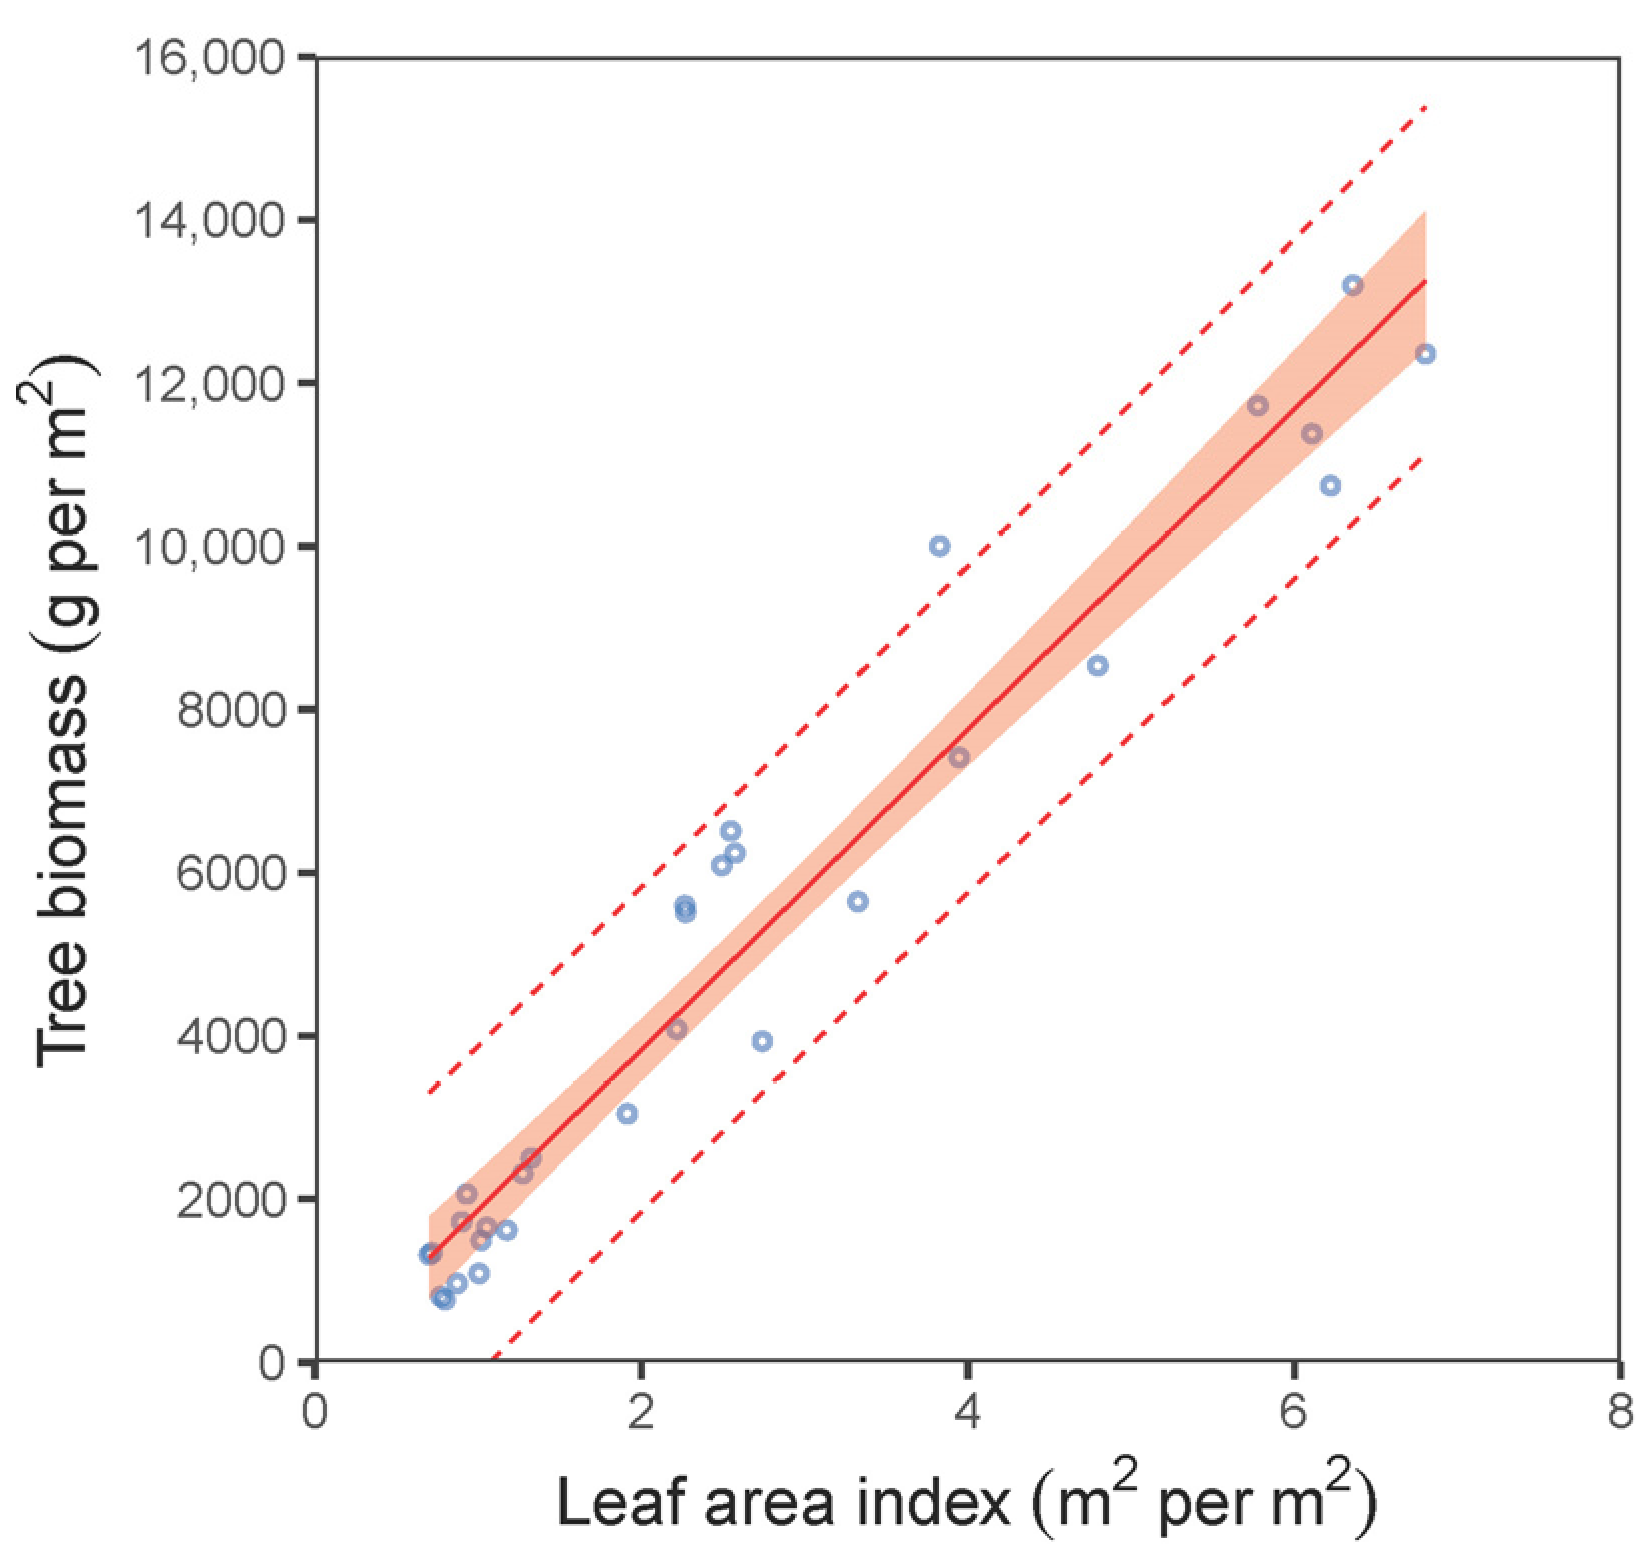
| total biomass vs. LAI—plot level | (7) | 0.94 | 921.62 | −6.03 × 10⁻¹⁶ | 0.99 | 501 | 505 |
References
- San-Miguel-Ayanz, J.; de Rigo, D.; Caudullo, G.; Durrant, T.H. European Atlas of Forest Tree Species; Publication Office of European Union: Luxembourg, 2016; p. 200. [Google Scholar]
- Pagan, J. Lesnícka Dendrológia; Technical University: Zvolen, Slovakia, 1999; 378p. (In Slovak) [Google Scholar]
- Pagan, J.; Randuška, D. Atlas Drevín. 1—Pôvodné Dreviny; Obzor: Bratislava, Slovakia, 1987; p. 360. (In Slovak) [Google Scholar]
- Šebeň, V. Národná Inventarizácia a Monitoring Lesov Slovenskej Republiky 2015–2016; Lesnícke štúdie 65; Národné Lesnícke Centrum, Slovakia: Zvolen, Slovakia, 2017; p. 256. (In Slovak) [Google Scholar]
- Vollmuth, D. The changing perception of coppice with standards in German forestry literature up to the present day—From a universal solution to a defamed and overcome evil—and back? Trees For. People 2022, 10, 100338. [Google Scholar] [CrossRef]
- Pincheva, O.; Sedliačik, J.; Horbachova, O.; Spirochkin, A.; Rohovskyi, I. Prosperities of hornbeam (Carpinus betulus) wood thermally treated under different conditions. Acta Fac. Xylogiae 2019, 61, 25–39. [Google Scholar]
- Augusto, L.; Ranger, J.; Binkley, D.; Rothe, A. Impact of several common tree species of European temperate forests on soil fertility. Ann. For. Sci. 2002, 59, 233–253. [Google Scholar] [CrossRef]
- Koojiman, A.M.; Cameraat, E. Biological control of beech and hornbeam affects species richness via changes in the organic layer, pH and soil moisture characteristics. Funct. Ecol. 2010, 24, 469–477. [Google Scholar] [CrossRef]
- Istrefi, E.; Toromani, E.; Collaku, N.; Thaci, B. Allometric biomass equations for young trees of four broadleaved species in Albania. New Zeal J. For. Sci. 2019, 49, 8. [Google Scholar] [CrossRef]
- André, F.; Ponette, Q. Comparison of biomass and nutrient content between oak (Quecus petraea) and hornbeam (Carpinus betulus) trees in a coppice-with-standards stand in Chimay (Belgium). Ann. For. Sci. 2003, 60, 489–502. [Google Scholar] [CrossRef]
- Suchomel, C.; Pyttel, P.; Becker, G.; Bauhus, J. Biomass equations for sessile oak (Quercus petraea (Matt.) Liebl.) and hornbeam (Carpinus betulus L.) in aged coppiced forests in southwest Germany. Biomass Bioenerg. 2012, 46, 722–730. [Google Scholar] [CrossRef]
- Vahedi, A.A.; Mataji, A.; Babayi-Kafaki, S.; Eshaghi-Rad, J.; Hodjati, S.M.; Djomo, A. Allometric equations for predicting aboveground biomass of beech-hornbeam stands in the Hyrcania forests of Iran. J. For. Sci. 2014, 6, 236–247. [Google Scholar] [CrossRef]
- Kahyani, S.; Sohrabi, H.; Hosseini, S.M.; Vanclay, J. LAI and leaf biomass allometric equations for three common tree species in a Hyrcanian temperate forest. Open J. For. 2016, 6, 65409. [Google Scholar] [CrossRef]
- Akburak, S.; Makineci, E. Thinning effects on biomass and element concentrations of roots in adjacent hornbeam and oak stands in Istanbul, Turkey. For. Ecosyst. 2021, 8, 1. [Google Scholar] [CrossRef]
- Annighöfer, P.; Ameztegui, A.; Ammer, C.; Balandier, P.; Bartsch, N.; Bolte, A.; Coll, L.; Collet, C.; Ewald, J.; Frischbier, N.; et al. Species-specific and generic biomass equations for seedlings and saplings of European tree species. Eur. J. For. Res. 2016, 135, 313–329. [Google Scholar] [CrossRef]
- Pajtík, J.; Konôpka, B.; Šebeň, B. Mathematical Biomass Models for Young Individuals of Forest Tree Species in the Region of the Western Carpathians; National Forest Centre: Zvolen, Slovakia, 2018; p. 89. [Google Scholar]
- Kozlowski, T.T.; Pallardy, S.G. Physiology of Woody Plants, 2nd ed.; Academic Press, Inc.: London, UK, 1997; p. 411. [Google Scholar]
- Pickup, M.; Westoby, M.; Basden, A. Dry mass costs of deploying leaf area in relation to leaf size. Funct. Ecol. 2005, 19, 88–97. [Google Scholar] [CrossRef]
- Shipley, B. Net assimilation rate, specific leaf area and leaf mass ratio: Which is most closely correlated with relative growth rate? A meta-analysis. Funct. Ecol. 2006, 20, 565–574. [Google Scholar] [CrossRef]
- Milla, R.; Reich, P.B.; Niinemets, U.; Castro-Diez, P. Environmental and developmental controls on specific leaf area are little modified by leaf allometry. Funct. Ecol. 2008, 22, 565–576. [Google Scholar] [CrossRef]
- Long, W.; Zang, R.; Schamp, B.S.; Ding, Y. Within- and among-species variation in specific leaf area drive community assembly in a tropical cloud forest. Oecologia 2011, 167, 1103–1113. [Google Scholar] [CrossRef]
- Savoy, P.; MacKay, D.S. Modeling the seasonal dynamics of leaf area index based on environmental constraints to canopy development. Agric. For. Meteorol. 2015, 200, 46–56. [Google Scholar] [CrossRef]
- Asaadi, A.; Arora, V.K.; Melton, J.R.; Bartlett, P. An improved parameterization of leaf area index (LAI) seasonality in the Canadian Land Surface Scheme (CLASS) and Canadian Terrestrial Ecosystem Model (CTEM) modelling framework. Biogeosciences 2018, 15, 6885–6907. [Google Scholar] [CrossRef]
- Konôpka, B.; Pajtík, J.; Šebeň, V.; Surový, P.; Merganičová, K. Woody and Foliage Biomass, Foliage Traits and Growth Efficiency in young Trees of Four Broadleaved Tree Species in a Temperate Forest. Plants 2021, 10, 2155. [Google Scholar] [CrossRef]
- Pajtík, J.; Konôpka, B.; Lukac, M. Biomass functions and expansion factors in young Norway spruce (Picea abies [L.] Karst) trees. For. Ecol. Manag. 2008, 256, 1096–1103. [Google Scholar] [CrossRef]
- Konôpka, B.; Pajtík, J.; Moravčík, M.; Lukac, M. Biomass partitioning and growth efficiency in four naturally regenerated forest tree species. Basic Appl. Ecol. 2011, 11, 234–243. [Google Scholar] [CrossRef]
- Easlon, H.M.; Bloom, A.J. Easy Leaf Area: Automated digital image analysis for rapid and accurate measurement of leaf area. Appl. Plant Sci. 2014, 2, 1400033. [Google Scholar] [CrossRef] [PubMed]
- West, P.W. Tree and Forest Measurement; Springer: Berlin/Heidelberg, Germany, 2009; p. 191. [Google Scholar]
- Nash, J.E.; Sutcliffe, J.V. River flow forecasting through conceptual models: Part 1. A discussion of principles. J. Hydrol. 1970, 10, 282–290. [Google Scholar] [CrossRef]
- Gupta, H.V.; Sorooshian, S.; Yapo, P.O. Status of automatic calibration for hydrologic models: Comparison with multilevel expert calibration. J. Hydrol. Eng. 1999, 4, 135–143. [Google Scholar] [CrossRef]
- Willmott, C.J. On the validation of models. Phys. Geogr. 1981, 2, 184–194. [Google Scholar] [CrossRef]
- R Core Team, R. A Language and Environment for Statistical Computing; R Foundation for Statistical Computing: Vienna, Austria, 2022; Available online: https://www.R-project.org/ (accessed on 26 April 2023).
- Wickham, H. ggplot2: Elegant Graphics for Data Analysis; Springer: New York, NY, USA, 2016; ISBN 978-3-319-24277-4. Available online: https://ggplot2.tidyverse.org (accessed on 26 April 2023).
- Poorter, H.; Niklas, K.J.; Reich, P.B.; Oleksyn, J.; Poot, P.; Mommer, L. Biomassallocation to leaves, stems and roots: Meta-analyses of interspecific variation and environmental control. New Phytol. 2012, 193, 30–50. [Google Scholar] [CrossRef]
- Fatichi, S.; Leuzinger, S.; Korner, C. Moving beyond photosynthesis: From carbon source to sink-driven vegetation modeling. New Phytol. 2014, 201, 1086–1095. [Google Scholar] [CrossRef]
- Agathokleous, E.; Belz, R.G.; Kitao, M.; Koike, T.; Calabrese, E.J. Does the root to shoot ratio show a hormetic response to stress? An ecological and environmental perspective. J. For. Res. 2019, 30, 1569–1580. [Google Scholar] [CrossRef]
- Ledo, A.; Paul, K.I.; Burslem, D.F.R.P.; Ewel, J.J.; Barton, C.; Battaglia, M.; Brooksbank, K. Tree size and climatic water deficit control root to shoot ratio in individual trees globally. New Phytol. 2018, 217, 8–11. [Google Scholar] [CrossRef]
- Ohtuska, T.; Shizu, Y.; Nishiwaki, A.; Yashiro, Y.; Koizumi, H. Carbon cycling and net ecosystem production at an early stage of secondary succession in an abandoned coppice forest. J. Plant. Res. 2009, 123, 393–401. [Google Scholar] [CrossRef]
- Zhang, H.; Wang, K.; Xu, X.; Song, T.; Xu, Y.; Zeng, F. Biogeographical patterns of biomass allocation in leaves, stems and roots in China’s forests. Sci. Rep. 2015, 5, 4994. [Google Scholar] [CrossRef]
- Konôpka, B.; Pajtík, J.; Noguchi, K.; Lukac, M. Replacing Norway spruce with European beech: A comparison of biomass and Net Primary Production patterns in young stands. For. Ecol. Manag. 2013, 302, 185–192. [Google Scholar] [CrossRef]
- Hochbichler, E.; Bellos, P.; Lick, E. Biomass functions for estimating needle and branch biomass of spruce (Picea abies) and Scots pine (Pinus sylvestris) and branch biomass of beech (Fagus sylvatica) and oak (Quercus robur and petrea). Austr. J. For. Sci. 2006, 123, 35–46. [Google Scholar]
- Wang, J.; Zhang, C.; Xia, F.; Zhao, X.; Wu, L.; von Gadow, K. Biomass Structure and Allometry of Abies nephrolepis (Maxim) in Northeast China. Silva Fenn. 2011, 45, 211–226. [Google Scholar] [CrossRef]
- Abebe, M.A.; Roshanak, D.; Andrew, K.S. Retrieval of Specific Leaf Area from Landsat-8 Surface Reflectance Data Using Statistical and Physical Models. IEEE J. 2017, 10, 3529–3536. [Google Scholar]
- Pierce, L.L.; Running, S.W.; Walker, J. Regional-scale relationships of leaf area index to specific leaf area and leaf nitrogen-content. Ecol. Appl. 1994, 4, 313–321. [Google Scholar] [CrossRef]
- Burkes, E.C.; Will, R.E.; Barron-Gafford, G.A.; Teskey, R.O.; Shiver, B. Biomass partitioning and growth efficiency of intensively managed Pinus taeda and Pinus elliottii stands of different planting densities. For. Sci. 2003, 49, 224–234. [Google Scholar]
- Fender, A.-C.; Mentilla-Contreras, J.; Leuschner, C. Multiple environmental control of leaf area and its significance for productivity in beech saplings. Trees 2011, 25, 847–857. [Google Scholar] [CrossRef]
- Konôpka, B.; Pajtík, J.; Šebeň, V.; Surový, P.; Merganičová, K. Biomass Allocation into Woody Parts in Young Common Aspen (Populus tremula L.)—Trees and a Stand-Level Study in the Western Carpathians. Forests 2020, 11, 464. [Google Scholar] [CrossRef]
- Viña, A.; Gitelson, A.A.; Nguy-Robertson, A.L.; Peng, Y. Comparison of different vegetation indices for the remote assessment ofgreen leaf area index of crops. Remote Sens. Environ. 2011, 115, 3468–3478. [Google Scholar] [CrossRef]
- Boussetta, S.; Balsamo, G.; Beljaars, A.; Kral, T.; Jarlan, L. Impact of a satellite-derived leaf area index monthly climatology in a global numerical weather prediction model. Int. J. Remote Sens. 2013, 34, 3520–3542. [Google Scholar] [CrossRef]
- Alton, P.B. The sensitivity of models of gross primary productivity to meteorological and leaf area forcing: A comparison between aPenman-Monteith ecophysiological approach and the MODIS Light-Use Efficiency algorithm. Agric. For. Meteorol. 2016, 218, 11–24. [Google Scholar] [CrossRef]
- GCOS. Systematic observation requirements for satellite-based products for climate, 2011 Update, Supplemental Details to the Satellite-Based Component of the Implementation Plan for the Global Observing System for Climate in Support of the UNFCCC (2010 Update). Available online: http://www.wmo.int/pages/prog/gcos/Publications/gcos-154.pdf (accessed on 26 April 2023).
- Fang, H.; Baret, F.; Plummer, S.; Schaepman-Strub, G. An Overview of Global Leaf Area Index (LAI): Methods, Products, Validation, and Applications. Rev. Geophys. 2019, 57, 739–799. [Google Scholar] [CrossRef]
- Gülcin, D.; Arslan, E.S.; Örücü, Ö.K. Effects of climate change on the ecological niche of common hornbeam (Carpinus betulus L.). Ecol. Inform. 2021, 66, 101478. [Google Scholar] [CrossRef]
- Román-Palcios, C.; Wiens, J.J. Recent responses to climate change reveal the drivers of species extinction and survival. Biol. Sci. 2020, 117, 4211–4217. [Google Scholar] [CrossRef] [PubMed]


| Site Code | Site Name | Altitude | N Latitude | E Longitude | Aspect | Soil | Bedrock |
|---|---|---|---|---|---|---|---|
| (m a.s.l.) | (°) | (°) | |||||
| 1 | Píla | 313 | 48.3941 | 17.2944 | S | Typical paternia | Alluvium |
| 2 | Rudica | 475 | 48.5935 | 18.5497 | W | Mesotropic cambisols | Andesites |
| 3 | Antol | 516 | 48.3955 | 18.9564 | W | Ilimerised soil | Clay loess |
| 4 | Dol. Breziny | 387 | 48.5274 | 19.0820 | N | Mesotropic cambisoils | Andesitic tuff |
| 5 | Šariny | 432 | 48.5271 | 19.0816 | NE | Mesotropic cambisoils | Andesites |
| 6 | Hor. Breziny | 451 | 48.5361 | 19.0796 | E | Mesotropic cambisoils | Andesites |
| 7 | Cerovo | 560 | 48.2475 | 19.2295 | SW | Mesotropic cambisoils | Andesitic tuff |
| 8 | Soroška | 567 | 48.6109 | 20.6057 | NW | Moder rendzinas | Limestones |
| 9 | Budimír | 295 | 48.7938 | 21.2916 | SW | Ilimerised soil | Clay loess |
| 10 | Zubné | 350 | 49.0459 | 22.0874 | N | Ilimerised soil | Sandstones |
| Related Variables | Equation | b0 | S.E. | p | b1 | S.E. | p | b2 | S.E. | p |
|---|---|---|---|---|---|---|---|---|---|---|
| H vs. D0—tree level | (1) | 20.763 | 2.275 | <0.001 | 2.582 | 0.222 | <0.001 | 0.108 | 0.005 | <0.001 |
| Mean H vs. mean D0—plot level | (1) | 38.664 | 25.162 | 0.136 | 2.638 | 2.597 | 0.319 | 0.084 | 0.062 | 0.187 |
| Related Variables | (Equation) | b0 | S.E. | p | b1 | S.E. | p |
|---|---|---|---|---|---|---|---|
| leaf biomass vs. mean D0 | (2) | 1.716 | 1.099 | 0.130 | 1.861 | 0.195 | <0.001 |
| branch biomass vs. mean D0 | (2) | 0.688 | 0.478 | 0.161 | 2.282 | 0.209 | <0.001 |
| bark biomass vs. mean D0 | (2) | 4.318 | 2.630 | 0.112 | 1.560 | 0.187 | <0.001 |
| root biomass vs. mean D0 | (2) | 5.768 | 3.409 | 0.102 | 1.657 | 0.181 | <0.001 |
| stem biomass vs. mean D0 | (2) | 6.604 | 4.424 | 0.147 | 2.002 | 0.203 | <0.001 |
| total biomass vs. mean D0 | (2) | 15.254 | 9.636 | 0.125 | 1.936 | 0.192 | <0.001 |
| Site Code | Site Name | Leaf Area | Leaf Weight | SLA |
|---|---|---|---|---|
| (cm2) | (g) | (cm2 per g) | ||
| 1 | Píla | 5.04 (2.34) | 0.096 (0.072) | 52.5 (23.4) |
| 2 | Rudica | 4.10 (1.82) | 0.051 (0.032) | 80.4 (32.2) |
| 3 | Antol | 3.90 (2.27) | 0.064 (0.037) | 60.9 (27.0) |
| 4 | Dol. Breziny | 3.57 (1.17) | 0.048 (0.029) | 56.3 (21.8) |
| 5 | Šariny | 4.66 (1.99) | 0.086 (0.041) | 54.2 (24.3) |
| 6 | Hor. Breziny | 3.61 (1.63) | 0.067 (0.053) | 53.9 (22.8) |
| 7 | Cerovo | 4.87 (1.25) | 0.081 (0.053) | 60.1 (26.5) |
| 8 | Soroška | 5.33 (2.04) | 0.115 (0.072) | 46.4 (19.7) |
| 9 | Budimír | 4.11 (1.89) | 0.067 (0.051) | 61.3 (31.5) |
| 10 | Zubné | 4.77 (2.40) | 0.104 (0.081) | 45.9 (23.6) |
| Related Variables | (Equation) | b0 | S.E. | p | b1 | S.E. | p |
|---|---|---|---|---|---|---|---|
| LA vs. LW—leaf level | (3) | 1734.740 | 33.090 | <0.001 | 0.502 | 0.008 | <0.001 |
| LA vs. LW—stand level * | (4) | 247.971 | 35.780 | <0.001 | 2459.935 | 443.150 | <0.001 |
| LAR vs. D0—tree level | (5) | 20.315 | 1.963 | <0.001 | −0.403 | 0.038 | <0.001 |
| LAR vs. D0—plot level | (5) | 16.241 | 1.787 | <0.001 | −0.380 | 0.043 | <0.001 |
| LAI vs. D0—plot level | (6) | 0.010 | 0.008 | 0.259 | 1.851 | 0.263 | <0.001 |
| BTotal vs. LAI—plot level * | (7) | −91.126 | 293.560 | 0.759 | 1961.813 | 90.080 | <0.001 |
Disclaimer/Publisher’s Note: The statements, opinions and data contained in all publications are solely those of the individual author(s) and contributor(s) and not of MDPI and/or the editor(s). MDPI and/or the editor(s) disclaim responsibility for any injury to people or property resulting from any ideas, methods, instructions or products referred to in the content. |
© 2023 by the authors. Licensee MDPI, Basel, Switzerland. This article is an open access article distributed under the terms and conditions of the Creative Commons Attribution (CC BY) license (https://creativecommons.org/licenses/by/4.0/).
Share and Cite
Konôpka, B.; Murgaš, V.; Šebeň, V.; Pajtík, J.; Merganičová, K. Stand-Level Biomass and Leaf Trait Models for Young Naturally Regenerated Forests of European Hornbeam. Forests 2023, 14, 1084. https://doi.org/10.3390/f14061084
Konôpka B, Murgaš V, Šebeň V, Pajtík J, Merganičová K. Stand-Level Biomass and Leaf Trait Models for Young Naturally Regenerated Forests of European Hornbeam. Forests. 2023; 14(6):1084. https://doi.org/10.3390/f14061084
Chicago/Turabian StyleKonôpka, Bohdan, Vlastimil Murgaš, Vladimír Šebeň, Jozef Pajtík, and Katarína Merganičová. 2023. "Stand-Level Biomass and Leaf Trait Models for Young Naturally Regenerated Forests of European Hornbeam" Forests 14, no. 6: 1084. https://doi.org/10.3390/f14061084
APA StyleKonôpka, B., Murgaš, V., Šebeň, V., Pajtík, J., & Merganičová, K. (2023). Stand-Level Biomass and Leaf Trait Models for Young Naturally Regenerated Forests of European Hornbeam. Forests, 14(6), 1084. https://doi.org/10.3390/f14061084