Article

NPP and Carbon Emissions under Forest Fire Disturbance in Southwest and Northeast China from 2001 to 2020

1
Co-Innovation Center for Sustainable Forest in Southern China, Nanjing Forestry University, Nanjing 210037, China
2
College of Biology and the Environment, Nanjing Forestry University, Nanjing 210037, China
*
Author to whom correspondence should be addressed.
Forests 2023, 14(5), 999; https://doi.org/10.3390/f14050999
Submission received: 30 March 2023 / Revised: 26 April 2023 / Accepted: 8 May 2023 / Published: 12 May 2023
(This article belongs to the Section Natural Hazards and Risk Management)

Abstract

:
With climate change, frequent forest fires and prolonged fire period occur all over the world. Moreover, carbon emission from forest fire affects the carbon cycle of the forest ecosystem. However, this effect varies by region with no uniform conclusions, and fewer comparative studies exist on such differences between regions. In this paper, net primary productivity (NPP) data MOD17A3 were used as an important parameter of forest carbon absorption, along with MODIS fire spot data MCD14DL and burned area data MCD64A1. Forest carbon lost under forest fire interference in the northeast and southwest natural forest areas of China was studied to explore the role of forest fire in the carbon cycle process and its differences in the unlike regions of China. Here, by means of kernel density analysis and M-K trend test, the characteristics of forest fires in China’s southwest and northeast forests were calculated. Forest carbon emission under forest fire disturbance was quantified by reference to the forest fire emission factor list. We show that (1) the total number of forest fire spots in the southwest region from 2001 to 2020 was 1.06 × 10⁵, 1.28 times that of Northeast China. However, the total burned area in the southwest was only 67.84% of that in the northeast. (2) The total carbon emissions from forest fires in the southwest from 2001 to 2020 was 37,559.94 Gg, 10.77% larger than the northeast forest, CH4 and CO2 were 13.52% and 11.29% larger respectively. Moreover, the carbon emissions of forest fire in the northeast showed a downward trend, R2 = 0.16 (p < 0.1), while it remained basically unchanged in the southwest. The contribution of carbon emissions from forest fires changed with forest types, it was shown as: evergreen needleleaf forest (14.98%) > evergreen broadleaf forest (10.81%) > deciduous needleleaf forest (6.52%) > deciduous broadleaf forest (5.22%). (3) From 2001 to 2020, under the premise that the NPP both manifested upward trends, the NPP of the burned areas showed a significant downward trend in the southwest forest, with R2 = 0.42 (p < 0.05), while it increased in the northeast forest, with R2 = 0.37 (p < 0.05). It showed negative correlation between NPP of burned areas and forest fire carbon emissions, and forest fire disturbance had no significant effect on forest NPP in Northeast China, while net carbon loss occurred in Southwest China. In general, under different forest fire characteristics, NPP, which represents forest carbon uptake, and carbon emissions from forest fires show differences. The impact of forest fire disturbance on forest carbon process varies with regions. The study can provide some ideas on the effects of forest fire disturbance on climate change.

1. Introduction

The global forest vegetation carbon stock is about 359.00–373.00 Pg [1], which is the largest carbon pool on land [2,3] and plays an important role in the ecosystem carbon cycle. Currently, the largest disturbance to the carbon cycle in forest ecosystems is forest fire [4]. Approximately 1% of the global forest suffers from fire disturbance each year [5,6], and forest fires can directly cause forest carbon loss [7]. From 2000 to 2019, the global carbon emission from wildfires was about 2 Gt C/year, among which the burned areas in tree-dominated terrestrial vegetation region contributed a lot [8]. For China’s ecosystem, biomass burning emitted about 23.02 Tg C/year (1997–2016) [9], which is higher than the previous average. With climate change, forest fires are characterized by a trend of increased frequency and longer fire seasons [10], and the impact of this on forest ecosystem productivity and carbon cycling processes should not be underestimated. CO2 emissions from boreal forest wildfires hit a record high in 2021, accounting for 23% (0.48 Gt) of global carbon emissions from wildfires, 20 years ago, this proportion was only around 10% [11].
The key to studying carbon emissions from forest fire disturbance is to estimate the carbonaceous gas emissions from biomass burning during fires [12,13,14]. A large number of statistical studies on forest fire carbon emissions have been conducted both nationally and internationally, and the values of forest fire carbon emissions are found to vary from region to region. The total annual average carbon emissions from vegetation burning in northern Alaska forests is about 5.86 × 10⁶ t C/year [15]. With the development of satellite remote sensing technology, it has become possible to estimate the area of forest fire disturbance and calculate carbon loss on a large scale [16,17]. The selection of different emission factors for different forest types is a prerequisite for accurate estimation of carbonaceous gas emissions. It is also related to the burning efficiency of different forest types, and now the burning efficiency of global different vegetation has been roughly obtained [18]. Among the existing research results, forest fire emission factors of evergreen broadleaf forest, evergreen needleleaf forest and other forest types have been widely adopted [16,19].
Net primary productivity (NPP) is closely related to forest carbon sequestration, and it is an important indicator of carbon processes in forest ecosystems. Studies have shown that there is a significant positive correlation between vegetation NPP and CO2 fixed by plants through photosynthesis. The dry matter produced by vegetation is about 1.63 times the CO2 fixed by plants through photosynthesis, and the dry matter produced by vegetation within a fixed time period is in turn 2.2 times the NPP. The higher the burning index of forest fires, the smaller the vegetation NPP values [20] and the more significant the forest fire carbon emissions.
Therefore, analysis of the relationship between forest fire disturbance and changes in forest vegetation NPP can be used to quantify forest fire carbon emissions, calculate forest carbon losses, and understand changes in forest ecosystem carbon cycling processes under forest fire disturbance [21]. There have been previous studies on this. Through studies of the changes in forest NPP under forest fire disturbance, forest carbon source/sink transfer has been observed in North America [22] and Canada [23] at different time scales. However, few explorations operate in China. The forests in China are mainly distributed in the northeastern, southwestern, and southeastern regions, among which the southwestern and northeastern forest regions are the two most important natural forest areas [24] and are also forest fire-prone areas [25]. Under the influence of afforestation patterns, forest area at provincial level in southwest and Northeast China has increased by 40,000 to 440,000 ha per year in the past 10 to 15 years, but the carbon sink in these two places has been underestimated due to limitations in research methods [26]. Although some numerical conclusions on forest fire have been obtained through remote sensing information, statistical methods [27,28], or Maxent model [29], relatively mature conclusions have not been drawn on forest fire carbon emission, especially in Southwest China due to the complex geographical and geomorphologic features and highlighted drought problem [30]. Based on the above research status of NPP and forest fire carbon emissions, it is urgent to carry out research on forest carbon cycle under forest fire interference in these two regions. Moreover, due to the different climatic background and forest structure of the two regions, the different performance of forest fire interference on forest carbon cycle is also worth exploring.
In this study, the two major natural forest areas in southwestern and northeastern China were studied. With the help of Moderate-resolution Imaging Spectroradiometer (MODIS) fire spot data MCD14DL, burned area data MCD64A1, NPP data MOD17A3, and land use data MCD12Q1 from 2001 to 2020, together with the list of forest fire combustion emission factors, and using methods such as kernel density analysis, we analyzed the spatiotemporal distribution characteristics of forest fires in southwest and northeast regions from 2001 to 2020 and quantified carbon emissions from forest fire disturbance. By combining the NPP of the two burned forest areas, we also explored the influence of forest fire disturbance on the carbon cycle process of the forest ecosystem and its differential behavior in the natural forest areas of southwestern and northeastern China, which is of positive significance for China to formulate scientific and effective regionalized forest fire management measures and to study the influence of forest fire disturbance on the atmospheric carbon balance.

2. Materials and Methods

2.1. The Study Area

In this study, the southwest and northeast regions (mainly natural forests) of China were used as the study area, as shown in Figure 1. The southwest and northeast regions differ significantly in terms of climatic background and vegetation types. The southwest region is located in Southwest China (97° E–111° E, 21° N–35° N), see Figure 1a,b, and refers to three provinces and one city, which are Yunnan, Guizhou, Sichuan, and Chongqing, but not Tibet. The climate type is complex and diverse, with a gradual transition from a tropical and subtropical monsoon climate in the southeast to a highland mountain climate in the northwest. The terrain is complex and diverse, with plateaus, hills, plains, and basins. The southwest region is dominated by evergreen broadleaf forests, which account for more than 50% of the area of all forest types in the southwest, with an average annual precipitation between 500 mm and 2500 mm and an average annual temperature between −5 °C and 25 °C. The northeast region is located in Northeast China (115° E–136° E, 38° N–54° N), see Figure 1a,c, and includes a total of three provinces, Heilongjiang, Liaoning, and Jilin, with a temperate monsoon climate and a relatively simple landscape, dominated by plains and mountains. The main vegetation types in the northeast region are deciduous broadleaf forests and deciduous needleleaf forests, which account for more than 90% of the area of all forest types in the northeast region. The average annual precipitation ranges from 300 mm to 1300 mm, and the average annual temperature ranges from −5 °C to 15 °C.
According to the Forestry Statistical Yearbook (http://forest.ckcest.cn/, accessed on 22 March 2021), both regions experience a high incidence of natural forest fires in China; 2.26 × 10⁴ forest fires occurred in the SW from 2005 to 2020, with a total forest fire area of 3.19 × 10⁵ ha, and 3.71 × 10³ forest fires occurred in the NE, with a total forest fire area of 7.46 × 10⁵ ha.

2.2. Data and Methods

2.2.1. Forest Fire Data and Its Processing

The fire spot data MCD14DL of MODIS for 2001–2020 were obtained from the National Aeronautics and Space Administration (NASA, http://ladsweb.nasa.gov/) with a spatial resolution of 1 km and contain parameters such as the time of fire point occurrence, latitude, longitude, and confidence. The burned area data MCD64A1, also from this website, refer to the land in the forest herein that has been burned and has not yet grown into new forest, with a spatial resolution of 500 m. Pseudo-fire spots were removed based on the product QA (quality assurance) data sets. Since both fire spot data and burned area data do not distinguish between forest fires and other vegetation wildfires, we superimposed land use data to obtain forest fire data. And the employed same source land use data MCD12Q1 (https://ladsweb.modaps.eosdis.nasa.gov/search/, accessed on 22 October 2021) is an annual-scale product with a spatial resolution of 500 m. For the vegetation types shown in Figure 1, the forest types in the SW are evergreen needleleaf forest, evergreen broadleaf forest, and deciduous broadleaf forest, the types in the NE are deciduous needleleaf forest and deciduous broadleaf forest. Here the mixed forests in Figure 1b,c have been distinguished by the land use data, and scrub and meadow types have been excluded.

2.2.2. NPP Data and Its Processing

The NPP data MOD17A3 for 2001–2020 were obtained from MODIS (https://ladsweb.modaps.eosdis.nasa.gov/search/, accessed on 22 October 2021) provided by NASA with a temporal and spatial resolution of 1 year and 500 m, respectively. The annual NPP value for this product is the 8 days net sum of the photosynthetic product data MOD17A2H for that year. According to the NPP data requirements of MOD17A3, it is necessary to multiply the original data by the scaling factor 0.0001 to obtain the NPP values in Kg C/m2/year. The unit used in this paper is g C/m2/year, so the NPP value still needs to be multiplied by 1000.

2.2.3. Meteorological Data and Elevation Data

ERA5 is the latest fifth-generation atmospheric reanalysis dataset released by the European Center for Medium-Range Weather Forecasts (https://cds.climate.copernicus.eu/, accessed on 1 May 2021) [31]. With a temporal resolution of 1 h and a spatial resolution of 0.25° × 0.25°, it is the most widely used meteorological reanalysis data [32]. In this study, two elements, temperature and precipitation, were selected for the period 2010–2020.
Elevation data were obtained from the SRTM (Shuttle Radar Topography Mission) published by the US National Mapping Service in 2000 (http://www.cgiar-csi.org, accessed on 1 March 2021). The elevations of the SW and NE were classified into ten categories each, and the distribution of the elevation bands was assumed to be unchanged during the study period.

2.2.4. The Amount of Forest Burning Calculation

Forest burning amount was calculated using Equation (1) [6]:
B B = A × D × η
where B B is the total amount of forest burnt (unit: Mg), A is the forest fire burned area (unit: ha), D is the biomass density per unit area (unit: Mg·ha−1), and η is the forest burning efficiency (see Table 1).
The combustion efficiency was chosen to be 25% for all arbor by means of the findings of Michel et al., (2005) for East Asia, See Reference [18] for details.

2.2.5. Calculation of Carbonaceous Gas Emissions from Forest Burning

Based on the base data and emission factors obtained from the review of relevant statistics and literature, the total amount of carbonaceous gas emissions was calculated using Equation (2) [35]:
E i , j = 10 3 × B B j × E F i , j  
where E i , j is the emission of carbonaceous gases of category i (unit: Mg); B B j is the burning volume of the j th forest type (unit: Mg); E F i , j is the emission factor of carbonaceous gases of category i (unit: g·kg−1) after burning of the j th forest type.
The selection of different emission factors for different forest types is an important prerequisite for accurate estimation of the total amount of each type of emission. At present, there are few studies on the emission factors for the burning of different tree species in China, so the emission factors of the same forest types and tree species abroad and in China were chosen as the basis of calculation in this study according to the actual situation [16], as shown in Table 2.

2.2.6. The Spatial-Temporal Statistical Methods

For the forest fire spatial distribution based on fire spots and burned area data, we used kernel density analysis [36] to generate a continuous density surface from discrete fire points by interpolation, so as to express the spatial clustering or spatial distribution pattern of forest fires in the whole region.
For the time processing of forest fire and forest NPP data, we used the statistical method of Mann–Kendall trend test, which is one of the more effective methods applied in trend detection analysis [37]. The test is a nonparametric statistical test that does not require the sample to obey a certain distribution and is not disturbed by a few outliers, has a high degree of quantification, has a wide detection range, is easy to calculate, and is widely used for trend changes in hydrology, temperature, and climate in time series.
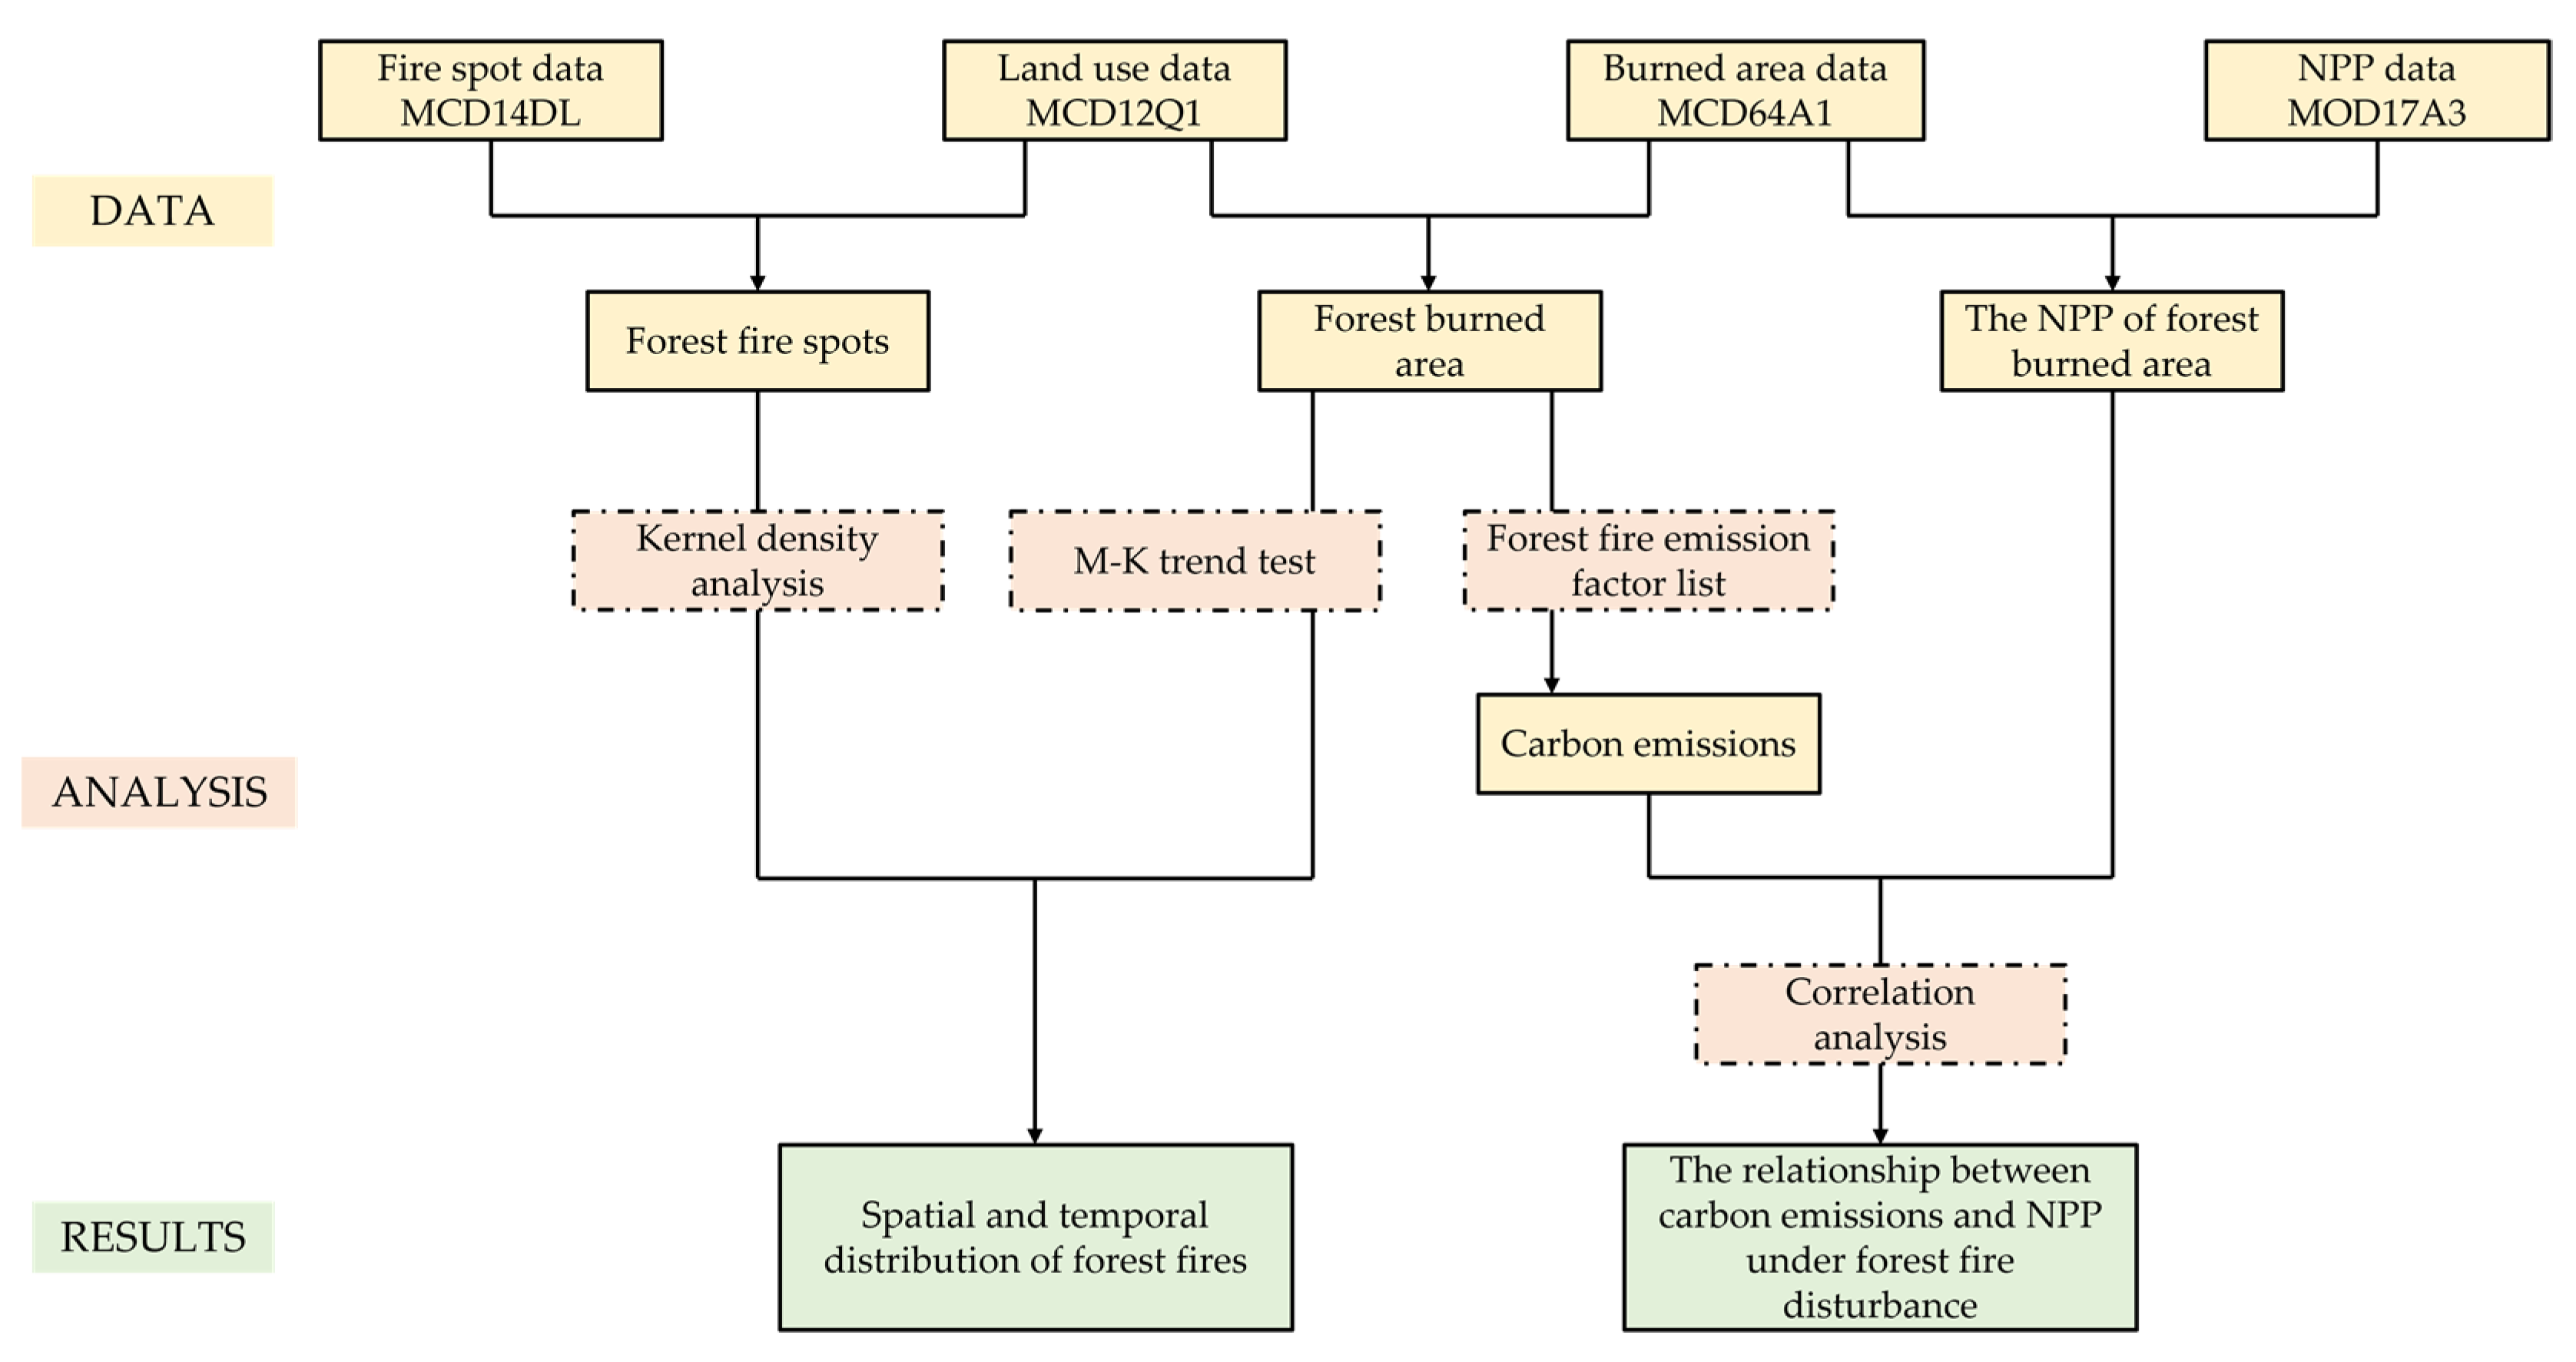
According to the previous introduction, the flowchart is shown as Figure 2.

3. Results

3.1. Spatiotemporal Distribution Characteristics of Forest Fires in Southwestern and Northeastern Regions of China

Figure 3 shows the interannual variation of the number of forest fire spots and the burned area in the SW and NE from 2001 to 2020. As shown in the Figure, the number of forest fire spots and the burned area in the SW and NE showed fluctuating changes during the two decades, and the interannual variation of the two were highly correlated. The correlation coefficient r reached 0.85 and 0.75 in the SW and NE, respectively (p < 0.01).
In terms of the number of forest fire spots (Figure 3, line graph), there were 1.06 × 10⁵ forest fire spots in the SW in 20 years, which is about 1.28 times the total number of forest fire spots in the NE, and the average annual number of forest fire spots in the two regions were 5288.85 and 2320.4, respectively. For the temporal trend, the average annual decline in the number of forest fire spots in the two forest regions was 18.67% and 37.29%, respectively, with the decline in the NE being more obvious than that in the SW. This trend change is inextricably linked to the implementation of forest fire prevention measures in China in recent years [38]. The number of forest fire spots in the SW reached a maximum of 13,625 in 2010 and declined thereafter. Taking 2010 as the demarcation line, the average number of forest fire spots was 6229.8 in the first 10 years before 2010, exceeding the average value of 4347.9 in the 10 years after 2010 by 43.28%. The number in the NE showed an increasing trend until 2003, with R2 = 0.76, and reached a maximum of 7656 in 2003, then declined and reached a minimum of only 717 in 2012.
In terms of the burned area (Figure 3 histogram), the annual average value of burned area in the SW from 2001 to 2020 was 7.69 × 10⁴ ha, which was 32.37% smaller than that in the NE; however, the annual average number of forest fires was 1.28 times higher than that in the NE (Figure 3, line graph). It can be seen that compared to the SW, forest trees in the NE were more flammable, which may be related to the extensive distribution of coniferous forests in the NE. The total burned area in the SW was 1.54 × 10⁶ ha, and the trend remained the same except for the abnormally high value of 4.18 × 10⁵ ha in 2010, with R2 = 0.01. The total burned area in the NE was 2.27 × 10⁶ ha, and the overall trend decreased, R2 = 0.16 (p < 0.1), and the burned area reached the maximum value of 6.32 × 10⁵ ha in 2003, which was related to the two mega fires that occurred in May of that year [39]. Since 2004, the burned area decreased, reaching a minimum value of 1.55 × 10⁴ ha in 2012.
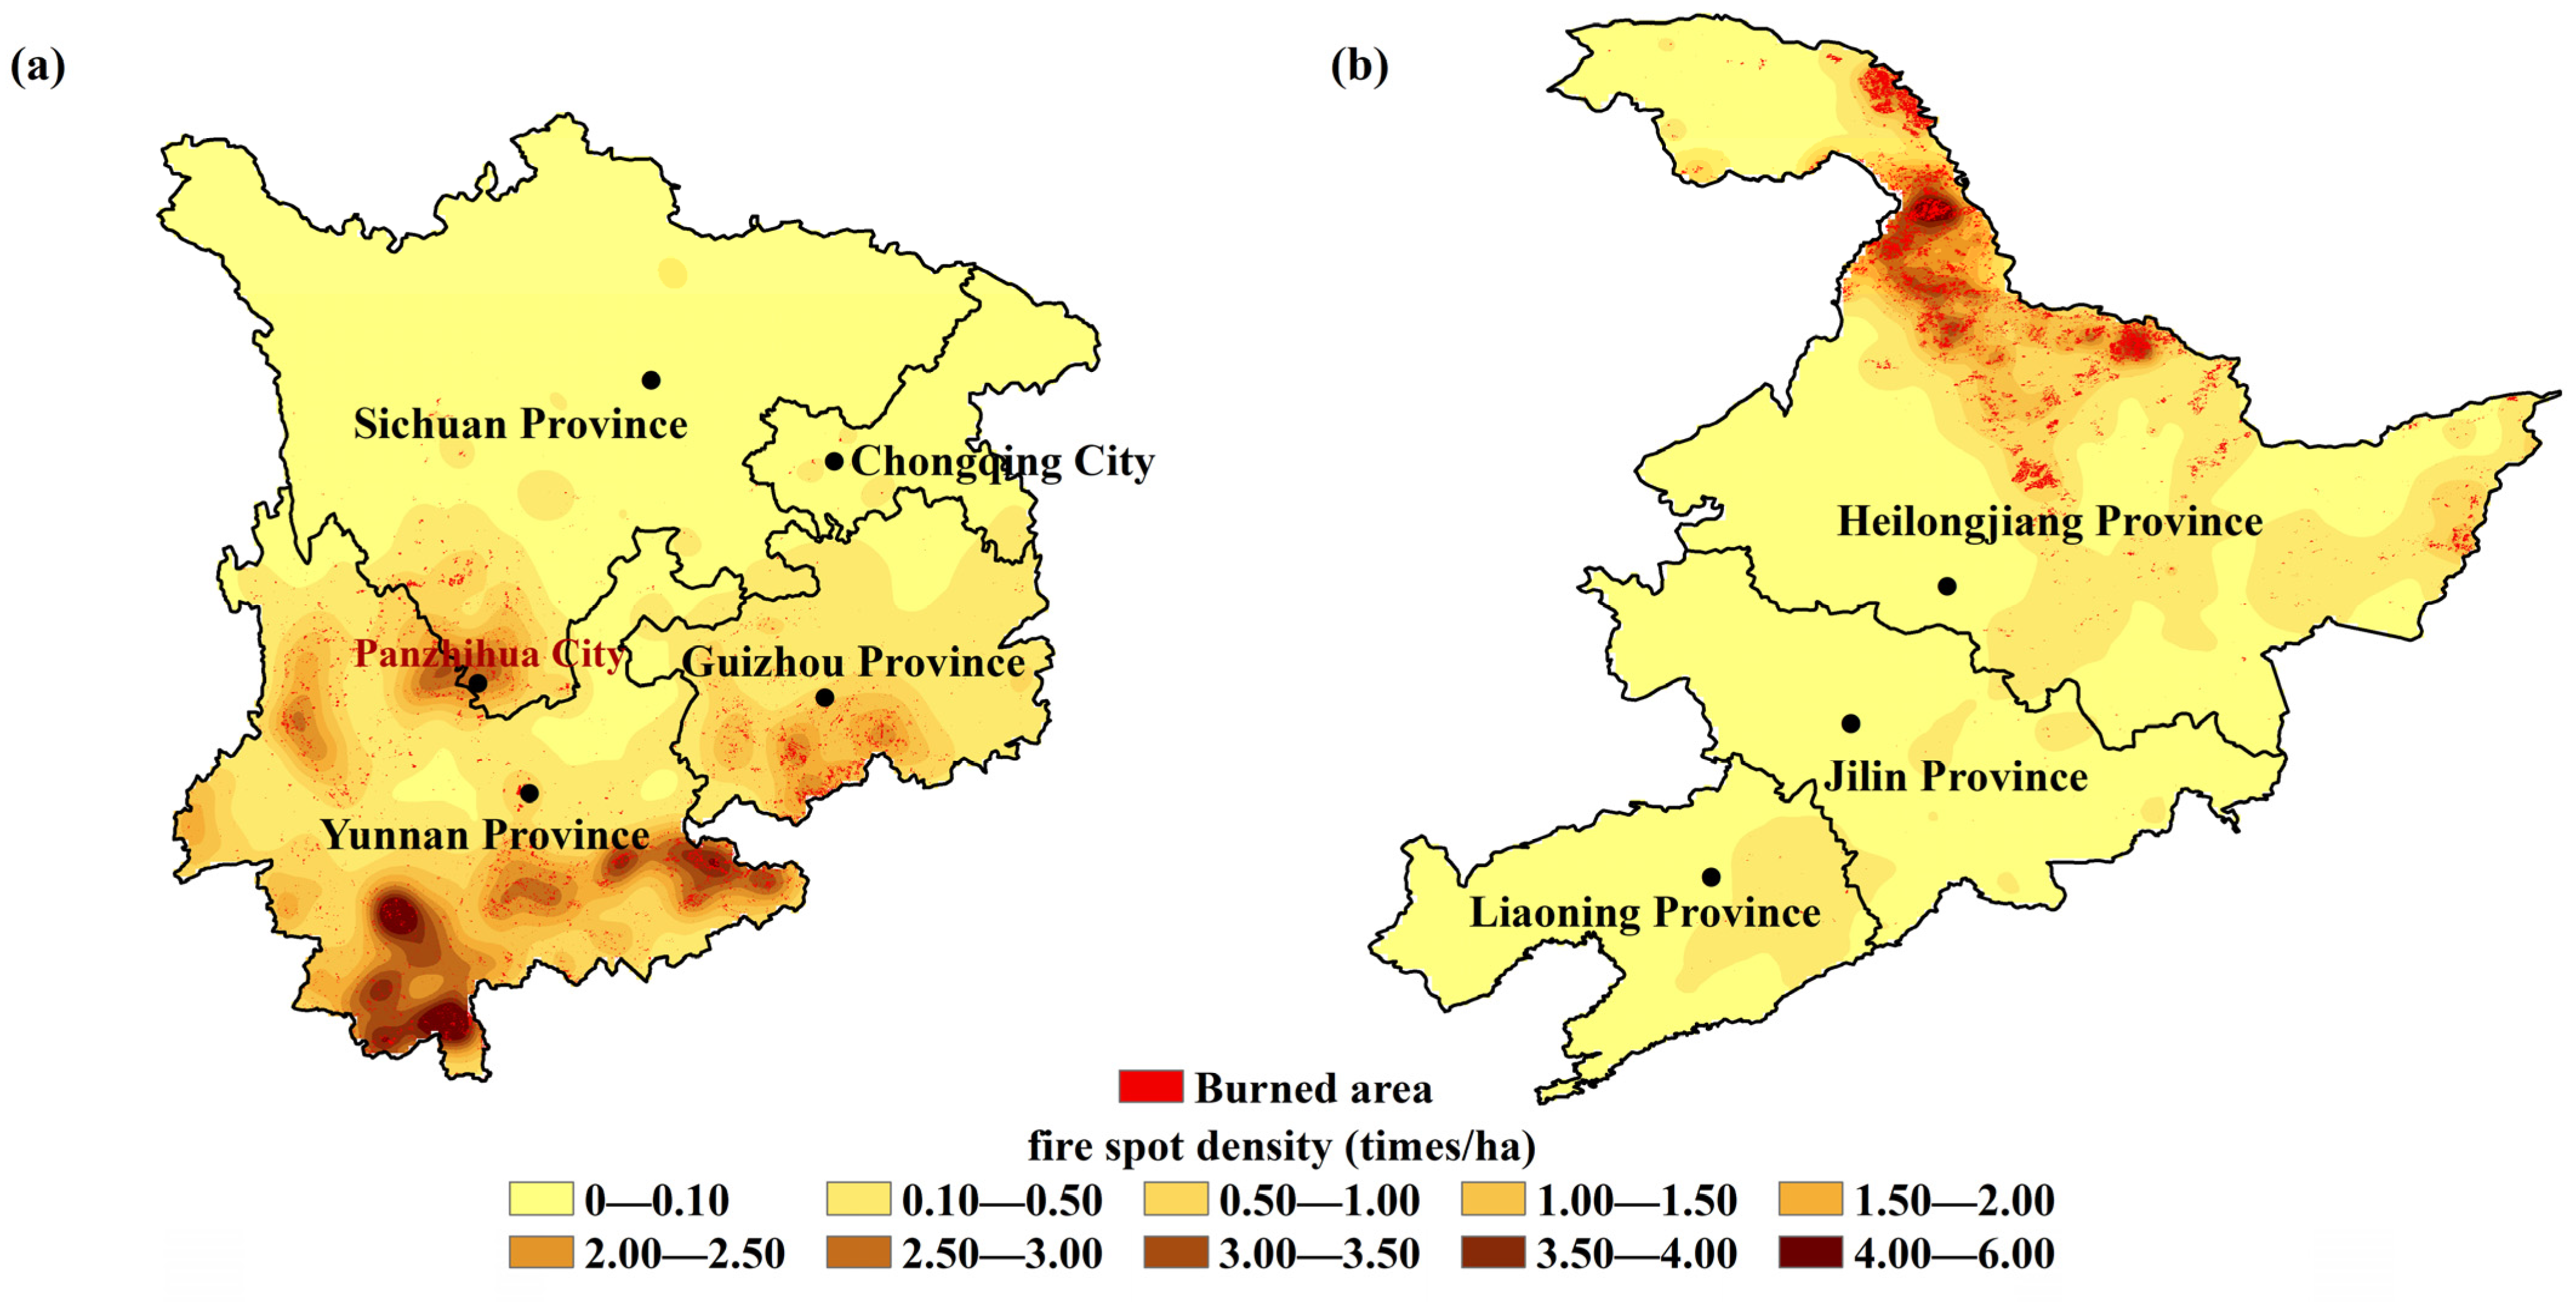
In order to analyze the spatial distribution of forest fires in the SW and NE from 2001 to 2020, we employed the kernel density analysis to map the density of forest fires based on the number of forest fire spots from 2001 to 2020 and also superimposed the distribution of the forest burned area, as shown in Figure 4. As can be seen, the kernel density center of the forest fire spots had an extensive overlap with the high value burned area, but the two showed spatial heterogeneity in the SW and NE, respectively. The distribution of forest fire spots and burned area in the SW was more dispersed than that in the NE. The distribution of forest fires in the SW was high in the southwest and low in the northeast (Figure 4a), and the areas with fire spot densities greater than 1.7 times/ha were mainly concentrated in southern Yunnan Province, southern Guizhou Province, and the border area between Sichuan Province and Yunnan Province, i.e., Panzhihua City, where the highest value was 5.6 times/ha. The high values of forest fire density and burned area in the NE were concentrated in Daxing’anling and Xiaoxing’anling Mountains (Figure 4b), where the fire density exceeded 1.5 times/ha.

3.2. Estimation of Carbon-Containing Gas Emissions and Carbon Emissions from Forest Fires in Southwestern and Northeastern Regions of China

Carbonaceous gases emitted from forest fires are the main source of forest carbon release and affect the atmospheric environment. CO2, CO, and CH4 are the main carbon gases emitted from forest fires. The carbonaceous gas emissions from forest fires in the SW and NE from 2001 to 2020, calculated according to Equations (1) and (2), were shown in Table 3. From Table 3, it can be seen that more than 90% of forest fire carbon emissions are released to the atmosphere in the form of CO2 and CO, and less than 10% were released in the form of CH4, but the specific proportions of the two regions differed, as shown in columns 2–7 of Table 3. Specifically, in the SW: CO2 (94.03%) > CO (5.67%) > CH4 (0.30%); in the NE: CO2 (93.73%) > CO (5.98%) > CH4 (0.29%). As the most dominant form of carbon emissions, the CO2 emission in the SW and the NE was 125,893.82 Gg and 113,118.17 Gg for 2001–2020, respectively, and the former was 12,775.65 Gg higher than the latter, i.e., the SW outnumbered the NE by 11.29%, as shown in the last row of Table 3. It also showed that forest fires emitted 13.52% more CH4 and 5.35% more CO in the SW than in the NE.
Based on the molecular weight of the carbonaceous gases, the carbonaceous gas emissions were uniformly converted to carbon emissions, as detailed in columns 8–9 of Table 3, the total carbon emissions from forest fires in the SW and NE were 37,559.94 Gg and 33,908.63 Gg respectively. From Equations (1) and (2), it can be seen that the estimation of the carbonaceous gas emissions was related only to the burned area. According to the previous analysis, the average annual burned area by forest fires in the SW was 32.37% smaller than that in the NE, but the forest fire carbon emissions exceeded those in the NE by 10.77%. This indicates that the carbon emissions from forests in the SW were higher under forest fire disturbance, which may be related to forest structure factors. According to the proportion of different forest types, the burned area in the SW showed that evergreen broadleaf forest (49.80%) > deciduous broadleaf forest (43.06%) > evergreen needleleaf forest (7.14%). The corresponding forest fire carbon emissions showed that evergreen broadleaf forest (61.87%) > deciduous broadleaf forest (25.85%) > evergreen needleleaf forest (12.28%). And the burned area in the NE showed that deciduous broadleaf forest (93.71%) > deciduous needleleaf forest (6.29%). The corresponding forest fire carbon emissions showed that deciduous broadleaf forest (92.28%) > deciduous needleleaf forest (7.72%). According to the comparison analysis of the above values, the forest fire carbon emission ratio of evergreen broadleaf forest and evergreen needleleaf forest in the SW and deciduous needleleaf forest in the NE was greater than the area ratio of burned area, and the carbon emission from burning was relatively higher. The influential factors of the absolute value of the burned area were removed. It was concluded that the contribution of different forest types to forest fire carbon emissions was evergreen needleleaf forest (14.98%) > evergreen broadleaf forest (10.81%) > deciduous needleleaf forest (6.52%) > deciduous broadleaf forest (5.22%), so the forest fire carbon emissions of forest types in the NE were lower than those in the SW.
In addition, as shown in Table 3, the forest fire carbon emissions in the SW in 2010 and the NE in 2003 reached the maximum value of 9313.07 Gg and 9706.01 Gg, respectively, which is consistent with the year of the maximum forest fire activities expressed in Figure 3. CO2, CO, and CH4 showed the same behavior, as shown in the bold font in the table, they also showed the maximum values in 2010 in the SW and in 2003 in the NE, respectively.
The carbonaceous gas emissions calculated according to Equations (1) and (2), as detailed in Section 2.2.4 and Section 2.2.5.
Figure 5 shows the interannual variation of forest fire carbon emissions in the SW and NE from 2001 to 2020 and their linear trends. Combined with Table 3, it can be seen in the Figure 5 that the forest fire carbon emissions in the SW were basically stable during 20 years with an annual average value of 1878.00 Gg, except for an unusually high value of 9313.07 Gg in 2010. The NE showed a decreasing trend, with R2 = 0.16 (p < 0.1), reaching a maximum value of 9706.01 Gg in 2003 and a minimum value of only 231.27 Gg in 2012.

3.3. Spatiotemporal Distribution Characteristics of NPP in Southwestern and Northeastern Regions of China and the Relationship with Forest Fire Carbon Emissions

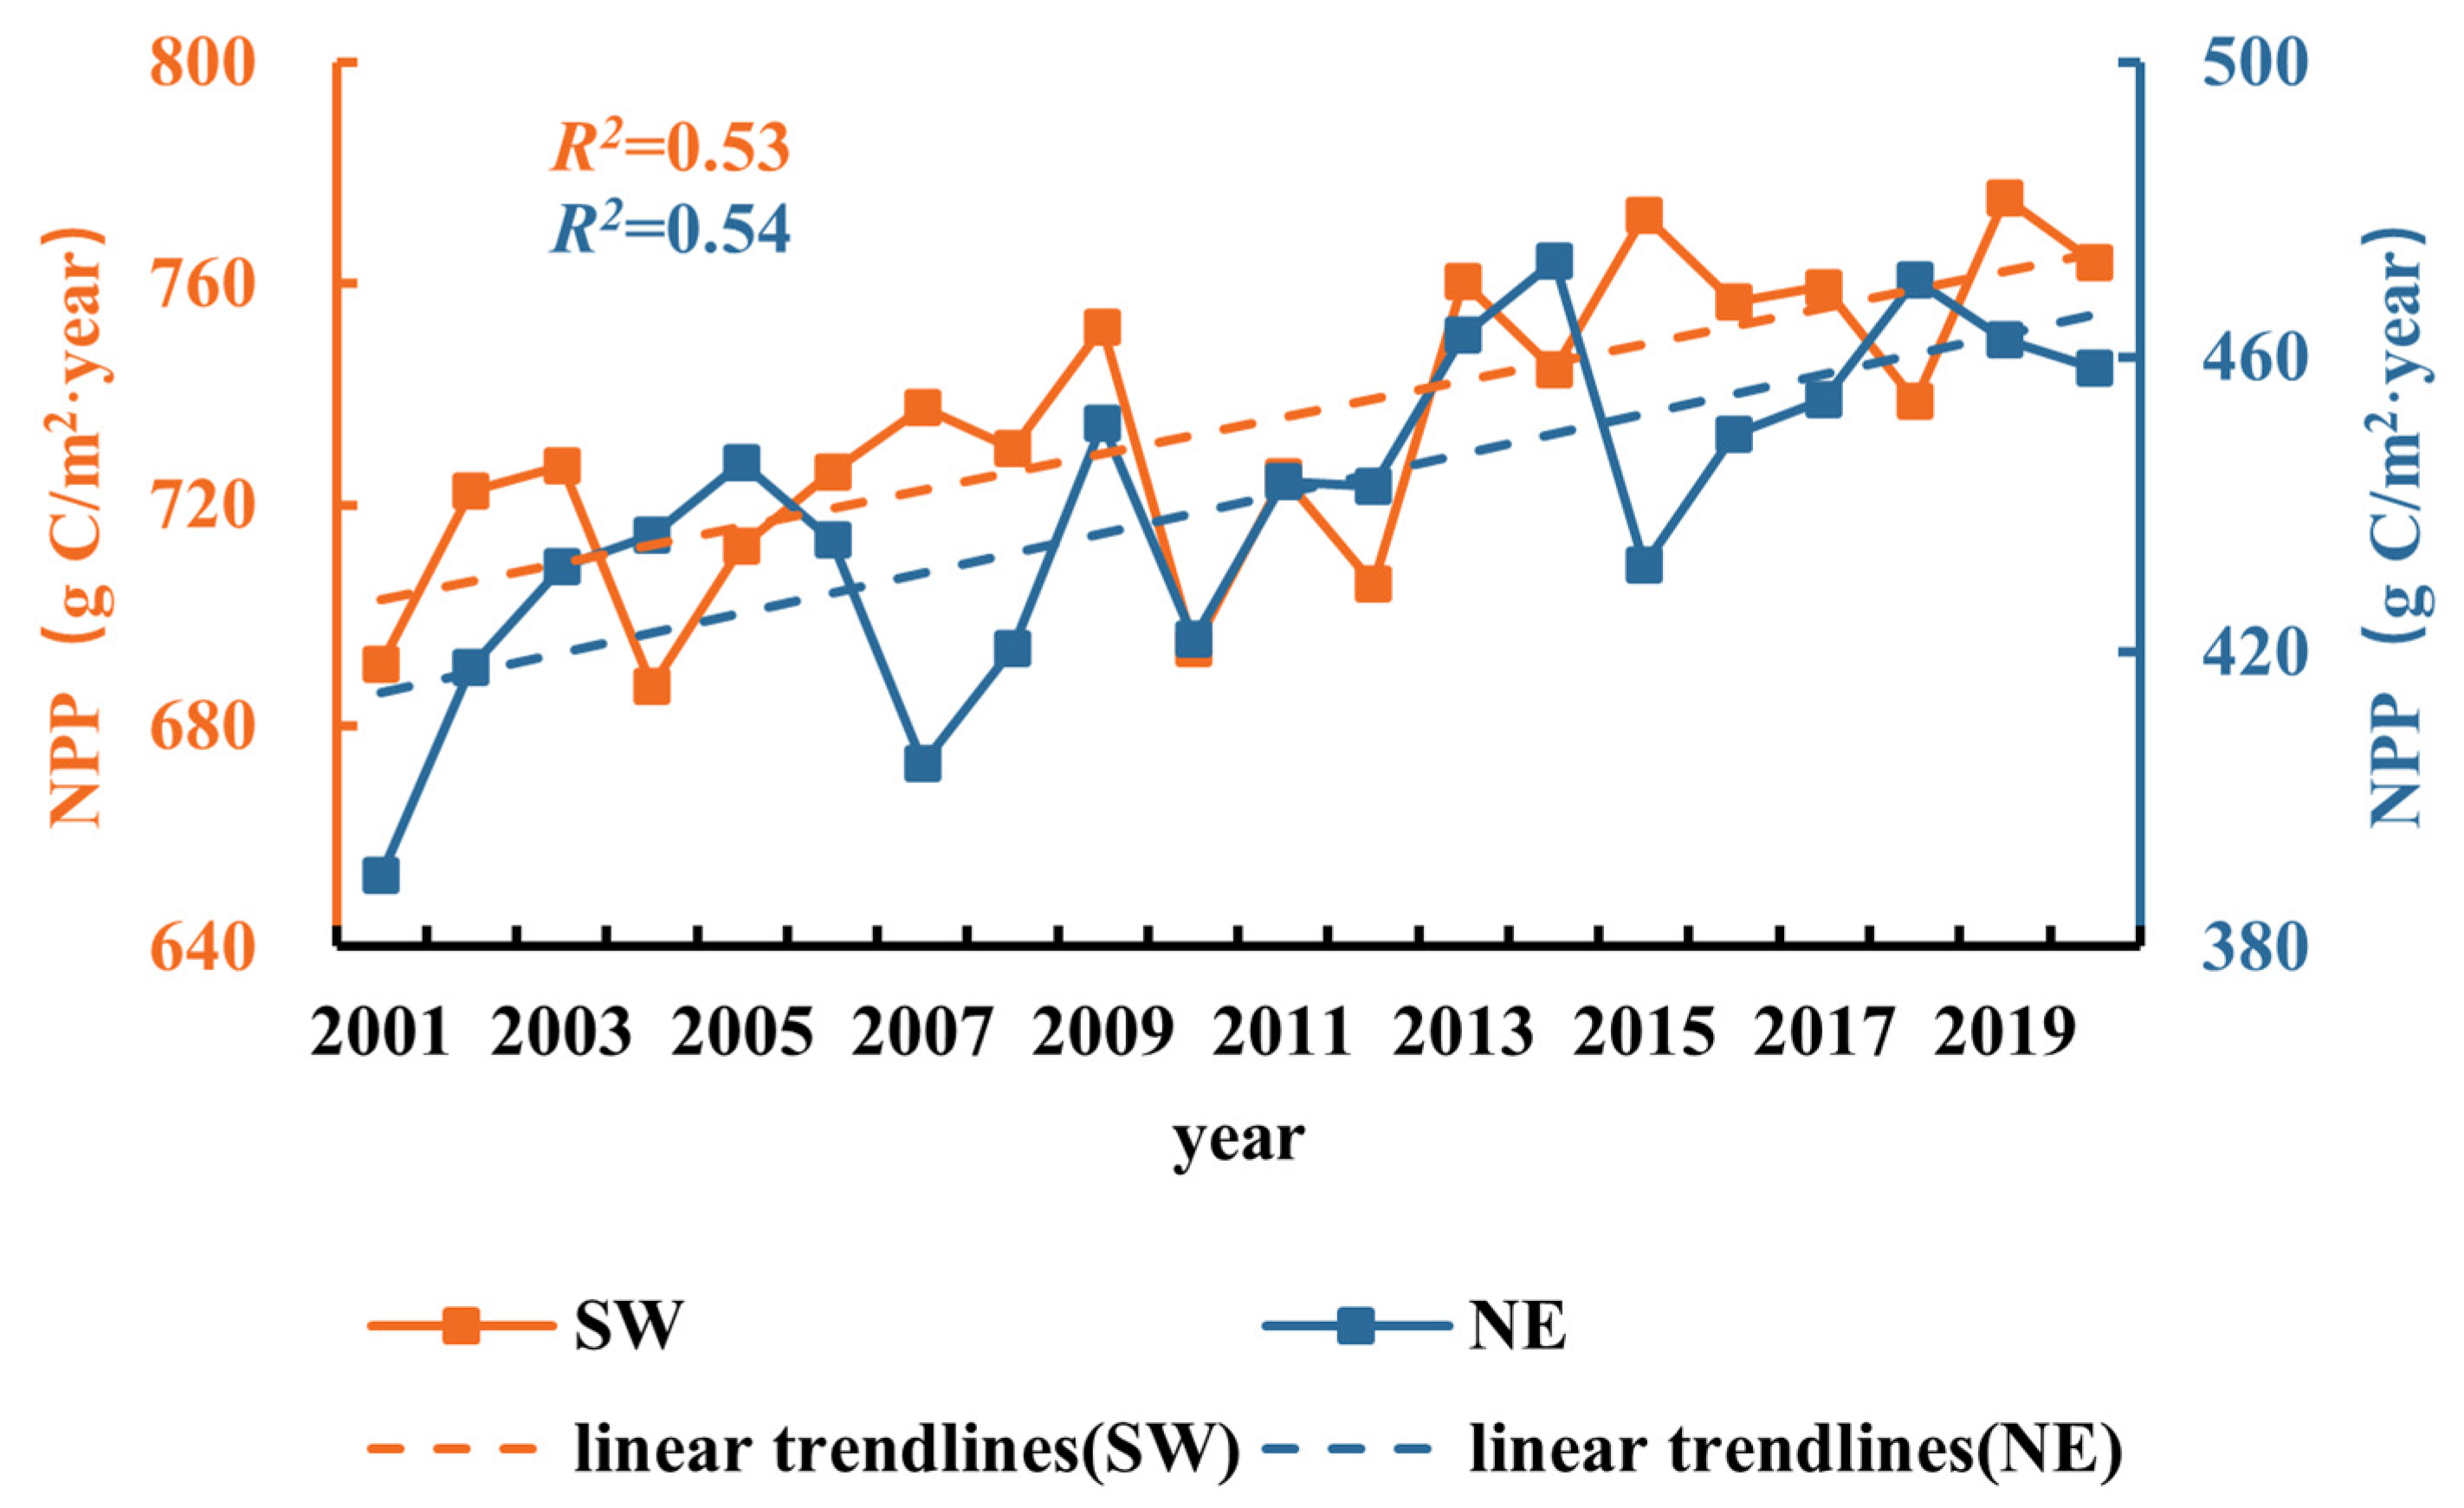
Figure 6 shows the interannual variation of NPP in the SW and NE from 2001 to 2020. As shown in Figure 6, the average value of vegetation NPP in 20 years in the SW was 734.07 g C/m2·year, and the average value of vegetation NPP in 20 years in the NE was 440.13 g C/m2·year, which was 66.78% lower than that in the SW. The NPP in both the SW and NE increased significantly from 2001 to 2020, with R2 values of 0.53 (p < 0.05) and 0.54 (p < 0.05), respectively, which was mainly related to the implementation of forestry ecological engineering construction policies such as the closure of mountains for reforestation, the return of cultivated land to forest, and the construction of artificial protection forests around 2000 in China [40].
In terms of spatial distribution, as shown in Figure 7, the average annual spatial distribution of NPP in different value domains in the SW was more uniform, mainly concentrated between 600 and 1000 g C/m2·year (Figure 7a), which is higher than that (200–600 g C/m2·year) in the NE (Figure 7b). Due to the combined influence of multiple factors such as climate, geography, and population, the average NPP in the SW from 2001 to 2020 showed the distribution characteristics of high in the south and low in the northwest, with the first high-value area in the southwest of Yunnan Province, followed by the border areas between Sichuan Province and Yunnan Province centered on Panzhihua City and the south of Guizhou Province. The high value area of NPP is basically consistent with the high value area of forest fire point density and burned area (Figure 4), with the lower vegetation NPP area on the western Sichuan plateau. The overall distribution of NPP in the NE from 2001 to 2020 was characterized by high in the east and low in the west, with the highest area being the Changbai Mountain area, followed by the Daxing’anling and Xiaoxing’anling Mountains.
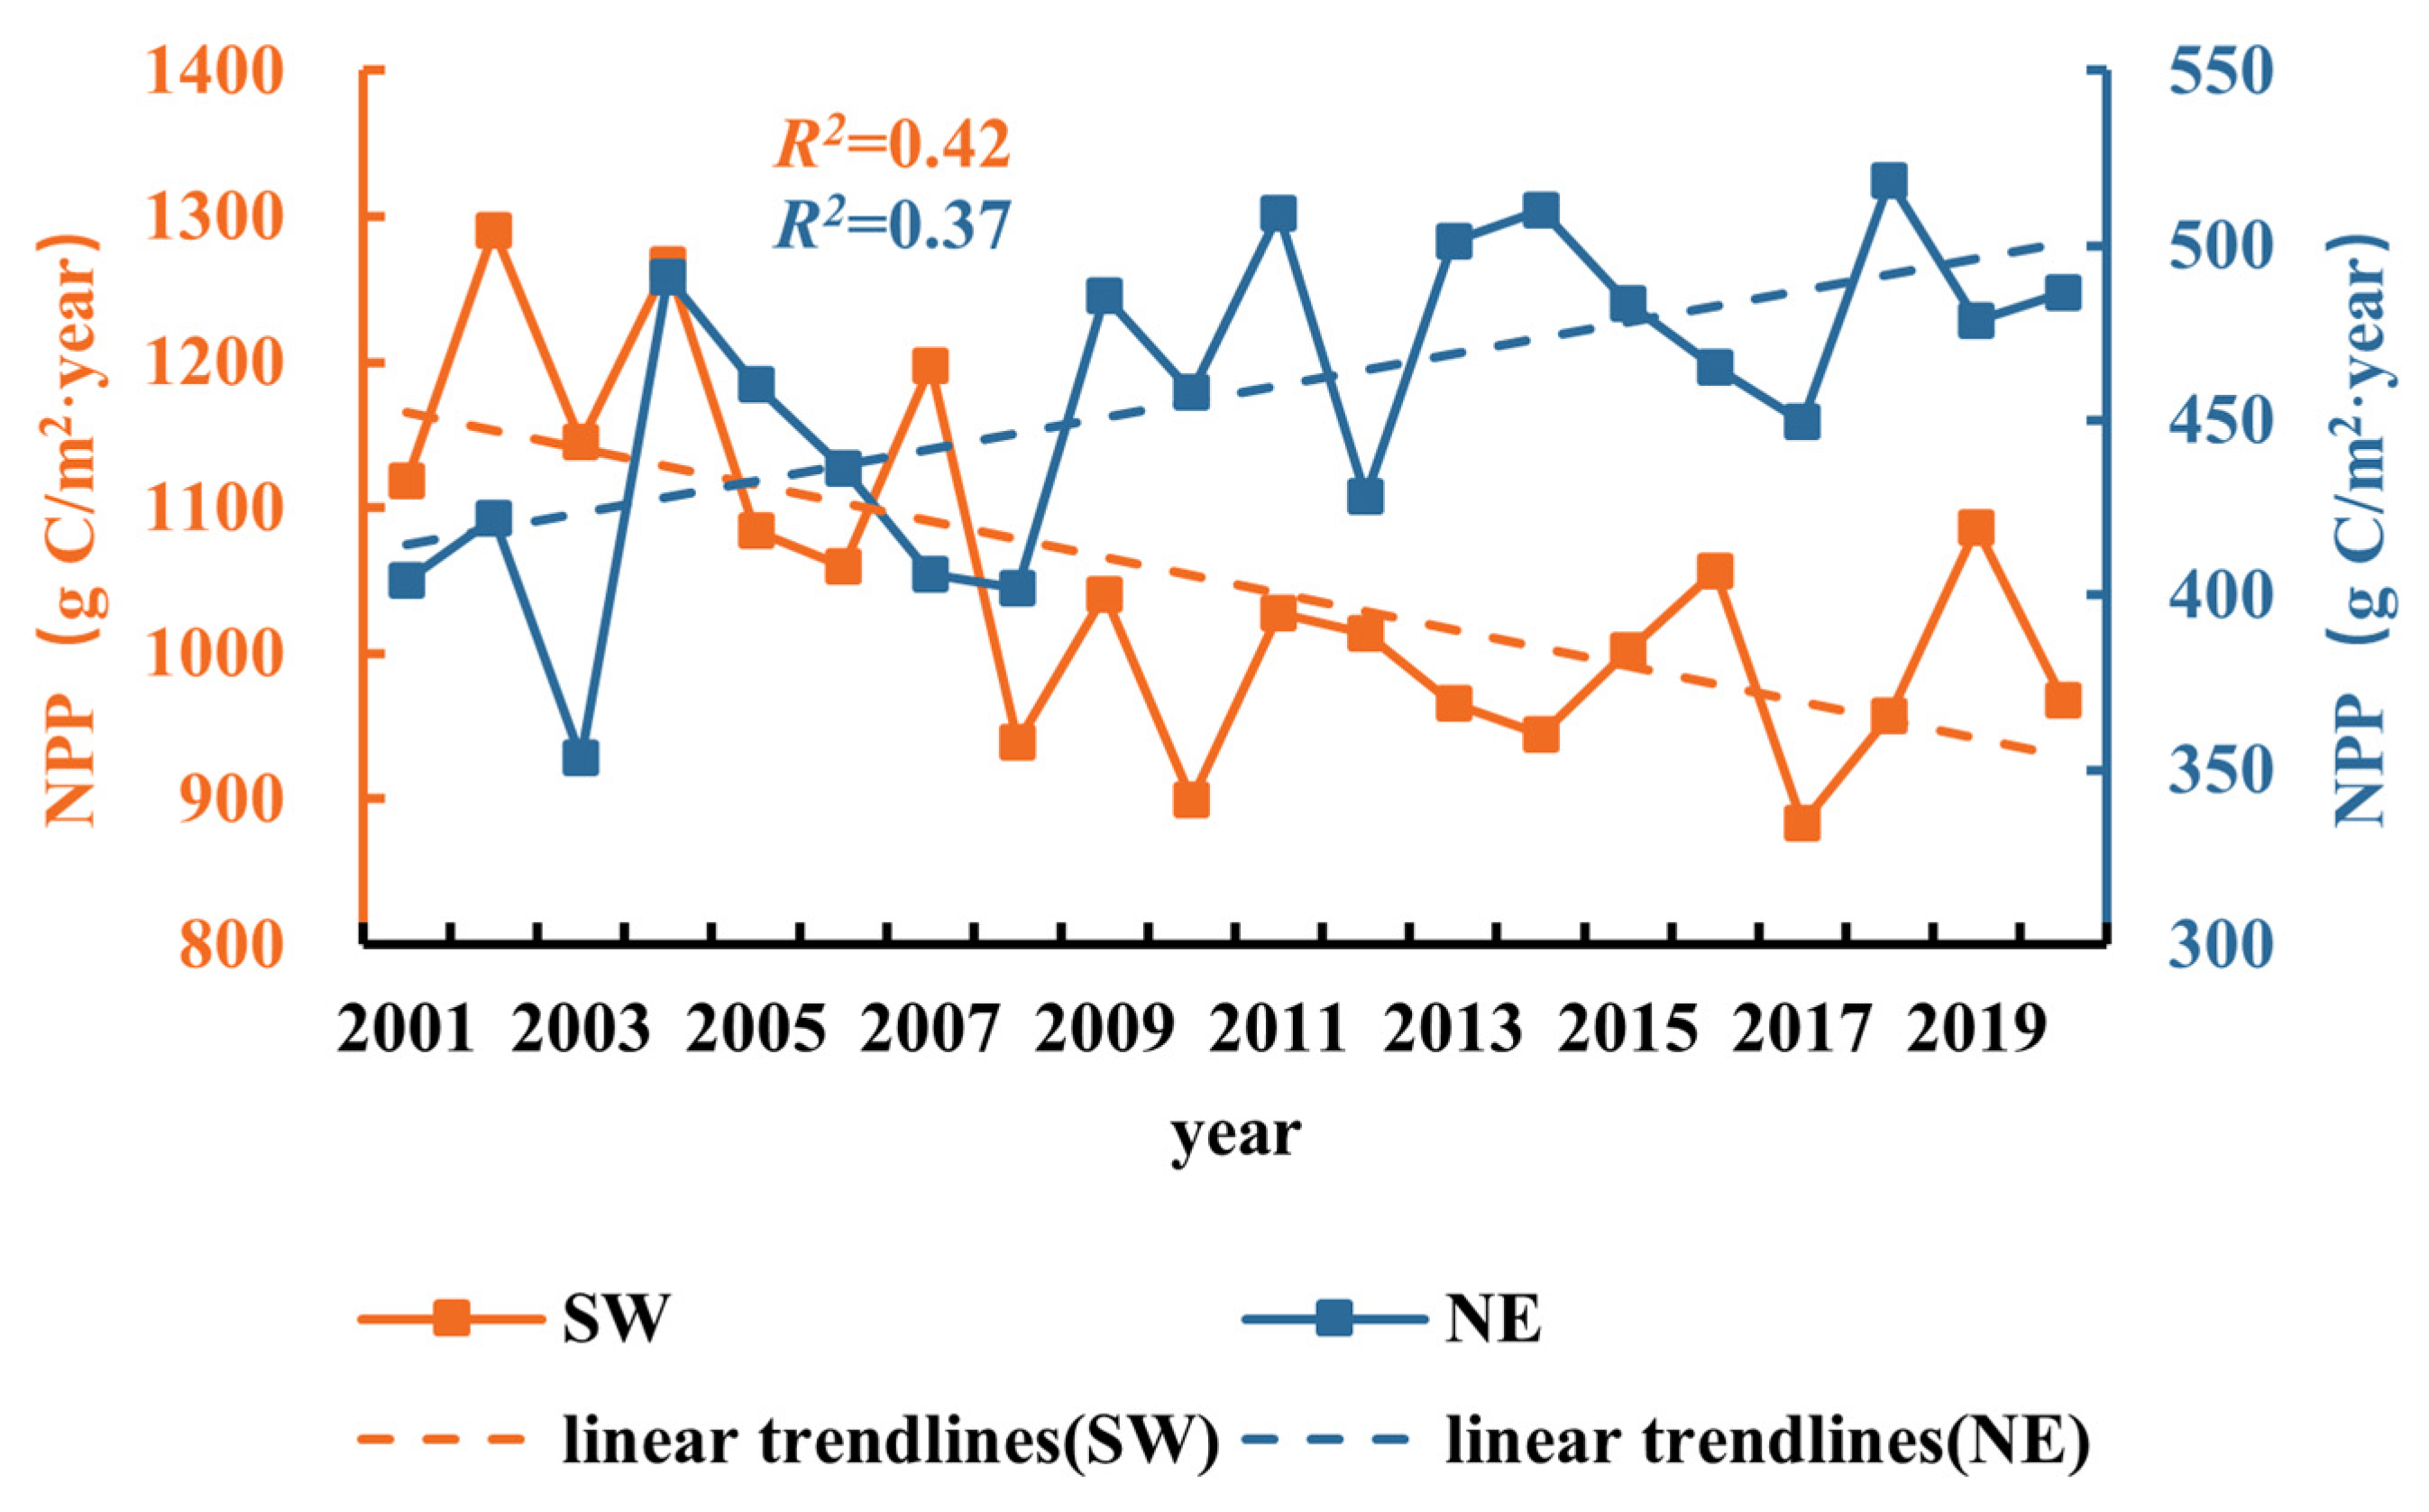
The NPP of forest burned areas in the SW and NE was extracted to obtain the interannual variation of NPP in these burned areas from 2001 to 2020, as shown in Figure 8. It is shown that the NPP of burned areas in the SW showed a significant decreasing trend, with R2 = 0.42 (p < 0.1); while the NPP of burned areas in the NE showed a significant increasing trend, with R2 = 0.37 (p < 0.05). The two trends of burned areas’ NPP were opposite, and the average annual value of NPP in burned areas in the SW from 2001 to 2020 was larger than that in the NE, the former was 1047.18 g C/m2·year and the latter was only 457.42 g C/m2·year.
In order to test the effect of carbon emissions from forest fire disturbance on the carbon cycling process of forest ecosystems, the relationship between forest fire carbon emissions and NPP in the forest fire burned area was derived as shown in Figure 9. It can be seen that the NPP of the southwestern burned area had a weak negative correlation with forest fire carbon emissions, with r = −0.27, p < 0.05, as shown in Figure 9a. The NPP of the northeastern burned area had a significant negative correlation with forest fire carbon emissions, with r = −0.61 (p < 0.05), as shown in Figure 9b. The change of burned area NPP was discussed under the change of forest fire carbon emission, so the results in Figure 9 more intuitively reflect the previous content. In the SW, forest fire carbon emissions were basically stable and unchanged within 20 years (Figure 5), while the NPP values in the burned area showed a decreasing trend (Figure 8); in the NE, forest fire carbon emissions showed a more significant decreasing trend within 20 years (Figure 5), and the NPP values in the burned area showed a significant increasing trend (Figure 8). This indicates that forest fire disturbance actually has an effect on NPP in the burned area. The NPP values are used to represent the important parameter of forest carbon uptake, so the carbon sequestration capacity of forest will change with the change of forest carbon loss caused by forest fire disturbances, the change depends on different regions. Combined with the above results, the forest carbon sequestration capacity under the disturbance of forest fire showed different in northeast and Southwest China: Although the forest NPP values of the two regions increased continuously in the past 20 years, with the decrease in forest fire carbon emissions, the NPP of the burned areas also increased, as shown in the NE, indicating that the forest fire interference had no significant effect on forest carbon storage. In Southwest China, carbon emissions from forest fires remained stable for 20 years, NPP values in burned area decreased, indicating that the carbon loss caused by forest fires in Southwest China had a negative impact on local forest carbon stocks, resulting in net carbon loss in burned area. Therefore, the interference of forest fire in Southwest China is more worthy of attention, and the climate change caused by it and their interaction are worth studying in the future.

4. Discussion

4.1. The Establishment of the Relationship between Forest NPP and Forest Fire Carbon Emissions Involves Many Areas That Cannot Be Considered Individually

Forest NPP can reflect the forest carbon source/sink capacity [41,42], but its spatiotemporal variation is simultaneously affected by changes in meteorological factors (temperature, precipitation, etc.,), changes in atmospheric composition (CO2 concentration, N deposition) and various forest disturbances such as fire disturbance [43], wind disturbance [44,45], and pest and disease disturbance [46]. Meanwhile, the continuation of the forest ecological projects implemented in China since 2000 will also have a positive impact on forest NPP. In this paper, only one of the most important forest disturbances, forest fire disturbance, which can cause changes in forest carbon pools and carbon allocation patterns [47], was selected, while other disturbances in forests and their interactions between disturbances were not addressed. However, carbon emissions are a trend indicator value. This study constructed scientific relationships between carbon emissions released from forest fires and forest carbon uptake by quantitatively studying them, which can provide scientific support for the scientific and rational formulation of forest fire management measures.

4.2. The Inventory of Forest Fire Combustion Emission Factors Is Mostly Derived from Previous Empirical Values, and the Results Are Subject to Some Errors

The number of carbonaceous gases emitted by forest fire disturbance has been studied by many scholars at home and abroad, using empirical, statistical, and remote sensing analyses [48,49], but the results are local in character; also, the results vary from time to time in the same region. Therefore, only limited results are applicable. In this paper, the emission factor method [16] was used to estimate the carbon emissions from forest fires in southwest and Northeast China from 2001 to 2020, and the errors were relatively large because they were all derived from previous empirical values. Moreover, the burning efficiency was affected by the vegetation type, burning method, and natural environment, so the exact values could not be obtained. Meanwhile, this paper did not consider the effects of plant physiological processes and soil factors, so the conclusions may have limitations, but the analysis of the temporal trends of carbon emissions in the southwestern and northeastern regions over 20 years on a large scale can still provide a scientific basis for the study of carbon expenditure in these two regions.

4.3. The Impacts of Forest Fire on Climate Change May Be Complex and Far-Reaching

It is a fact that forest fires are becoming more frequent and more intense under cli-mate change, resulting in increased forest carbon loss. The carbon released mainly includes CO2, CH4, etc., and these increased greenhouse gases will promote climate change [50]. Northern North America wildfires are responsible for nearly 12 Gt of carbon emission linked to the 1.5 °C limit of the Paris Agreement [51]. In addition to the direct effects, fire carbon emissions are long-term and complex to climate change. The CO2 absorption of burned forest land needs to recover slowly, which weakens the soil carbon sink capacity [8]. One year after the forest fire, the land surface temperature rises 0.12–0.19 °C in the burned area, and the warming in the year after the disaster is equivalent to 62% of the CO2 warming released by the forest fire [52], and the surface evapotranspiration decreases. Considering the total carbon balance of the regenerated forest after the fire, it takes about 150 years to compensate for this carbon loss [53]. Meanwhile, changes in underlying surface caused by forest succession and forest structure changes after forest fires will continue to affect climate change, which does not only refer to forest carbon cycle. In addition, the aerosol particles produced by forest fires are larger and higher [54], and the radiative forcing of aerosols will also affect climate change [55].
However, as a kind of forest disturbance, whether fire will change forest carbon cycle needs to be analyzed on a case-by-case basis. Amazon rainforest is the largest forest in the world. Currently, forest carbon emission including forest fire interference is as high as 0.2 Pg C/year in this region, which is equivalent to reducing evapotranspiration by 34% in dry season [56]. Under such interference, the rainforest has become a carbon source [57], which positively promotes climate change. In this study, we found that forest fire carbon emissions increased as well as NPP decreased in burned areas in Southwest China, indicating that forest fires caused a net loss of carbon in burned areas. However, on the whole, the NPP of the southwest forest area continued to increase during the 20 years studied, leading to the fact that the forest fire as a disturbance did not change the status of the car-bon sink in the southwest forest. In fact, with the increase of NDVI in Southwest China, precipitation has increased slightly in recent years. In Northeast China, there was no net loss of carbon in the burnt area. This research result is limited by the research period and has regional characteristics. However, the results can also provide some support for whether forest fire interference in China’s natural forests will change forest carbon sink function and produce significant regional climate change.

5. Conclusions

The forest fires in Southwest China and Northeast China during 2001–2020 have spatial aggregation, but the forest fires in the two regions have different characteristics. In contrast, there were more fire spots in Southwest China, but less burned areas. The carbon emission of forest fires dependent on burned areas showed that the carbon loss from forest fires was greater in the southwest, which was related to the distribution of forest types in the two regions. The results showed that the contribution of evergreen forest (needleleaf and broadleaf forest) to forest fire carbon emission was greater than that of deciduous forest (needleleaf and broadleaf forest). Based on the condition of forest fire carbon emissions decreased in Northeast China and remained unchanged in Southwest China over the past 20 years, we found that there was an inverse correlation between NPP and forest fire carbon emissions in burned area, but the two regions showed completely different performances: forest fire interference in Southwest China had caused net carbon loss in the burned area, while that in Northeast China was not. Through the study of forest carbon emissions under forest fire disturbance in the main natural forest areas in northeast and Southwest China, it is found that different forest types and forest fire characteristics are important reasons for the differences in forest carbon uptake/emissions under forest fire disturbance, which can provide some ideas for the feedback of forest disturbance on climate change.

Author Contributions

Conceptualization, Y.Y., C.H., W.W. and L.Z.; methodology, W.Z., Y.Y., C.H. and W.W.; software, W.Z. and B.H.; formal analysis, W.Z., Y.Y., C.H. and L.Z.; data curation, W.Z., Q.L., Y.L. and Y.Y.; writing—original draft preparation, W.Z. and Y.Y.; writing—review and editing, Y.Y., C.H., L.Z., Q.L. and Y.L. All authors have read and agreed to the published version of the manuscript.

Funding

This research was funded by National Natural Science Foundation of China (grant number 31971670) and the National Key Research and Development Program of China (2021YFD2200404).

Data Availability Statement

The original contributions presented in the study are included in the article, further inquiries can be directed to the corresponding author.

Acknowledgments

We thank reviewers for their insightful suggestions and comments.

Conflicts of Interest

The authors declare no conflict of interest.

References

  1. Lal, R. Forest soils and carbon sequestration. For. Ecol. Manag. 2005, 220, 242–258. [Google Scholar] [CrossRef]
  2. Fernández-Martínez, M.; Vicca, S.; Janssens, I.A.; Sardans, J.; Luyssaert, S.; Campioli, M.; Chapin, F.S.; Ciais, P.; Malhi, Y.; Obersteiner, M.; et al. Nutrient availability as the key regulator of global forest carbon balance. Nat. Clim. Chang. 2014, 4, 471–476. [Google Scholar] [CrossRef]
  3. Nemani, R.R.; Keeling, C.D.; Hashimoto, H.; Jolly, W.M.; Piper, S.C.; Tucker, C.J.; Myneni, R.B.; Running, S.W. Climate-driven increases in global terrestrial net primary production from 1982 to 1999. Science 2003, 300, 1560–1563. [Google Scholar] [CrossRef] [PubMed]
  4. Zhao, J.; Wang, J.M.; Meng, Y.F.; Du, Z.Q.; Ma, H.; Qiu, L.H.; Tian, Q.; Wang, L.; Xu, M.Y.; Zhao, H.F.; et al. Spatiotemporal patterns of fire-driven forest mortality in China. For. Ecol. Manag. 2023, 529, 120678. [Google Scholar] [CrossRef]
  5. Crutzen, P.J.; Heidt, L.E.; Krasnec, J.P.; Pollock, W.H.; Seiler, W. Biomass burning as a source of atmospheric gases CO, H2, N2O, NO, CH3CJ and COS. Nature 1979, 282, 253–256. [Google Scholar] [CrossRef]
  6. Seiler, W.; Crutzen, P.J. Estimates of gross and net fluxes of carbon between the biosphere and the atmosphere from biomass burning. Clim. Chang. 1980, 2, 207–247. [Google Scholar] [CrossRef]
  7. Hu, T.X.; Zhao, B.Q.; Li, F.; Dou, X.; Hu, H.Q.; Sun, L. Effects of fire on soil respiration and its components in a Dahurian larch (Larix gmelinii) forest in northeast China: Implications for forest ecosystem carbon cycling. Geoderma 2021, 402, 115273. [Google Scholar] [CrossRef]
  8. Zheng, B.; Ciais, P.; Chevallier, F.; Chuvieco, E.; Chen, Y.; Yang, H. Increasing forest fire emissions despite the decline in global burned area. Sci. Adv. 2021, 7, 39. [Google Scholar] [CrossRef]
  9. Chen, A.P.; Tang, R.Y.; Mao, J.F.; Yue, C.; Li, X.R.; Gao, M.D.; Shi, X.Y.; Jin, M.Z.; Ricciuto, D.; Rabin, S.; et al. Spatiotemporal dynamics of ecosystem fires and biomass burning-induced carbon emissions in China over the past two decades. Geogr. Sustain. 2020, 1, 47–58. [Google Scholar] [CrossRef]
  10. Bastit, F.; Brunette, M.; Montagné-Huck, C. Pests, wind and fire: A multi-hazard risk review for natural disturbances in forests. Ecol. Econ. 2023, 205, 107702. [Google Scholar] [CrossRef]
  11. Zheng, B.; Ciais, P.; Chevallier, F.; Yang, H.; Canadell, J.G.; Chen, Y.; van der Velde, I.R.; Aben, I.; Chuvieco, E.; Davis, S.J.; et al. Record-high CO2 emissions from boreal fires in 2021. Science 2023, 379, 912–917. [Google Scholar] [CrossRef] [PubMed]
  12. Korontzi, S.; Justice, C.O.; Scholes, R.J. Influence of timing and spatial extent of savanna fires in southern Africa on atmospheric emissions. J. Arid. Environ. 2003, 54, 395–404. [Google Scholar] [CrossRef]
  13. Sun, Y.P.; Zhang, Q.X.; Li, K.L.; Huo, Y.N.; Zhang, Y.M. Trace gas emissions from laboratory combustion of leaves typically consumed in forest fires in Southwest China. Sci. Total Environ. 2022, 846, 157282. [Google Scholar] [CrossRef]
  14. Romanov, A.A.; Tamarovskaya, A.N.; Gloor, E.; Brienen, R.; Gusev, B.A.; Leonenko, E.V.; Vasiliev, A.S.; Krikunov, E.E. Reassessment of carbon emissions from fires and a new estimate of net carbon uptake in Russian forests in 2001–2021. Sci. Total Environ. 2022, 846, 157322. [Google Scholar] [CrossRef] [PubMed]
  15. French, N.H.F.; Goovaerts, P.; Kasischke, E.S. Uncertainty in estimating carbon emissions from boreal forest fires. J. Geophys. Res. 2004, 109. [Google Scholar] [CrossRef]
  16. Song, R.; Wang, T.J.; Han, J.C.; Xu, B.Y.; Ma, D.Y.; Zhang, M.; Li, S.; Zhuang, B.L.; Li, M.M.; Xie, M. Spatial and temporal variation of air pollutant emissions from forest fires in China. Atmospheric. Environ. 2022, 281, 119156. [Google Scholar] [CrossRef]
  17. Shi, Y.S.; Zang, S.Y.; Matsunaga, T.; Yamaguchi, Y. A multi-year and high-resolution inventory of biomass burning emissions in tropical continents from 2001–2017 based on satellite observations. J. Clean. Prod. 2020, 270, 122511. [Google Scholar] [CrossRef]
  18. Michel, C.; Liousse, C.; Grégoire, J.M.; Tansey, K.; Carmichael, G.R.; Woo, J.H. Biomass burning emission inventory from burnt area data given by the SPOT-VEGETATION system in the frame of TRACE-P and ACE-Asia campaigns. J. Geophys. Res. 2005, 110, D09304. [Google Scholar] [CrossRef]
  19. Akagi, S.K.; Yokelson, R.J.; Wiedinmyer, C.; Alvarado, M.J.; Reid, J.S.; Karl, T.; Crounse, J.D.; Wennberg, P.O. Emission factors for open and domestic biomass burning for use in atmospheric models. Atmos. Chem. Phys. 2010, 11, 27523–27602. [Google Scholar] [CrossRef]
  20. Sannigrahi, S.; Pilla, F.; Basu, B.; Basu, A.S.; Sarkar, K.; Chakraborti, S.; Joshi, P.K.; Zhang, Q.; Wang, Y.; Bhatt, S.; et al. Examining the effects of forest fire on terrestrial carbon emission and ecosystem production in India using remote sensing approaches. Sci. Total Environ. 2020, 725, 138331. [Google Scholar] [CrossRef]
  21. Quan, Q.; Zhang, F.Y.; Meng, C.; Ma, F.F.; Zhou, Q.P.; Sun, F.B.; Niu, S.L. Shifting biomass allocation determines community water use efficiency under climate warming. Environ. Res. Lett. 2020, 15, 094041. [Google Scholar] [CrossRef]
  22. Hicke, J.A.; Asner, G.P.; Kasischke, E.S.; French, N.H.F.; Randerson, J.T.; Collatz, G.J.; Stocks, B.J.; Tucker, C.J.; Los, S.O.; Field, C.B. Postfire response of North American boreal forest net primary productivity analyzed with satellite observations. Glob. Chang. Biol. 2003, 9, 1145–1157. [Google Scholar] [CrossRef]
  23. Kurz, W.A.; Apps, M.J. A 70-Year retrospective analysis of carbon fluxes in the Canadian forest sector. Ecol. Appl. 1999, 9, 526–547. [Google Scholar] [CrossRef]
  24. Wu, Z.W.; Yan, S.J.; He, L.; Shan, Y.L. Spatiotemporal changes in forest loss and its linkage to burned areas in China. J. For. Res. 2020, 31, 2525–2536. [Google Scholar] [CrossRef]
  25. Guo, F.T.; Su, Z.W.; Wang, G.Y.; Sun, L.; Tigabu, M.; Yang, X.J.; Hu, H.Q. Understanding fire drivers and relative impacts in different Chinese forest ecosystems. Sci. Total Environ. 2017, 605–606, 411–425. [Google Scholar] [CrossRef] [PubMed]
  26. Zhao, H.X.; Gu, B.J.; Sarah, L.; Zhu, T.Y.; Fan, J.D. Regulation factors driving vegetation changes in China during the past 20 years. J. Geogr. Sci. 2023, 33, 508–528. [Google Scholar] [CrossRef]
  27. Hu, T.Y.; Zhou, G.S. Drivers of lightning- and human-caused fire regimes in the Great Xing’an Mountains. For. Ecol. Manag. 2014, 329, 49–58. [Google Scholar] [CrossRef]
  28. Fang, L.; Yang, J.; Zu, J.X.; Li, G.C.; Zhang, J.S. Quantifying influences and relative importance of fire weather, topography, and vegetation on fire size and fire severity in a Chinese boreal forest landscape. For. Ecol. Manag. 2015, 356, 2–12. [Google Scholar] [CrossRef]
  29. Xiong, Q.L.; Luo, X.J.; Liang, P.H.; Xiao, Y.; Xiao, Q.; Sun, H.; Pan, K.W.; Wang, L.X.; Li, L.J.; Pang, X.Y. Fire from policy, human interventions, or biophysical factors? Temporal–spatial patterns of forest fire in southwestern China. For. Ecol. Manag. 2020, 474, 118381. [Google Scholar] [CrossRef]
  30. Yuan, C.X.; Zhang, W.; Zhong, Y.H.; Lu, X.Y.; Liu, J.C.; Wahiduzzaman, M. North Atlantic forcing of autumn drought in Southwest China. Atmos. Oceanic. Sci. Lett. 2022, 15, 100152. [Google Scholar] [CrossRef]
  31. Sun, W.T.; Gao, X. Geomorphology of sand dunes in the Taklamakan Desert based on ERA5 reanalysis data. J. Arid. Environ. 2022, 207, 104848. [Google Scholar] [CrossRef]
  32. Vanella, D.; Longo-Minnolo, G.; Belfiore, O.R.; Ramírez-Cuesta, J.M.; Pappalardo, S.; Consoli, S.; D’Urso, G.; Chirico, G.B.; Coppola, A.; Comegna, A.; et al. Comparing the use of ERA5 reanalysis dataset and ground-based agrometeorological data under different climates and topography in Italy. J. Hydrol. Reg. Stud. 2022, 42, 101182. [Google Scholar] [CrossRef]
  33. Alves, C.; Gonçalves, C.; Fernandes, A.P.; Tarelho, L.; Pio, C. Fireplace and woodstove fine particle emissions from combustion of western Mediterranean wood types. Atmos. Res. 2011, 101, 692–700. [Google Scholar] [CrossRef]
  34. Ni, J.; Zhang, X.S.; Scurlock, J.M.O. Synthesis and analysis of biomass and net primary productivity in Chinese forests. Ann. For. Sci. 2001, 58, 351–384. [Google Scholar] [CrossRef]
  35. Lu, Z.; Zhang, Q.; Streets, D.G. Sulfur dioxide and primary carbonaceous aerosol emissions in China and India, 1996–2010. Atmos. Chem. Phys. 2011, 11, 9839–9864. [Google Scholar] [CrossRef]
  36. Laasasenaho, K.; Lensu, A.; Lauhanen, R.; Rintala, J. GIS-data related route optimization, hierarchical clustering, location optimization, and kernel density methods are useful for promoting distributed bioenergy plant planning in rural areas. Sustain. Energy Technol. Assess. 2019, 32, 47–57. [Google Scholar] [CrossRef]
  37. Marchetto, A.; Rogora, M.; Arisci, S. Trend analysis of atmospheric deposition data: A comparison of statistical approaches. Atmospheric. Environ. 2013, 64, 95–102. [Google Scholar] [CrossRef]
  38. Zhu, H.; Zhang, Z.; Yang, S.; Zhu, Z.P.; Zeng, A.C.; Guo, F.T. Temporal and spatial distribution of forest fire and the dynamics of fire danger period in southern and northern China: A case study in Heilongjiang and Jiangxi provinces. Chin. J. Ecol. 2023, 42, 198–207. [Google Scholar] [CrossRef]
  39. In, H.J.; Kim, Y.P. Estimation of the aerosol optical thickness distribution in the Northeast Asian forest fire episode in May 2003: Possible missing emissions. Atmos. Res. 2010, 98, 261–273. [Google Scholar] [CrossRef]
  40. Chen, Y.Z.; Chen, L.Y.; Cheng, Y.; Ju, W.M.; Chen, H.Y.H.; Ruan, H.H. Afforestation promotes the enhancement of forest LAI and NPP in China. For. Ecol. Manag. 2020, 462, 117990. [Google Scholar] [CrossRef]
  41. Wei, X.D.; Yang, J.; Luo, P.P.; Lin, L.G.; Lin, K.L.; Guan, J.M. Assessment of the variation and influencing factors of vegetation NPP and carbon sink capacity under different natural conditions. Ecol. Indic. 2022, 138, 108834. [Google Scholar] [CrossRef]
  42. Sun, J.; Fan, W.Y.; Yu, Y.; Wang, B.; Chen, C. Quantitative analysis of impact factors on net primary productivity of Tahe forest based on InTEC model. Chin. J. Appl. Ecol. 2019, 30, 793–804. [Google Scholar] [CrossRef]
  43. Filkov, A.I.; Ngo, T.; Matthews, S.; Telfer, S.; Penman, T.D. Impact of Australia’s catastrophic 2019/20 bushfire season on communities and environment. Retrospective analysis and current trends. J. Saf. Sci. Resil. 2020, 1, 44–56. [Google Scholar] [CrossRef]
  44. Van Lierop, P.; Lindquist, E.; Sathyapala, S.; Franceschini, G. Global forest area disturbance from fire, insect pests, diseases and severe weather events. For. Ecol. Manag. 2015, 352, 78–88. [Google Scholar] [CrossRef]
  45. Jin, Y.H.; Xu, J.W.; He, H.S.; Tao, Y.; Wang, H.Y.; Zhang, Y.J.; Hu, R.; Gao, X.; Bai, Y.Y.; Zhao, C.; et al. Effects of catastrophic wind disturbance on formation of forest patch mosaic structure on the western and southern slopes of Changbai Mountain. For. Ecol. Manag. 2021, 481, 118746. [Google Scholar] [CrossRef]
  46. Jenkins, M.J.; Runyon, J.B.; Fettig, C.J.; Page, W.G.; Bentz, B.J. Interactions among the Mountain Pine Beetle, Fires, and Fuels. For. Sci. 2014, 60, 489–501. [Google Scholar] [CrossRef]
  47. Souza-Alonso, P.; Saiz, G.; García, R.A.; Pauchard, A.; Ferreira, A.; Merino, A. Post-fire ecological restoration in Latin American forest ecosystems: Insights and lessons from the last two decades. For. Ecol. Manag. 2022, 509, 120083. [Google Scholar] [CrossRef]
  48. Kasischke, E.S.; Hyer, E.J.; Novelli, P.C.; Bruhwiler, L.P.; French, N.H.F.; Sukhinin, A.I.; Hewson, J.H.; Stocks, B.J. Influences of boreal fire emissions on Northern Hemisphere atmospheric carbon and carbon monoxide. Glob. Biogeochem. Cycles 2005, 19, 1–16. [Google Scholar] [CrossRef]
  49. Lü, A.; Tian, H.Q.; Liu, M.L.; Liu, J.Y.; Melillo, J.M. Spatial and temporal patterns of carbon emissions from forest fires in China from 1950 to 2000. J. Geophys. Res. 2006, 111, D05313. [Google Scholar] [CrossRef]
  50. Park, C.Y.; Takahashi, K.; Li, F.; Takakura, J.; Fujimori, S.; Hasegawa, T.; Ito, A.; Lee, D.K.; Thiery, W. Impact of climate and socioeconomic changes on fire carbon emissions in the future: Sustainable economic development might decrease future emissions. Glob. Environ. Chang. 2023, 80, 102667. [Google Scholar] [CrossRef]
  51. Phillips, C.A.; Rogers, B.M.; Elder, M.; Cooperdock, S.; Moubarak, M.; Randerson, J.T.; Frumhoff, P.C. Escalating carbon emissions from North American boreal forest wildfires and the climate mitigation potential of fire management. Sci. Adv. 2022, 8, 118–131. [Google Scholar] [CrossRef] [PubMed]
  52. Liu, Z.H.; Ballantyne, A.P.; Cooper, L.A. Biophysical feedback of global forest fires on surface temperature. Nat. Commun. 2019, 10, 214. [Google Scholar] [CrossRef] [PubMed]
  53. Fischer, R. The Long-Term Consequences of Forest Fires on the Carbon Fluxes of a Tropical Forest in Africa. Appl. Sci. 2021, 11, 4696. [Google Scholar] [CrossRef]
  54. Kadir, E.A.; Rosa, S.L.; Syukur, A.; Othman, M.; Daud, H. Forest fire spreading and carbon concentration identification in tropical region Indonesia. Alex. Eng. J. 2022, 61, 1551–1561. [Google Scholar] [CrossRef]
  55. Zhang, X.T.; Gui, K.; Liao, T.T.; Li, Y.F.; Wang, X.Y.; Zhang, X.L.; Ning, H.Q.; Liu, W.; Xu, J.J. Three-dimensional spatiotemporal evolution of wildfire-induced smoke aerosols: A case study from Liangshan, Southwest China. Sci. Total Environ. 2021, 762, 144586. [Google Scholar] [CrossRef]
  56. Lapola, D.M.; Pinho, P.; Barlow, J.; Aragão, L.E.O.C.; Berenguer, E.; Carmenta, R.; Liddy, H.M.; Seixas, H.; Silva, C.V.J.; Silva-Junior, C.H.L.; et al. The drivers and impacts of Amazon forest degradation. Science 2023, 379, 6630. [Google Scholar] [CrossRef]
  57. Gatti, L.V.; Basso, L.S.; Miller, J.B.; Gloor, M.; Domingues, L.G.; Cassol, H.L.G.; Tejada, G.; Aragão, L.E.O.C.; Nobre, C.; Peters, W.; et al. Amazonia as a carbon source linked to deforestation and climate change. Nature 2021, 595, 388–393. [Google Scholar] [CrossRef]
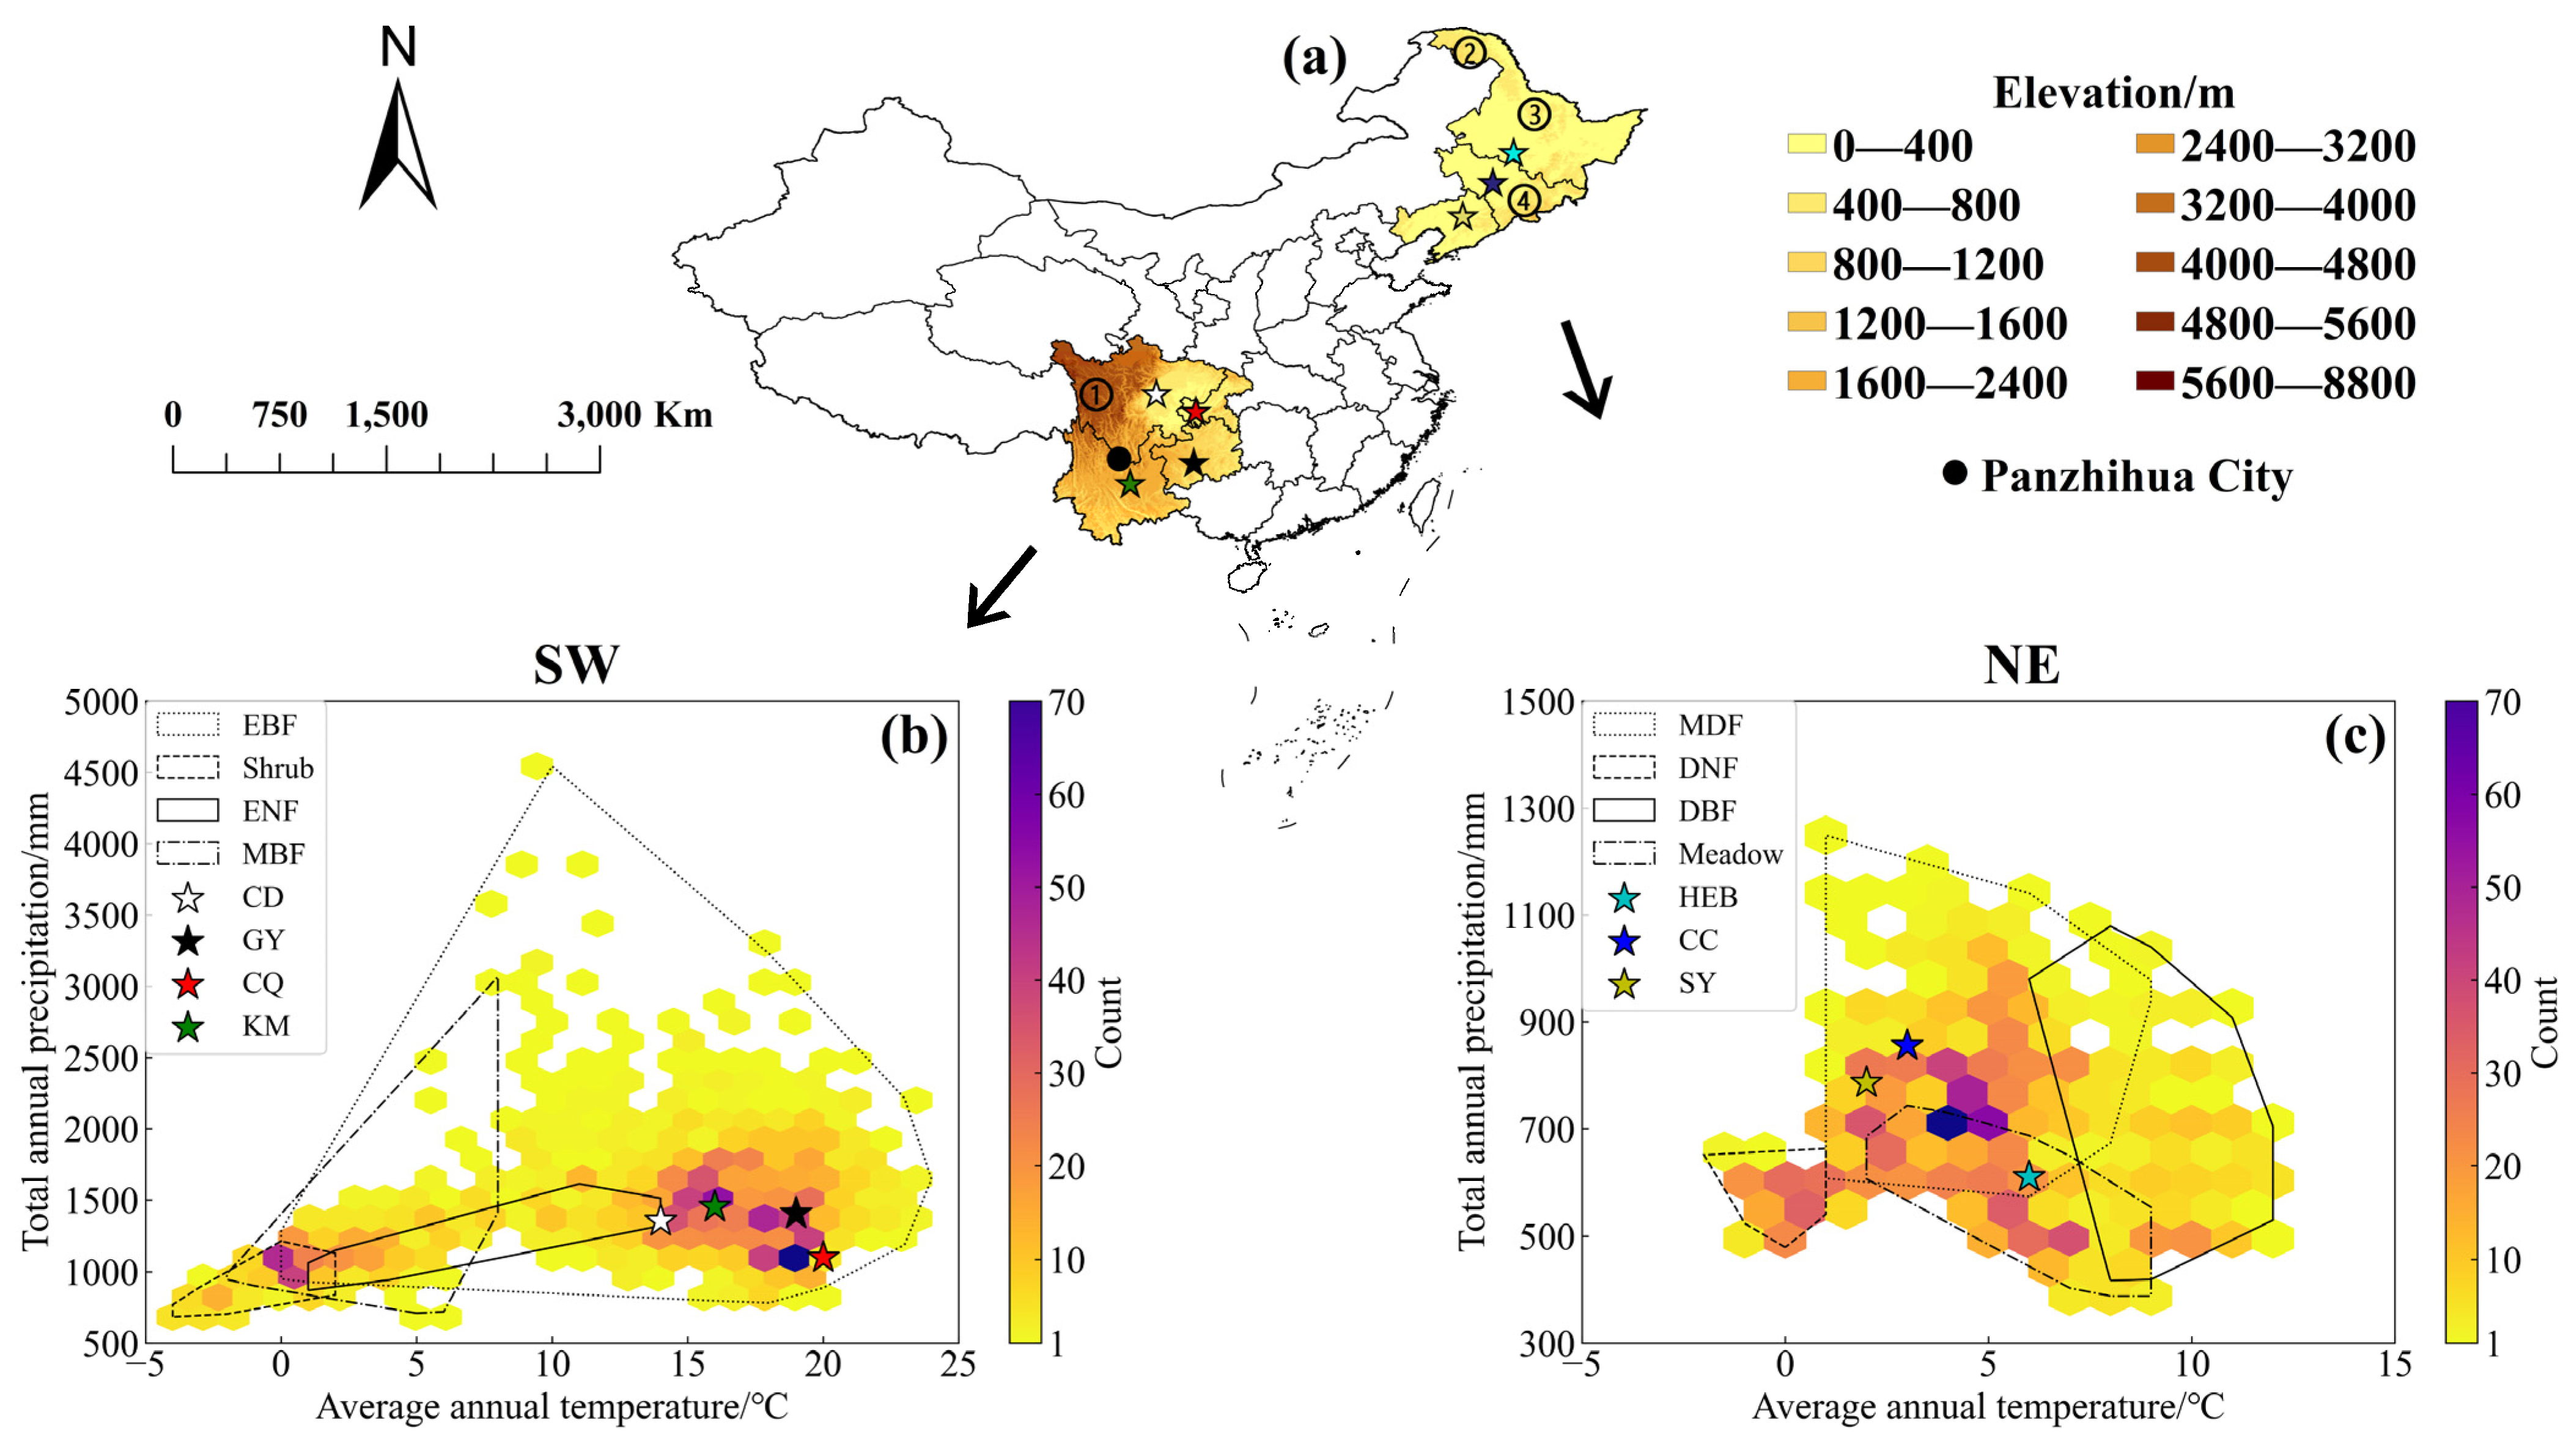
Figure 1. Overview of the two study areas in China (a) and comprehensive map of climatic vegetation in Southwest China (SW) (b) and Northeast China (NE) (c). In the map of China (a), label ① represents the western Sichuan Plateau, see the southwest region in the lower left corner of (a) (the big black dot represents Panzhihua City in Sichuan Province, which was the frequency forest fire area, and will be mentioned later in this paper); the label ②, ③, and ④ respectively represent the Daxing’anling and Xiaoxing’anling Mountains as well as Changbai Mountains, see the northeast region in the upper right corner of (a). Labels ① to ④ show the main landforms in northeast and Southwest China, with darker colors indicating higher elevations, see the elevation icon on the right of (a) (unit: m). The asterisks “☆” in (ac) and represent the provincial capital and are used to roughly represent the position of the province in (b,c). As shown in (b), the white, black, red, and green asterisk means Chengdu (CD) city in Sichuan Province, Guiyang (GY) city in Guizhou Province, Chongqing city (CQ) and Kunming (KM) city in Yunnan Province, respectively. The cyan, blue, and yellow asterisks in (c) means Harbin (HEB) city in Heilongjiang Province, Changchun (CC) city in Jilin province and Shenyang (SY) city in Liaoning Province, respectively. The dotted outlines and solid outlines in (b,c) represent the forest type boundaries, and the yellow, red, and purple hexagons therein represent the climate value distributions, with average annual temperature (unit: °C) on the horizontal axis and total annual precipitation (unit: mm) on the vertical axis. It is noticeable that the forest type data in (b,c) are from the Resource and Environment Science and Data Center of the Chinese Academy of Sciences (https://www.resdc.cn/data.aspx?DATAID=133, accessed on 1 March 2021), and are ecogeographic regionalization information based on the administrative map of China. Among them, the EBF means evergreen broadleaf forest, the ENF means evergreen needleleaf forest, the MBF means mixed evergreen-deciduous broadleaf forest, the DBF means deciduous broadleaf forest, the DNF means deciduous needleleaf forest and the MDF means mixed needleleaf-broadleaf deciduous forest. From the vegetation type distribution boundaries and climate values shown in (b,c), the corresponding climate characteristics of different forest species can be described.
Forests 14 00999 g001
Figure 2. A flowchart of the methods.
Forests 14 00999 g002
Figure 3. Interannual variation of forest fires from 2001 to 2020 (a) SW; (b) NE. The number of forest fire spots is represented by a solid blue line, see the right ordinate, unit: ×103; the burned area is expressed in orange columns, see the left ordinate, unit: ×104 ha. See Section 2.2.1 for the data sources of forest fire spots and burned areas and processing methods in this figure.
Forests 14 00999 g003
Figure 4. Annual average spatial distribution of forest fires from 2001 to 2020 (a) SW; (b) NE, the small red dots represent the burned area, and the filling color from yellow to dark brown represents the density distribution of the fire spot, unit: times/ha. The data sources in this figure are the same as in Figure 3.
Forests 14 00999 g004
Figure 5. The interannual change and trends of forest fire carbon emissions from 2001 to 2020 in the SW and NE, unit: ×102 Gg. The blue line represents the NE and the orange line represents the SW. The figure shows the carbon emission calculated from CO2, CO, and CH4, namely the data in columns 8 and 9 of Table 3. In fact, the trends of every carbonaceous gas emission are basically similar to this figure: CO2, CO, and CH4 emitted by forest fires in the SW remained basically unchanged in 20 years, with no significant trend. However, the three gases in NE all showed a similar downward trend as the blue line in this figure, meeting the requirement that p was less than 0.1.
Forests 14 00999 g005
Figure 6. Interannual variation change and trends of NPP from 2001 to 2020, with the unit as g C/m2·year. Blue represents the NE (refer to the right ordinate) and orange represents the SW (refer to the left ordinate). The data sources and processing methods of this figure are detailed in Section 2.2.2.
Forests 14 00999 g006
Figure 7. Spatial average annual distribution map of NPP from 2001 to 2020 (a) SW; (b) NE, with the unit as g C/m2·year. Different shades of yellow, green, and blue indicate the change in NPP per 200 g C/m2·year. By color code, the darker the blue color, the higher the NPP value, and the lighter the yellow color, the lower the value. The data source in this figure is the same as in Figure 6.
Forests 14 00999 g007
Figure 8. Interannual variation and trends of NPP in burned area from 2001 to 2020 in the NE and SW. Blue represents the NE (refer to the right ordinate) and orange represents the SW (refer to the left ordinate), the unit is g C/m2·year. The NPP data of forest burned areas in this figure were extracted by combining the forest fire burned area data in Section 2.2.1 with the NPP data in Section 2.2.2.
Forests 14 00999 g008
Figure 9. Scatter plot of annual mean NPP (unit: g C/m2·year) and carbon emissions (unit: Gg) in forest fire burned area from 2001 to 2020 (a) SW; (b) NE. The dots in the figure represent annual carbon emissions and NPP of burned area over a 20-year period, each figure has 20 groups of values. In this figure, carbon emissions data are from columns 8 and 9 of Table 3 and NPP data are from Figure 8.
Forests 14 00999 g009
Table 1. Biomass density and combustion efficiency for different forest type.
Forest TypeBiomass Density (Unit: Mg·ha−1)Forest Burning EfficiencyReferences
ENF365.8125%[18,33,34]
EBF248.5825%[18,34]
DNF159.1325%[18,34]
DBF120.3225%[18,34]
Table 2. Emission factors from different forest type (unit: g·kg−1) [19].
Forest TypeCO2COCH4
ENF15141186
EBF1643925.1
DNF15141186
DBF16301025
Table 3. Carbonaceous gases emissions and carbon emissions from forest fires in the SW and NE from 2001 to 2020 (unit: Gg).
YearCO2COCH4C
SWNESWNESWNESWNE
20012541.088022.77150.06502.158.0524.62756.652400.54
20021535.415040.9588.00316.514.7915.53455.991508.80
20038150.2932,268.90476.962126.6825.50105.252424.809706.01
20046602.917392.14376.62462.9520.5522.701960.152211.97
20058184.133357.43483.44210.3025.8210.312436.961004.67
20063790.003643.86228.86234.4712.2411.551130.891093.33
20076745.355419.50398.15339.5721.3216.652008.441621.77
20082795.136696.91172.92420.449.1720.62835.912004.42
20096611.594455.64399.99278.8221.0113.671972.881333.17
201031,259.063255.631859.45212.0398.0810.479313.07978.05
20112150.432685.81127.57168.196.888.25640.63803.67
20127576.70771.45455.6849.2224.252.422259.84231.27
20136504.592290.35403.22143.5821.377.041945.65685.41
20147804.502147.11487.11134.7325.666.612335.92642.61
20154205.474093.35251.24259.4313.3812.751253.541226.32
20164517.833576.77271.27223.8214.0610.971347.011070.20
20171428.283727.3295.47233.434.9111.44430.371115.34
20182574.814695.74158.45295.058.1314.47769.431405.57
20192673.836291.61162.86393.898.6419.31798.441882.59
20208242.433284.93549.49205.6528.8410.082483.37982.92
total125,893.82113,118.177596.787210.92402.65354.7037,559.9433,908.63
Disclaimer/Publisher’s Note: The statements, opinions and data contained in all publications are solely those of the individual author(s) and contributor(s) and not of MDPI and/or the editor(s). MDPI and/or the editor(s) disclaim responsibility for any injury to people or property resulting from any ideas, methods, instructions or products referred to in the content.