Article

Microbial Community and Enzyme Activity of Forest Plantation, Natural Forests, and Agricultural Land in Chilean Coastal Cordillera Soils

1
Facultad de Ingeniería y Negocios, Universidad Adventista de Chile, Chillán 3780000, Chile
2
Laboratory of Soil Microbiology Ecology and Biogeochemistry, Institute of Agri-Food, Animal and Environmental Sciences (ICA3), Universidad de O’Higgins, Rancagua 3070000, Chile
3
Centro de Sustentabilidad y Gestión Estratégica de Recursos (CiSGER), Facultad de Ingeniería, Universidad del Desarrollo, Las Condes 7610658, Chile
4
Laboratory of Conservation and Dynamics of Volcanic Soils, Department of Chemical Sciences and Natural Resources, Faculty of Engineering and Sciences, Universidad de La Frontera, Temuco 4780000, Chile
5
Network for Extreme Environment Research, Universidad de La Frontera, Temuco 4780000, Chile
6
Instituto de Bioquímica y Microbiología, Facultad de Ciencias, Universidad Austral de Chile, Valdivia 5090000, Chile
7
AUSTRAL-omics, Universidad Austral de Chile, Valdivia 5090000, Chile
8
Instituto de Investigaciones Agropecuarias, INIA-Quilamapu, Chillán 3800062, Chile
*
Author to whom correspondence should be addressed.
Forests 2023, 14(5), 938; https://doi.org/10.3390/f14050938
Submission received: 3 March 2023 / Revised: 2 April 2023 / Accepted: 13 April 2023 / Published: 3 May 2023

Abstract

:
Despite the global expansion of forest plantations in Chile, their effect on biology properties of soil has still been only scarcely studied. Land use change in the Chilean Coastal Cordillera (36° to 40° S) is mainly attributed to the conversion of native forest to agriculture and forest plantations (Eucalyptus globulus and Pinus radiata de Don). The aim of this paper was to evaluate the changes in microbial composition (PCR-DGGE) and enzyme activity after the substitution of a native forest (e.g., Nothofagus spp.) by fast-growing exotic species and cropping. The most important factors that influence the abundance and diversity of bacteria and the fungi community were the soil organic matter (SOM) content, phosphorous (P-Olsen), calcium (Ca), boron (B), and water-holding capacity. These variables can better predict the microbial community composition and its enzymatic activity in the surface Ah horizon. Land use change also affected chemical soil properties of biogeochemical cycles. However, to deeply understand the connection between chemical and physical soil factors and microbial community composition, more research is needed. On the other hand, the expansion of forest plantations in Chile should be subject to legislation aimed to protect the biological legacy as a strategy for forest productivity as well as the soil microbial biodiversity.

1. Introduction

Increasing land conversion rates from native forest to forest plantations and agriculture land has led to the widespread and dramatic degradation of forest ecosystems worldwide [1]. This has promoted a decline in forest biodiversity, primary productivity, carbon sequestration, freshwater supply, ecological value, and ecosystem services [2,3,4].
Numerous reports have emphasized that changes in land use influence soil fertility and soil organic matter (SOM) even for redox controls [5,6]. Many others, e.g., Baldrian [5], state that SOM transformation depends on the soil microorganisms’ activity, mainly fungi and bacteria. The understanding of these microbe-mediated processes is critical in maintaining the role of ecosystem services provided by forests [7], e.g., the biogeochemical cycles of carbon (C), phosphorus (P), and nitrogen (N). While plants are the key drivers of C uptake from the atmosphere in forests, soil microorganisms play an essential role as symbionts, pathogens, and organic matter decomposers, which influences the C turnover and the availability of other nutrients [5,8]. Therefore, most research on forest soil ecology has focused on fungi, which are considered the primary decomposers in forest soils because of their ability to produce a wide range of extracellular enzymes [7,9]. Thus, fungi play a pivotal role in P and C mobilization and sequestration in forest soil [10]. However, recently, most studies have focused on bacteria’s role as the principal agents for the biogeochemical cycling of forest ecosystems [5,7]. Bacteria are the primary natural agents involved in nitrogen fixation [7,11], as well as being responsible for mineral weathering that releases nitrogen and inorganic nutrients into the soil [11,12]. Accordingly, bacteria and fungi should not be viewed separately [7].
Chile has the largest area of temperate forest in South America, comprising more than half of the total area of the southern hemisphere [13]. Nevertheless, Chile’s temperate forests are being harvested to supply the increasing global demand for wood and paper products through its conversion to crop- and grassland, human settling, fires, selective logging, and other logging practices [14]. Central Chile has lost more than 80% of its original vegetative cover, making it the most deforested region in Latin America [15,16]. Therefore, soils have been eroded, and the ecosystem services provided by native forests have been reduced, mainly in the soils of the Chilean Coastal Range [2,17,18,19,20,21]. Despite this, the effects of land use change of native temperate rainforest on exotic plantations in southern latitudes on soil microorganisms (fungal and bacteria diversity) and enzyme activities have been scarcely studied [22,23]. This inevitably hampers the human ability to mitigate anthropogenic influences on this unique ecosystem, as bacteria and fungi is essential for the prediction of the forest response to future environmental conditions [24].
In this study, we investigated the impact of land use on soil enzyme activities and microbial communities (abundance and diversity) of bacteria and fungi after replacing native Nothofagus spp. forests, mixed with sclerophyllous species, with fast-growing exotic species and crops in the Chilean Coastal Cordillera soils. We hypothesized that the soil microbial community and enzyme activities are affected by the alteration of nutrient pools induced by land use change from native Nothofagus forests to plantations under non-intensive management. Thus, we want to answer the following research question: which physicochemical properties factors explain the differences in the microbial community composition and enzyme activities associated with land use practices (native forest versus monoculture eucalyptus plantations and conventional agriculture)?

2. Materials and Methods

2.1. Site Description and Soil Sampling

This research was conducted in south-central Chile (37°18′ S and 73°28′ W) (Figure 1). Soil samples were taken from different vegetation covers and land use areas. Four permanent plots (25 m × 20 m) were delimited in a native forest (NF), a young plantation (YP), an adult plantation (AP), and agricultural crops (AC). The NF was a degraded transition forest of Nothofagus obliqua (Mirb) Oerst and sclerophyllous species (e.g., Cryptocarya alba Mol. Looser, Lithraea caustica Molina Hook et Arn). The YP was a four-year-old second rotation of Eucalyptus globulus Labill. The AP was a ten-year-old plantation of the first rotation of E. globulus, and the AC was an agricultural area used to produce cereals (annual crops) and potatoes. According to the USDA classification, the soil was a typical mesic Humic Hapludults [25].
In each study area, we randomly selected three different plots, and from each plot we collected a composite sample (from five soil samples) from the Ah (0–20 cm deep approx.) and Bh horizons (20–55 cm deep approx.), respectively. The sampling was repeated three times per horizon (two horizons) and vegetation cover (four), totaling 24 soil samples. Soil samples were transported to a laboratory where the soil was sieved (2 mm) and debris and stones were removed. Visible coarse organic materials were removed through handpicking. Afterward, soil samples were stored at 4 °C for biological analysis. For the total DNA extraction and for further studies, soil samples were kept at −20 °C. Soil sampling were performed in autumn 2015.
Bulk densities were determined by pushing steel cylinders with a known volume (200 cm3) into the undisturbed soil [26]. Soil weight was determined after drying it at 105 °C for 48 h. Soil texture was determined using the Bouyoucos method [27]. Soil samples were analyzed for total organic C using the Walkley–Black method [28]. Soil organic matter (g kg−1) was determined from organic C, using a conversion factor of 1.724, assuming that organic matter contains approximately 58% organic C [28]. Subsequently, NO3 (mg N kg−1) was extracted with 2 mol L−1 KCl and determined by distillation with Devarda alloy and titration with H2SO4 (0.0025 mol L−1), according to Sadzawka et al. [27]. Soil pH was measured in H2O at a 1:2.5 soil solution ratio, with a glass electrode pH meter, following the methods described by Hirzel et al. [29]. Available phosphorus was extracted with 0.5 M sodium bicarbonate (pH 8.2), according to Olsen et al. [30], and amorphous Al and Fe were extracted with a 0.2 M ammonium oxalate/oxalic acid buffer of pH 3.0 [31] and were determined using atomic absorption spectrometry (Shimadzu AA-6200, Germany). To measure the bases, K, Ca, and Mg were determined according to Rivas et al. [32].

2.2. Soil Enzyme Activities

Enzyme and microbiological soil activities were measured over fresh soil samples or stored for a short time at 4 °C. Samplings were carried out for two years every three months (January 2014 to January 2016). According to Wu et al. Campo [33], the cellulase activity was determined using carboxymethyl cellulase as a substrate. Soil cellulase activity was determined spectrophotometrically at 595 nm and expressed as µg of glucose g−1 dwt 24 h−1. Soil urease activity was determined by staining the ammonium released into the incubation solution at 37 °C for two hours, according to Pinto-Poblete et al. [33], using urea as substrate. Soil urease was determined spectrophotometrically at 660 nm after treating the incubated soil sample with KCl and HCl. The soil urease activity was expressed as µg NH4+-N g−1 dwt 2 h−1 of soil. The hydrolysis of fluorescein diacetate (FDA) was analyzed according to Khadem et al. [34], using fluorescein diacetate (1000 µg mL−1) as substrate. Fluorescein was measured with a spectrophotometer at 490 nm. The FDA activity was expressed as µg of fluorescein g−1dwt h−1. All activities were measured in triplicate.

2.3. DNA Extraction

Smaller soil samples of 0.2–0.3 g were processed for DNA extraction using the PowerSoil® DNA Isolation Kit (MoBio Laboratories, Inc., Carlsbad, CA, USA) following the manufacturer’s protocol and mechanical disruption via bead beating (FP120; Q-biogene Inc., Carlsbad, CA, USA). The quality of DNA was evaluated by agarose gel electrophoresis. Final DNA extracts were eluted into 50 mL of sterile H2O and stored at −20 °C. All DNA analyses were conducted on 10-fold dilutions (working solution) held at −20 °C.

2.4. Microbial Community Analyses

The effect of soil land use on the composition of bacterial and fungal communities was evaluated by polymerase chain reaction–denaturing gradient gel electrophoresis (PCR–DGGE). For this, 16S rRNA and 18 rRNA genes were amplified using the primer sets EUBf933-GC/EUBr1387 for bacteria and NS1/NS8 and NS7-GC/F1Ra for fungi. A PCR–DGGE analysis was carried out as described previously by Jorquera et al. [35]. The PCR–DGGE analysis was performed in a 9% (w/v) polyacrylamide gel with a gradient of 55 to 70% for bacteria and 30 to 60% (urea and formamide) for fungi. The electrophoresis was run for 12 h at 100 V, after which the gels were stained with SYBR Gold (Molecular Probes, in vitro gen Co.) for 30 min and photographed on a UV transilluminator. Each band was inferred to represent a distinct operational taxonomic unit (OTU), and band intensity was used to indicate relative abundance [36]. Representative bands in DGGE gels were carefully cut out; run again in DGGE gel after re-amplification, to ensure that the excised bands did not contain multiple bands; and then sequenced by Macrogen, Inc. (Seoul, South Korea) [35]. The nucleotide sequences were assembled and edited in Sequencher® version 5.4.6. The sequences of the nearest species for each isolate were retrieved from the Gen Bank database from the National Center for Biotechnology Information (NCBI).

2.5. Statistical Analysis

The results of PCR–DGGE were analyzed using the multivariate statistics software Primer V.7 (Primer-E Ltd., Plymouth, UK). The PCR–DGGE band profiles were compared, and the dendrograms were generated. The similarity matrix was calculated using Bray–Curtis similarity and visualized using non-metric multidimensional scaling (nMDS) (Primer-E Ltd., Plymouth, UK).
A two-way ANOVA was used to evaluate the effect of the soil land use and soil horizons on the physic-chemical properties, richness, and Shannon–Wiener index of bacteria and fungi. Regarding enzyme soil activities, a three-way ANOVA was used to evaluate the effect of the soil land use, soil horizon, and season (for two years) (Table S1). All databases were tested for variance homogeneity and normal distribution. The non-normal distribution of data were transformed. In cases where a significant influence of soil use, horizon, season, or the interactions between these factors was found, post hoc Tukey’s tests were carried out to assess differences (p < 0.05). Additionally, Pearson’s correlation analysis was performed on each of the response variables to determine which were correlated and then to consider their use in model building (Table S2).
The relationship between soil variables, PCR-DGGE banding patterns, and enzyme activities was used to identify the variables for predicting microbial measures through multiple regression models. In this context, a PCA was carried out to explore the data and detect variables representing the most variable contributions. Multiple regression models were built for biological variables (enzyme activities and community attributes). All these analyses were carried out in R v3.4.3 with RStudio v1.1.383. During modeling, predictors were compared using correlation coefficients and their significance; multicollinearity was avoided by carefully selecting non-redundant explanatory variables, which were highly correlated with response variables. The modeling procedure was stepwise and manual, using a combination of model building and simplification. The first model was built from the null model (the mean), adding terms in order of explanatory power defined as the change in the residual sum of squares, resulting from adding individual terms to the current model. Only the response variables that presented significant correlations (p < 0.05) among the explanatory variables were considered. Finally, the model-building process ended when no more terms were significant, and the Akaike information criterion (AIC) was reduced insofar as possible.

3. Results

3.1. Soil Physicochemical Properties

The physicochemical properties of studied soils under different vegetation (native forest, young plantation, adult plantation, and agricultural crop) are shown in Table 1 and Table 2. The four studied ecosystems presented different textural classes: NF and YP are grouped as clay soils, while AP and AC as sandy–clay–loam soils in the Ah horizon. In the first horizon, field capacity, and permanent wilting point differed under different vegetation compositions; NF presented the highest field capacity and permanent wilting point, even when adjacent to YP. No differences in bulk density were found among sites (Table 1). Regarding the chemical characteristics of the different types of soils in the first horizon (Ah), NF displayed the highest MOS, Mn, Zn, Cu, and N contents, compared with YP, AP, and AC (Table 2). Nutrient contents were generally higher in clay soils than in sandy–clay–loam soils (Table 2). In the Bt-h horizon, there were no significant differences among land uses except for Al and Mn (Table 1 and Table 2).

3.2. Enzyme Activities

The soil enzyme activities for each season, land use, and horizon from 2014 to 2016 are presented in Figure 2. Different vegetation compositions or land use changes induced alterations in the soil enzyme activities. NF showed the highest values in almost all soil enzymes studied, especially contrasting NF versus AC in the A-h horizon. The enzyme activities slightly decreased in B-h (Figure 2). Moreover, significant effects (p < 0.05) for land use, horizon, season, and some significant interactions were found (Table S6). However, significant interactions among the three factors (ecosystem, depth, and season) were found only for cellulase
Urease activity (mean ± SE) across different seasons and soil horizons was significantly higher in NF (187.82 ± 22.37 µg NH4N g−1 dwt−1) and YP (155.6 ± 19.6 µg NH4N g−1 dwt−1) compared with AP (51.4 ± 7.9 µg NH4N g−1 dwt−1) and AC (52.2 ± 5.8 µg NH4N g−1 dwt−1). Regarding FDA activity (mean ± SE), this enzyme activity was the most sensitive among changes in land use systems (Figure 2). From summer 2014 (S-15) to winter 2016 (W-15), NF presented higher FDA activity (417.2 ± 23.4 µg of fluorescein g−1 dwt h−1) than that shown by AC (105.6 ± 17.9 µg of fluorescein g−1 dwt h−1) and YP (317.9 ± 30.6 µg of fluorescein g−1 dwt h−1). Non-significant differences were found between YP and AP (358.1± 30.2 µg of fluorescein g−1 dwt h−1). On average, FDA and urease activities were higher in NF, except for some exceptions. On the other hand, the mean ± SE of cellulase activity for the whole study period was 82.7 ± 10.3 µg glucose g−1 dwt 24 h−1 in NF, 51.38 ± 7.9 µg glucose g−1 dwt 24 h−1 in YP, 45.91 ± 5.6 µg glucose g−1 dwt 24 h−1 in AP, and 26.9 ± 4.4 µg glucose g−1 dwt 24 h−1 in AC. Cellulase activity was significantly higher in NF than in plantation and agricultural soil (Figure 2).

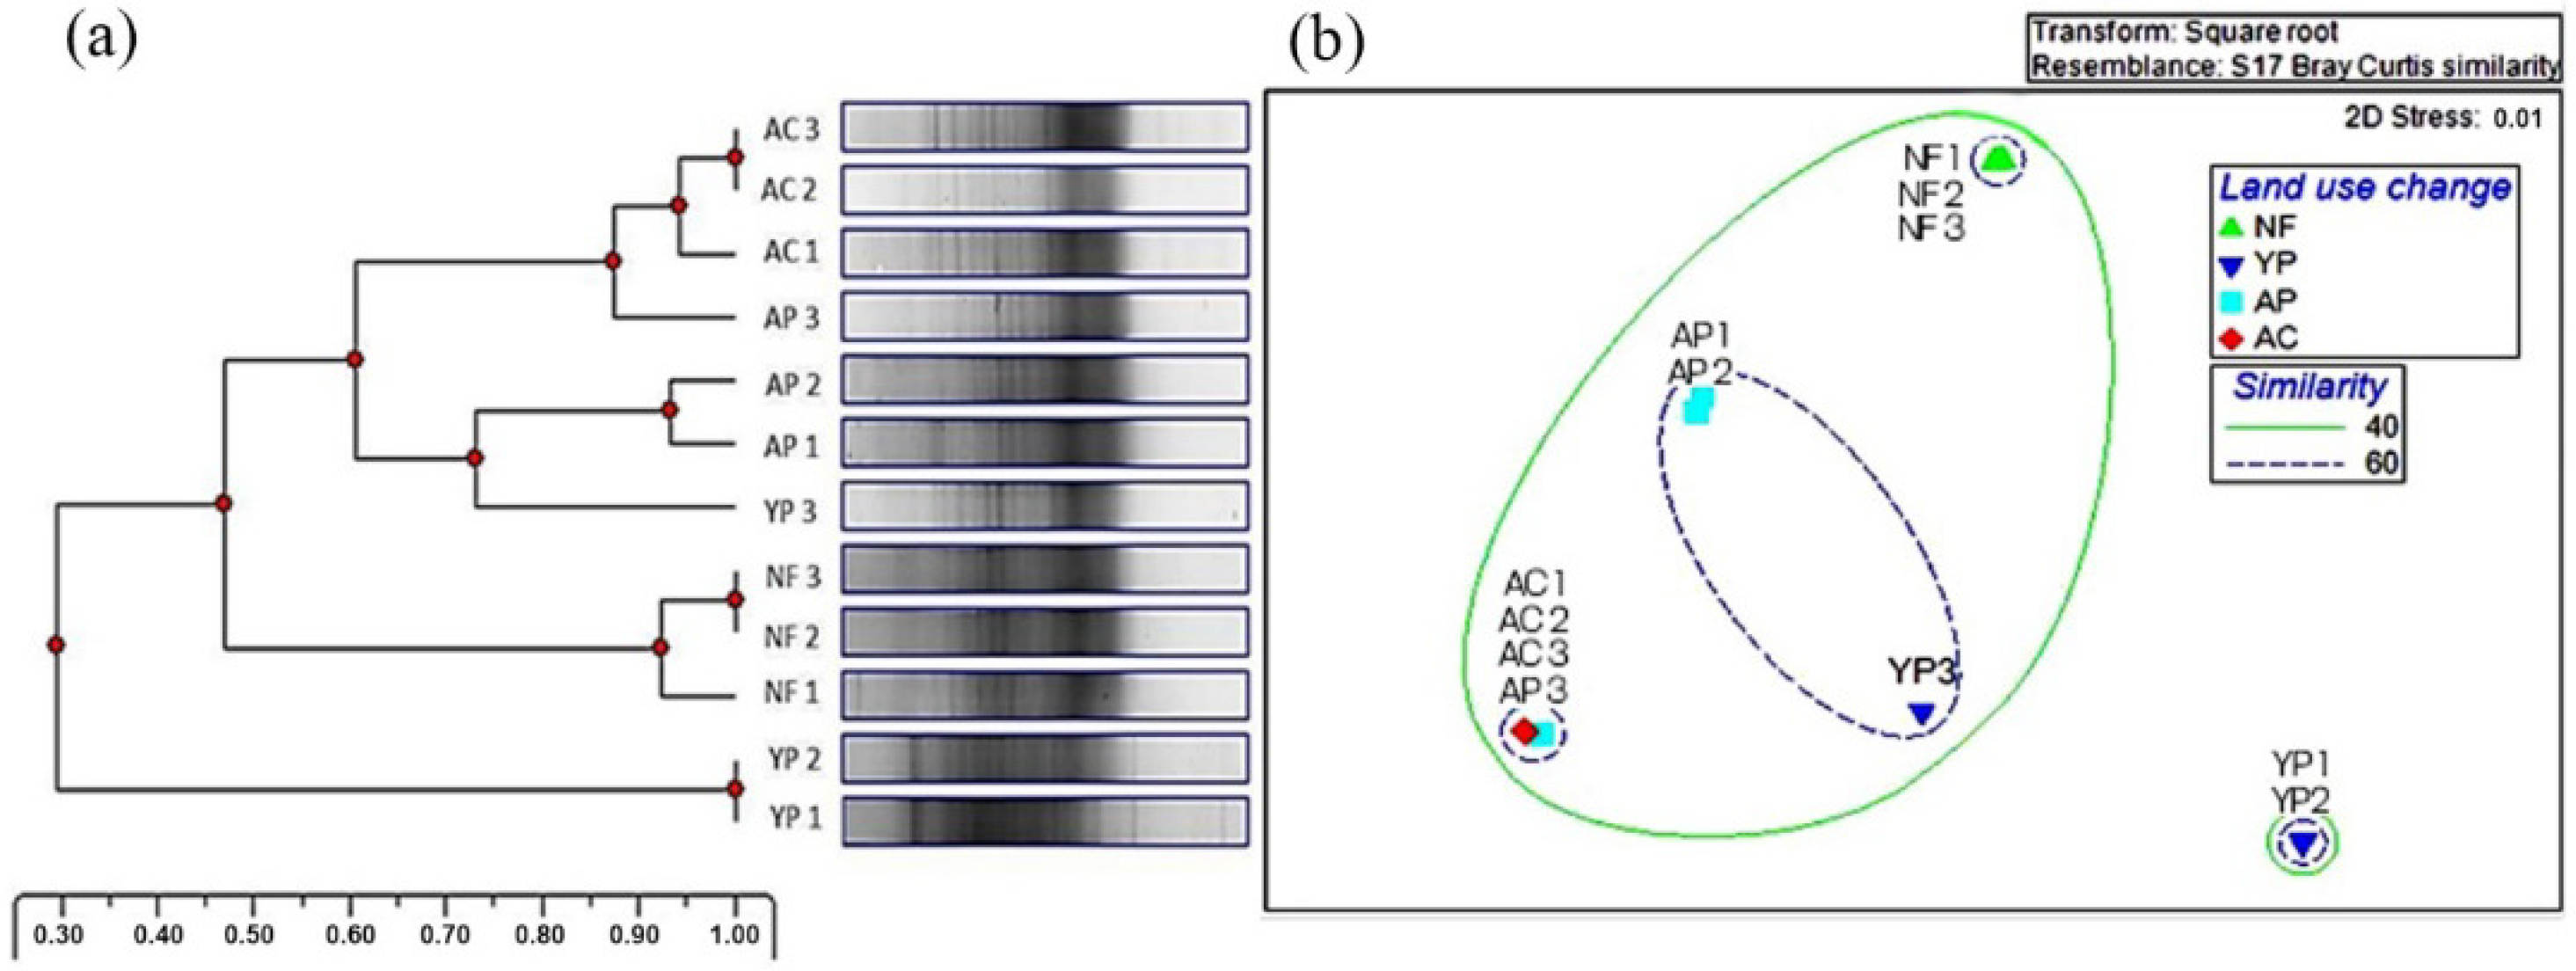
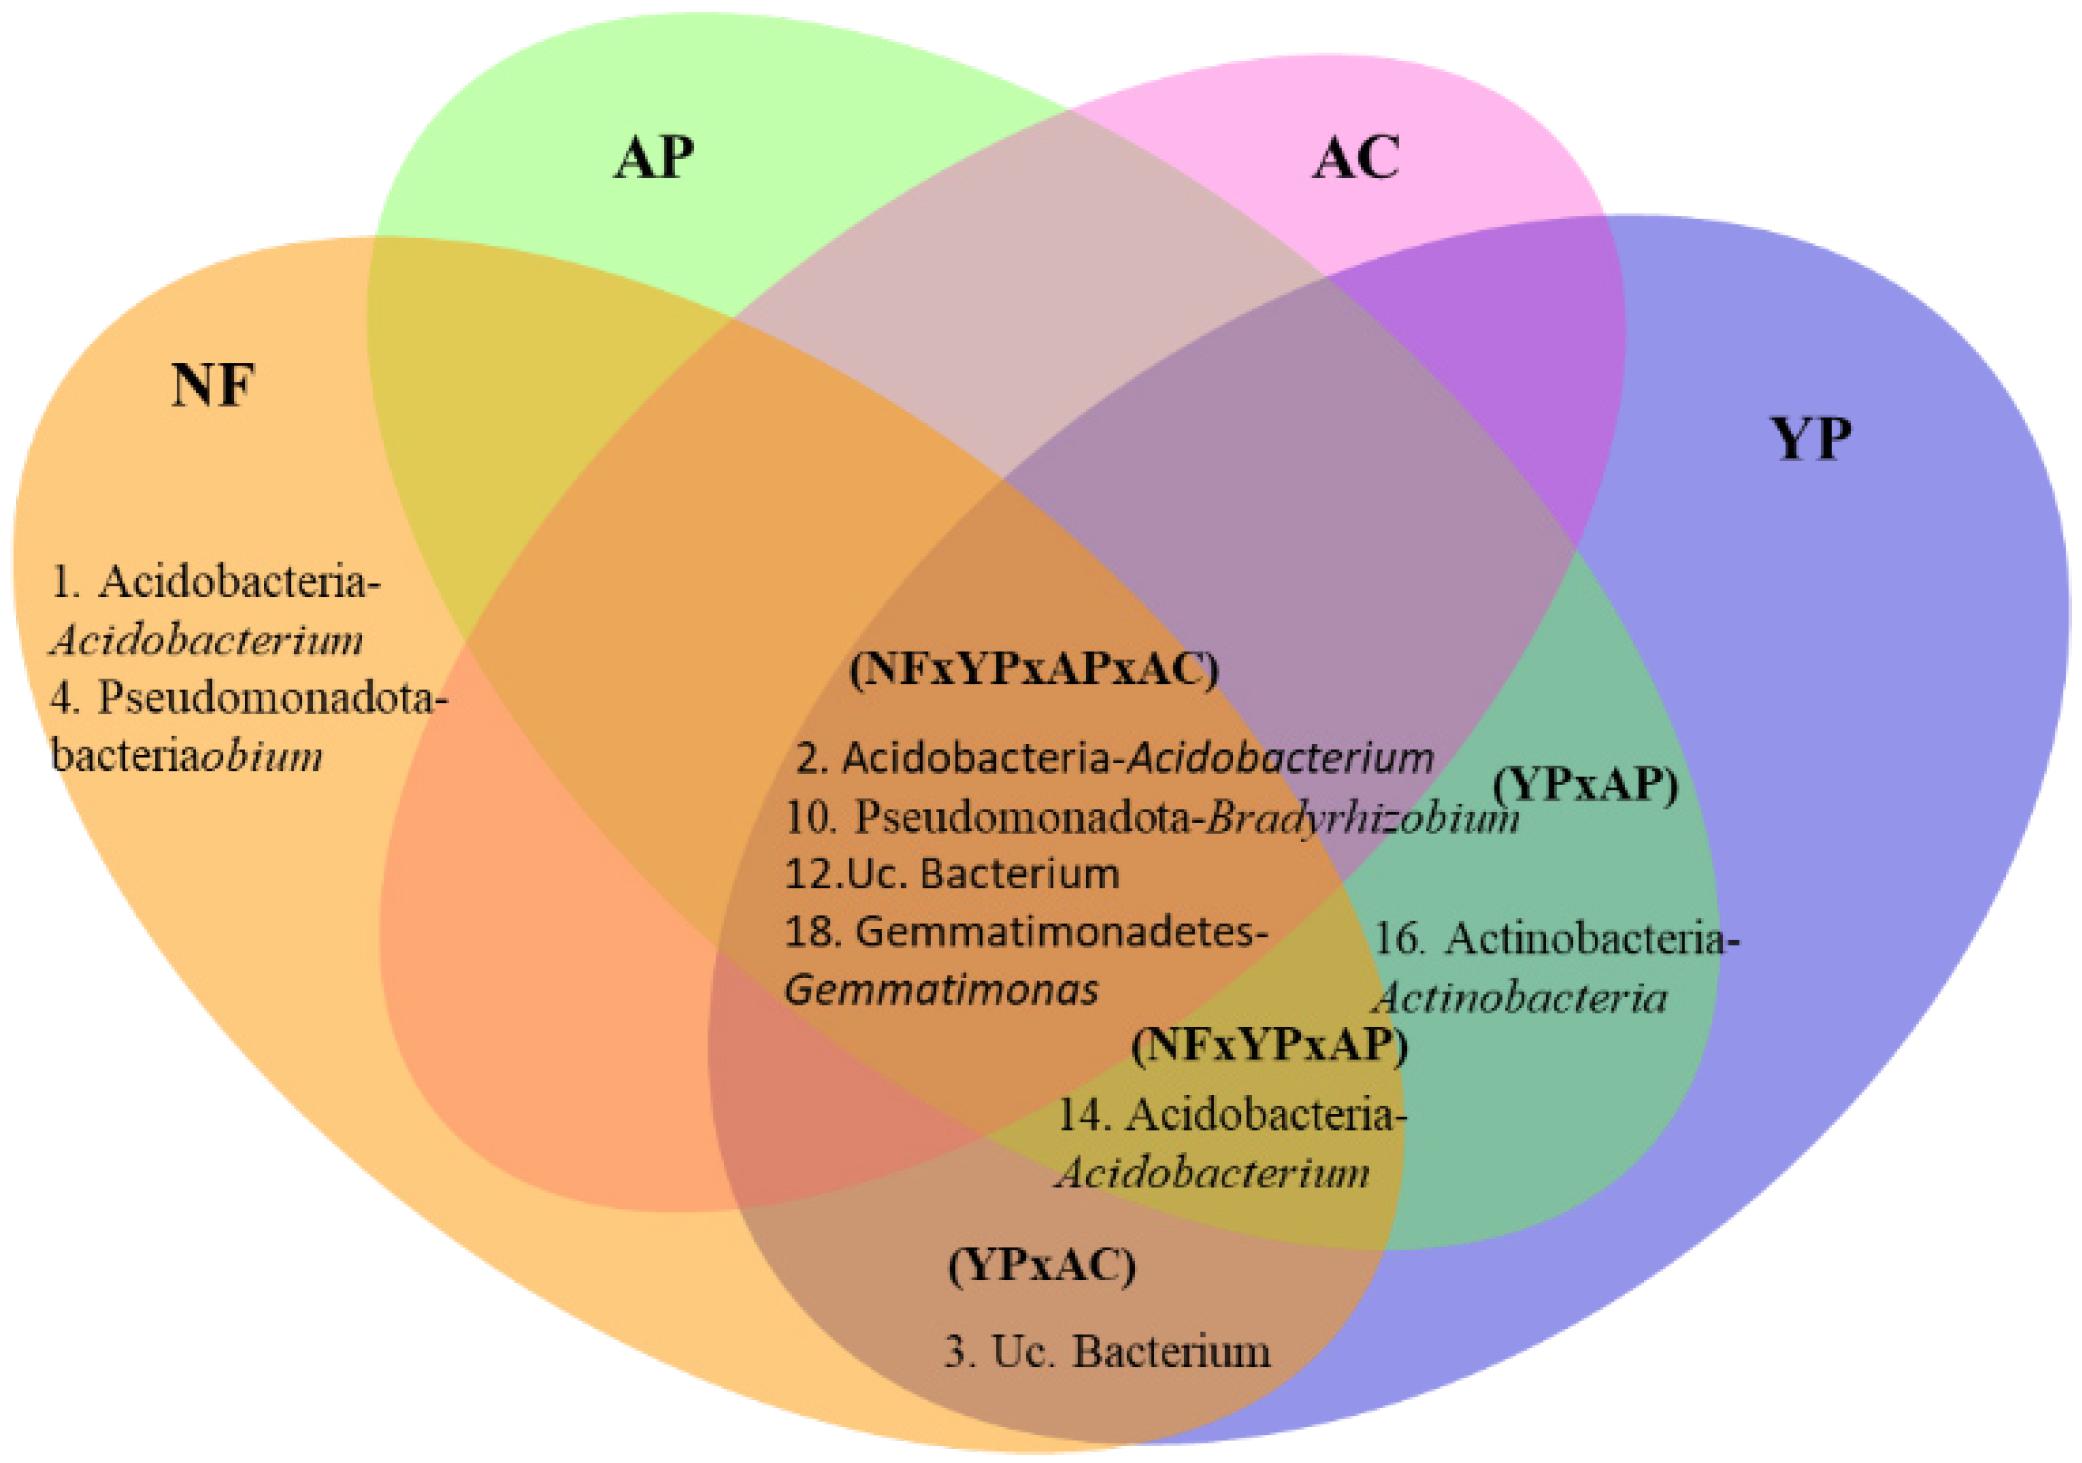
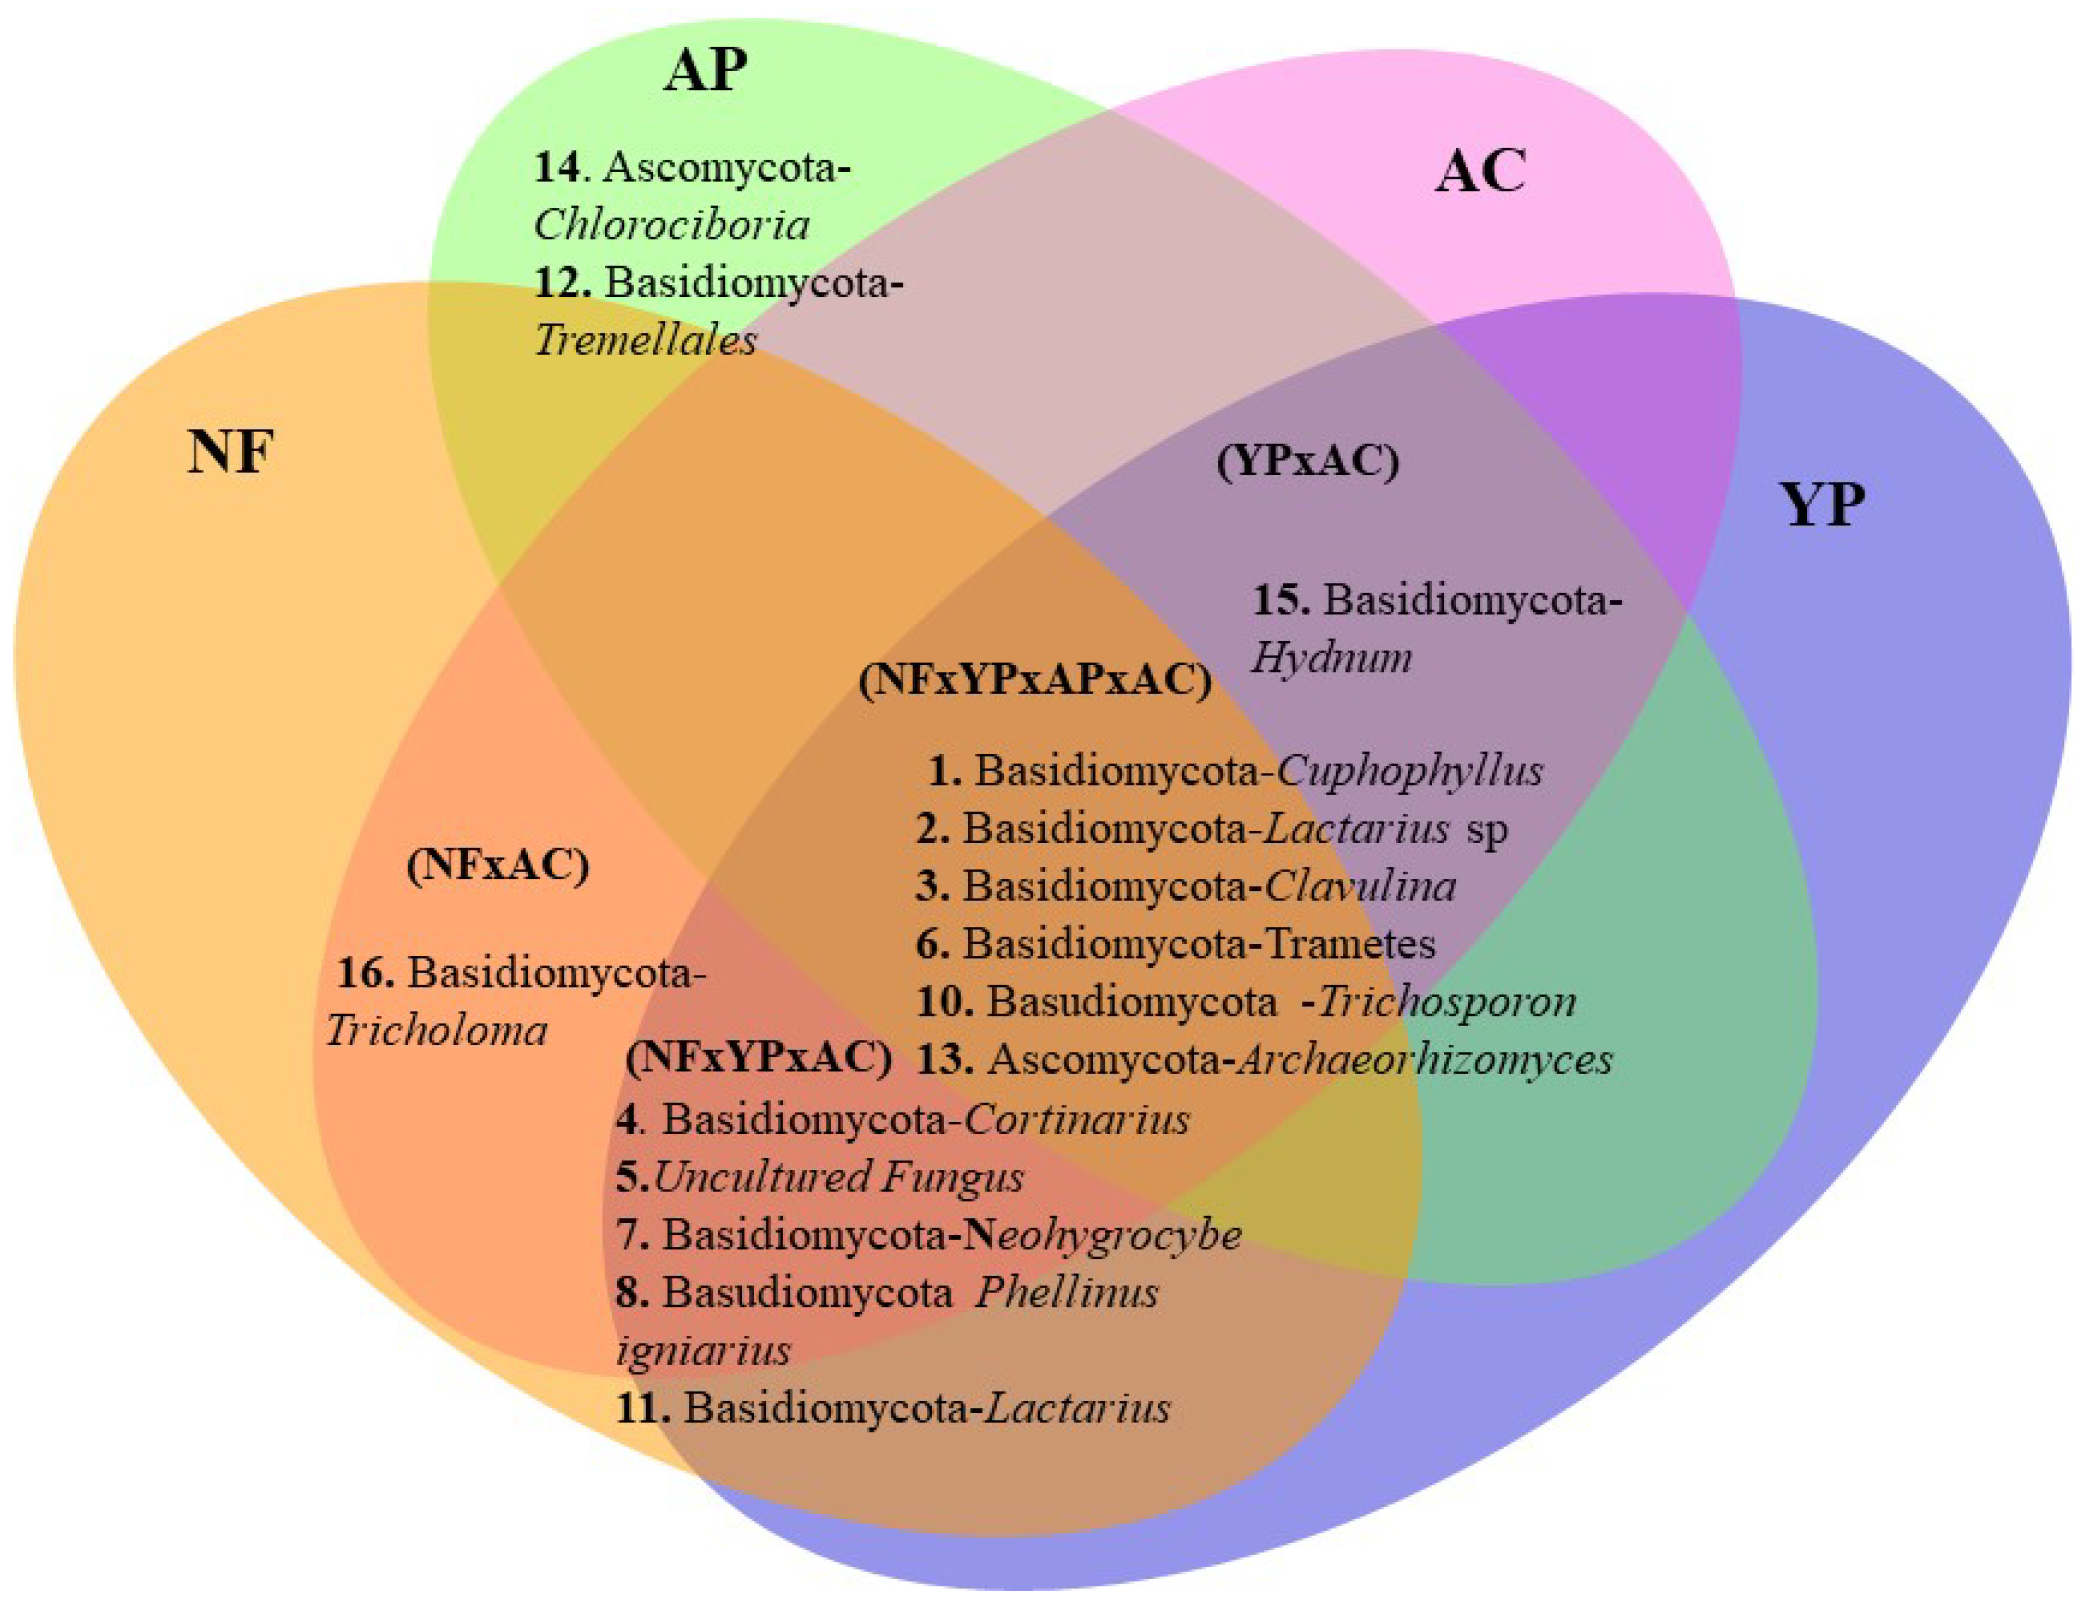
3.3. Bacterial and Fungal Community Structure, Biodiversity Index, and Species Composition

Cluster analysis and non-metric multidimensional scaling (nMDS) studies were used to find similarities (grouping) of bacterial and fungal communities among soils from the studied land uses. In total, 61 unique PCR-DGGE banding positions were identified for bacterial communities in both horizons (A-h and B-h) (S3 and S4), and 49 unique DGGE banding positions for the fungal community were found in the two horizons throughout the whole study (S5 and S6). The cluster analysis and nMDS from bacteria (Figure 3a and Figure 3b, respectively) showed a similarity of 80% between AP and AC. Moreover, NF is another group that shares 50% similarity only with AP and AC. YP is a different group. However, in the second horizon, the cluster and nMDS analyses did not show a separation between soils or land uses (Figure 4a,b).
The cluster analysis and nMDS analysis of the fungal community are shown in Figure 5 and Figure 6. Fungal community structures were less grouped to land use than bacterial communities were. In the A-h horizon, the nMDS reveals that fungal communities varied in their design among study areas, as the similarity was only 40%. The exception was AC (Figure 5a,b), which was completely separated from the rest of the treatments. Nevertheless, similitude in fungi communities between NF and YP was observed, possibly due to their close location. In the second horizon (Figure 6), a minor separation of the NF, YP, and AC communities was observed. The exception was AP, which was completely separated from the rest of the treatments.
Bacterial and fungal richness and the Shannon–Wiener index are shown in Table 3. The highest bacterial richness was found in NF (13.00), YP (13.00,), and AP (11.67) in the A-h horizon. However, no differences between land use or between soil horizons (A-h and B-h) were found. The highest Shannon–Wiener index of bacteria was found in NF (2.56) and YP (1.86) in the Ah horizon; significant differences were observed between these only. Regarding diversity indices in fungi, the richness index was higher in the B-h of NF (12.67) and AC (11.67) (Table 3), but we only found significant statistical differences with respect to AP. The Shannon–Wiener index was higher in the B-h of NF (2.47), although significant statistical differences were only found with regard to AC (1.87) in the A-h horizon.
The bacterial and fungal species compositions in the study of different soil uses are shown in Figure 7, Figure 8, Figure 9 and Figure 10. According to the nucleotide similarity range between the sequences, it was only possible to assign them at the genus level or lower (GenBank database). We found nine bacteria operational taxonomic units (OUTs) in the A-h horizon. Eight of these nine identified OTUs were present in NF, seven in YP, six in AP, and four in AC. However, there were four OTUs in common (Figure 7). For B-h, the bacterial composition was higher than in A-h, showing sixteen OTUs. They found fifteen bacteria in NF, nine in YP, ten in AC, and ten in AP. Only four species in common were present in all four study areas, as shown in Figure 8.
For fungi, the total number of OTUs identified in the first horizon was seventeen. Of these seventeen OTUs, twelve were present in NF, seven OTUS in YP, eight OTUs in AP, and seven OTUs in AC. Only two OTUs were common to all treatments (Figure 9). In B-h, the number of identified OTUs was sixteen. Of these sixteen OTUs, thirteen were found in NF, eleven in YP, nine in AP, and twelve in AC (Figure 10). There were six OTUs common to all treatments.

3.4. Drivers of Richness, Shannon–Wiener Index of Bacterial, Fungal, and Enzyme Activities

The results indicate that there are significant correlations between certain soil factors and the two PCA axes. As shown in Figure 11, the percentage of “eigenvalue” for the first axis and second axis of PCA are about 39.2% and 18.3% respectively. The first component (39.2%, axis 1) was based on variation in SOM, N, P, Ca, S, Mn, Zn, Mg, Na, and the sum of the bases Cu and B. The second component, accounting for 18.3% of the variation, separated soil by silt, clay, sand, aluminum saturation, and Fe. According to this multivariate exploratory analysis, the arrangement separated NF and YP from AC, AP, and the spatial segregation of samples. Thus, NF was linked to higher fungi diversity, FDA, urease, S availability, and clay content. YP was linked to bulk density, richness B, and Al concentration. AP and AC were mainly associated with PWP, field capacity, and K saturation.
The predictive models for every index of diversity and enzyme activities are shown in Table 4. For bacterial richness, the best model, according to the statistical significance level, correlation among variables and reduced AIC value, may be predicted at 55%; variables Ca and Zn were inversely correlated with bacterial richness, whereas NO3, P-Olsen, and available S were positively correlated. The Shannon–Wiener index of bacteria is explained at 56% by the same variables and association as bacterial richness.
Concerning fungi, their diversity was better explained at 53% through the lineal and negative association with NO3 and silt percentage in the soil and positive association with field capacity. Regarding fungi abundance, NO3 and silt were inversely correlated, whereas P-Olsen, sand, and field capacity were positively correlated with fungi abundance. These variables may explain 65% of fungi abundance.
Regarding the variation in enzyme activity, it was found that more than 80% of the variation in cellulase activity could be explained by the positive association among variables P Olsen, N-NO3, and field capacity percentage. Conversely, a negative association was observed between Mn, Zn, and sand. Urease activity was explained in 89% through a negative association with SOM, Zn, and sand and a positive association with P Olsen, Mn, Cu, and the richness of bacteria. The FDA hydrolysis is an indicator of total soil microbiological activities; this enzyme activity was positively explained in 58% by only two variables: the percentage of silt and available S (Table 4).

4. Discussion

4.1. Soil Microbial Diversity and Enzyme Activities Relationships with Physical and Chemical Soil Characteristics

The negative impacts of monoculture timber plantations over soil biodiversity have been little studied in Chile [17]. This investigation was carried out in monoculture plantations implemented by small and medium farmers, whose management is less intensive than that of large Chilean companies (e.g., large clear-cutting on steep slopes, the intensively widespread use of chemicals to control competing vegetation, fire-clearing, destruction of microhabitat diversity, etc.) [37]. However, despite the differences in the establishment and management of plantations, the results of enzymatic activities have shown that land use change induced alterations in the soil enzyme activities. Natural forest presented the highest values in almost all soil enzymes studied, especially contrasting natural forest treatment versus agricultural crops in A-h horizon. FDA activity was the most sensitive indicator for assessing differences among land use systems [38].
On the other hand, the cluster analysis and nMDS from bacteria showed a similarity of 80% between adult plantation and agricultural crops; additionally, the natural forest is another group that shares a 50% similarity only with adult plantations and agricultural crops. However, in the second horizon, the cluster and nMDS analyses did not show a separation between soils or land uses. Moreover, fungal community structures were less grouped by land use than bacterial communities were. In the A-h horizon, the nMDS reveals that fungal communities varied in their structure among study areas, as the similarity was only 40%. In the second horizon, a minor separation of NF, YP, and AC communities was observed, with the exception of the treatment of adult plantations, which was completely separated from the rest.
Soil characteristics showed that the sites (located too close to each other inside the same micro watershed) with contrasting land use had significant differences regarding abiotic and biotic properties (Table 2 and Table 3, Figure 2). Other studies suggest that land-use change to forest plantations affects soil microbial communities [22]. Furthermore, this research showed differences relative to biodiversity and richness (bacterial and fungal) when the natural forest is changed to eucalyptus plantations or agricultural crop use (Table 3). However, no significant differences between them were found. Similar results were reported by Gans [39] and Singh et al. [40].
Additionally, no significant differences between soil horizons relative to the microbial responses to forest land-use change were found, although both soil horizons present differences regarding soil physical and chemical properties and enzymatic activities. This may be due to the abundant understory present in unmanaged plantations, which arises from the original regeneration and germination of species naturally due to seed deposition by birds and other animals. The thriving understory can be attributed to the existence of native species observed at the limits of the plantations, which may serve as biological legacies and a refuge for indigenous microorganisms and animals. Additionally, the existence of remnants of native forest in landscapes dominated by forest plantations should be a priority for the contribution of plantations to biodiversity to be effective [41].
On the other hand, as litter composition is constantly changing, new species become more dominant, aiming at the decomposing cellulose-rich litter, such as eucalyptus [42]. Nevertheless, additional long-term field and in situ research appears necessary to be carried out on plantations; they must be performed under different management intensities and in such a way that they permit the assessment of the impacts of forestry management practices over the composition and functions of the soil microbial community. Carrying out such studies would greatly contribute to a better understanding of the mechanisms involved in the changes of diversity and richness of fungi, bacteria, and other organisms during the development of plantations. Moreover, these studies would provide a scientific basis for implementing sustainable forest management practices in a forestry model that is faced with climate change.

4.2. Models That Explain Variation in Biodiversity of Bacterial and Fungi and Enzymatic Activity

Our study has revealed robust associations between microbial structures and several edaphic properties, such as NO3, P–Olsen, Mn, Cu, Zn, S, soil texture, and field capacity (see Table 4). Specifically, we found that enzyme activities were significantly affected by soil texture, with clay content showing a positive correlation and sand content displaying a negative correlation. Clay content favors enzyme activity, whereas sandy soils with lower water retention potential are less favorable. Indeed, higher clay content could enhance microbial activity since extra-cellular enzymes can be stabilized in organo-mineral complexes, which confers more resistance to denaturation by temperature and proteolytic attack [38,43]. One key finding in our study is that water content at field capacity positively impacted fungal and bacterial diversity and enzyme activity. This variable can be considered to be one of the most critical parameters regulating biological activities in soil, and similar results were provided by Janson and Hofmockel [44]. Changes in water availability can influence soil organisms through complex interactions, such as the dissolution of nutrients, soil temperature regulation, water pore saturation, and the indirect regulation of gas fluxes to the atmosphere. A decrease in soil water potential can reduce solute diffusion and the size of water-filled pore space, increasing soil aeration [43,45]. It should be noted that Widyati et al. [46] state that the elimination of the undergrowth produces a reduction in soil and water nutrients, since water and nutrients retention is carried out by plants belonging to the undergrowth. Thus, Jansson et al. [44] stated that understanding the parameters governing the impact on the microbial community is essential to understand climatic changes and their effects on soil functions. As previously stated, undergrowth vegetation plays a fundamental role in forestry ecosystems and produces changes in the micro-environments and nutrient cycle (Yang et al., 2019). Under plantation-intensive management, undergrowth vegetation is often eliminated, since plants belonging to the undergrowth are often considered to compete with plants belonging to the upper canopy. We found slight differences regarding the type of microorganisms that dominate each studied area (Figure 4, Figure 5 and Figure 6). This differs from results shown by a number of other studies, which demonstrated that the composition and structure of microbial communities are strongly related to abiotic and biotic factors, soil substrate properties (e.g., C and N pools), tree species composition, and diversity [47]. This is important since small microbial biomasses or community structure changes could affect SOM turnover and nutrient cycling. Forest land use changes can displace native species and the indigenous microbiota [48]. According to the calculated models, the pattern of soil microbial profiles among the four land uses could be attributed to the differences in N (N-NO3) and P nutrient pools, soil textural class, and soil water storage capacity. As stated in this study, N and P pools were lower in AP compared to NF. Moisture content should be considered a potential driver for microbial biomass and contrasting community structures; these results agree with those of Vinhal-Freitas et al. [49]. Accordingly, Liu et al. [42] state that underground biological processes may be regulated by soil nutrients and water availability, which affects soil microbial community composition and the activities of various hydrolytic enzymes within forestry ecosystems.
The bacterial phyla identified in this study include Actinobacteria, Bradyrhizobium, Alphaproteobacteria, and Betaproteobacteria, among others, which are known to be abundant in soil [50]. Proteobacteria and Acidobacteria are recognized as key players in the soil carbon cycle due to their capacity for cellulose and lignin degradation [51]. In particular, acidobacteria has garnered significant interest due to its unique physiological traits, including its diverse carbon utilization strategies, its role in iron cycling, its production of antimicrobial compounds, and its ability to assimilate nitrogen. These aspects make Acidobacteria a key player in soil biogeochemical cycles and an important target for further research. Microorganisms are essential for the global N cycle, and denitrifying bacteria are abundant and widespread in forest soils. Their genes have been found in bacterial strains belonging to Actinobacteria, Proteobacteria, and Firmicutes, as well as in other bacterial phyla [52]. In accordance with these bacterial phyla, for example, there are some well-known groups of nitrogen-fixing Actinobacteria, such as Frankia, which can fix nitrogen, solubilize and immobilize forms of phosphorus, and can produce phytohormones, such as indole-3-acetic acid, indole-3-pyruvic acid, gibberellins, and cytokinins, improving organic matter decomposition by releasing cellulases, xylanase, glucanases, lipases, proteases, and other enzymes [53]. The Bradyrhizobium class plays a role in N fixation, oxidizing ammonium to produce nitrite in soil. The Gemmatimonas significantly increased in healthy soils and can participate in C cycling in soil [54] and N fixing. Other representative species, such as Streptomycetes, play an important role in the mineralization processes of SOM. They are able to degrade a wide range of complex organic compounds, such as lignin, cellulose, chitin, and proteins. Streptomycetes are also able to produce enzymes that can solubilize minerals, such as phosphates. They can increase the availability of these minerals for plant growth. Overall, Streptomycetes are important members of soil microbial communities and play a crucial role in the mineralization processes that drive nutrient cycling and ecosystem functioning [55]. Regarding fungal community, identified dominant groups correspond mainly to two phyla, Basidiomycota and Ascomycota, in both horizons. Glomeromycota and Agaricomycetes were also dominant in A-h Horizon. The low level of endemism, as defined here as OTUs, in the study area may be attributed to the proximity of the plots. Specifically, there is a high degree of overlap between the AC and AP plots, as well as between the NF and YP plots. On the other hand, we must consider the technique used in this study, namely DGGE, which is able to provide valuable information on the dominant groups of microorganisms in a sample, although it may not be able to detect low-abundance groups. Other techniques, such as next-generation sequencing, may be needed to fully characterize microbial communities in further studies. Ensuring the preservation of microbial diversity and functionality is of utmost importance as it plays a critical role in sustaining essential ecological processes. Moreover, it also aids in predicting the impacts of global climate change on ecosystem functions [56,57]. Losing indigenous microorganisms with critical functions may have significant consequences for the ability of ecosystems to function sustainably [58]. A recommendation is that watersheds must have a permanent tree or shrub cover, preferably native and from the original forest or its biological legacies. They should be located mainly at gorges, streams, and river headwaters and connected to riparian areas of the basin. The biological legacies in forests are often considered minor components of original or previous vegetation, such as green trees, surviving plant parts (including propagules), dead wood, organic soil, and other surviving organisms [59]. Retaining forestry during harvesting is ecologically important because it emulates the “biological legacies” generally found in stands following natural disturbances [60].
In this way, such a silvicultural system could effectively satisfy socio-economic needs (e.g., timber production and no timber production) without significantly compromising biological conservation, offering a profound potential to help achieve ecologically sustainable forest management. As proposed in this paper, the understory within forestry plantations or biological legacies may absorb the harmful effects of forestry monoculture management to a considerable extent. However, it is essential to establish unambiguous regulations that clearly outline the rules and requirements. The current legislation only provides general guidelines, leaving room for interpretation and loopholes that large forestry companies exploit to maintain their profits at the expense of environmental sustainability. Compulsory collaboration should be a key component of any effective regulation, ensuring that all parties involved, including businesses and communities, work together towards the common goal of preserving natural resources. It is imperative to prioritize the long-term well-being of the environment over short-term financial gains, especially in the case of the Chilean forestry model, where the exploitation of natural resources has led to severe ecological damage. Therefore, the implementation of robust regulations that facilitate mandatory collaboration among all stakeholders is crucial to address the environmental challenges faced by Chile’s forestry industry.

5. Conclusions

The results of the study indicated that land use change in the Chilean Coastal Cordillera affects the soil microbial composition and soil enzyme activities when native Nothofagus spp. forests are replaced by fast-growing exotic species and crop land. The hypothesis that physicochemical properties drive these changes was tested. Soil organic matter content along with inorganic P (P-Olsen) and physical characteristics such as water holding capacity influenced the abundance, diversity, and structure of bacterial and fungal communities. Other nutrients, such as Ca and B, were also important. Natural forests exhibited higher enzyme activity compared to other land uses, suggesting that nitrogen and carbon cycling, as well as overall microbial activity slowdown in plantations and agricultural soils.
Microbial soil communities of forest plantations, natural forests, and agricultural crops were similar, suggesting that taxonomic composition does not significantly differ among habitats. These results could suggest that native forests surrounding other soil uses could act as microbial reservoirs buffering land conversion. However, further research is needed to explore this possibility. Additionally, it is important to highlight that the management approach adopted in the forest monoculture areas is not intensive, which promotes the growth of an understory with a high presence of native species that survive thanks to the low planting density and it could be the cause of not having found differences.
In Chile, there is a significant knowledge gap regarding the impact of land use changes on microbial soil communities’ biodiversity at the landscape level. This knowledge gap is particularly concerning given that over 60% of Chile’s land area is devoted to intensively managed plantations. To mitigate the negative impacts of the present forestry model over indigenous native microbiota, it is crucial to propose legislation aimed at protecting the remaining natural forest in both Condilleras. For better strategies to be included in the legislation we need, first comprehensive soil sampling strategies that target large-scale areas and incorporate modern molecular techniques, such as metagenomics, metaproteomics, and metatranscriptomics. Secondly, it is essential to include native ecosystems at different stages of alteration in these investigations to better understand the impact of land use changes on microbial diversity. Finally, analyses of plantations under intensive management, which dominate the central-southern landscape in Chile, should be a priority in future research efforts. By focusing on these areas, we can begin to bridge the knowledge gap and develop effective conservation strategies that prioritize the preservation of indigenous microbial communities in Chile.

Supplementary Materials

The following supporting information can be downloaded at: https://www.mdpi.com/article/10.3390/f14050938/s1, Table S1: Phylogenetic assignment bacteria of major DGGE bands Bacteria A–h horizon; Table S2: Phylogenetic assignment bacteria of major DGGE bands Bacteria B–h horizon; Table S3: Phylogenetic assignment fungi of major DGGE bands Fungal A-h horizon; Table S4: Phylogenetic assignment fungi of major DGGE bands Fungal B–h horizon; Table S5: Pearson correlation coefficients between biological and physicochemical variables from soils under different land use; Table S6: Results of a three-way ANOVA about the effect of land use change, soil horizon, season, and their interactions on enzyme activities: (a) cellulase, (b) FDA, and (c) urease activity.

Author Contributions

Conceptualization, Y.R.; methodology, Y.R., F.M., O.M., C.E. and H.A.; software, Y.R. and H.A.; validation, Y.R.; formal analysis, Y.R., H.A. and J.R.-S.; investigation, Y.R.; resources, Y.R. and D.R.-S.; data curation, Y.R.; H.A. and J.R.-S.; writing—original draft preparation, Y.R.; writing—review and editing, H.A., J.R.-S., F.M. and D.R.-S.; project administration, Y.R.; funding acquisition, Y.R. and D.R.-S. All authors have read and agreed to the published version of the manuscript.

Funding

The first author also thanks CONICYT (National Commission for Scientific and Technological Research) and FONDECYT Postdoctoral Project # 3140161 (National Fund for Scientific and Technological Development). D.R. –S. was funded by the Water Research Center For Agriculture and Mining, CRHIAM (ANID/FONDAP/15130015), proyecto regular interno-UnACh 100_2019 and 171_2022.

Data Availability Statement

The data supporting the reported results in the present study are available on request from the corresponding author or the first author.

Acknowledgments

We thank to the Centro de Recursos Hídricos para la Agricultura y Minería (CRHIAM) (ANID/FONDAP/15130015) for their financial support.

Conflicts of Interest

The authors declare no conflict of interest.

References

  1. Gibbs, H.K.; Salmon, J.M. Mapping the World’s Degraded Lands. Appl. Geogr. 2015, 57, 12–21. [Google Scholar] [CrossRef]
  2. Oyarzún, C.E.; Hervé-Fernandez, P.; Frêne, C. Effects of Land Use Changes and Management Practices on Water Yield in Native Forests and Exotic Plantations in Southern Chile; NOVA Publishers: New York, NY, USA, 2012. [Google Scholar]
  3. Mori, A.S.; Kitagawa, R. Retention Forestry as a Major Paradigm for Safeguarding Forest Biodiversity in Productive Landscapes: A Global Meta-Analysis. Biol. Conserv. 2014, 175, 65–73. [Google Scholar] [CrossRef]
  4. Van der Plas, F.; Manning, P.; Allan, E.; Scherer-Lorenzen, M.; Verheyen, K.; Wirth, C.; Zavala, M.A.; Hector, A.; Ampoorter, E.; Baeten, L.; et al. Jack-of-All-Trades Effects Drive Biodiversity–Ecosystem Multifunctionality Relationships in European Forests. Nat. Commun. 2016, 7, 11109. [Google Scholar] [CrossRef] [PubMed] [Green Version]
  5. Baldrian, P. Forest Microbiome: Diversity, Complexity and Dynamics. FEMS Microbiol. Rev. 2017, 41, 109–130. [Google Scholar] [CrossRef] [PubMed] [Green Version]
  6. Merino, C.; Jofré, I.; Matus, F. Soil Redox Controls CO2, CH4 and N2O Efflux from White-Rot Fungi in Temperate Forest Ecosystems. J. Fungi 2021, 7, 621. [Google Scholar] [CrossRef]
  7. Lladó, S.; López-Mondéjar, R.; Baldrian, P. Forest Soil Bacteria: Diversity, Involvement in Ecosystem Processes, and Response to Global Change. Microbiol. Mol. Biol. Rev. 2017, 81, e00063-16. [Google Scholar] [CrossRef] [Green Version]
  8. Trivedi, P.; Anderson, I.C.; Singh, B.K. Microbial Modulators of Soil Carbon Storage: Integrating Genomic and Metabolic Knowledge for Global Prediction. Trends Microbiol. 2013, 21, 641–651. [Google Scholar] [CrossRef]
  9. Van der Wal, A.; Geydan, T.D.; Kuyper, T.W.; de Boer, W. A Thready Affair: Linking Fungal Diversity and Community Dynamics to Terrestrial Decomposition Processes. FEMS Microbiol. Rev. 2013, 37, 477–494. [Google Scholar] [CrossRef] [Green Version]
  10. Van der Heijden, M.G.A.; Martin, F.M.; Selosse, M.-A.; Sanders, I.R. Mycorrhizal Ecology and Evolution: The Past, the Present, and the Future. New Phytol. 2015, 205, 1406–1423. [Google Scholar] [CrossRef]
  11. Reed, S.C.; Cleveland, C.C.; Townsend, A.R. Functional Ecology of Free-Living Nitrogen Fixation: A Contemporary Perspective. Annu. Rev. Ecol. Evol. Syst. 2011, 42, 489–512. [Google Scholar] [CrossRef]
  12. Uroz, S.; Oger, P.; Lepleux, C.; Collignon, C.; Frey-Klett, P.; Turpault, M.-P. Bacterial Weathering and Its Contribution to Nutrient Cycling in Temperate Forest Ecosystems. Res. Microbiol. 2011, 162, 820–831. [Google Scholar] [CrossRef] [PubMed]
  13. Donoso, C. Bosques Templados de Chile y Argentina: Variacion, Estructura y Dinamica; Segunda; Universitaria: Santiago, Chile, 1994. [Google Scholar]
  14. Neira, E.; Verscheure, H.; Revenga, C. Chile’s Frontier Forests: Conserving A Global Treasure; University Austral of Chile: Valdivia, Chile, 2022; ISBN 1-56973-517-4. [Google Scholar]
  15. Miranda, A.; Altamirano, A.; Cayuela, L.; Lara, A.; González, M. Native Forest Loss in the Chilean Biodiversity Hotspot: Revealing the Evidence. Reg Environ. Change 2017, 17, 285–297. [Google Scholar] [CrossRef]
  16. Torres, R.; Azócar, G.; Rojas, J.; Montecinos, A.; Paredes, P. Vulnerability and Resistance to Neoliberal Environmental Changes: An Assessment of Agriculture and Forestry in the Biobio Region of Chile (1974–2014). Geoforum 2015, 60, 107–122. [Google Scholar] [CrossRef]
  17. Echeverria, C.; Coomes, D.; Salas, J.; Rey-Benayas, J.M.; Lara, A.; Newton, A. Rapid Deforestation and Fragmentation of Chilean Temperate Forests. Biol. Conserv. 2006, 130, 481–494. [Google Scholar] [CrossRef]
  18. Echeverría, C.; Newton, A.C.; Lara, A.; Benayas, J.M.R.; Coomes, D.A. Impacts of Forest Fragmentation on Species Composition and Forest Structure in the Temperate Landscape of Southern Chile. Glob. Ecol. Biogeogr. 2007, 16, 426–439. [Google Scholar] [CrossRef] [Green Version]
  19. Huber, A.; Iroumé, A.; Mohr, C.; Frêne, C. Efecto de Plantaciones de Pinus Radiata y Eucalyptus Globulus Sobre El Recurso Agua En La Cordillera de La Costa de La Región Del Biobío, Chile. Bosque (Valdivia) 2010, 31, 219–230. [Google Scholar] [CrossRef]
  20. Nahuelhual, L.; Carmona, A.; Aguayo, M.; Echeverria, C. Land Use Change and Ecosystem Services Provision: A Case Study of Recreation and Ecotourism Opportunities in Southern Chile. Landsc. Ecol. 2014, 29, 329–344. [Google Scholar] [CrossRef]
  21. Rodríguez-Echeverry, J.; Echeverría, C.; Oyarzún, C.; Morales, L. Impact of Land-Use Change on Biodiversity and Ecosystem Services in the Chilean Temperate Forests. Landsc. Ecol. 2018, 33, 439–453. [Google Scholar] [CrossRef]
  22. He, R.; Yang, K.; Li, Z.; Schädler, M.; Yang, W.; Wu, F.; Tan, B.; Zhang, L.; Xu, Z. Effects of forest conversion on soil microbial communities depend on soil layer on the eastern Tibetan Plateau of China. PLoS ONE 2017, 12, e0186053. [Google Scholar] [CrossRef] [Green Version]
  23. Jiang-shan, Z.; Jian-fen, G.; Guang-shui, C.; Wei, Q. Soil Microbial Biomass and Its Controls. J. For. Res. 2005, 16, 327–330. [Google Scholar] [CrossRef]
  24. Voříšková, J.; Brabcová, V.; Cajthaml, T.; Baldrian, P. Seasonal Dynamics of Fungal Communities in a Temperate Oak Forest Soil. New Phytol. 2014, 201, 269–278. [Google Scholar] [CrossRef] [PubMed]
  25. Corral-Pazos-de-Provens, E.; Rapp-Arrarás, Í.; Domingo-Santos, J.M. Estimating Textural Fractions of the USDA Using Those of the International System: A Quantile Approach. Geoderma 2022, 416, 115783. [Google Scholar] [CrossRef]
  26. Hirzel, J.; Retamal-Salgado, J.; Walter, I.; Matus, I. Effect of Soil Cadmium Concentration on Three Chilean Durum Wheat Cultivars in Four Environments. Arch. Agron. Soil Sci. 2018, 64, 162–172. [Google Scholar] [CrossRef]
  27. Sadzawka, A.; Carrasco, M.; Grez, R.; Mora, M.; Flores, H.; Neaman, A. Métodos de Análisis Recomendados Para Los Suelos de Chile; Actas INIA N° 34; Revision 2006; Instituto de Investigaciones Agropecuarias: Santiago, Chile, 2006. [Google Scholar]
  28. Rivas, Y.; Retamal-Salgado, J.; Knicker, H.; Matus, F.; Rivera, D. Neutral Sugar Content and Composition as a Sensitive Indicator of Fire Severity in the Andisols of an Araucaria–Nothofagus Forest in Southern Chile. Sustainability 2021, 13, 12061. [Google Scholar] [CrossRef]
  29. Hirzel, J.; Retamal-Salgado, J.; Walter, I.; Matus, I. Fixation Coefficient and Soil Residual Effect of Cadmium Application on Three Biannual Crop Rotations at Four Locations in Chile. J. Soil Sci. Plant Nutr. 2019, 19, 450–462. [Google Scholar] [CrossRef]
  30. Olsen, S.R. Estimation of Available Phosphorus in Soils by Extraction with Sodium Bicarbonate; U.S. Department of Agriculture: Washington, DC, USA, 1954. [Google Scholar]
  31. Hirzel, J.; Retamal-Salgado, J.; Walter, I.; Matus, I. Residual Effect of Cadmium Applications in Different Crop Rotations and Environments on Durum Wheat Cadmium Accumulation. J. Soil Water Conserv. 2019, 74, 41–50. [Google Scholar] [CrossRef]
  32. Rivas, Y.; Rivera, D.; Gallardo, R.; Lagos, E.; Yevenes, M.; Zambrano, F.; Mendoza, J. Water Availability, Quality, and Use in Rural Communities of the Chilean Coastal Range. J. Soil Water Conserv. 2020, 75, 75–90. [Google Scholar] [CrossRef]
  33. Pinto-Poblete, A.; Retamal-Salgado, J.; López, M.D.; Zapata, N.; Sierra-Almeida, A.; Schoebitz, M. Combined Effect of Microplastics and Cd Alters the Enzymatic Activity of Soil and the Productivity of Strawberry Plants. Plants 2022, 11, 536. [Google Scholar] [CrossRef]
  34. Khadem, A.; Raiesi, F.; Besharati, H.; Khalaj, M.A. The Effects of Biochar on Soil Nutrients Status, Microbial Activity and Carbon Sequestration Potential in Two Calcareous Soils. Biochar 2021, 3, 105–116. [Google Scholar] [CrossRef]
  35. Jorquera, M.A.; Hernández, M.; Martínez, O.; Marschner, P.; de la Luz Mora, M. Detection of Aluminium Tolerance Plasmids and Microbial Diversity in the Rhizosphere of Plants Grown in Acidic Volcanic Soil. Eur. J. Soil Biol. 2010, 46, 255–263. [Google Scholar] [CrossRef]
  36. Fromin, N.; Hamelin, J.; Tarnawski, S.; Roesti, D.; Jourdain-Miserez, K.; Forestier, N.; Teyssier-Cuvelle, S.; Gillet, F.; Aragno, M.; Rossi, P. Statistical Analysis of Denaturing Gel Electrophoresis (DGE) Fingerprinting Patterns. Environ. Microbiol. 2002, 4, 634–643. [Google Scholar] [CrossRef] [PubMed]
  37. Salas, C.; Donoso, P.J.; Vargas, R.; Arriagada, C.A.; Pedraza, R.; Soto, D.P. The Forest Sector in Chile: An Overview and Current Challenges. J. For. 2016, 114, 562–571. [Google Scholar] [CrossRef] [Green Version]
  38. Nannipieri, P.; Ascher, J.; Ceccherini, M.T.; Landi, L.; Pietramellara, G.; Renella, G. Microbial Diversity and Soil Functions. Eur. J. Soil Sci. 2003, 54, 655–670. [Google Scholar] [CrossRef]
  39. Gans, J.; Wolinsky, M.; Dunbar, J. Computational Improvements Reveal Great Bacterial Diversity and High Metal Toxicity in Soil. Science 2005, 309, 1387–1390. [Google Scholar] [CrossRef]
  40. Singh, B.K.; Quince, C.; Macdonald, C.A.; Khachane, A.; Thomas, N.; Al-Soud, W.A.; Sørensen, S.J.; He, Z.; White, D.; Sinclair, A.; et al. Loss of Microbial Diversity in Soils Is Coincident with Reductions in Some Specialized Functions. Environ. Microbiol. 2014, 16, 2408–2420. [Google Scholar] [CrossRef] [PubMed]
  41. García, R.A.; Pauchard, A.; Escudero, A. French Broom (Teline Monspessulana) Invasion in South-Central Chile Depends on Factors Operating at Different Spatial Scales. Biol. Invasions 2014, 16, 113–124. [Google Scholar] [CrossRef]
  42. Liu, J.; Ding, C.; Zhang, W.; Wei, Y.; Zhou, Y.; Zhu, W. Litter Mixing Promoted Decomposition Rate through Increasing Diversities of Phyllosphere Microbial Communities. Front. Microbiol. 2022, 13, 1009091. [Google Scholar] [CrossRef] [PubMed]
  43. Seaton, F.M.; George, P.B.L.; Lebron, I.; Jones, D.L.; Creer, S.; Robinson, D.A. Soil Textural Heterogeneity Impacts Bacterial but Not Fungal Diversity. Soil Biol. Biochem. 2020, 144, 107766. [Google Scholar] [CrossRef]
  44. Jansson, J.K.; Hofmockel, K.S. Soil Microbiomes and Climate Change. Nat. Rev. Microbiol. 2020, 18, 35–46. [Google Scholar] [CrossRef]
  45. Rawls, W.J.; Pachepsky, Y.A.; Ritchie, J.C.; Sobecki, T.M.; Bloodworth, H. Effect of Soil Organic Carbon on Soil Water Retention. Geoderma 2003, 116, 61–76. [Google Scholar] [CrossRef]
  46. Widyati, E.; Nuroniah, H.S.; Tata, H.L.; Mindawati, N.; Lisnawati, Y.; Darwo; Abdulah, L.; Lelana, N.E.; Mawazin; Octavia, D.; et al. Soil Degradation Due to Conversion from Natural to Plantation Forests in Indonesia. Forests 2022, 13, 1913. [Google Scholar] [CrossRef]
  47. Sowerby, A.; Emmett, B.; Beier, C.; Tietema, A.; Peñuelas, J.; Estiarte, M.; Van Meeteren, M.J.M.; Hughes, S.; Freeman, C. Microbial Community Changes in Heathland Soil Communities along a Geographical Gradient: Interaction with Climate Change Manipulations. Soil Biol. Biochem. 2005, 37, 1805–1813. [Google Scholar] [CrossRef]
  48. Pérez-Hernández, J.; Gavilán, R.G. Impacts of Land-Use Changes on Vegetation and Ecosystem Functioning: Old-Field Secondary Succession. Plants 2021, 10, 990. [Google Scholar] [CrossRef] [PubMed]
  49. Vinhal-Freitas, I.C.; Corrêa, G.F.; Wendling, B.; Bobuľská, L.; Ferreira, A.S. Soil Textural Class Plays a Major Role in Evaluating the Effects of Land Use on Soil Quality Indicators. Ecol. Indic. 2017, 74, 182–190. [Google Scholar] [CrossRef]
  50. Chaparro, J.M.; Badri, D.V.; Vivanco, J.M. Rhizosphere Microbiome Assemblage Is Affected by Plant Development. ISME J. 2014, 8, 790–803. [Google Scholar] [CrossRef] [Green Version]
  51. Ward, N.L.; Challacombe, J.F.; Janssen, P.H.; Henrissat, B.; Coutinho, P.M.; Wu, M.; Xie, G.; Haft, D.H.; Sait, M.; Badger, J.; et al. Three Genomes from the Phylum Acidobacteria Provide Insight into the Lifestyles of These Microorganisms in Soils. Appl. Environ. Microbiol. 2009, 75, 2046–2056. [Google Scholar] [CrossRef] [Green Version]
  52. Priyanka, J.; Koel, M. Diversity Study of Nitrate Reducing Bacteria from Soil Samples-A Metagenomics Approach. J. Comput. Sci. Syst. Biol. 2015, 8, 4. [Google Scholar] [CrossRef] [Green Version]
  53. Mishra, A.; Singh, L.; Singh, D. Unboxing the Black Box—One Step Forward to Understand the Soil Microbiome: A Systematic Review. Microb. Ecol. 2023, 85, 669–683. [Google Scholar] [CrossRef]
  54. Zeng, Y.; Baumbach, J.; Barbosa, E.G.V.; Azevedo, V.; Zhang, C.; Koblížek, M. Metagenomic Evidence for the Presence of Phototrophic Gemmatimonadetes Bacteria in Diverse Environments. Environ. Microbiol. Rep. 2016, 8, 139–149. [Google Scholar] [CrossRef]
  55. Baltz, R.H. Renaissance in Antibacterial Discovery from Actinomycetes. Curr. Opin. Pharmacol. 2008, 8, 557–563. [Google Scholar] [CrossRef]
  56. Wang, J.; Hu, A.; Meng, F.; Zhao, W.; Yang, Y.; Soininen, J.; Shen, J.; Zhou, J. Embracing Mountain Microbiome and Ecosystem Functions under Global Change. New Phytol. 2022, 234, 1987–2002. [Google Scholar] [CrossRef] [PubMed]
  57. Pescador, D.S.; Delgado-Baquerizo, M.; Fiore-Donno, A.M.; Singh, B.K.; Bonkowski, M.; Maestre, F.T. Ecological Clusters of Soil Taxa within Bipartite Networks Are Highly Sensitive to Climatic Conditions in Global Drylands. Philos. Trans. R. Soc. B Biol. Sci. 2022, 377, 20210387. [Google Scholar] [CrossRef] [PubMed]
  58. Pan, Y.; Jackson, R.B.; Hollinger, D.Y.; Phillips, O.L.; Nowak, R.S.; Norby, R.J.; Oren, R.; Reich, P.B.; Lüscher, A.; Mueller, K.E.; et al. Contrasting Responses of Woody and Grassland Ecosystems to Increased CO2 as Water Supply Varies. Nat. Ecol. Evol. 2022, 6, 315–323. [Google Scholar] [CrossRef] [PubMed]
  59. Harmon, M.E.; Franklin, J.F.; Swanson, F.J.; Sollins, P.; Gregory, S.V.; Lattin, J.D.; Anderson, N.H.; Cline, S.P.; Aumen, N.G.; Sedell, J.R.; et al. Ecology of Coarse Woody Debris in Temperate Ecosystems. In Advances in Ecological Research; Advances in Ecological Research: Classic Papers; Academic Press: Cambridge, MA, USA, 2004; Volume 34, pp. 59–234. [Google Scholar]
  60. Lindenmayer, D.B.; Franklin, J.F. Conserving Forest Biodiversity: A Comprehensive Multiscaled Approach; Island Press: Washington, DC, USA, 2002; ISBN 978-1-55963-935-4. [Google Scholar]
Figure 1. Map of the study area and delimitation of the catchments. Red squares show the studied areas: native forest (NF), young plantation (YP), adult plantation (AP), and agricultural crop (AC).
Forests 14 00938 g001
Figure 2. Potential soil enzyme activity under different vegetation types: native forest (NF), young plantation (YP), adult plantation (AP), and agricultural crop (AC) across different seasons and soil horizons (A): A–h horizon; (B) B–h horizon. Enzyme activities were performed from 2014 to 2016: S–14= spring 2014; W–14=) winter 2014; S–15= summer 2015; A–15= autumn 2015; W–15= winter 2015; and S–16= spring 2016. Bars indicate ± standard error. * p < 0.01.
Forests 14 00938 g002
Figure 3. (a) Dendrogram and (b) non-metric multidimensional scaling (MDS) analysis of DGGE profiles (16 rRNA genes) from soil bacterial communities of the A–h horizon in native forest (NF), young plantation (YP), adult plantation (AP) and agricultural crop (AC).
Forests 14 00938 g003
Figure 4. (a) Dendrogram and (b) non-metric multidimensional scaling (MDS) analysis of DGGE profiles (16 rRNA genes) from soil bacterial communities of the B–h horizon in NF (natural forest, namely the Nothofagus Forest), YP (young plantation of E. Globulus), AP (adult plantation of E. Globulus), and AC (agricultural crops).
Forests 14 00938 g004
Figure 5. (a) Dendrogram and (b) non-metric multidimensional scaling (MDS) analysis of DGGE profiles (18 rRNA genes) from soil fungal communities of the A–h horizon in NF (natural forest, namely the Nothofagus Forest), YP (young plantation Of E. Globulus), AP (adult plantation of E. Globulus), and AC (agricultural crops).
Forests 14 00938 g005
Figure 6. (a) Dendrogram and (b) non-metric multidimensional scaling (MDS) of DGGE profiles (18 rRNA genes) from the soil fungal communities of the B–h horizon of native forest (NF), young plantation (YP), adult plantation (AP) and agricultural crop (AC).
Forests 14 00938 g006
Figure 7. Bacterial taxa found in A-h horizon in native forest (NF), young plantation (YP), adult plantation (AP), and agricultural crop (AC). Between brackets, the respective combinations among them can be seen. Each number corresponds to a different OTUs. Uc Bacterium: uncultured bacterium.
Forests 14 00938 g007
Figure 8. Bacterial taxa found in B-h horizon in native forest (NF), young plantation (YP), adult plantation (AP), and agricultural crop (AC). Between brackets, the respective combinations among them can be seen. Each number corresponds to a different OTU. Uc Bacterium: uncultured bacterium.
Forests 14 00938 g008
Figure 9. Fungal taxa found in the A-h horizon in native forest (NF), young plantation (YP), adult plantation (AP), and agricultural crop (AC)., and between brackets, the respective combinations among them can be seen. Each number corresponds to a different OTU. Uc Fungal: uncultured fungal.
Forests 14 00938 g009
Figure 10. Fungal taxa found in the B-h horizon in native forest (NF), young plantation (YP), adult plantation (AP), and agricultural crop (AC). Between brackets, the respective combinations among them can be seen. Each number corresponds to a different OTU. Uc Fungal: uncultured fungal.
Forests 14 00938 g010
Figure 11. Principal component analysis of soil location by physicochemical and biological properties. Arrows represent each soil property’s relationship (direction and strength) to each soil sample in both horizons (A–h and B–h). Native forest (NF), young plantation (YP), adult plantation (AP), and agricultural crop (AC).
Forests 14 00938 g011
Table 1. Physics soil properties of the native forest (NF), young plantation (YP), adult plantation (AP), and agricultural crop (AC) in catchment soils. Similar capital letters do not differ significantly between the two averages (Tukey’s test at 5% significance).
EcosystemSoil
Horizon
θfcPWPρbClaySiltSandSoil Survey (USDA)
%g cm−3%
NFA-h40.3 b29.4 d1.25 a50.11 a23.33 b26.55 dClay
−0.8−0.4−0.06−0.31−0.23−0.28
B-h42.2 b31.9 c1.37 a34.81 d15.27 a49.91 aSandy clay loam
−0.8−0.4−0.03−0.32−0.23−0.28
YpA-h27.4 d,e19.6 f1.42 a48.38 b37.09 d14.54 gClay
−0.8−1.4−0.04−0.32−0.25−0.33
B-h24.0 e17.9 f1.46 a50.94 b29.91 e19.15 fSandy clay loam
−0.7−0.4−0.23−0.31−0.24−0.58
APA-h33.3 c28.2 d1.32 a36.38 c48.73 b14.89 f,gSilty clay loam
−1.5−0.4−0.39−0.31−0.26−0.33
B-h43.7 b54.0 b1.23 a15.44 f42.41 c42.14 aLoam
−1.4−0.4−0.01−0.31−0.23−0.58
ACA-h30.9 c,d22.5 e1.25 a32.27 e51.52 a16.21 fSilty clay loam
−0.7−0.5−0.01−0.33−0.23−0.58
B-h66.6 a54.0 a1.39 a13.14 g50.65 a36.21 cSilty loam
−1.9−0.4−0.01−0.31−0.23−0.33
θfc: field capacity; PWP: permanent wilting point; ρb: bulk density; USDA: the United States Department of Agriculture; A–h: A-horizon soil topsoil (0–20 cm depth approx.); B–h: B-horizon soil (20–55 cm depth approx).
Table 2. Chemical soil properties of the native forest (NF), young plantation (YP), adult plantation (AP), and agricultural crop (AC) catchments soils. Similar capital letters do not differ significantly between the two averages (Tukey’s test at 5% significance).
EcosystemSoil
Horizon
MOSpHBase
Cations
P- PO4
Olsen
N-N03AlKCaMgSFeMnZnCuB
(%) Cmol(+) kg−1mg Kg−1Saturation (%)mg Kg−1
NFA-h27.5 a5.6 a24.2 a7.5 a13.9 a0.23 c5.8 c64.8 a23.0 a10.9 a72.7 a280.7 a16.0 a3.5 a1.2 a
−1.6−0.2−2.5−7.7−0.78−4.5−1.9−8.2−1.5−5.5−10.8−24.5−9.3−1.5−0.2
B-h3.5 b5.4 a4.0 b1.1 a1.7 b,c42.9 a7.5 b,c32.3 b22.0 a2.6 a31.4 a,b33.3 b0.1 b0.8 b,c0.4 b
−1.6−0.2−2.5−0.5−0.4−10.6−2.3−8.5−3.2−1.2−19.3−20.1−0.2−0.4−0.2
YPA-h6.1 b5.8 a10.3 b2.1 a1.5 b,c16.8 a,b,c6.2 c47.3 a,b27.9 a1.5 b31.8 a63.1 b1.0 b0.7 b,c0.7 a,b
−1.6−0.3−6.1−3.6−1.3−5.6−2.2−17−2.3−2.3−33.7−24.1−1.5−0.5−0.2
B-h1.4 b5.7 a5.9 b0.2 a0.6 c31.1 a,b5.7 c29.5 b30.7 a1.5 b2.4 b2.1 b0.0 b0.1 c0.3 b
−1.6−0.2−1.6−0.4−0.3−15.9−2.8−17−2.6−0.3−1.4−24.3−0.1−0.2−0.2
APA-h4.4 b5.7 a10.9 b1.71.8 b,c8.9 b,c10.1 b,c57.4 a,b21.6 a1.3 b74.8 a40.1 b0.8 b1.5 b0.6 a,b
−1.7−0.1−3.2−0.1−0.7−5.6−2.2−8.7−1.8−1−19.4−15.1−0.2−0.3−0.2
B-h3.4 b5.7 a9.4 b1.2 a3.5 b,c11.9 a10.4 b,c52.6 a,b23.3 a1.3 b53.0 a27.7 b0.7 b1.0 b,c0.5 a,b
−2.4−0.4−2−0.8−2.8−6.9−0.6−4.1−1.2−1.6−28.8−24.4−0.8−0.6−0.2
ACA-h3.9 b5.9 a14.5 a,b5.0 b2.6 b7.2 b,c52.6 a55.1 a,b31.5 a1.5 b96.2 a34.0 b1.4 b1.3 b,c0.4 b
−1.2−0.3−5.8−1.4−1.4−5.5−6.2−12.4−9.7−0.4−19.2−24.2−0.1−0.4−0.2
B-h5.4 b5.7 a9.63 b1.6 b,c0.8 b10.6 b,c36.4 a28.6 b29.8 a1.4 b77.2 a24.1 b1.0 b1.2 b,c0.3 b
−2.5−0.2−2.2−0.4−1.4−2.3−2.7−10.7−13.2−0.5−17.4−24.2−0.2−0.5−0.2
A–h: A–horizon soil topsoil (0–20 cm depth approx.); B–h: B–horizon soil (20–55 cm depth approx.). Different letters represent significant differences at p < 0.05.
Table 3. Richness and Shannon-Wiener index in A-h and B-h horizons in native forest (NF), young plantation (YP), adult plantation (AP), and agricultural crop (AC).
EcosystemSoil
Horizon
RichnessShannon–Wiener Index
BacteriaFungiBacteriaFungi
NFA-h13.00 a (0.00)9.33 a,b (0.87)2.56 a (0.00)2.20 a,b (0.09)
B-h11.33 a (2.60)12.67 a (0.33)2.36 a,b (0.24)2.47 a (0.05)
YPA-h13.00 a (0.01)9.33 a,b (0.88)1.86 b (0.05)2.18 a,b (0.10)
B-h10.67 a (2.19)10.67 a,b (1.20)2.32 a,b (0.18)2.19 a,b (0.13)
APA-h8.33 a (0.88)7.00 b (1.15)2.11 a,b (0.10)1.91 a,b (0.17)
B-h11.67 a (1.76)7.67 a,b (0.67)2.45 a,b (0.16)1.94 a,b (0.11)
ACA-h8.00 a (0.01)7.33 b (0.88)2.08 a,b (0.00)1.87 b (0.11)
B-h11.00 a (1.53)11.67 a,b (1.86)2.36 a,b (0.15)2.25 a,b (0.15)
A–h: A-horizon soil topsoil (0–20 cm depth approx.), B–h: B-horizon soil (20–55 cm depth approx.). Different letters represent significant differences at p < 0.05.
Table 4. ‘Best’ models to explain variation in richness of fungi, the Shannon index of fungi, richness of bacteria, the Shannon index of bacteria, cellulose and urease activity, and FDA hydrolysis. D.f. = degrees of freedom; R2 = proportion of the variance accounted for (tested by deletion from the model); AIC = Akaike information criterion; root mean square error (RSE) = residual standard error.
ModelCoefficientt-ValueD.f.p-ValueR2AIC
Null Model 23
(a) Bacteria Richness (RSE:2.95) 50.007 *0.55115.07
Intercept9.296.89 1.90 × 10⁻⁷ ***
N-NO3 (mg Kg−1)1.212.20 0.047 *
P Olsen (mg Kg−1)0.892.36 0.029 *
Ca (mg Kg−1)−0.58−3.54 0.002 **
Available S (mg Kg−1)1.051.73 0.101
Zn (mg Kg−1)−2.07−2.85 0.010 *
(b) Shannon Bacteria (RSE:2.29) 50.0070.563.115
Intercept2.2116.89 1.75 × 10⁻¹² ***
N-NO3 (mg Kg−1)0.101.97 0.064
P Olsen (mg Kg−1)0.082.24 0.038 *
Ca (mg Kg−1)−0.05−3.20 0.005 **
Available S (mg Kg−1)0.091.47 0.158
Zn (mg Kg−1)−0.18−2.65 0.016 *
(c) Fungi Richness (RSE:1.84) 30.00130.53113.4
Intercept11.647.12 6.72 × 10⁻⁷ ***
N-NO3 (mg Kg−1)−0.25−2.56 0.0185 *
Silt (%)−0.13−4.16 4.86 × 10⁻⁴ ***
Field capacity (θfc) %0.093.12 5.42 × 10⁻³ **
(d) Shannon Fungi (RSE:0.19) 20.001**0.65−5.5
Intercept2.5215.17 1.07 × 10⁻¹¹ ***
N-NO3 (mg Kg−1)−0.08−3.29 0.004 **
P Olsen (mg Kg−1)0.062.67 0.015 *
Silt (%)−0.13−2.49 0.022 *
Sand (%)−0.112.18 0.042 *
Field capacity (θfc) %0.013.20 0.005 **
(e) Cellulase activity (RSE:8.40) 51.70 × 10⁻⁵ ***0.82180.6
Intercept40.795.38 4.91 × 10⁻⁵ ***
N-N03 (mg Kg−1)−6.16−3.09 0.006 **
P Olsen (mg Kg−1)−4.49−3.49 0.002 **
Mn (mg Kg−1)0.16−2.37 0.023 *
Zn (mg Kg−1)13.436.51 5.30 × 10⁻⁶ ***
Sand (%)−0.392.32 0.033 *
Field capacity (θfc) %−0.45−2.95 0.008 **
(f) Urease activity (RSE:54.5) 71.09 × 10⁻⁶ ***0.89276.2
Intercept175.822.41 0.025 *
MOS (mg Kg−1)−28.19−3.07 0.007 **
P Olsen (mg Kg−1)42.644.68 0.000 ***
Mn (mg Kg−1)2.6103.67 0.002 **
Zn (mg Kg−1−36.56−3.17 0.006 **
Cu (mg Kg−1)72.802.3720.030 *
Sand (%)−6.73−6.20 0.000 ***
Richness_B11.382.54 0.021 *
(g) FDA hydrolysis (RSE:72.64) 20.000 ***0.62276.2
Intercept263.094.87 0.000 ***
Silt (%)3.3342.784 0.011 *
Available S (mg Kg−1)15.4933.146 0.004 **
Statistical significance. codes: *** p < 0.001, ** p < 0.01, * p < 0.05.
Disclaimer/Publisher’s Note: The statements, opinions and data contained in all publications are solely those of the individual author(s) and contributor(s) and not of MDPI and/or the editor(s). MDPI and/or the editor(s) disclaim responsibility for any injury to people or property resulting from any ideas, methods, instructions or products referred to in the content.

