Article

Effect of Alternate Drying Techniques on Cross-Laminated Timber after Exposure to Free-Water Wetting

by
Maryam Shirmohammadi
* and
Adam Faircloth
Department of Agriculture and Fisheries (QLD), Forest Products Innovation, Salisbury, QLD 4107, Australia
*
Author to whom correspondence should be addressed.
Forests 2023, 14(5), 1007; https://doi.org/10.3390/f14051007
Submission received: 11 April 2023 / Revised: 4 May 2023 / Accepted: 4 May 2023 / Published: 12 May 2023
(This article belongs to the Special Issue Wood Quality and Mechanical Properties)

Abstract

:
Cross-laminated timber (CLT) panels are commonly used in mass-timber multistorey constructions due to their prefabrication, construction flexibility, environmental credentials and weight-to-strength ratio advantages compared to competing building materials. However, the long-term durability and service life of these mass timber panels require further understanding of their performance when exposed to free water. Wetting and drying trials were conducted by exposing Radiata pine (Pinus radiata) CLT sections to either free water (pooling on a single surface) or submerged water (all directions exposed) saturation, followed by either ambient or fan drying. The panels exposed to water pooling only reached MC above the FSP up to 40 mm of the panel depth. For submerged panels, the MC reached values above the fibre saturation point (FSP) at depths of 30 to 40 mm penetration on both panel faces. When comparing the ambient and fan-drying panel sections over the same time period, a less uniform MC profile was observed for the ambient drying, whereas the fan-dried panels fell below the FSP faster and with a more consistent MC profile. A complementary study was conducted on a standalone 3.0 × 3.0 m CLT room, where the room was wetted during a simulated pipe burst event. The moisture monitoring of wall and floor panels during fan drying of the room showed that an MC reduction from an excess of 40% to below 20% could be reached in less than 96 h for the panels’ surface; however, the middle sections of the panels dried slower than the surface sections. The CLT structure fan drying required a longer drying time than the CLT sections tested due to the closed sections (overlaps and connected faces) and a lower rate of airflow. The study of drying CLT sections highlighted the product reaching and maintaining MC higher than FSP points and the need for further drying applied to minimise long-term decay development. Further study is recommended to investigate the effects of closed sections (connected faces) and the duration of drying needed for semi-finished and finished buildings.

1. Introduction

Mass timber panels are becoming more popular as building materials due to their environmental benefits, lower cost and faster construction [1,2,3,4,5,6,7,8]. In 2021, the cross-laminated timber (CLT) market exceeded USD 1.1 billion and is predicted to reach USD 1.4 billion in 2025 [9,10]. Mass timber panels have many benefits and provide prefabrication design potential for the building industry; however, due to the hygroscopic nature of timber, they are prone to biodegradation.
CLT panels are a form of engineered wood products (EWP) developed by laminating sawn boards together, commonly by face lamination only (although it can also include edge bonding); the boards are arranged with each layer perpendicular to the previous. Sustained exposure to moisture during construction, in the event of heavy rainfall or plumbing leaks post-construction, can cause moisture gain and lead to possible decay [11,12,13]. A moisture content (MC) exceeding 20% provides an optimum condition for fungal decay in timber products [14,15]. Research showed that most mould growth in building elements is due to wetting events and exposure to free surface water, where free water is commonly found in timber surface cellular structures [16]. A study on timber with elevated MC in Canada showed that if the relative humidity (RH) range of the environmental conditions is optimum for fungal growth, CLT panels could lose structural strength within a few months [14]. Another study showed that exposure to outdoor RH and temperature for a period over 3 months in Tallinn, Estonia, from August to September, even without rainfall, can create a high risk of mould growth in mass timber panel elements [17]. Mould developed on the surface of a product can be removed; however, it is essential to define the source of moisture and its cause to eliminate its origin and avoid any further moisture gain and longer-term damage [6]. Moisture management is one of the most important considerations when working with timber during construction and in service. Moisture management practises and protocols need to target minimising weathering, moisture gradient (MG) development and elevated MC, reducing the chance of dimensional instability, loss of airtightness, biodegradation and mould growth [13,18,19,20,21]. Previous studies showed that the location of panels, type of elements (wall, roof, floor), and connection type can affect the moisture gain and drying requirements to return the panels to optimum MC levels [6,22,23,24]. There are limited field data on EWPs pre- and post-construction, focusing on drying time and methods to reach MC below 20% and avoid degradation of CLT panels after the major wetting event [25]. Although modelling moisture gain and loss using available software provides information about moisture variation in composite elements, there are limitations [26] due to the assumptions made and the variability in timber products that make the simulation results less accurate.
A previous study of soaking western Canadian Spruce-pine-fir (SPF, predominantly Picea mariana Mill.) CLT panels in water and applying an external vapour barrier and insulation (as would be installed in an in-situ situation) has shown high MC (above 20%) of panels after 12 months. The studied moisture changes showed that at 19 mm from the panel surface, MC was reportedly higher (above 30%) when wall configurations with exterior permeance (NVP membrane and mineral wool insulation, combined permeance of 1.6 mg/Pa s m2) were monitored [14]. Additionally, slow drying rates of wetted panels due to various reasons, such as high humidity, weather barriers and wall orientation, can increase the chance of mould growth [17]. Monitoring CLT panels on a construction site in Portland, USA, between February and December 2017 showed that panels could experience over 762 mm of rainfall [25]. The study showed that moisture content could be reduced using temporary panel protection with a tarp and applying appropriate drying if panels were wetted; however, the drying process was slowed when vapour membranes were applied, and drying was limited to one side of the panel [25]. This indicates moisture being trapped within the membranes, only allowing the exposed, internal face to dry. Previous studies have investigated the moisture changes in CLT structures when exposed to wet events; however, the type of drying equipment, drying protocol and length of panel drying are still parameters that need to be addressed and investigated [27]. Such information would provide industry-relevant information on the techniques to be employed to correctly dry CLT panels after exposure to water damage.
As a first step to providing such information, this research aims to develop a better understanding of the drying of CLT panels. This study presents a series of investigations to examine moisture movement within the layered structure of CLT panels under different wetting (water pooling and submerging in water) and drying conditions. The testing included reporting moisture uptake after wetting in different depths of the CLT panel, as well as monitoring MC during ambient (no air flow-conditioned environment) and fan drying. The study has then applied the drying technique developed from the fan-drying activity to a CLT room that has undergone a wetting event. The assessment of the CLT room will investigate the differences experienced when scaling up to a larger, more complete system rather than isolated material testing.

2. Materials and Methods

2.1. Materials

The 3 layers of 75 and 125-mm thick Radiata pine (Pinus radiata) CLT panels manufactured by XLam Australia were used in this study. The material was fixed to a single species, and the construction strategy was to limit variables. Prior to beginning the test, samples were stored indoors at ambient temperature and RH.
Table 1 presents the number of samples, their corresponding sizes, test methods, and the sections in the article where each test method is described. The measured density across the various panel sizes was very consistent, with an average value of 478 kg/m3 and a low standard deviation of 1.4 kg/m3.

2.2. Coring Methodology

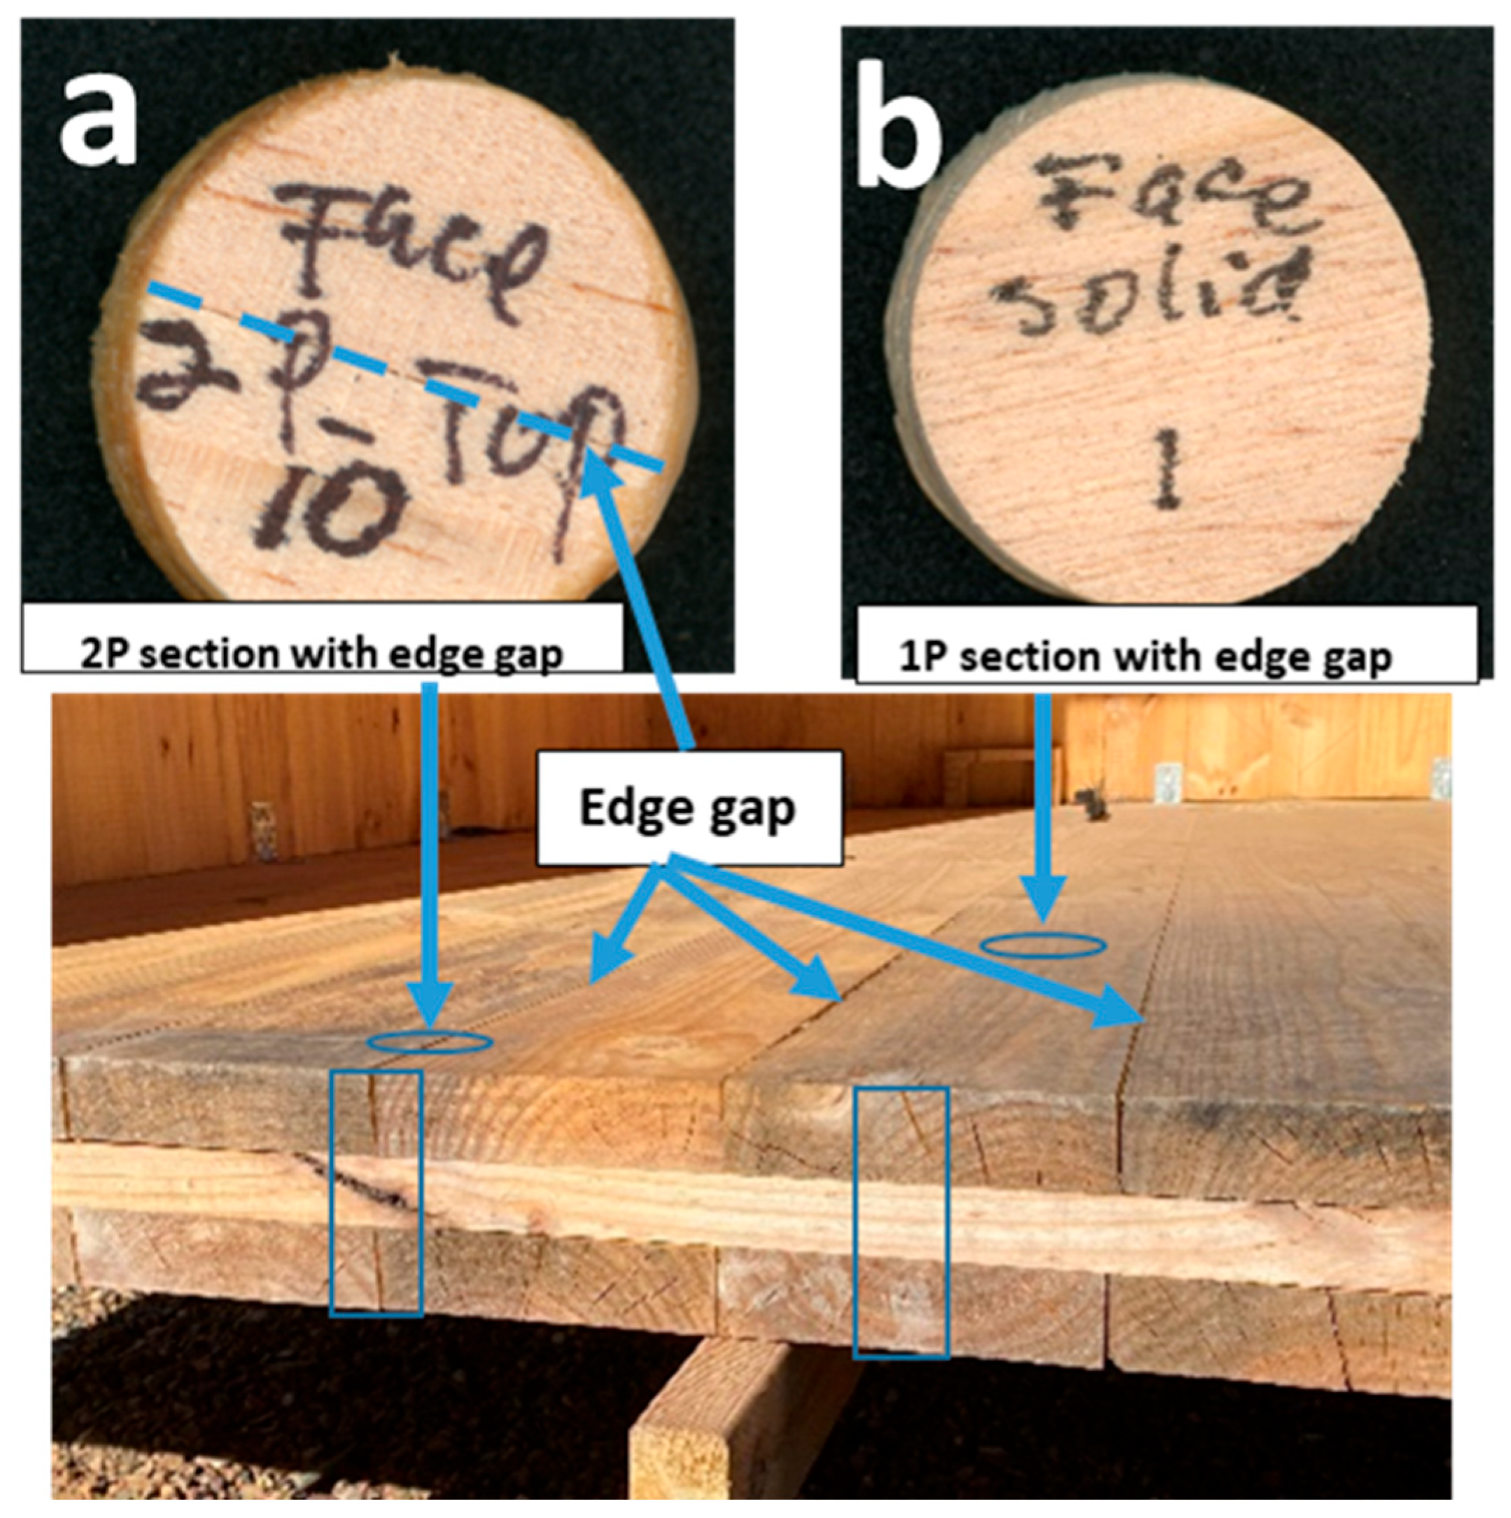
Cores, approximately 11 mm in diameter [28], were used throughout this study to measure the MC and moisture gradient (MG) of the panels through time, where MG refers to the distribution of MC throughout the sample depth as a gradient [29]. For each measurement, the cores were drilled in the tested panels (Figure 1 and Figure 2) at two different locations, corresponding to (1) one core drilled, which included an interface between the two unbonded face boards (Figure 1a—referred to as 2P in the text) and (2) one core taken from a solid board face (Figure 3b—referred to through the text as 1P). These two core types consider the conventional moisture uptake of laminated boards and the suggestion that the unbonded face boards in some CLT designs may trap water as the face boards swell and cup away from or towards one another.
Cores were then sliced into 13 thick discs (5–10 mm thick) to give a detailed representation of the MG for the CLT at each of the evaluation periods for the respective testing scenarios discussed in Section 2.3 and Section 2.4 [29].

2.3. Moisture Uptake

Prior to fan drying, the water ingress/moisture uptake of the ‘moisture uptake’ samples (Table 1) was determined for the 40 × 40 × 125 mm CLT samples. This trial was done to determine the mass gain of CLT sections when submerged in water. To include the three main orientations inherent to a CLT panel (three directions of face, edge and end), three sets of samples were selected for testing. The moisture uptake refers to the mass increase as a result of material soaking and water uptake. The moisture uptake was measured by soaking the CLT sections in room-temperature water (at approximately 22 °C) for a sufficient amount of time until water uptake (mass change) stabilised (approximately 120 h).
After the saturation period of 120 h, samples were removed from the water and then placed in a drying oven at 103 °C until they reached moisture equilibrium to determine the overall sample moisture content according to AS/NZS 1080.1 [30] Timber. The MC percentage was calculated using the oven-dried method (according to AS/NZS 1080.1) as follows:
M C   % = w w w d w d × 100 %
where w w is the wet weight and w d is the oven-dried weight of samples.

2.4. Ambient Drying

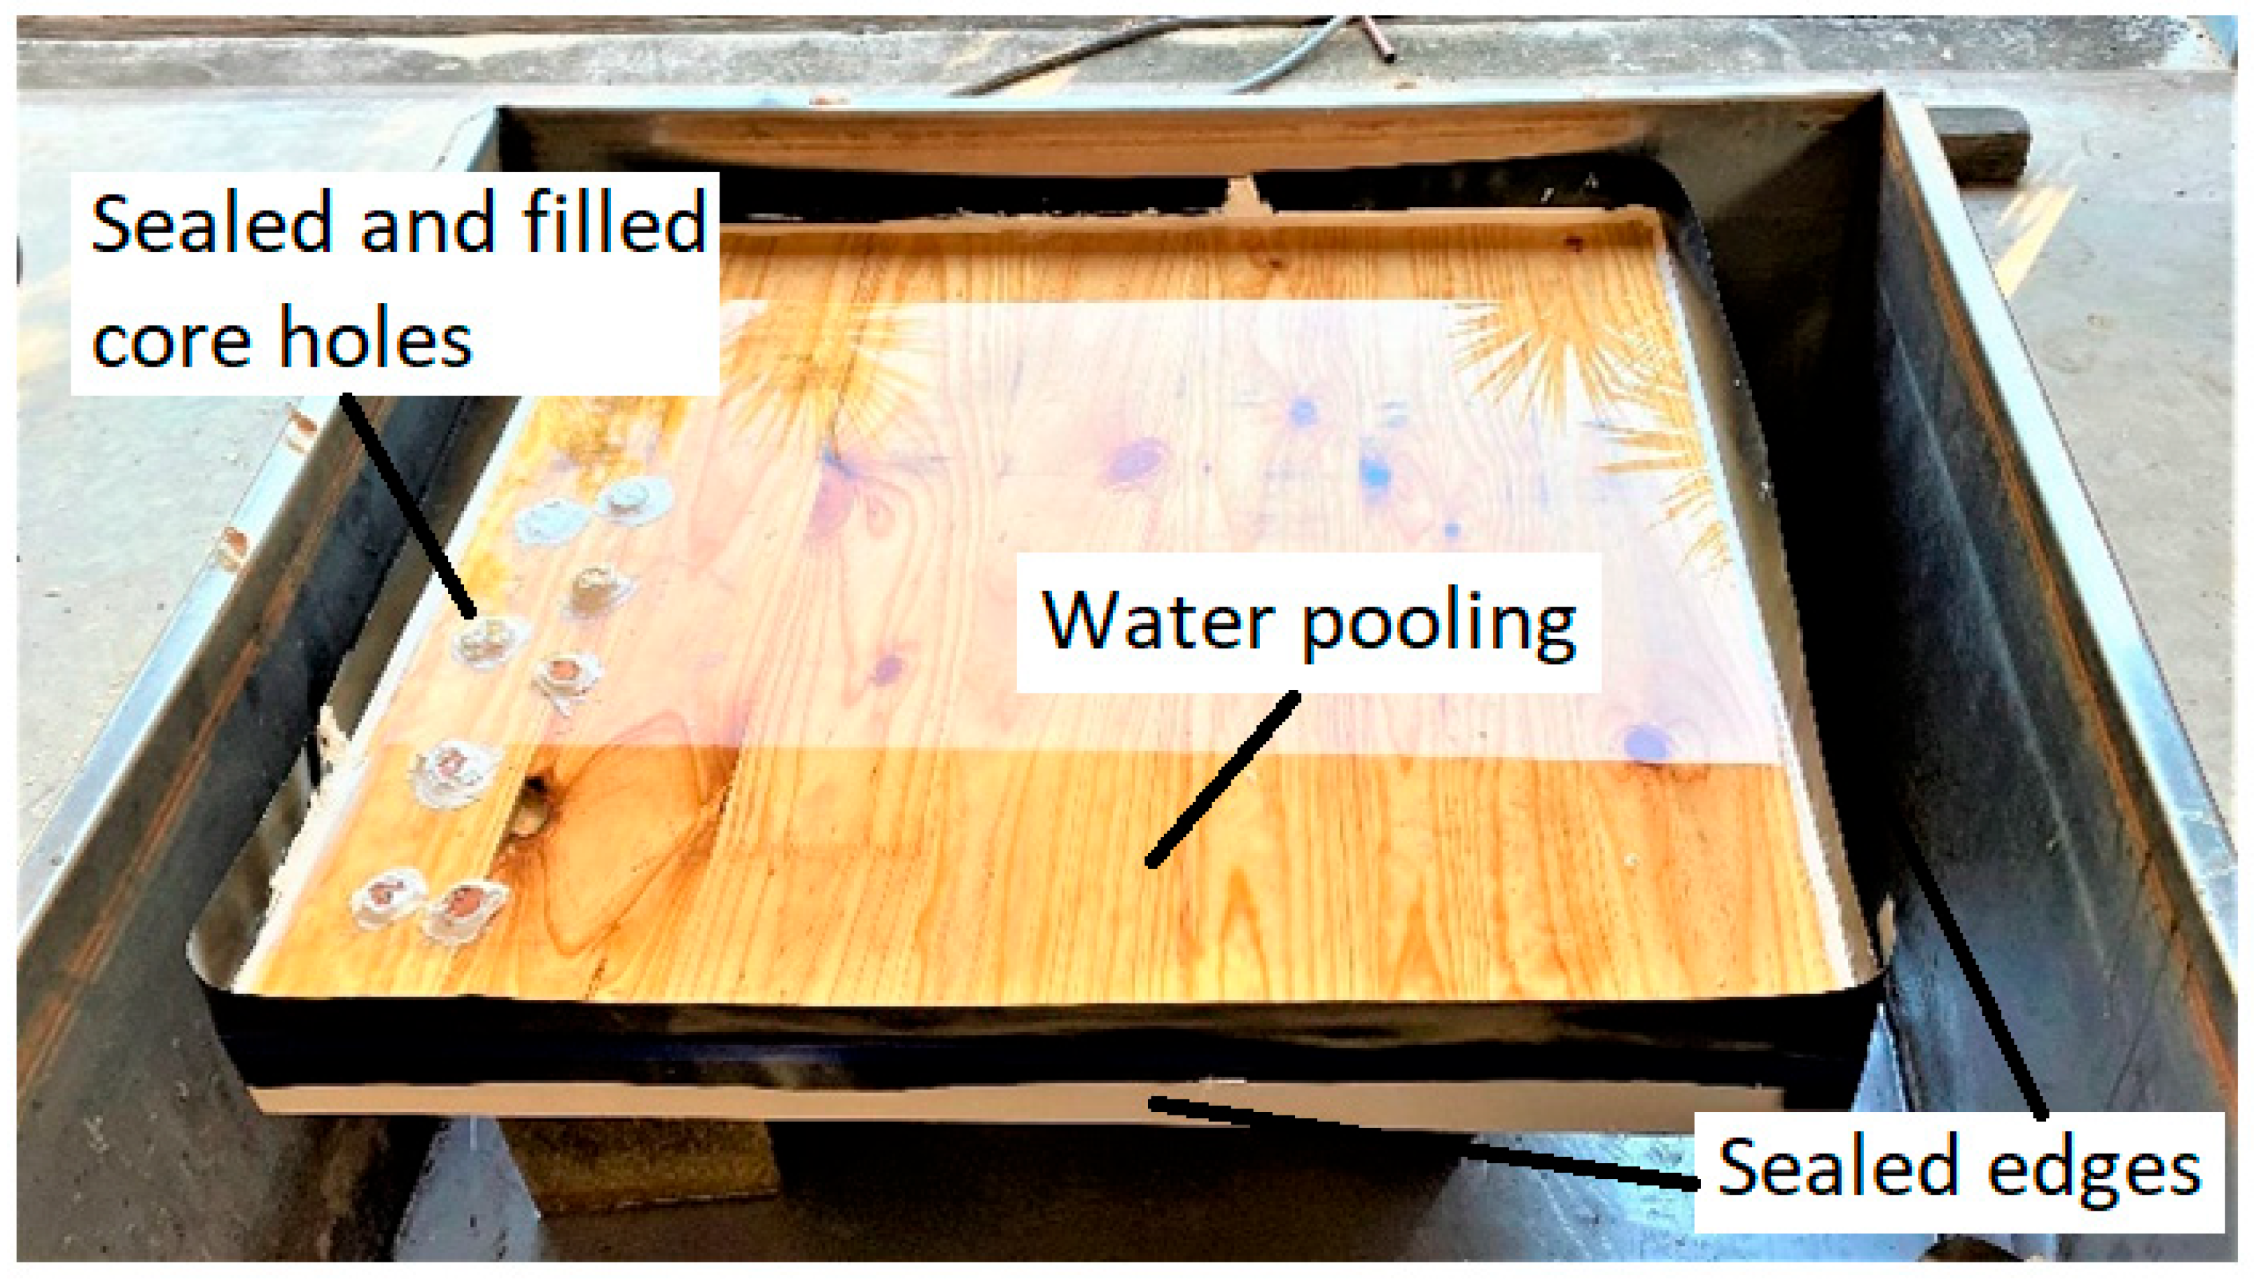
The ambient drying refers to the panel drying performance with no drying assistance (fan) in a conditioned environment. The CLT panel for ‘ambient drying’ was wrapped and sealed on five surfaces with Sikaflex silicon-based sealant and moisture barrier wrap, leaving one 800 × 850 mm surface exposed to water pooling at room temperature (Figure 2) for 6 weeks (September to December 2020). The samples simulate a flash flooding or plumbing leak scenario occurring on the floor panel surface only (Figure 1). The importance of this section is to provide a foundation point for the moisture absorbance on the panel face, followed by slow drying with no assistance other than environmental conditions. During the wetting of the panel, 78 cores were taken following the procedure detailed in Section 2.2 to determine the dry MC and MG of the panel over the surface of the panel. Cores were taken about every hour for the first 8 h then 24, 48, 72 and 96 h. The location from which the cores were taken was not of considerable importance given the consistent wetting conditions across the panel face. Each cored section was then sealed using silicone (Sikaflex silicone sealant) and a dowel (20-mm dowelled pine (clear)) to minimise moisture gain or leak in those sections (Figure 1).
After the wetting process (Figure 2) had concluded, the exposed panel surface was drained of the pooling water and allowed to dry at ambient conditions of 25 ± 2 °C and 62 ± 11% relative humidity (RH). The drying process was monitored for a period of 96 h in which the sets of two cores (1P and 2P) were taken (see Section Figure 1) for procedure) every hour for the first 8 h and then every day.
Figure 1. Coring schematic (a) 2P and (b) 1P sections that were targeted for coring.
Forests 14 01007 g001
Figure 2. CLT section exposed to water pooling and used for ambient drying trial.
Forests 14 01007 g002

2.5. Fan Drying

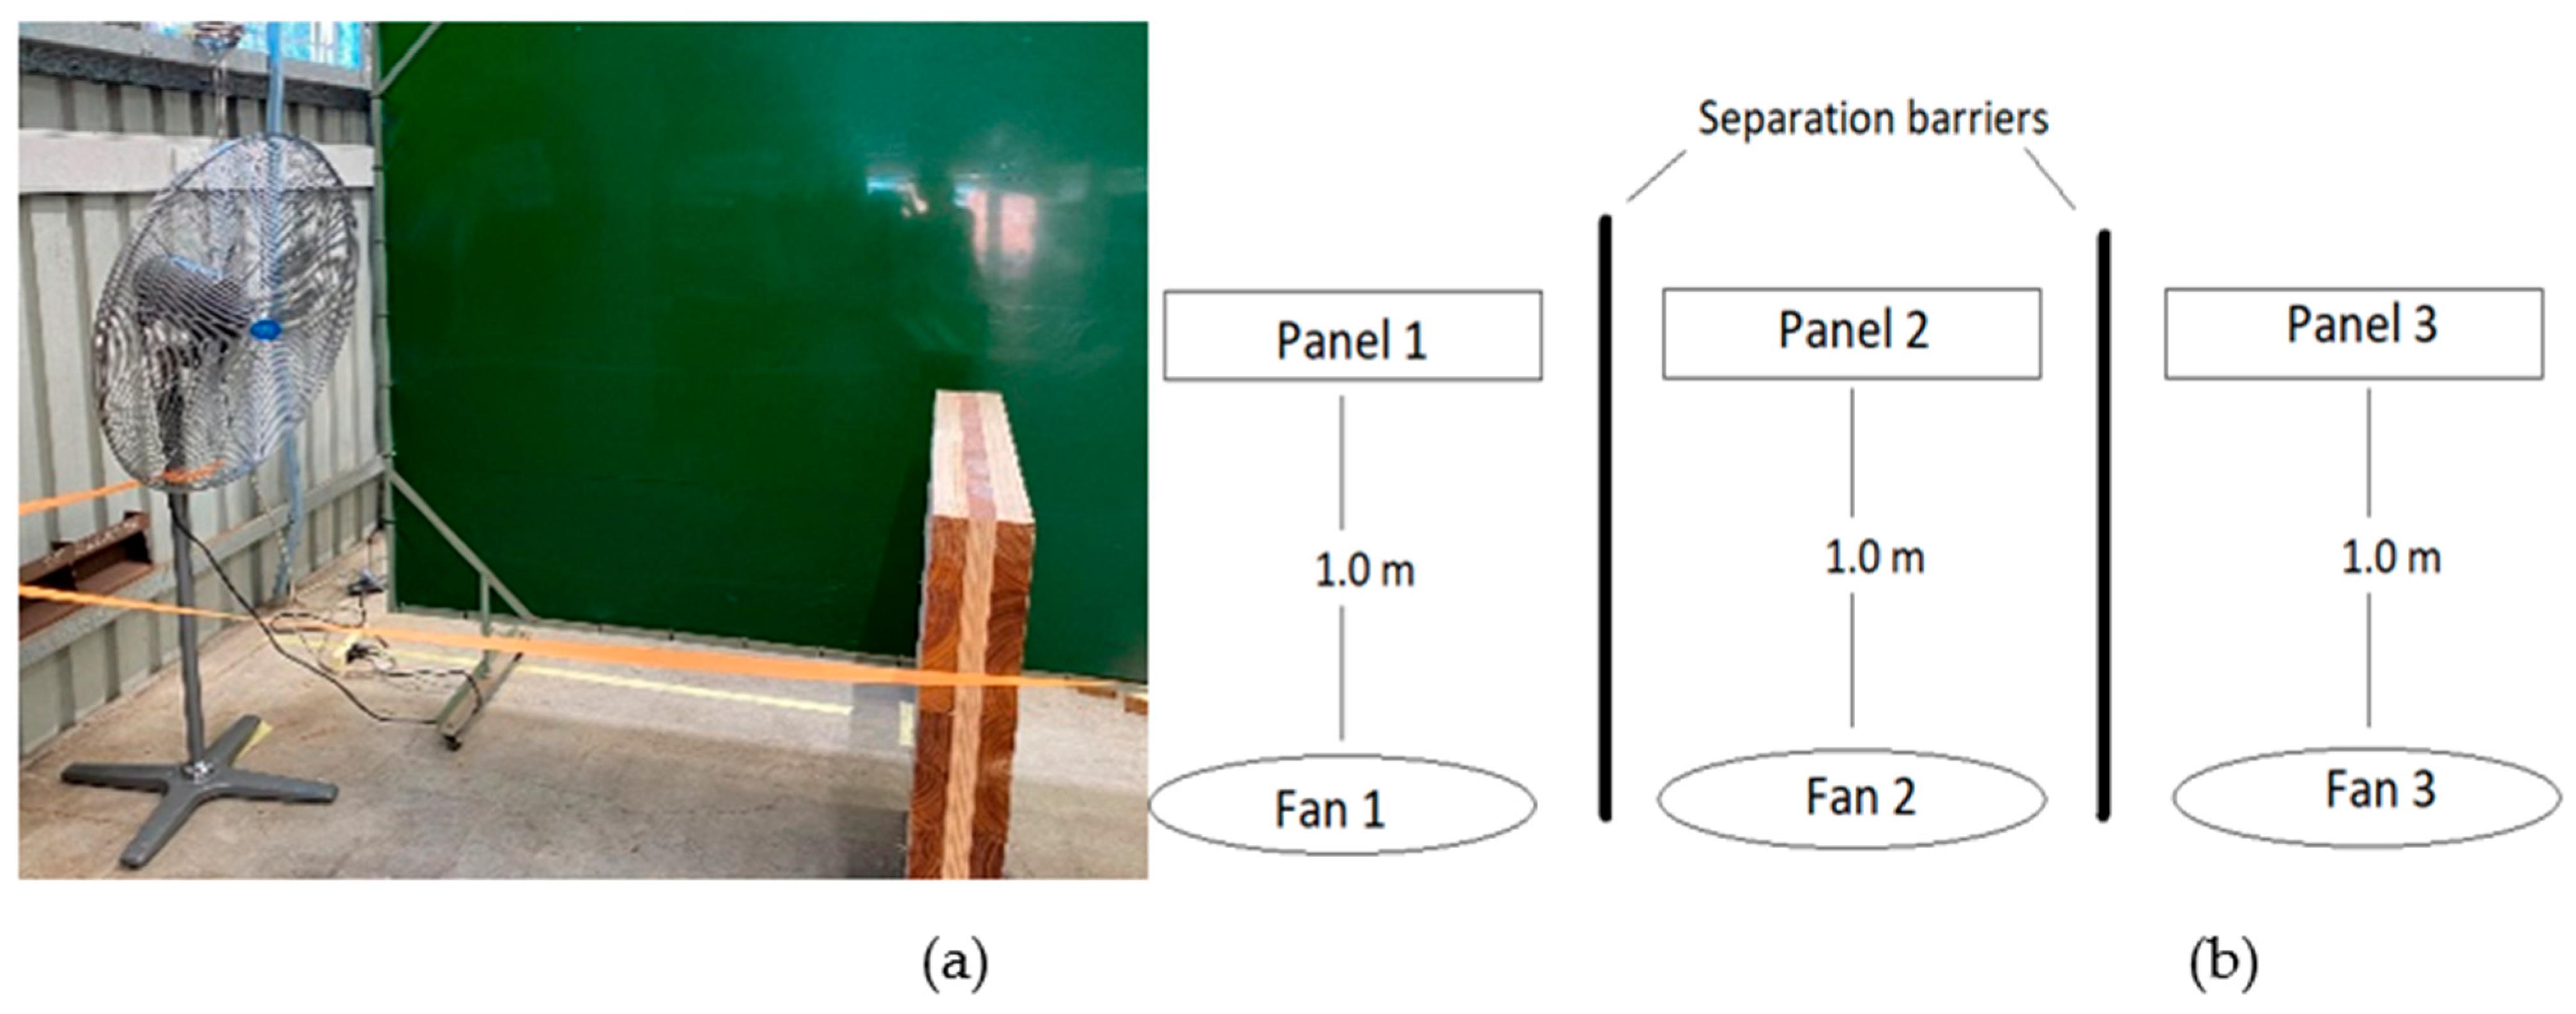
Similar to the activities presented in Section 2.3, the three ‘fan drying’ panels were saturated for 120 h before being placed in front of a fan as shown in Figure 3.
Figure 3. CLT panel drying setup (a) general setup of fan, sample and barrier between samples, and (b) the experimental setup for all three tests (top view).
Forests 14 01007 g003
Prior to the drying, the fans (PF-75—Industrial Pedestal Fan—750 mm) used for the experiments were evaluated for air velocity for three different fan speed settings and at three different distances. The air velocity was measured using a vane anemometer (Ahlborn/Schiltknecht, Almemo 2690/MiniAir60, Germany) and the results are presented in Table 2. Using this preliminary data, drying experiments were set up at a distance of 1.0 m using one of the three wet panels for each fan speed setting. The drying trial (Figure 3) took place during September and October 2021. Relative humidity and temperature were recorded during the fan drying trial, the average RH and temperature were 62 ± 23% and 20 ± 5 °C, respectively.
During the drying trial, both coring (using the method from Section 2.2) and probing (resistance meter MC measuring) were conducted for a period of 120 h (at two intervals per day, involving taking three sets of two cores (1P and 2P) for each measurement interval). Additionally, probing was conducted at 3 depths (15, 30, and 50 mm) and every 2 h using a resistive moisture meter (Delmhorst DCR22, Sydney, Australia). As the moisture content of the sample increases, the electrical resistance is lower [26]. Although the method provides fast moisture readings at different depths, it is more accurate in a lower moisture content range (6%–12%) than a higher range, and hence, the cores in conjunction with the probe readings are considered complementary [31].
During drying, probe readings of the CLT panels were taken from the surface exposed to fan drying faces (FS) on both the boards and the void between two unbonded parallel laminates, in the end, the grain of the core boards, perpendicular to the side of the surface layer, and on the back (NFS—face of CLT not exposed to fan drying).

2.6. CLT Structure Drying

Based on the understandings developed through the ambient and fan drying experiments, it was confirmed that fan drying significantly reduced the drying time required. An experiment was conceived to evaluate the investigated drying methods in Section 2.4 and Section 2.5 on a larger scale structure. A standalone CLT building (3.4 × 3.4 × 3 m) was constructed at the Salisbury Research Facility (Brisbane, Australia) to study the climate effects on moisture changes in an isolated structure during the various stages of construction. The building in construction, without the cladding, is shown in Figure 4. The effects of moisture change on the structure were targeted during the stage when the building had walls, floors, ceilings, steel roof, and wrap added but was still unsealed from the external environment. A sprinkler with a 10 mm diameter nozzle was placed inside the structure and directed at the back right roof corner (Figure 4) for 4 days. The fan drying trial was conducted by positioning fans inside the room and monitoring moisture movement within the CLT panel, as shown in Figure 5.
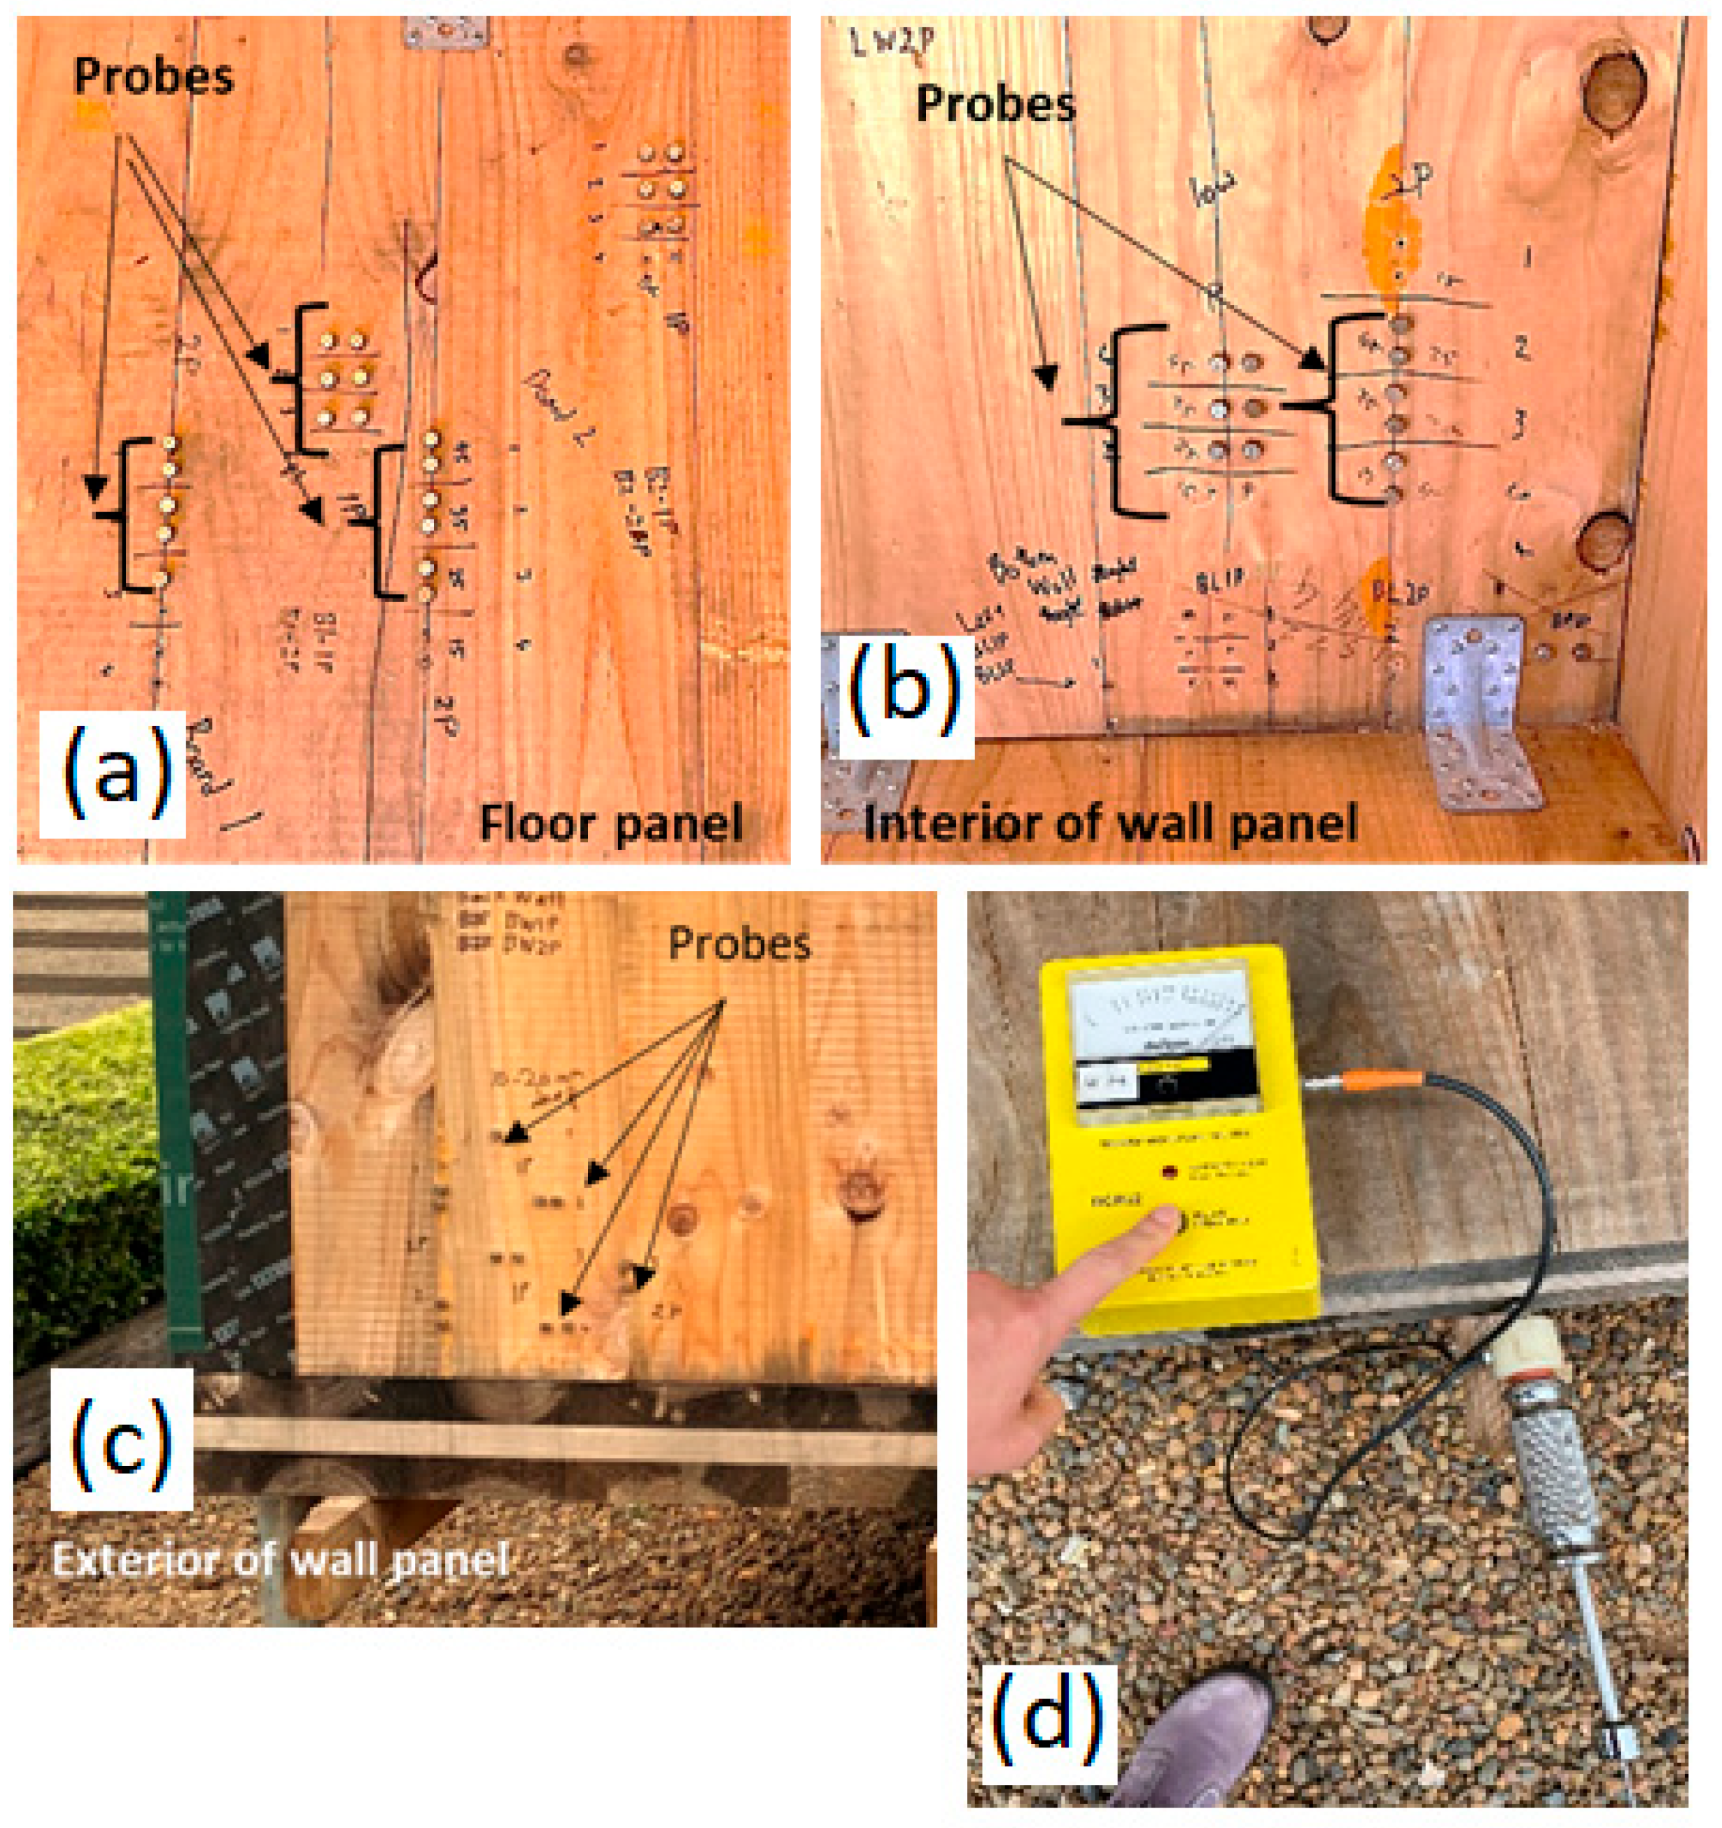
After the wetting event, moisture monitoring of the CLT structure was conducted during the 3-week construction period. Moisture measurements were taken every 2 h for the first three days and every 24 h after (Figure 6). Here, 30 pairs of resistive moisture probes were used in the depth of the panel to monitor moisture at 15, 25, 35 and 45 mm depths (Figure 5). The fixed probes were positioned both inside the area surrounding the wetted area (walls and floor—Figure 4 and Figure 5) and on the outside of the room (Figure 7). The areas were labelled based on their location relative to fan airflow direction. The two main areas of interest had direct fan airflow: the corner interior wall panel and the ‘high wall’ section shown in Figure 4 (right). Both fans were set to the maximum (setting 3) airspeed as measured in Table 2 at an approximate distance of 1 m from the wall. The section in the direct direction of airflow was labelled as a high wall; the middle height wall was just below the fan airflow, and the lower wall was the corner of walls and floor panels (Figure 4). The exterior wall panel shown in Figure 5c was not exposed to any fan drying although was exposed to environmental drying via the sun.

2.7. Statistical Analysis

The data collected throughout this study have been statistically analysed using Analysis of Variance (ANOVA) (α = 0.05) to investigate the effects of different variables on the MC determined for CLT sections. Genstat [32] was used for the analysis. The differences between the means of the experimental data were assessed using Tukey’s HSD (α = 0.05). The parameters that had a significant effect on output values were reported in each section.
To investigate the effects of drying on repeated time slots, the time-series nature of the data was taken into account by an analysis of variance of repeated measures [33], via the AREPMEASURES procedure of Genstat [32]. This forms a split-plot analysis of variance (split for time). The Greenhouse-Geisser epsilon estimates the degree of temporal autocorrelation and adjusts the probability levels for this.

3. Results and Discussion

3.1. Investigative Study

3.1.1. Ambient Drying

Both sample areas (1P and 2P) reached MC higher than FSP after being exposed to free water sitting on the panel’s surface after the exposure period of 6 weeks, with elevated moisture content above 20%, up to 30–40 mm deep. This relates to published studies of wetting CLT panels during construction and in the laboratory, which resulted in moisture levels higher than FSP at various depths (5–10 and 20–50 mm) of panels [27]. The results in this study are also in accordance with the high moisture levels of CLT panels exposed to up to 762 mm of rain [25], as detailed in the literature review. The moisture exposure trial presented in this paper was designed to focus on drying panels after the MC reached higher than the FSP.
Figure 6 plots the evolution of the MC through the thickness of the CLT panel during drying and for all recorded time steps. The data presented is an average of three cores taken at each time slot. The figure shows that during ambient drying, the surface reaches lower moisture levels compared to the higher MC values (above 40%) observed in the deeper sections (20–30 mm deep) of the panel for both 1P and 2P cores. The moisture content after 96 h of ambient drying was still high, above 20% at the surface of the 1P samples and deeper sections (20–30 mm deep) of the 2P samples. On the surface (top 5 mm) of the 2P cores, the MC reduced from 90% to below 60%, while the MC on the surface of the 1P cores remained above 80% 48 h after the ambient drying started. Edge gaps (2P sections) and cracks on the surface increase the water uptake/ingress into the panels when exposed to water [14,22,23,27,34. Similar observations were reported in the literature showing the effects of checking and gaps that can increase the water uptake in the samples [14,22,23,27,34]. Considering the differences observed between the 1P and 2P cores, with higher MC recorded for 1P (>40%) sections than 2P (<20%) sections after drying, the role of the edge gap as a pathway for moisture gain and loss needs to be considered in on-site and in-service moisture management of CLT panels. Alternatively, as mentioned earlier, edge gluing is considered to minimise moisture uptake into panels; however, depending on the type of moisture exposure and the possibility of moisture gain due to other faces exposed, edge gluing can reduce the drying speed [6,22].
ANOVA of the overall drying data set showed that both depths of reading and drying duration had significant effects on the determined MC (Table 3). Indicating the MC of the panel varies between both the 1P and 2P sections due to the various observations presented above. The significant difference between drying rate supports the discussion that 2P sections (the unbonded edge gaps) provide a means for moisture ingress to occur deeper for these CLT panels.

3.1.2. Fan Drying

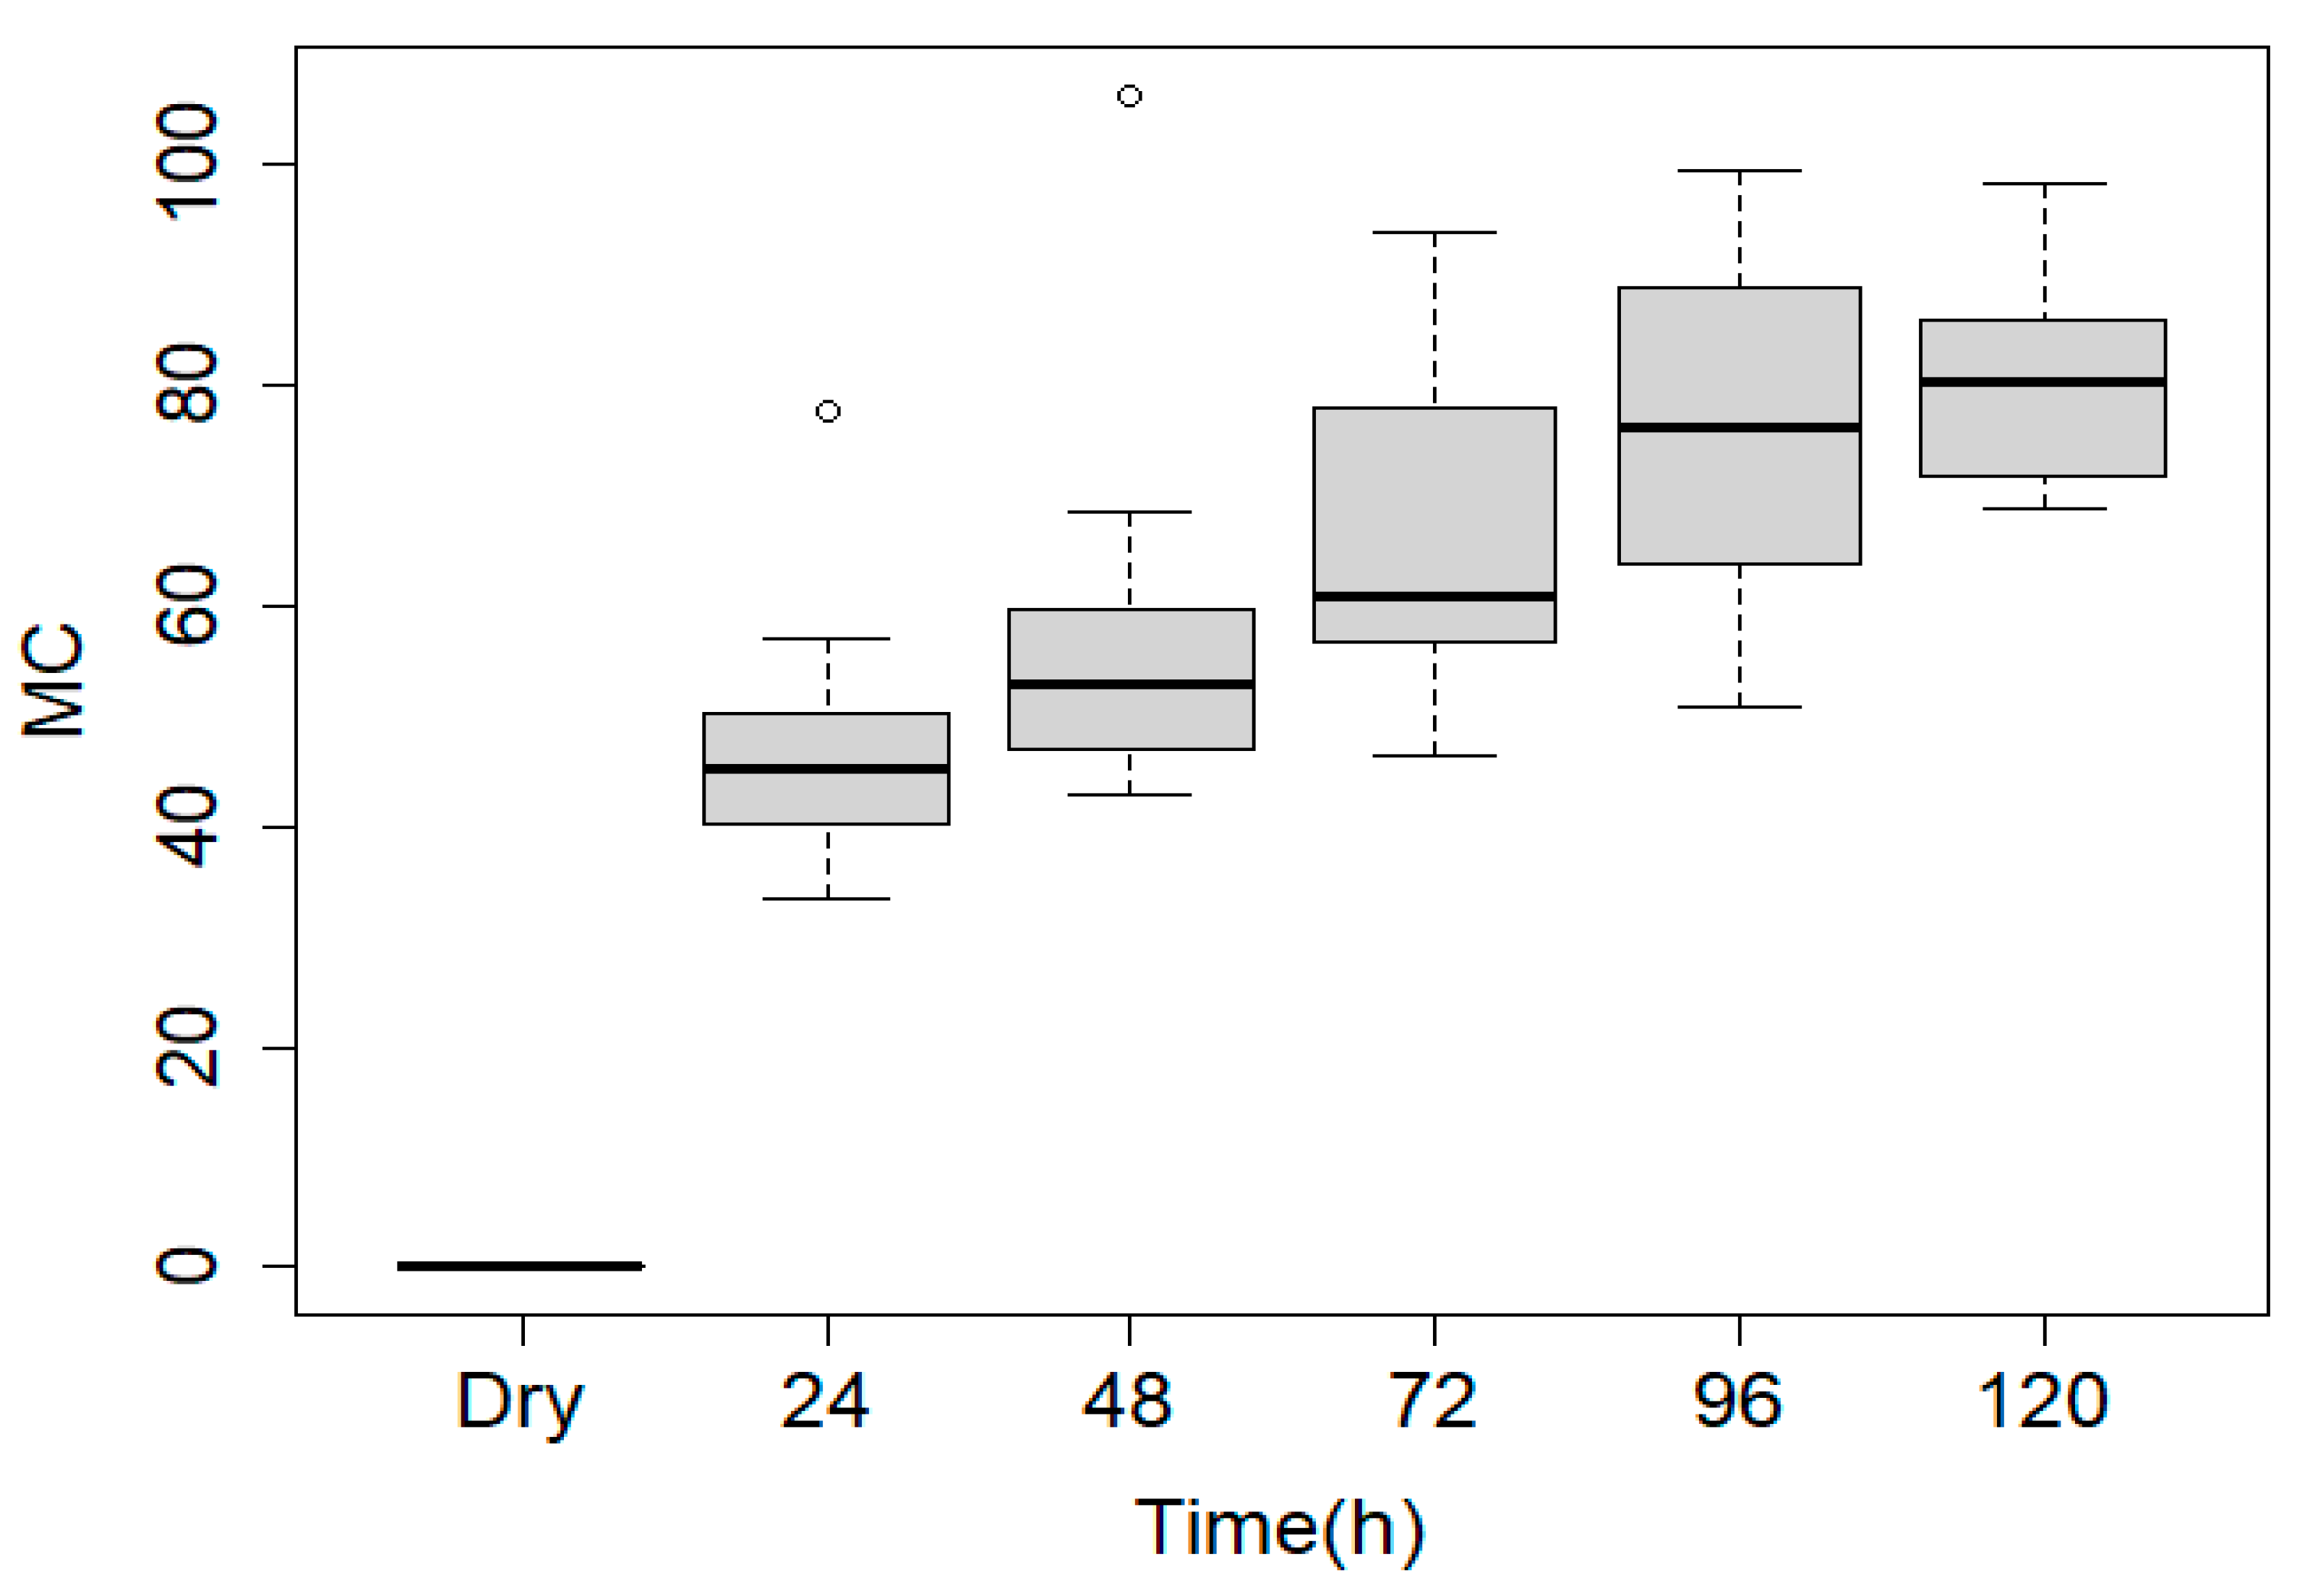
For submerged panels, sections of CLT were used to determine moisture uptake. Figure 8 shows the overall moisture uptake of block samples (mass increase) while submerged in water was monitored every 24 h for 120 h. Moisture increased to above FSP in tested sections after 24 h. The moisture uptake data was then used to submerge larger sections of CLT panels in water for 120 h. Panels were then monitored during fan drying using coring and probing.
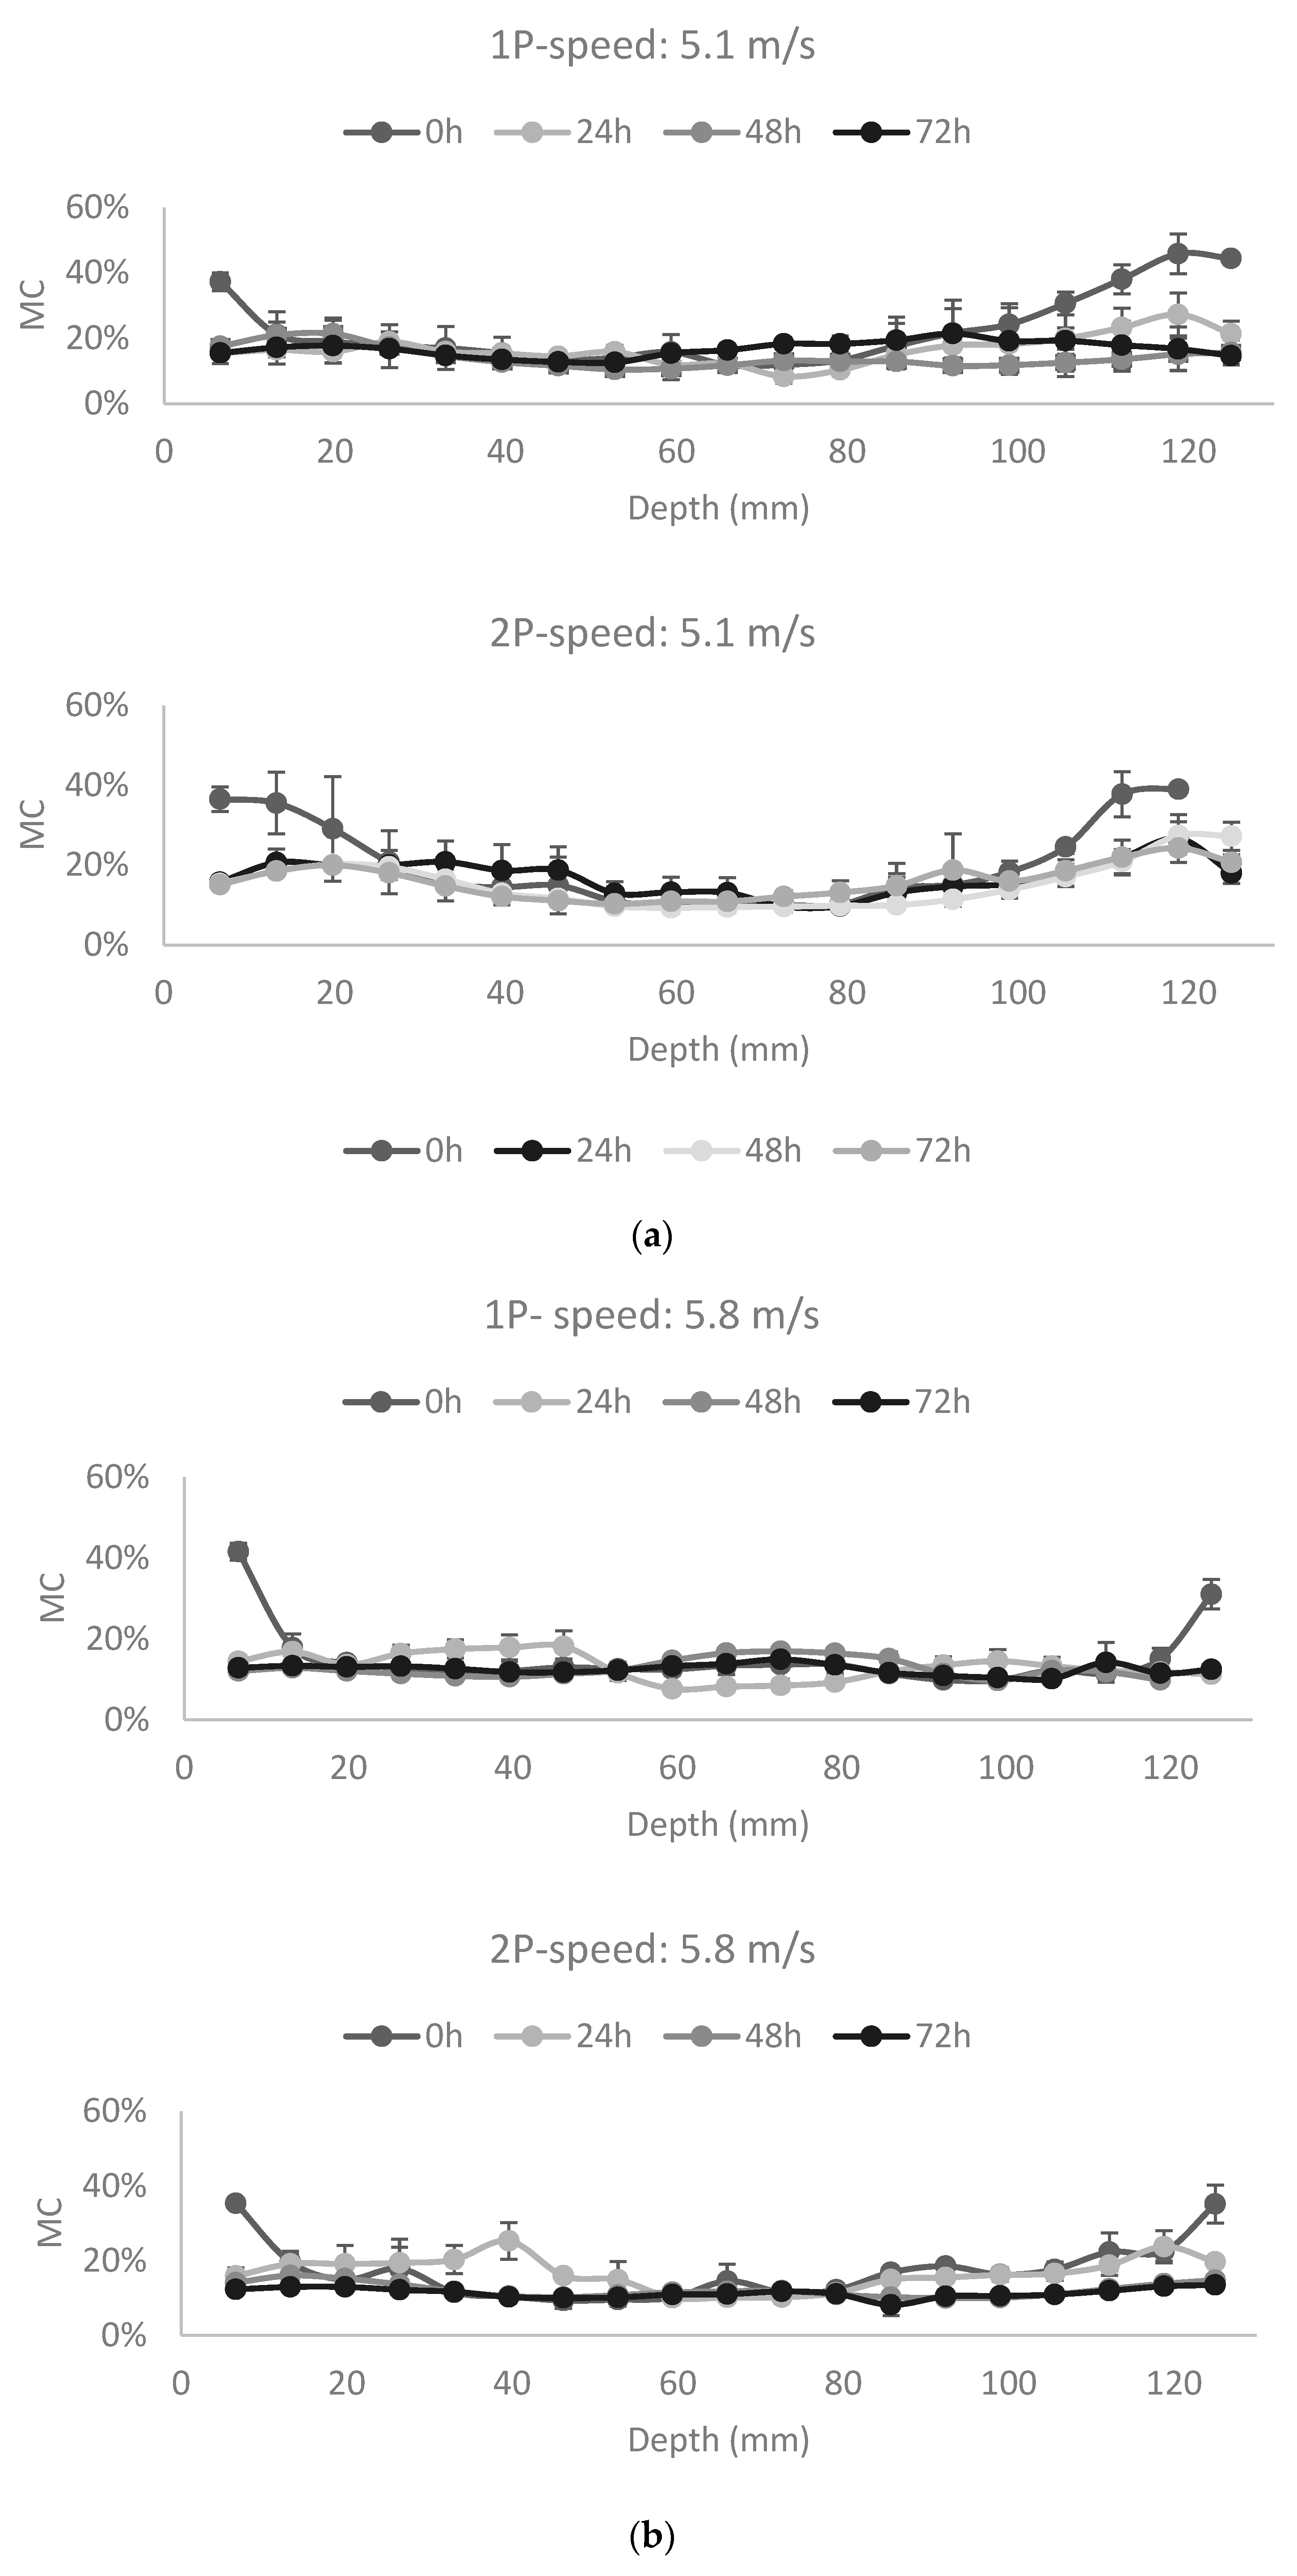
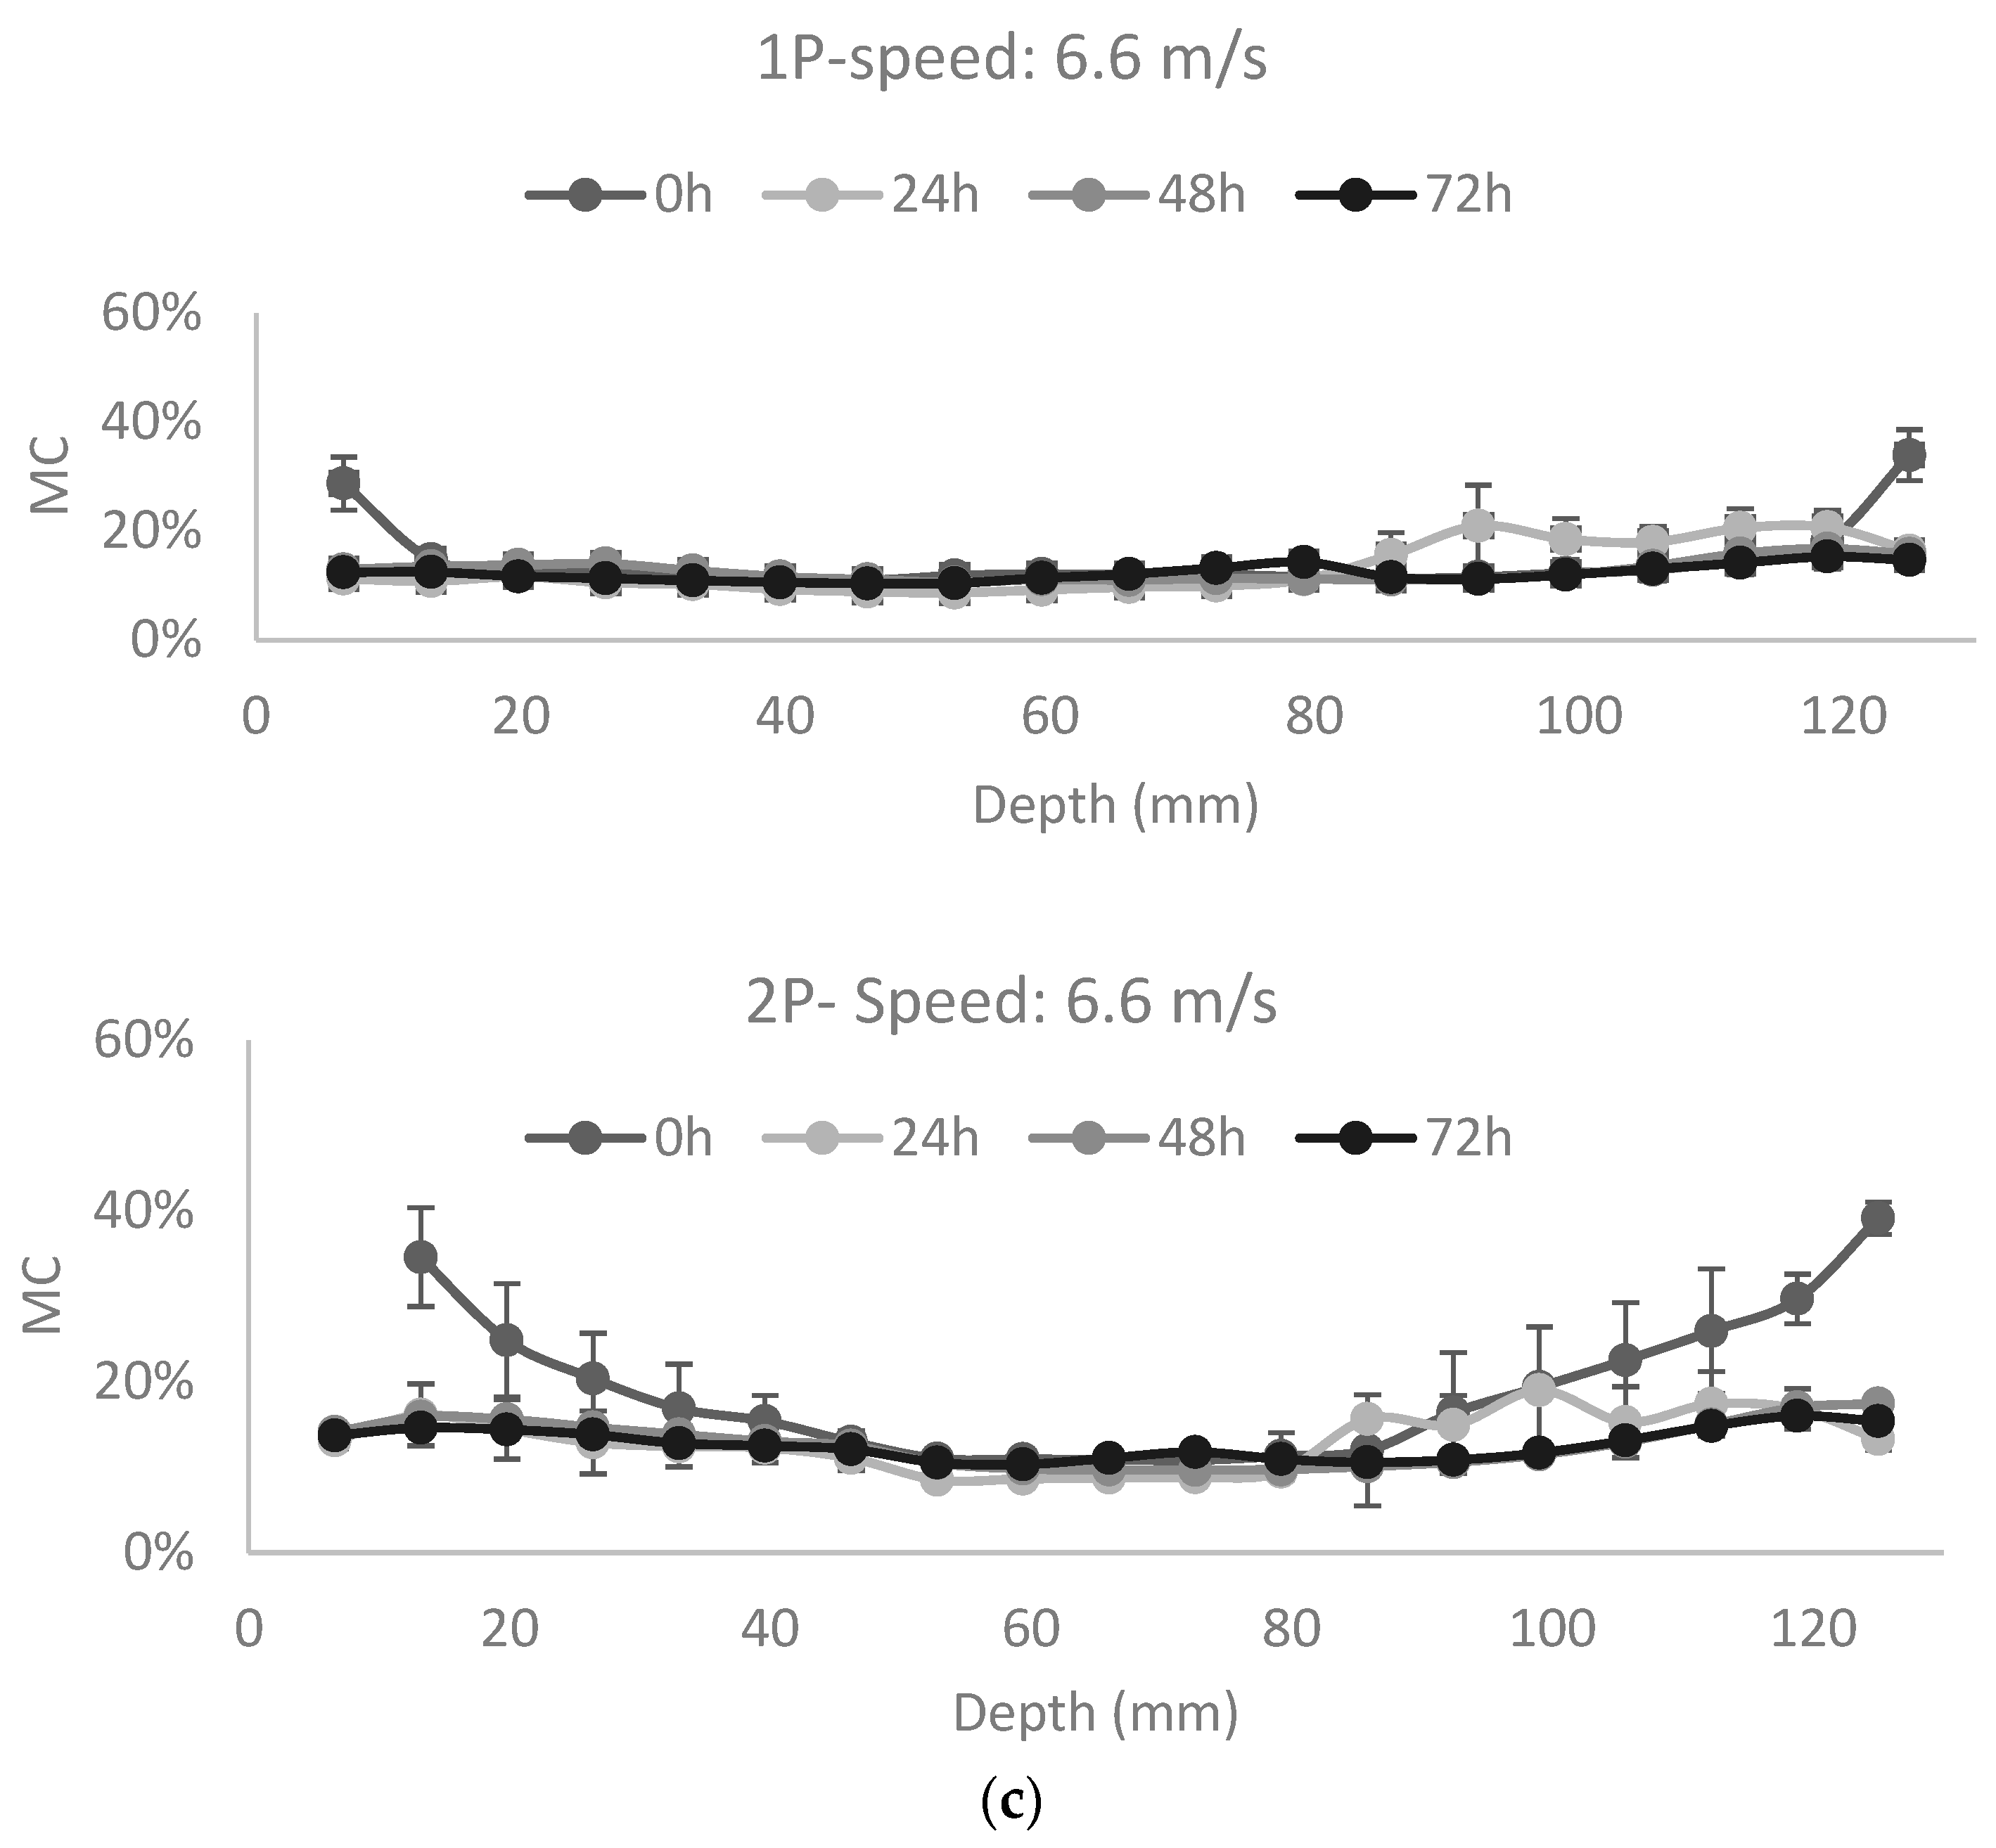
Figure 8 shows the MC of core sections taken from submerged panels after they were removed from the water and during fan drying (0–72 h). Submerged samples in the water had moisture content higher than FSP for both 1P and 2P cores on the panel’s face (Figure 8a–c), average MC recorded were 42% and 35% for 1P and 2P cores on the panel surface, respectively, after 72 h of drying. Industrial fans were used for the fan drying trial with three fan speed settings. The fan speeds tested were very close to each other; however, from the MC values determined, the MC was higher than 20% after 72 h of drying for the lowest fan speed tested.
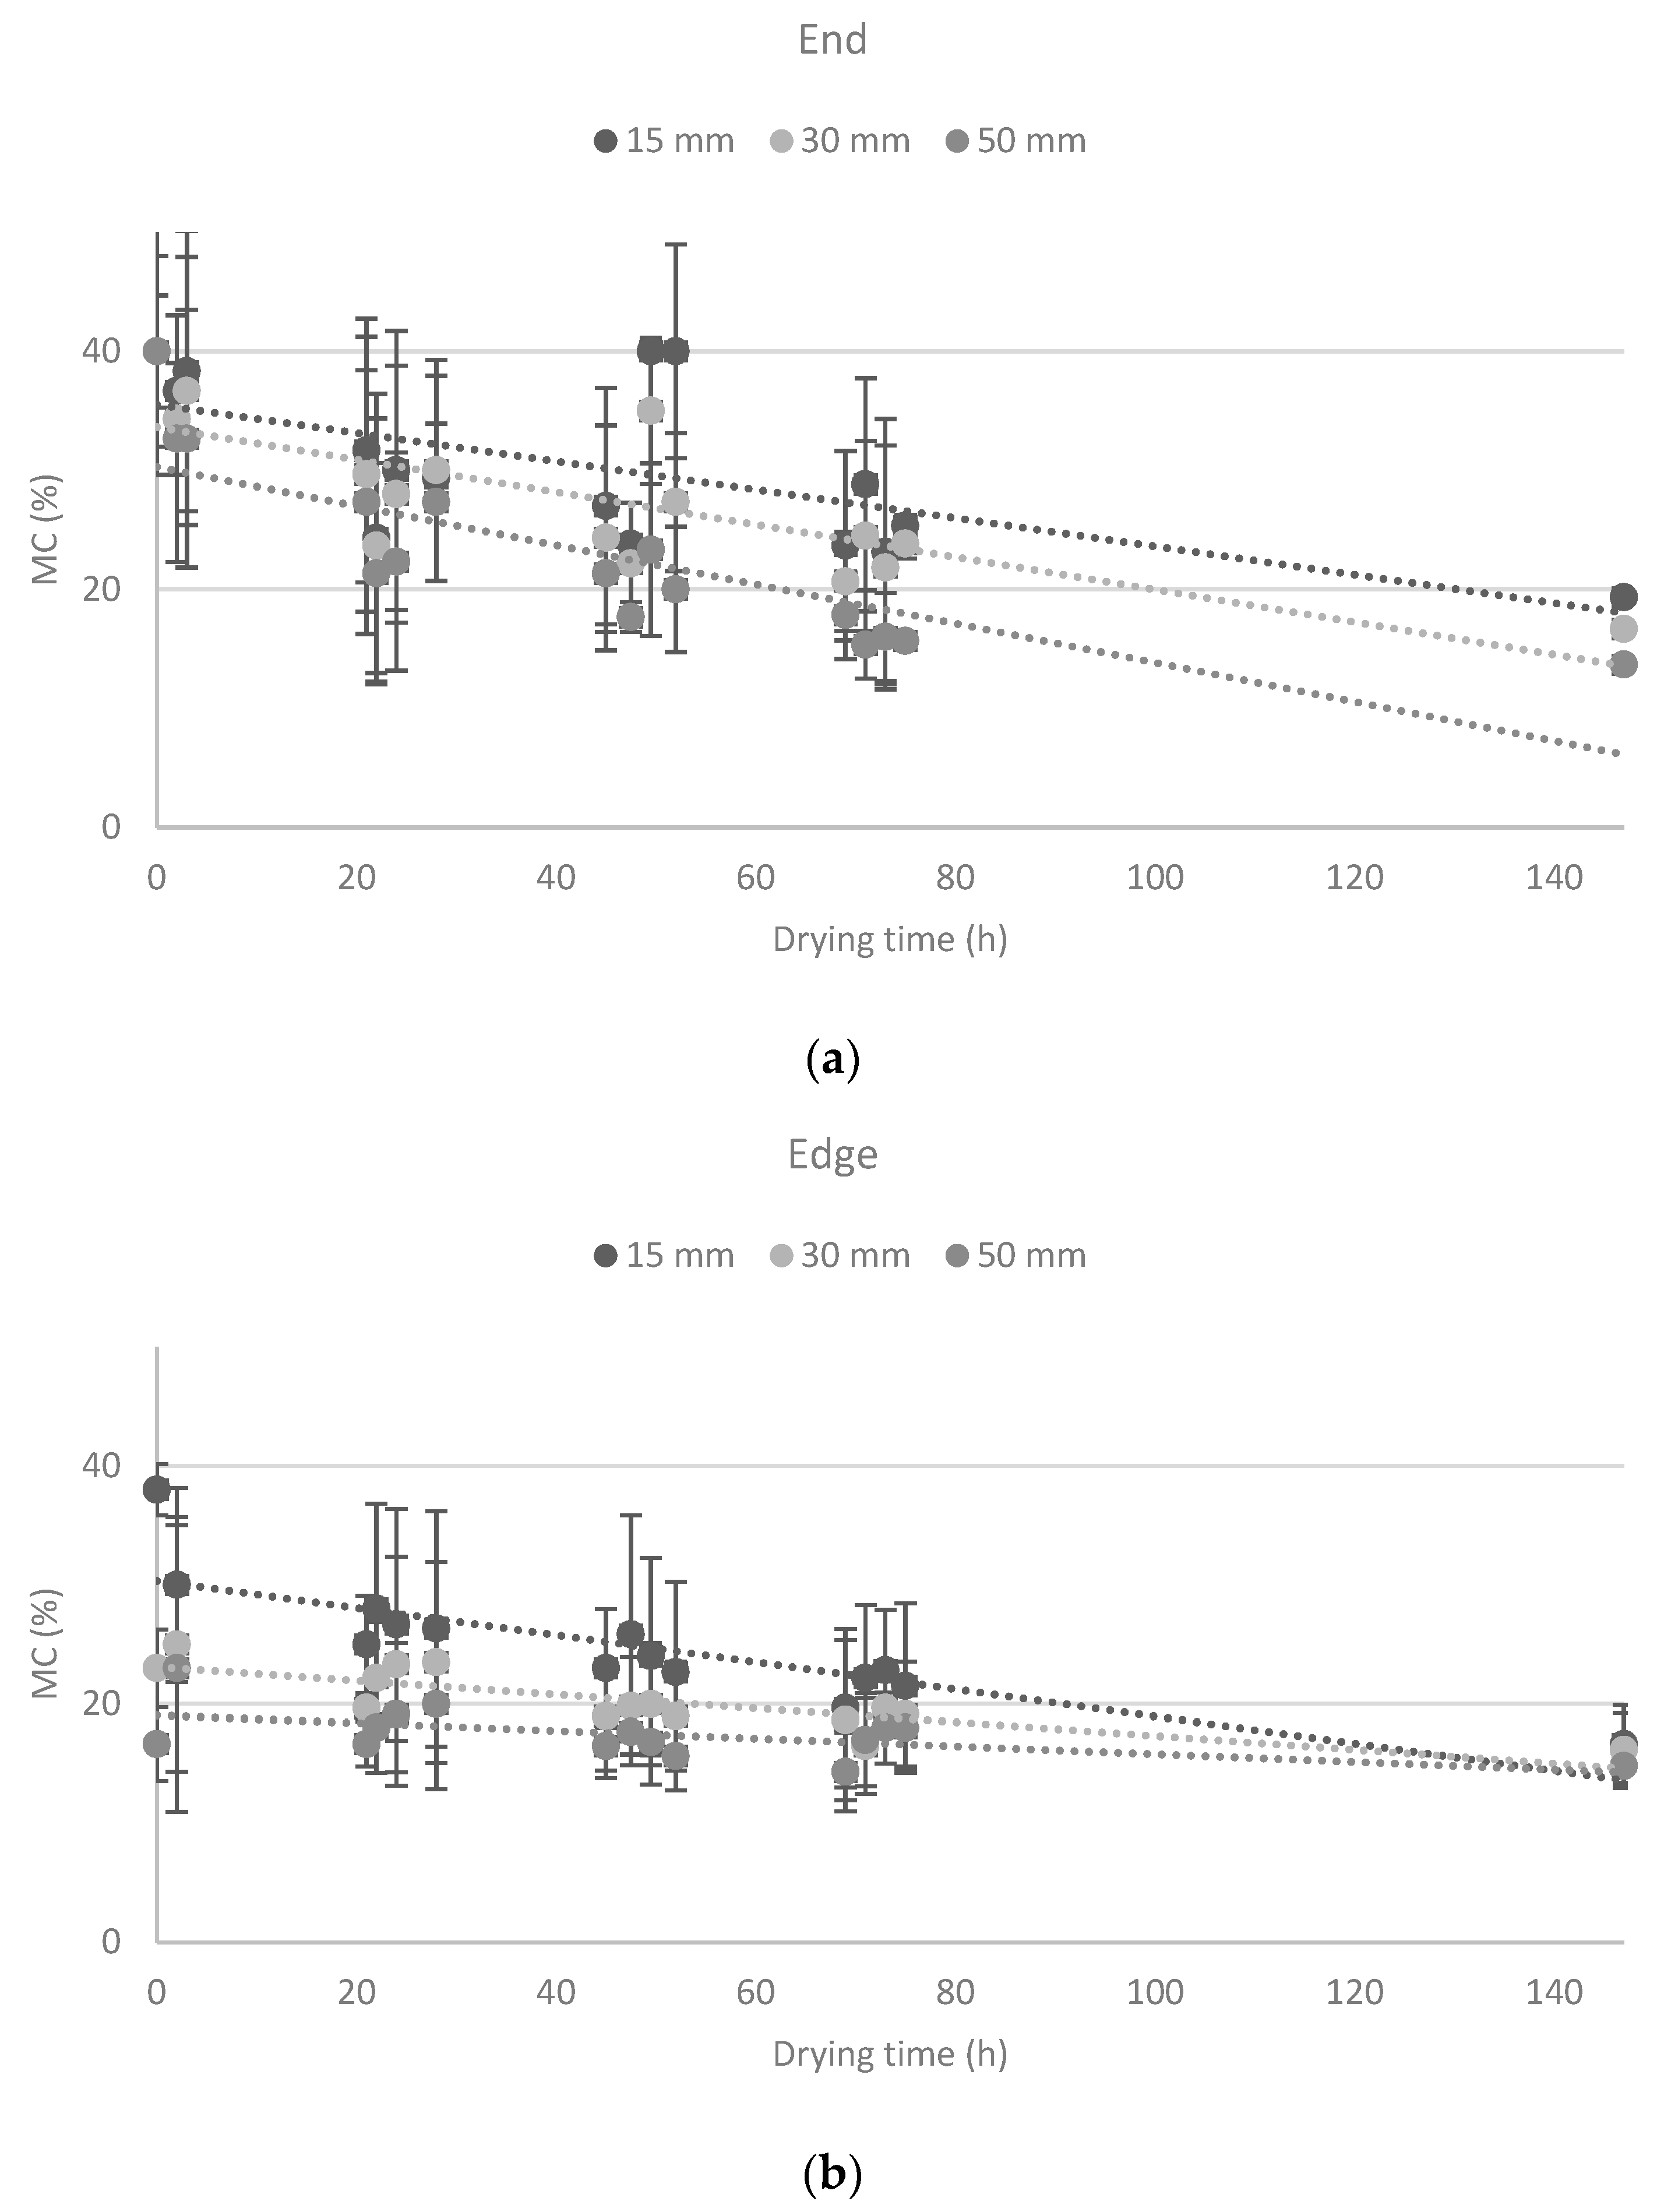
Figure 9 presents the moisture change as measured by the resistive meter over the drying time for the three depths of the meter probes. As mentioned in the methodology, for moisture monitoring using fan drying trials, both coring and probing were used for recording MC values. The moisture meter used for measurements had limitations in measuring moisture content above 40%; therefore, a ceiling level of 40% was shown, although it should be noted that the actual MC value could be in fact higher than this. The low accuracy of readings at higher moisture content (>26%) has been reported previously [34]. The moisture meter data summary for the edge sections (sections of the panel with end grain exposed to moisture) of panels showed elevated moisture content (above 20%) in 15- and 30-mm depth (Figure 10) at 24 h of drying. For the end sections of the panel, the moisture content was above 20% for the 15-, 30- and 50-mm depths of the panel (Figure 9).
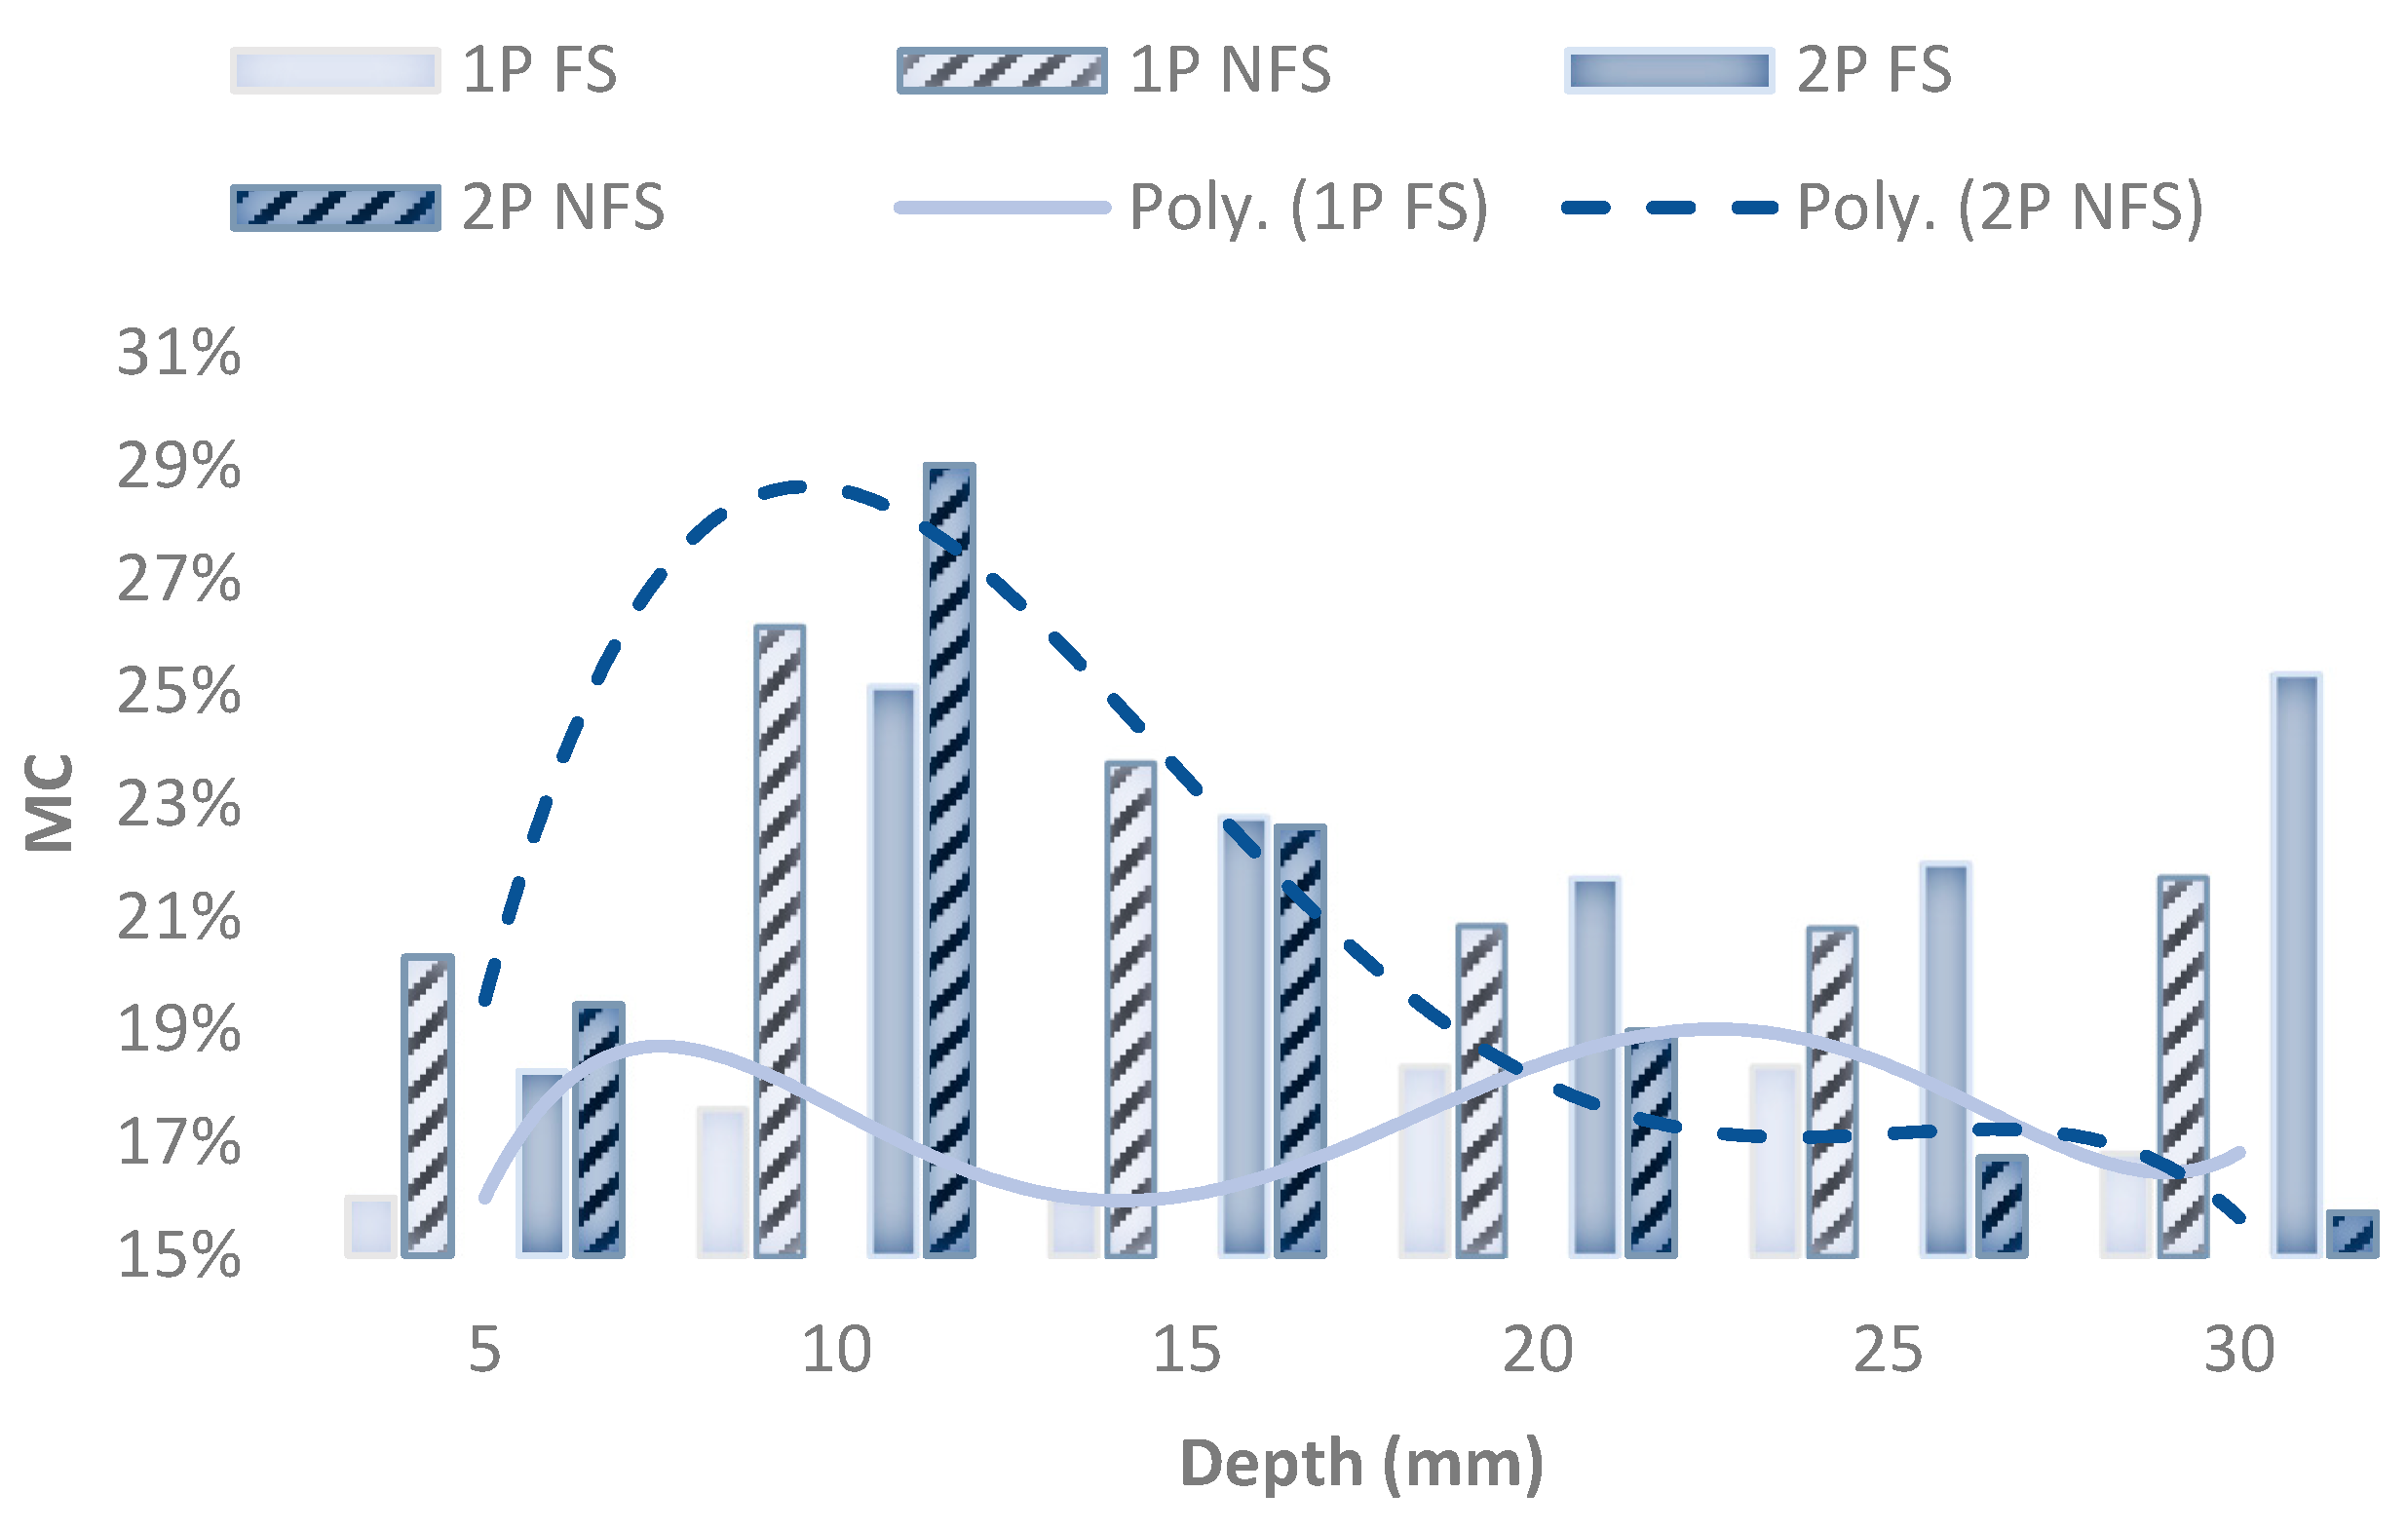
The panel face exposed to the fan appeared to dry faster than the non-exposed face of the panels, as shown in Figure 10 after 24 h of fan drying. The average MC determined for the non-fan-facing side of the panel was above 20% for 1P sections up to 30 mm deep, while the MC on the fan-facing side of the panel was reduced to below 20% (Figure 10). For 2P sections, the MC was higher than 20% on the non-fan facing side in the top 15 mm of the panel and dropped to below 20% from 20 mm depth (Figure 9). A previous study by Wang [35] showed that under unfavourable conditions, moisture accumulation in the face of the panels can cause high moisture gain, specifically in gaps between the boards. Another study by McClung et al. [14] on CLT wall assemblies wetted and monitored during drying showed that the drying rate varies between species tested and the depth of the panel and is dependent on the permeability of the surface exposed to drying conditions. Species with higher vapour permeability (such as European spruce) reached a moisture content of 11% after 12 months of installation, while others had a higher MC of 17%. The study of CLT structures drying pre- and post-construction reported that the exposure face, location of the panel, and weather barriers can influence the drying rate and time required [22]. The drying rate of wetted CLT panels has been reported to be dependent on local conditions, connection/overlapped sections, and protection or coating applied, and these factors can delay the drying further.
Compared to the results of the ambient drying presented (Figure 7), the measured MC falls below or at about the target 20% MC level after 72 h and thus the coring was stopped at this point. Due to the ease of rapid assessment, probing with a moisture meter was continued for 120 h. The ambient drying results showed that the moisture content values were still above 80% 48 h after the process began, while fan drying resulted in quicker removal of moisture from the structure.
Three different fan speeds were used for drying the CLT sections, with the results detailed in Table 4. The drying rate was different in 1P and 2P cores, and overall, slower fan speeds showed slower drying rates. A faster drying rate is favourable to avoid moisture accumulation within the panels and construction interruption [36,37].
Figure 11 shows the data collected during the fan drying experiment using moisture probes on the end and edge sections of the panels at different depths. The changes in moisture content of the surface and depth of 1P and 2P sections show the faster drying of surface sections in 1P samples than in 2P samples. There was moisture content higher than 20% in 2P sections after 72 h of drying.
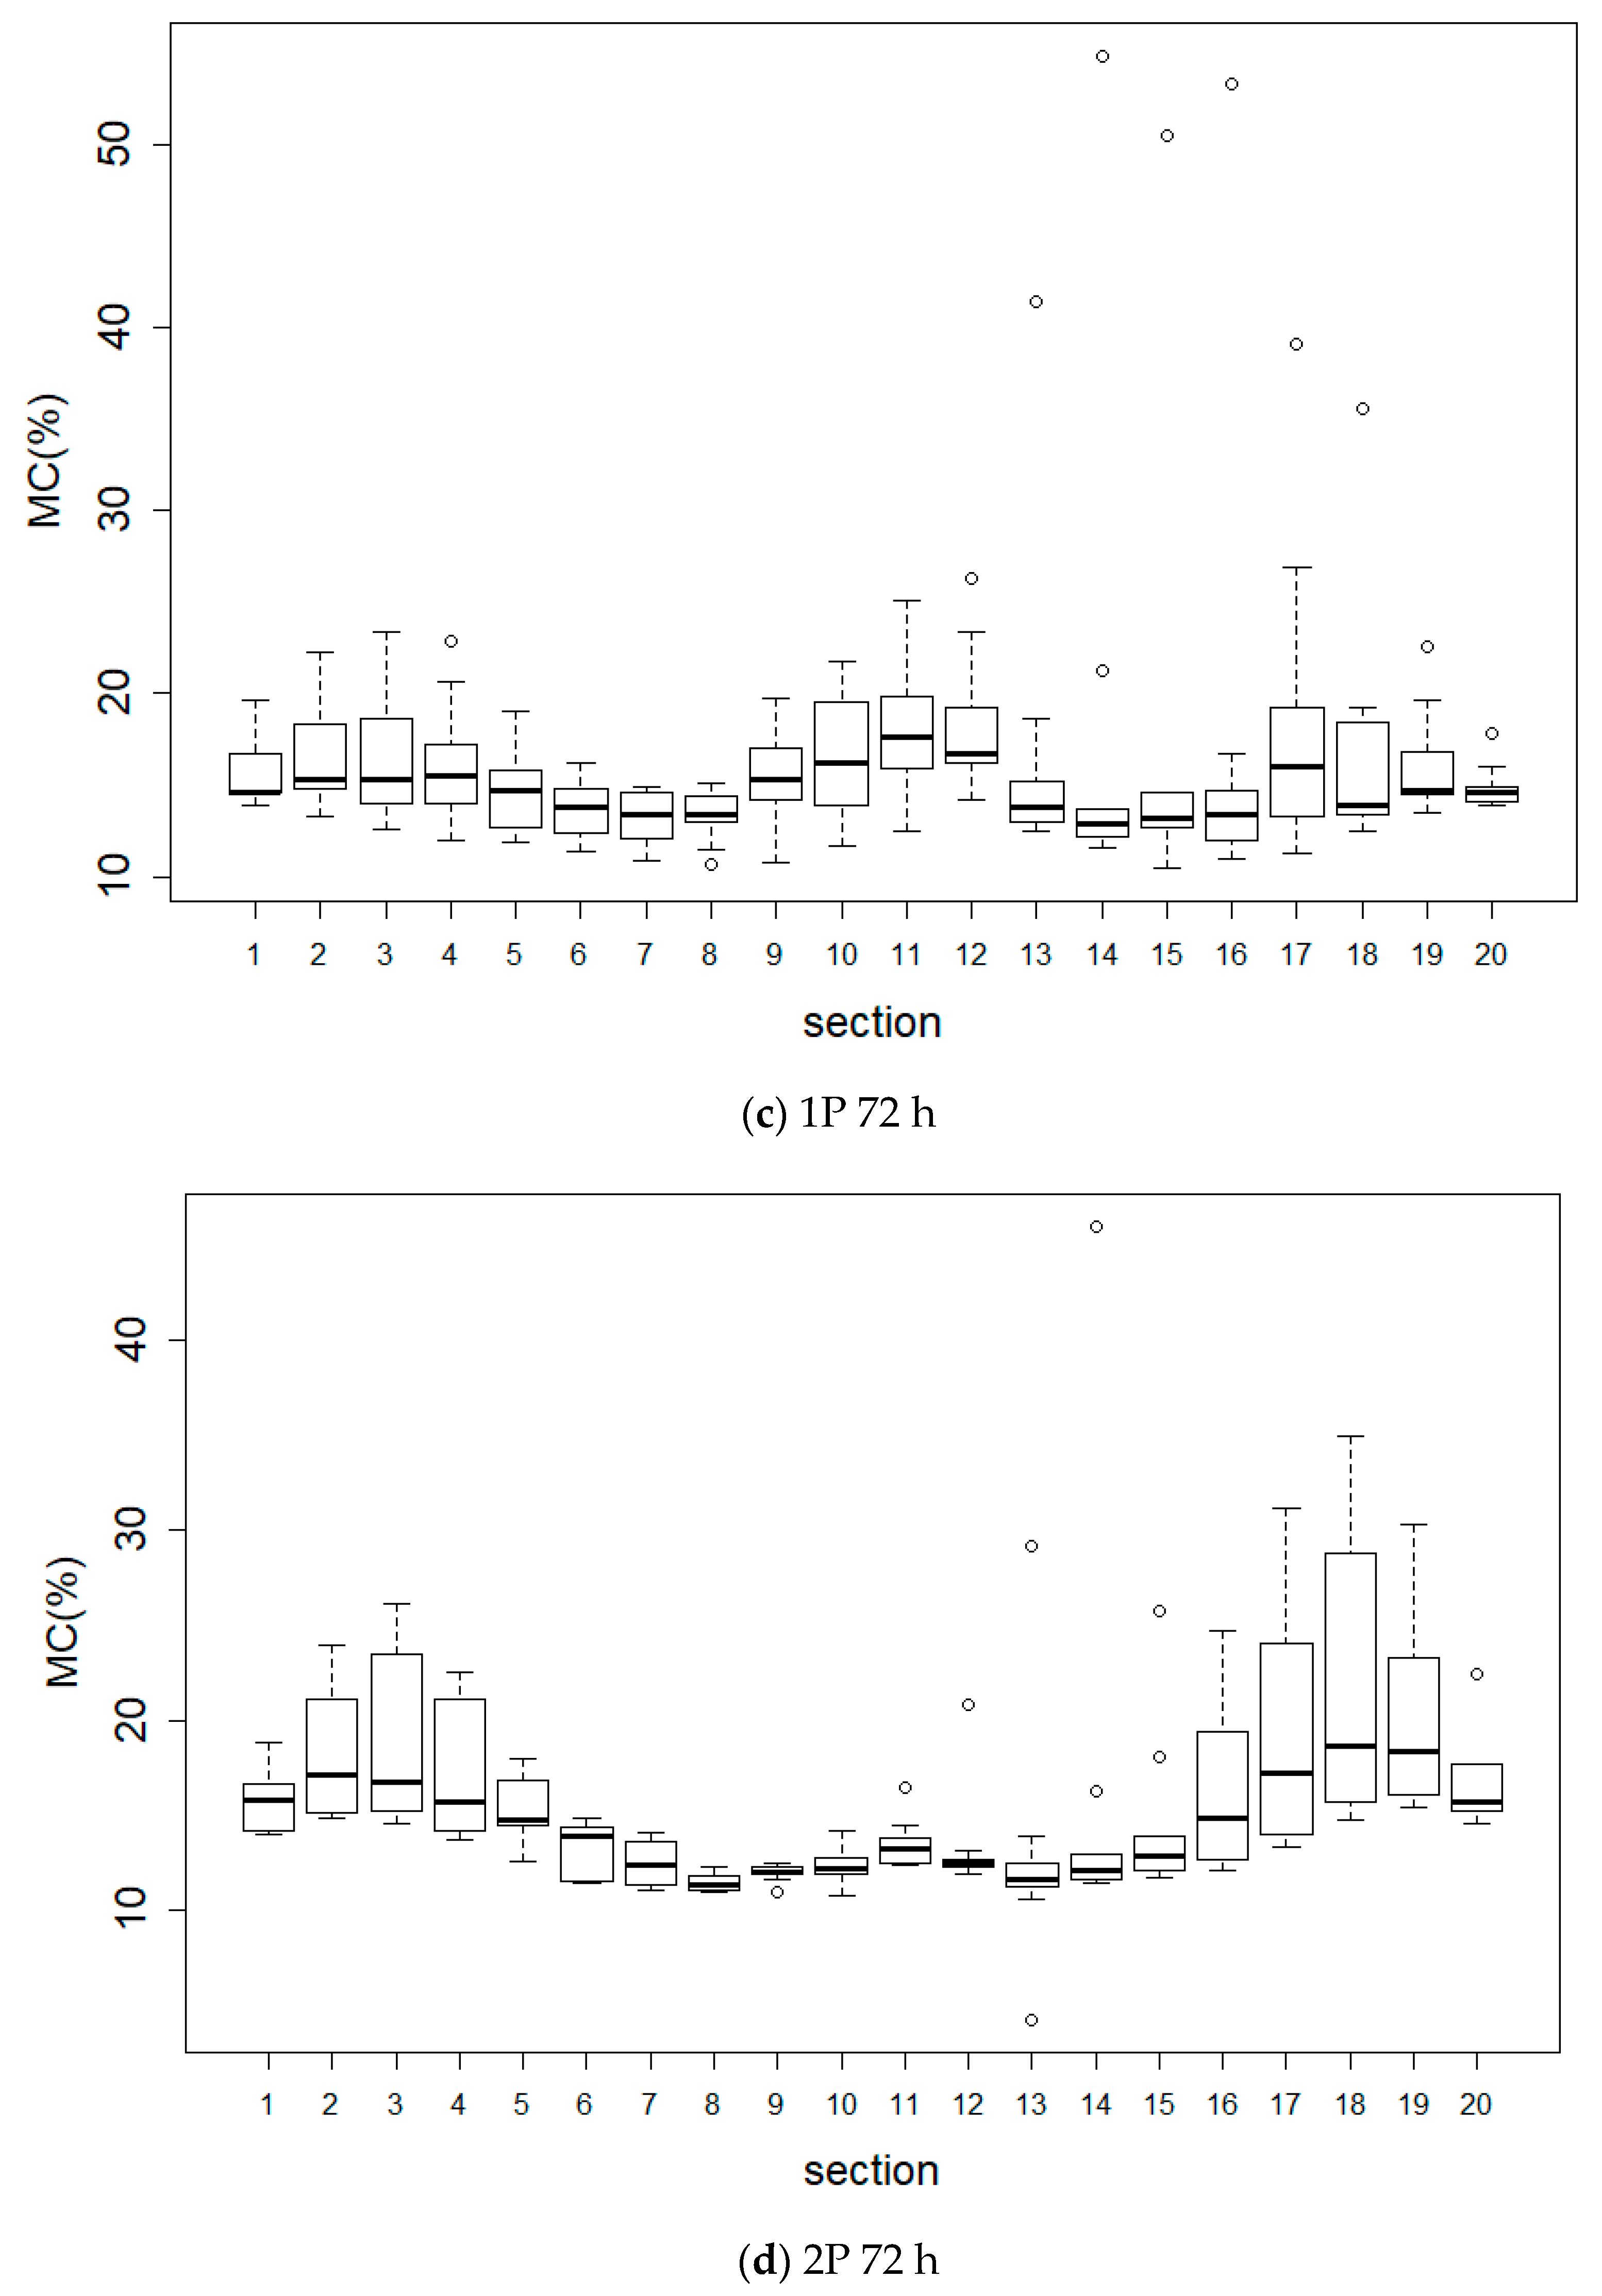
Figure 12 shows a summary of the average MC for 1P and 2P core sections during fan drying at 0 h (wet condition) and after 72 h of fan drying. The differences between the CLT sections facing the fan and the back sections were monitored by comparing MC values for the extracted cores and MC probing results. The core sections taken at 0 h of drying (after soaking concluded) showed higher moisture content in the 2P section, indicating that the edge gap contributed to accelerated moisture gain. Moisture accumulation above 20% was observed in the cores’ depth after 72 h of fan drying. The average moisture content of wet cores was 22.62 ± 16% and 25.71 ± 17% for 1P and 2P sections, respectively. The high variation in average MC shows the differences in moisture uptake in the outer and inner sections of the panels.
ANOVA of three panels’ data together (Table 5) showed that the position of subsection (depth) and time of drying had significant effects on MC values during drying determined for samples at p < 0.001 levels.

3.1.3. Ambient and Fan Drying Comparison

Comparison between the exposed face section of cores after water-pooling and ambient drying against the fully submerged and then fan-dried trials showed a more consistent drying pattern from the fan-dried sections (Figure 12).

3.2. CLT Structure Drying

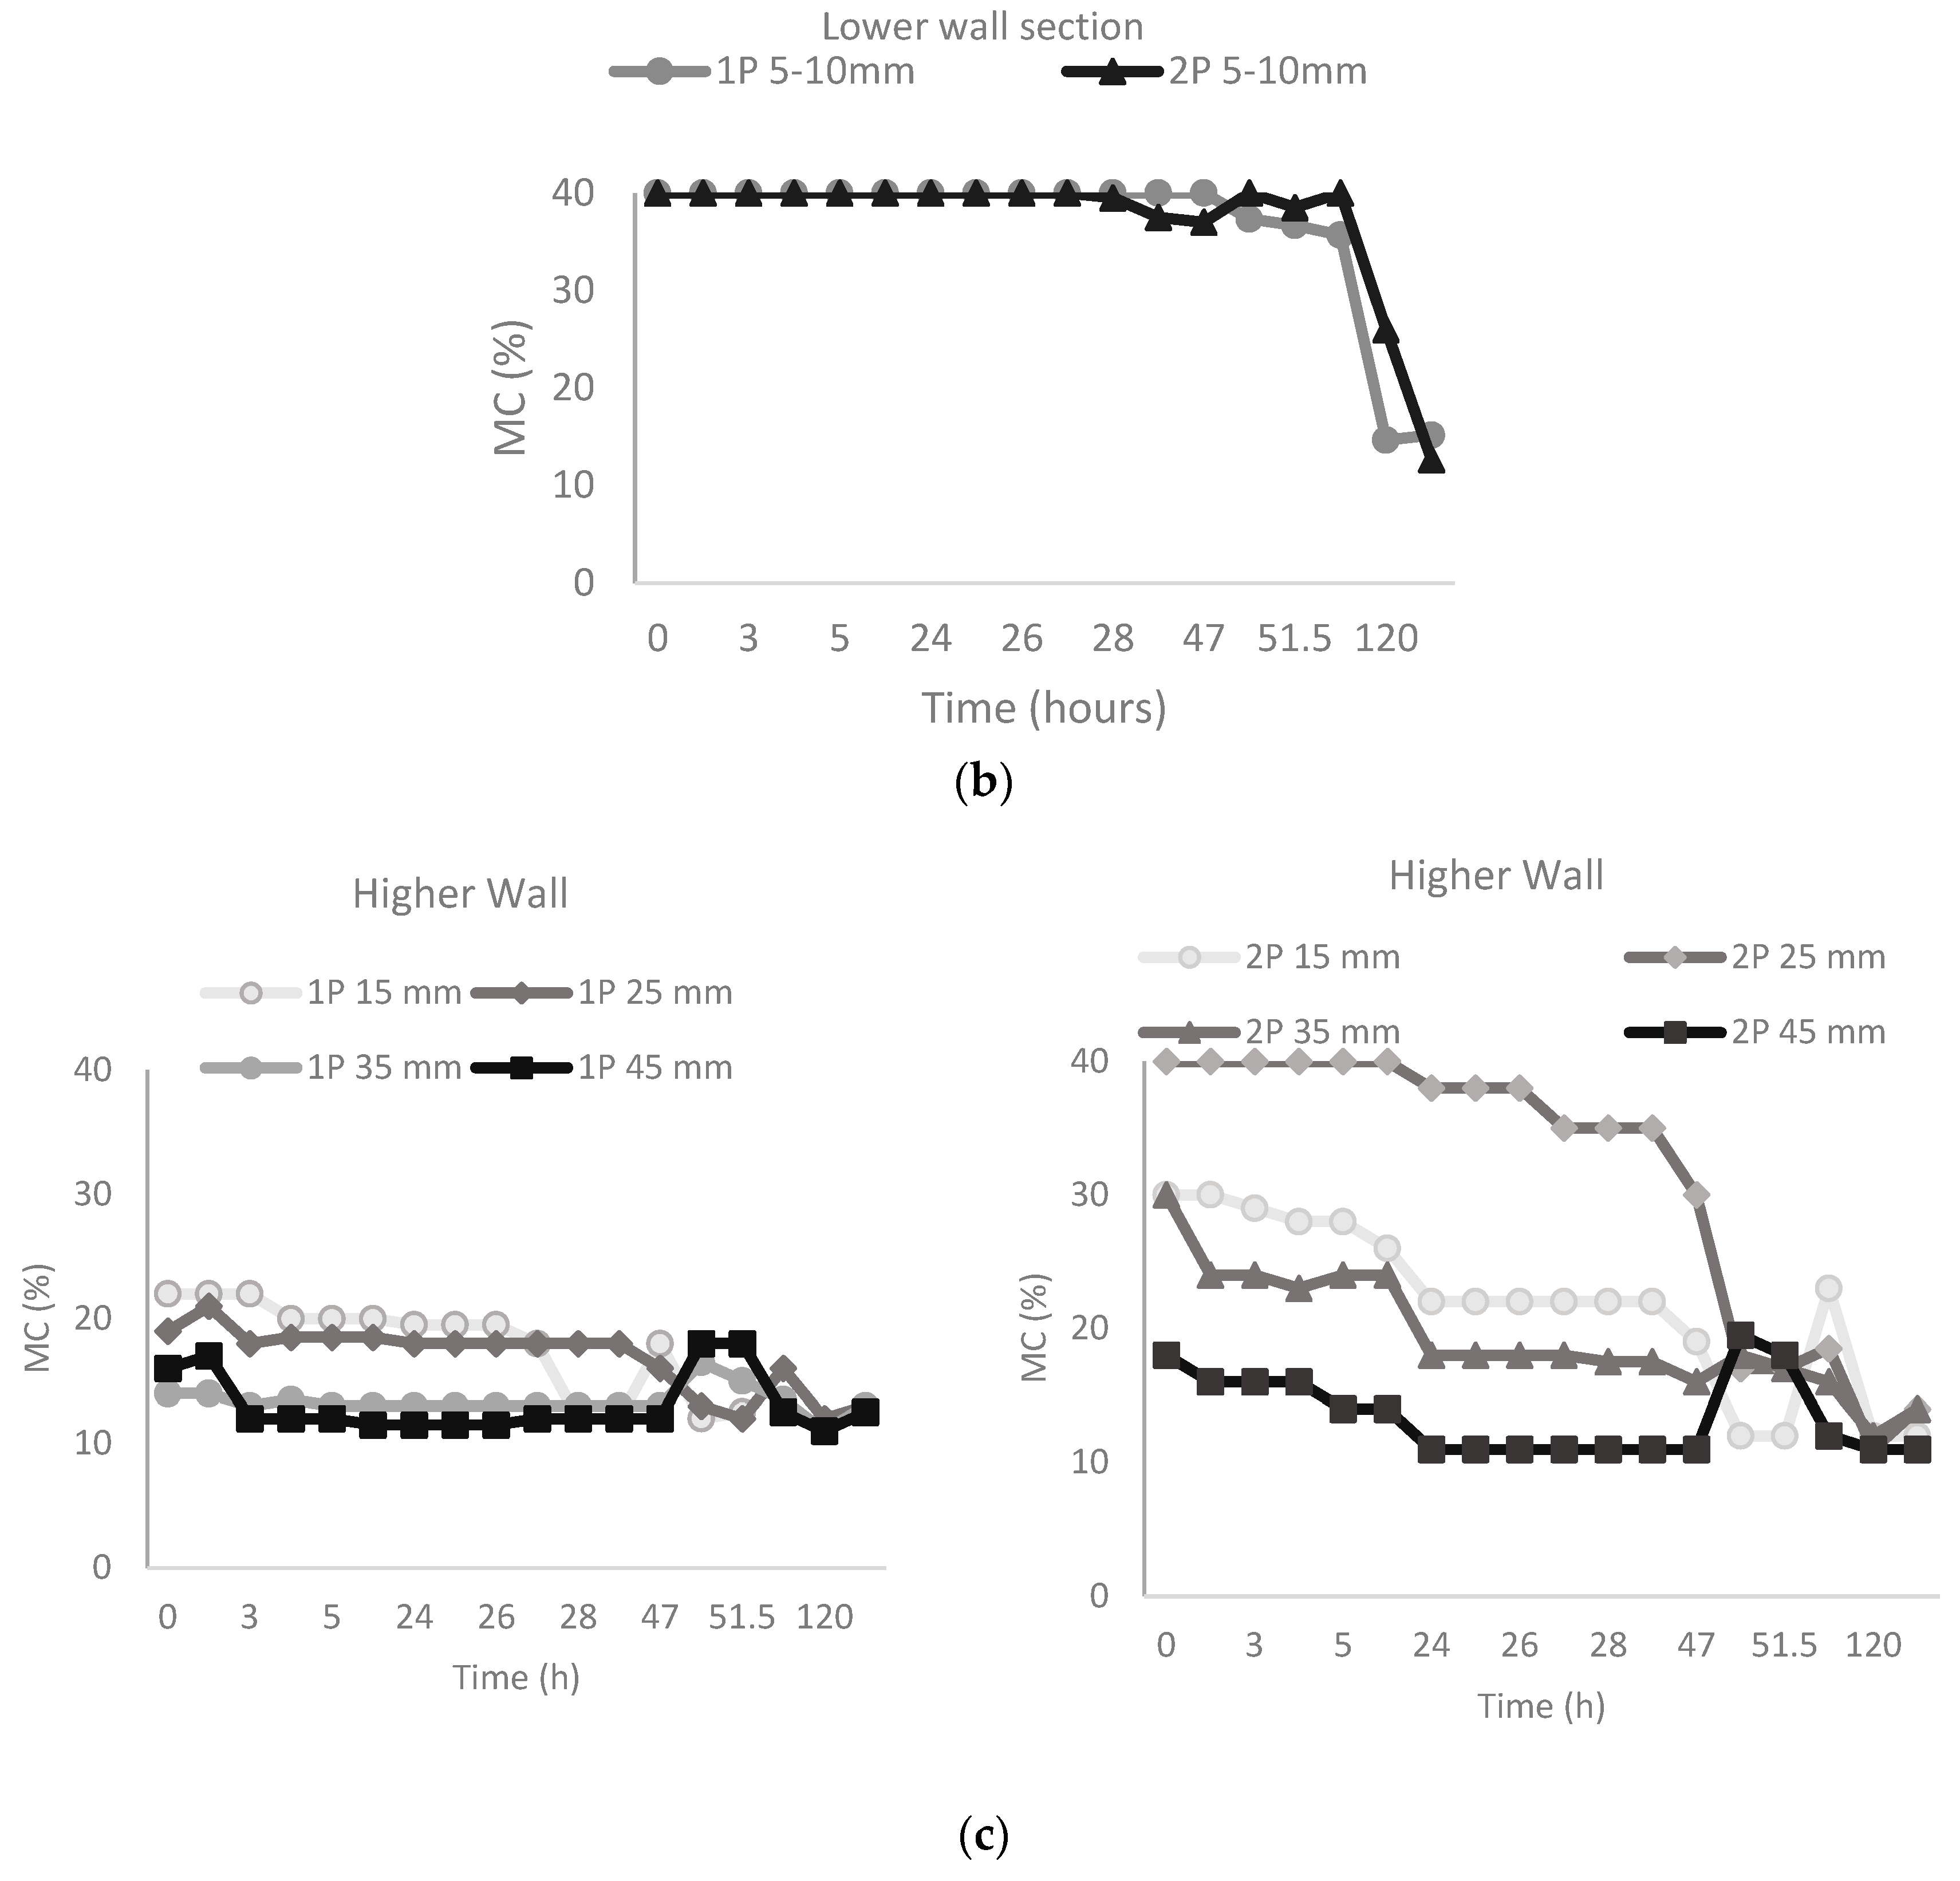
The CLT structure exposed to wetting trials showed that most of the sections, including wall and floor panels, reached above 20% MC (Figure 13 and Figure 14). Figure 14 shows the changes in MC of sections on assembly using moisture probes during fan drying. The MC recorded for the wall section showed that the lower wall section that was not in the direction of the fan airflow stayed at a high MC (40% maximum value measured by moisture meter), while the other two sections started to dry out (Figure 13). This is also expected due to the lower wall section being in close contact with the floor panels, where water pooling was present. The higher wall section that was in the path of the fan air flow showed the fastest drying rate.
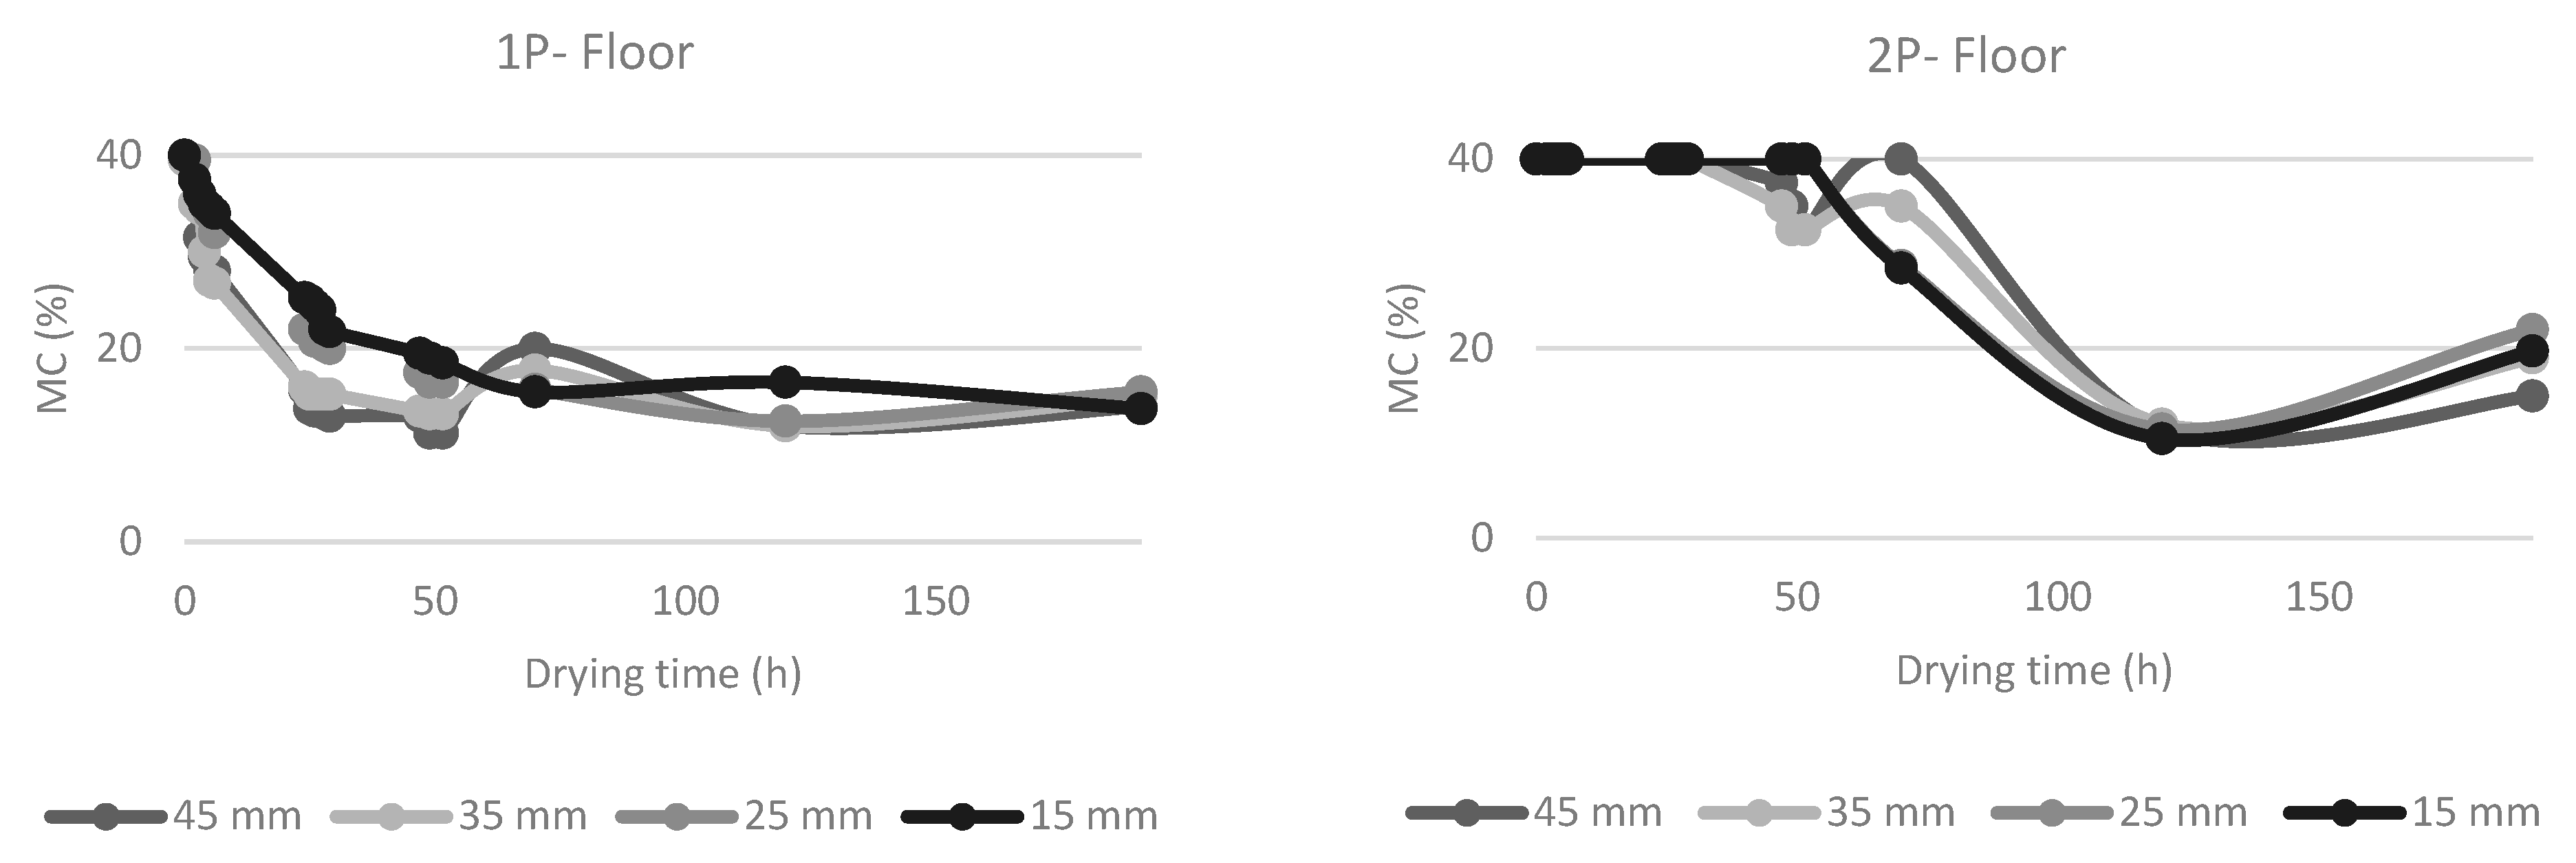
The moisture reduction happened at a lower rate than the CLT section drying 2, indicating that the building elements (covered edges, roof and connected sections) could reduce the drying rate. One-sided drying due to the installation of a vapour barrier membrane has previously shown lower rates of drying on wetted panels, indicating the effects of building design and elements on the drying rate of panels [25]. The moisture uptake differences between floor and wall panels due to the orientation and surface area exposed need to be considered when construction moisture management plans are made [37]. Figure 14 shows the MC values recorded for the floor sections using moisture probes. The monitoring of floor sections showed that edge gap sections (2P) had higher MC for a longer period of time before starting to dry (Figure 14). This is more important in areas with expected weathering and heavy rain events during the construction. Considering the limitation of moisture meters in the higher MC range (above 35%), this could indicate that 2P sections absorbed much higher moisture in comparison with 1P sections. Construction moisture management is an important aspect of minimising the risk of moisture damage and EWPs’ durability. The study of wall assemblies during construction in the Canadian climate showed that the use of vapour-impermeable membranes on the external or internal surface of the CLT panels could reduce the drying rate and increase the risk of damage [26]. The study suggested that in case of a heavy rain event, the panels need to be protected or external insulation and vapour permeable barriers should be used.
Figure 15 shows the moisture probe data recorded for the external section of the wall during a rain event. The panels exposed to the external conditions absorbed moisture due to a rain event as the fan drying trial was conducted in the internal part of the panels (Figure 15). The 2P section showed higher moisture absorbance due to the larger surface area and potential surface cracks, showing the need to consider water resistance barrier installation on external wall panels [37]. A case study of various CLT structures in Sweden showed that weather protection is required for building elements during construction. The study of moisture content in the depth of CLT panels showed MC above 25% in the roof and wall panels in different depths. It was also concluded that the RH (>80% in January to March, 45%–65% in April–May, >70% in June) on the external surface of CLT panels during the study (January to June) was not the main source of higher mould risk; however, the exposure to rain (350 mm during the measurement period) is likely to cause mould growth on the external panels [38].

4. Conclusions

This study investigated the drying of CLT panels and compared moisture gain within the panel structure when panels were exposed to water pooling and submerged saturation. The wetted panels were dried, and the drying process was monitored in both ambient and fan-drying scenarios. The trial showed that the coring of CLT sections provides more reliable specific MC and MG values in various depths and directions of the panel than the resistance-based moisture meter. The comparison between the results showed the importance of cross-checking MC values and examining MG within the panel depth.
The MC reached above FSP for the panel’s 1P and 2P sections exposed to water pooling. The ambient drying trial showed that 2P sections reached below 40% MC after 4–5 h, while the 1P sections took longer. There was surface drying in 1P sections, while the deeper parts stayed above 40% MC. This finding emphasised the importance of surface exposure to drying if a major wet event happens during construction and the possible limitation if the full surface of the panel is not exposed for drying [22,24,25,39].
Both trials (submerged in water and water pooling) had higher than saturation point moisture content when the drying trials were conducted. The CLT samples submerged in water for 5 days had a lower MC than the panel section exposed to water pooling (simulating flash flooding during construction or plumbing leaks post-construction) for 6 weeks. The fan drying results showed a distributed drying rate in panel depth (with less moisture gradient developing in the depth of the sample) than the ambient drying results. The fan-dried sections reached the desired MC in a shorter timeframe. However, the panel section facing the fan air flow reached a lower MC faster than the non-facing side. This shows the importance of MC monitoring and examining different parts of the panel (connections, covered sections, and sections that are less accessible) when a finished building section needs to be dried after being exposed to a wet event. The submerged sections showed higher MC on the outer surface of the panels than in the middle depth. After 72 h of fan drying, the 1P section of the panel showed MC below 20%, while the 2P section still had a higher than 20% moisture content. The moisture meter data showed that on submerged panels, the edge and end sections (which were not facing the fan) had above 20% moisture content at 15-mm and 30-mm depths, even after 72 h of drying. These sections reached below 20% moisture content after 140 h of drying.
Fan drying of the wetted CLT structure (walls and floor panels), where there were covered edges and connections, showed longer time was required to reduce the MC to an acceptable (below 20%) level than CLT sections without any covering and protection.
The presented work in this paper was a preliminary study on CLT drying rate with a focus on applicable solutions for onsite moisture management of panels. Further studies need to investigate the effects of drying types (fan type, heating, etc.) and length on moisture movement in CLT and possible crack development in the layered structure. The optimum RH and temperature to minimise dimensional changes need to be tested for a range of CLT panels with varying layer numbers and connection types.

Author Contributions

Conceptualization, M.S. and A.F.; methodology, M.S.; formal analysis, M.S. and A.F.; investigation, M.S. and A.F.; data curation, M.S. and A.F.; writing—original draft preparation, M.S.; writing—review and editing, M.S. and A.F.; visualization, M.S. and A.F.; supervision, M.S.; project administration, M.S. and A.F.; funding acquisition, M.S. and A.F. All authors have read and agreed to the published version of the manuscript.

Funding

This research was funded by Forest and Wood Product Australia (FWPA), the National Center for Timber Durability and Design Life (NCTDDL) and the Queensland Department of Agriculture and Fisheries (DAF).

Acknowledgments

The authors would like to acknowledge the financial and technical facilitation support provided by both the National Centre for Timber Durability and Design Life (NCTDDL), Forest and Wood Products Australia (FWPA) and the Queensland Department of Agriculture & Fisheries (QDAF), Salisbury Research Facility (SRF); without whom this study would not be possible. Further acknowledgements should also be made the both the University of Queensland (UQ) and Queensland University of Technology (QUT) for their contributions to various stages of the project methodology and material.

Conflicts of Interest

The authors declare no conflict of interest.

References

  1. Montana Ledger. Global Cross-Laminated Timber Market to Reach US$ 2,470 Mn by 2026, in Transperancy Market Research. 2019. Available online: https://montana-ledger.com/global-cross-laminated-timber-market-to-reach-us-2470-mn-by-2026/329947/ (accessed on 10 April 2023).
  2. Brandner, R.; Flatscher, G.; Ringhofer, A.; Schickhofer, G.; Thiel, A. Cross laminated timber (CLT): Overview and development. Eur. J. Wood Prod. 2016, 74, 331–351. [Google Scholar] [CrossRef]
  3. Cazemier, D.S. Comparing cross laminated timber with concrete and steel: A financial analysis of two buildings in Australia. Modul. Offsite Constr. (MOC) Summit Proc. 2017, 1, 184–196. [Google Scholar] [CrossRef]
  4. Gereke, T.; Schnider, T.; Hurst, A.; Niemz, P. Identification of moisture-induced stresses in cross-laminated wood panels from beech wood (Fagus sylvatica L.). Wood Sci. Technol. 2009, 43, 301–315. [Google Scholar] [CrossRef]
  5. Glass, S.V.; Wang, J.; Easley, S.; Finch, G. Chapter 10: Enclosure—Building enclosure design for cross-laminated timber construction. In CLT Handbook: Cross-Laminated Timber; Karacabeyli, E., Douglas, B., Eds.; Forest Products Laboratory: Madison, WI, USA, 2013; Volume 10, pp. 1–55. ISSN 1925-0495. [Google Scholar]
  6. Schmidt, E.; Riggio, M. Monitoring Moisture Performance of Cross-Laminated Timber Building Elements during Construction. Buildings 2019, 9, 144. [Google Scholar] [CrossRef]
  7. Shirmohammadi, M.; Leggate, W. Report on Industry Current Needs and Future Requirements—Investigating the Effects of Moisture Ingress on the Performance and Service Life of Mass Timber Panels in Australian Climates. Department of Agriculture and Fisheries, Queensland Government: Internal Report. Unpublished Work. 2020. [Google Scholar]
  8. Wang, L.; Wang, J.; Ge, H. Wetting and drying performance of cross-laminated timber related to on-site moisture protections: Field measurements and hygrothermal simulations. E3S Web Conf. 2020, 172, 10003. [Google Scholar] [CrossRef]
  9. IIMARC Group Research and Markets. Cross-Laminated Timber Market: Global Industry Trends, Share, Size, Growth, Opportunity and Forecast 2022–2027; IIMARC Group Research and Markets: Noida, India, 2022; p. 147. [Google Scholar]
  10. Mass Timber: Wood Is Prominent in Construction’s Future, Value for Carbon Removal to Be Determined, in the Economist Interrligence Unit. Available online: https://carbonremoval.economist.com/mass-timber/ (accessed on 10 April 2023).
  11. Cappellazzi, J.; Konkler, M.J.; Sinha, A.; Morrell, J.J. Potential for decay in mass timber elements: A review of the risks and identifying possible solutions. Wood Mater. Sci. Eng. 2020, 15, 351–360. [Google Scholar] [CrossRef]
  12. Mankowski, M.; Shelton, T.G.; Kirker, G.; Morrell, J. Post-layup protection of mass timber elements in above ground protected exposures: 2-year results. In Proceedings of the 53rd Annual Meeting of the International Research Group on Wood protection, Bled, Slovenia, 29 May–2 June 2022; pp. 1–10. [Google Scholar]
  13. Udele, K.E.; Morrell, J.J.; Sinha, A. Biological Durability of Cross-Laminated Timber—The State of Things. For. Prod. J. 2021, 71, 124–132. [Google Scholar] [CrossRef]
  14. McClung, R.; Hua, G.; Straube, J.; Jieying, W. Hygrothermal performance of cross-laminated timber wall assemblies with built-in moisture: Field measurements and simulations. Build. Environ. 2014, 71, 95–110. [Google Scholar] [CrossRef]
  15. Siau, J.F. Transport Processes in Wood; Springer Science & Business Media: Berlin/Heidelberg, Germany, 2012; Volume 2. [Google Scholar]
  16. Gezici-Koç, Ö.; Erich, S.J.F.; Huinink, H.P.; Van Der Ven, L.G.J.; Adan, O.C.G. Bound and free water distribution in wood during water uptake and drying as measured by 1D magnetic resonance imaging. Cellulose 2017, 24, 535–553. [Google Scholar] [CrossRef]
  17. Kukk, V.; Kers, J.; Kalamees, T.; Wang, L.; Ge, H. Impact of built-in moisture on the design of hygrothermally safe cross-laminated timber external walls: A stochastic approach. Build. Environ. 2022, 226, 109736. [Google Scholar] [CrossRef]
  18. Robbins, C.; Morrell, J.J. Mold, Housing & Wood; Western Wood Products Association: Portland, OR, USA, 2006. [Google Scholar]
  19. Winandy, J.E.; Morrell, J.J. Improving the utility, performance, and durability of woodand bio-based composites. Ann. For. Sci. 2017, 74, 1–11. [Google Scholar] [CrossRef]
  20. Zahora, A.R.; Morrell, J.J. Diffusion and sorption of the fumigant methylisothiocyanate in Douglas-fir wood. Wood Fiber Sci. 1989, 1989, 55–66. [Google Scholar]
  21. Hu, W.-G.; Wan, H. Comparative study on weathering durability property of phenol formaldehyde resin modified sweegum and southern pine specimens. Maderas Cienc. Y Tecnol. 2022, 24. [Google Scholar] [CrossRef]
  22. Schmidt, E.L.; Riggio, M.; Barbosa, A.R.; Mugabo, I. Environmental response of a CLT floor panel: Lessons for moisture management and monitoring of mass timber buildings. Build. Environ. 2019, 148, 609–622. [Google Scholar] [CrossRef]
  23. Lipand, R. Capillary Movement of Water in A Radial Direction and Moisture Distribution in a Cross-Section of CLT Panel. Master’s Thesis, Tallinn University of Technology, Talinn, Estonia, 2021; p. 68. [Google Scholar]
  24. Olsson, L. Moisture safety in CLT construction without weather protection—Case studies, literature review and interviews. E3S Web Conf. 2020, 172, 10001. [Google Scholar] [CrossRef]
  25. Kordziel, S.; Pei, S.; Glass, S.V.; Zelinka, S.; Tabares-Velasco, P.C. Structure Moisture Monitoring of an 8-Story Mass Timber Building in the Pacific Northwest. J. Arch. Eng. 2019, 25, 04019019. [Google Scholar] [CrossRef]
  26. Lepage, R. Moisture Response of Wall Assemblies of Cross-Laminated Timber Construction in Cold Canadian Climates; University of Waterloo: Waterloo, ON, Canada, 2012. [Google Scholar]
  27. Kalbe, K.; Kalamees, T.; Kukk, V.; Ruus, A.; Annuk, A. Wetting circumstances, expected moisture content, and drying performance of CLT end-grain edges based on field measurements and laboratory analysis. Build. Environ. 2022, 221, 109245. [Google Scholar] [CrossRef]
  28. Bailleres, H.; Lee, C.K.D.; Psaltis, S.; Hopewell, G.; Brancheriau, L. Improving Returns from Southern Pine Plantations through Innovative Resource Characterisation; Forest & Wood Products Australia: Melbourne, Australia, 2019. [Google Scholar]
  29. Shirmohammadi, S.P.M. Experimental Testing of Moisture Movement in Engineered Wood Product Panels for Numerical Modelling of Panels’ Wetting/Drying During and Post Construction; QLD Department of Agriculture and Fisheries: Brisbane, Australia, 2022. [Google Scholar]
  30. Australia AS/NZS 1080.1; Timber-Methods of Test-Moisture Content. Standards Australia: Sidney, Australia, 2012.
  31. Kear, G.; Kell, N.J. Performance of resistance-based moisture meters as a function of timber preservative treatment. N. Z. J. For. Sci. 2008, 38, 271–297. [Google Scholar]
  32. Genstat. Genstat for Windows 2022; Release 22.1. Available online: https://genstat.kb.vsni.co.uk/download-genstat/ (accessed on 10 January 2022).
  33. Rowell, J.G.; Walters, D.E. Analysing data with repeated observations on each experimental unit. J. Agric. Sci. 1976, 87, 423–432. [Google Scholar] [CrossRef]
  34. Kordziel, S.; Glass, S.V.; Boardman, C.R.; Munson, R.A.; Zelinka, S.L.; Pei, S.; Tabares-Velasco, P.C. Hygrothermal characterization and modeling of cross-laminated timber in the building envelope. Build. Environ. 2020, 177, 106866. [Google Scholar] [CrossRef]
  35. Wang, J. Wetting and drying performance of wood-based assemblies related to on-site moisture management. In Proceedings of the World Conference on Timber Engineering, Vienna, Austria, 22–25 August 2016. [Google Scholar]
  36. Wang, J. On-Site Moisture Management of Wood Construction; FPInnovation: Pointe-Claire, QC, Canada, 2015. [Google Scholar]
  37. Wang, J. Construction Moisture Management—Cross Laminated Timber; Stirling, R., Lum, C., Eds.; FPInnovation: Pointe-Claire, QC, Canada, 2020. [Google Scholar]
  38. Olsson, L. CLT construction without weather protection requires extensive moisture control. J. Build. Phys. 2021, 45, 5–35. [Google Scholar] [CrossRef]
  39. Kalbe, K.; Kukk, V.; Kalamees, T. Identification and improvement of critical joints in CLT construction without weather protection. E3S Web Conf. 2020, 172, 10002. [Google Scholar] [CrossRef]
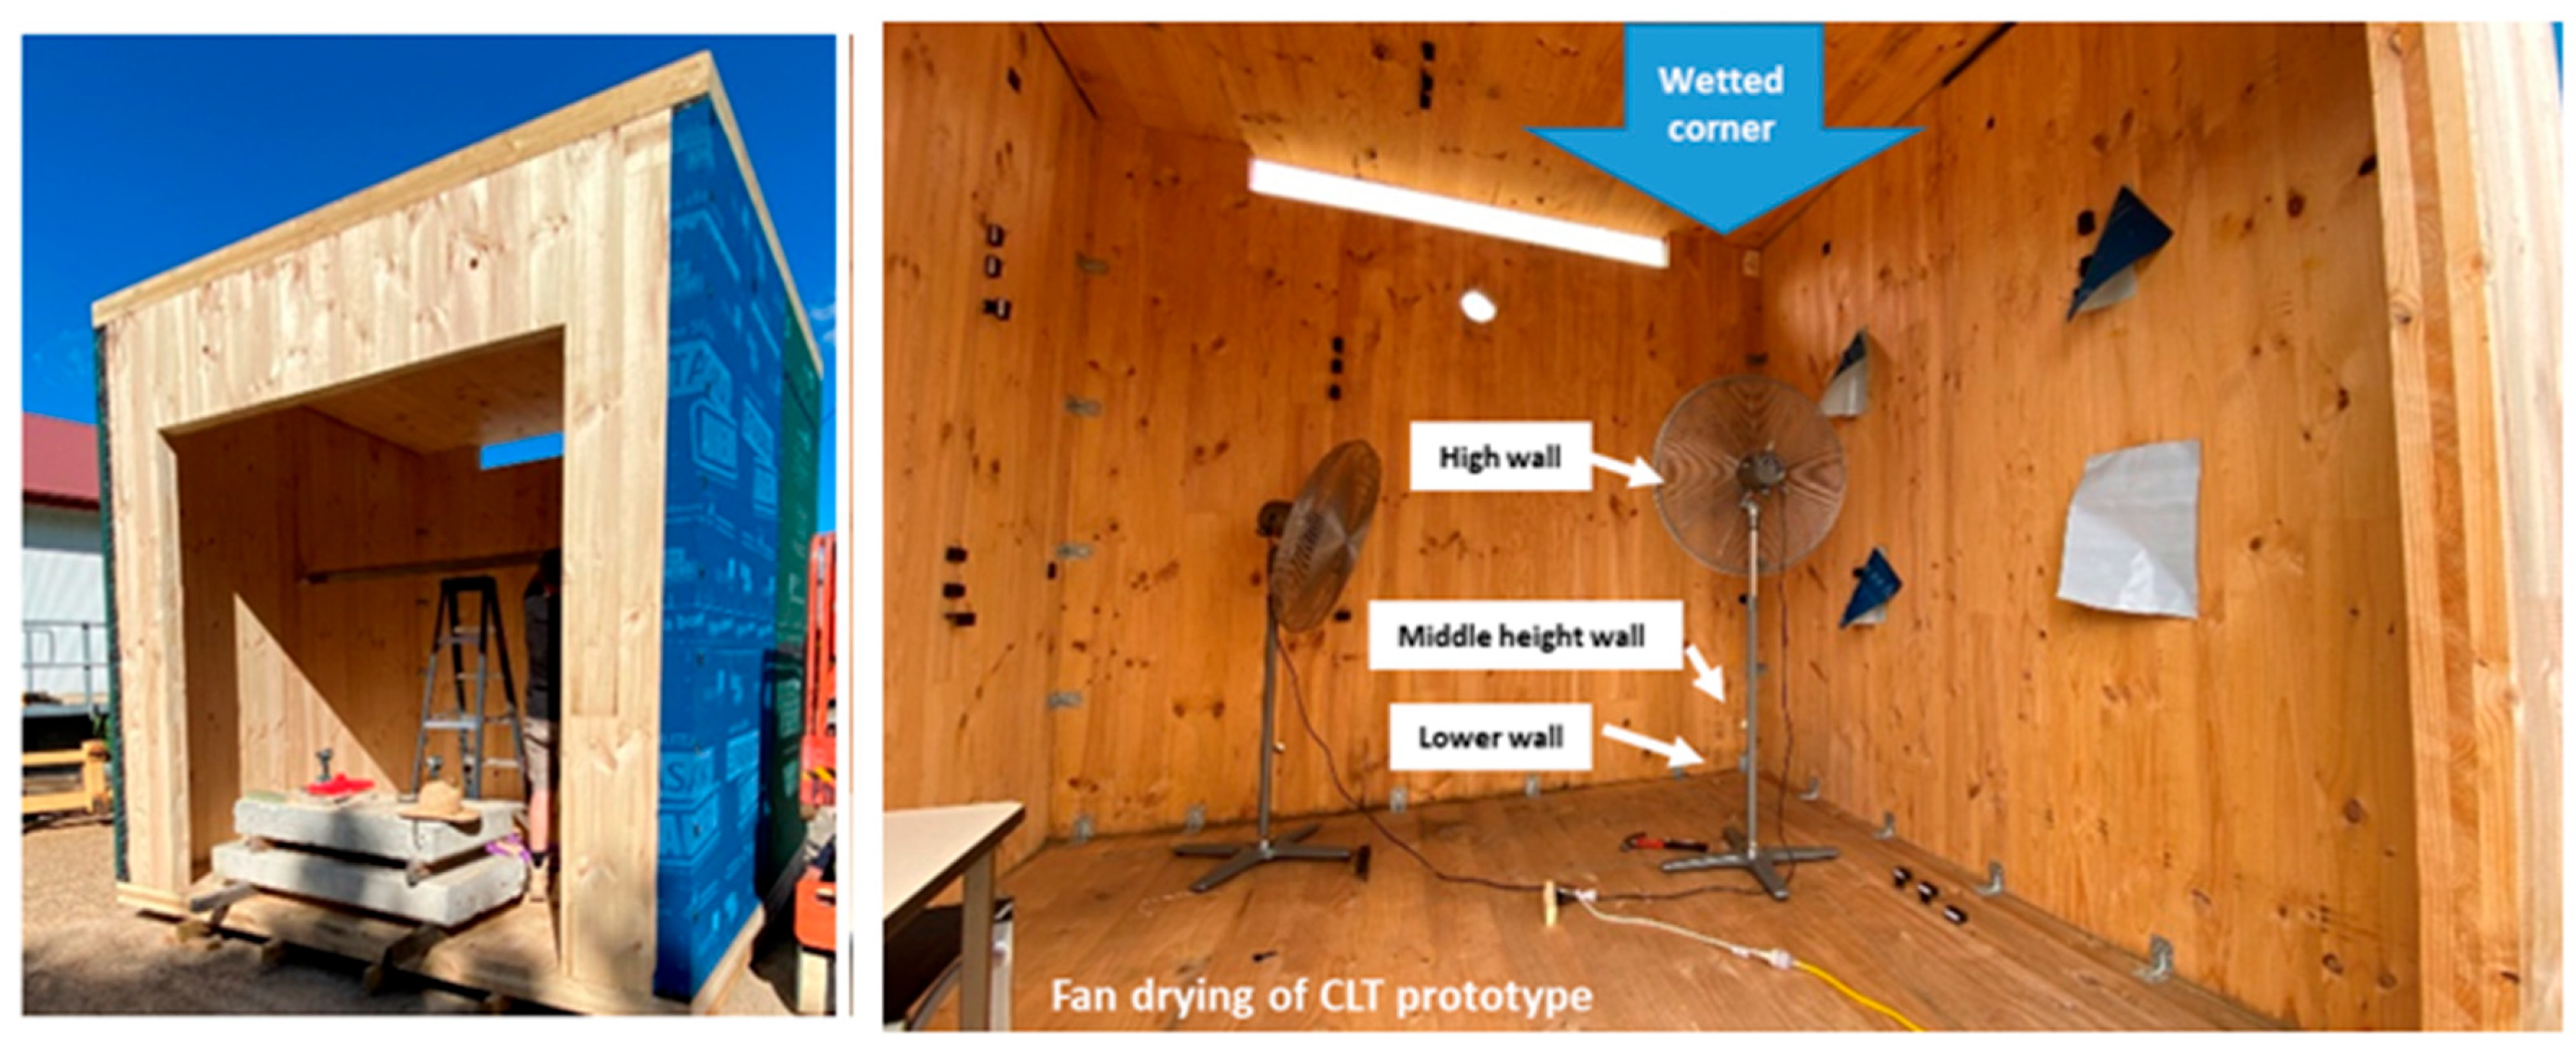
Figure 4. CLT structure used for the moisture monitoring study (left) the structure at the time of testing, (right) the area of moisture application and sections of moisture probing (high, middle height and lower wall) for MC observation during fan drying.
Forests 14 01007 g004
Figure 5. CLT prototype moisture meter probes and fan drying set-up, on (a) floor panel, (b) interior of wall panel, (c) exterior of wall panel and (d) moisture meter used for moisture content readings.
Forests 14 01007 g005
Figure 6. The average moisture content determined from cored sections of CLT during ambient drying (top) P1 and (bottom) P2 coring direction.
Forests 14 01007 g006
Figure 7. Changes in CLT sections’ MC, samples submerged in water for 120 h.
Forests 14 01007 g007
Figure 8. Average CLT face subsections 1P and 2P for fan-dried panels at three speeds: (a) 5.1 m/s, (b) 5.8 m/s and (c) 6.6 m/s. Fan facing side is shown as the first section of the core.
Forests 14 01007 g008aForests 14 01007 g008b
Figure 9. The average moisture content of CLT edge and end sections recorded using a moisture meter during fan drying (a) end and (b) edge.
Forests 14 01007 g009
Figure 10. Summary of moisture content for 1P and 2P sections of the fan-dried on fan-facing (FS) and non-fan-facing (NFS) sides after 24 h.
Forests 14 01007 g010
Figure 11. Comparison between the average moisture content of sections in wet conditions (0 h) and after 72 h of fan drying, each box plot shows the average value for a subsection.
Forests 14 01007 g011aForests 14 01007 g011b
Figure 12. The comparison between moisture content changes at the surface of the panels for CLT dried in ambient and fan drying conditions, (a) 1P and (b) 2P sections, AD is ambient drying, and FD is fan drying.
Forests 14 01007 g012
Figure 13. Moisture content determined for drying wall panels (a) in direct front of the fan, (b) lower wall and (c) higher wall sections away from fan drying.
Forests 14 01007 g013aForests 14 01007 g013b
Figure 14. Moisture content determined for floor panels at different depths using moisture meter probes.
Forests 14 01007 g014
Figure 15. Moisture content recorded in the external wall during the fan drying experiment.
Forests 14 01007 g015
Table 1. Materials and their specifications for the investigative study experiments.
Test MethodReferenced SectionsNo. of PanelsSample Size
(L × W × H) (mm)
No. of Core Samples
(a) Moisture uptakeSection 2.33 × 6 [1]40 × 40 × 125 -
(b) Ambient dryingSection 2.41800 × 850 × 75 78
(c) Fan dryingSection 2.531000 × 1000 × 125 72
[1] The sample types and groupings are defined in Section 2.3.
Table 2. Fan average speed settings were tested prior to the fan drying experiment.
Distance (m)Setting 1 Setting 2Setting 3
Speed (m/s) [1]
0.55.3 (±0.5)6.1 (±0.8)6.5 (±1.1)
1.04.7 (±0.8)5.5 (±1.1)5.7 (±1.1)
1.53.9 (±1.0)4.6 (±1.1)4.9 (±1.1)
2.03.1 (±0.7)3.93 (±0.7)4.2 (±1.0)
[1] Standard deviation determined for tested speeds is displayed in parentheses.
Table 3. Summary of ANOVA for ambient drying panel from 0 to 96 h of drying.
DfMean SqPr (>F)
Type10.00130.851
Time130.83<0.001
Position (depth)115.097<0.001
Type:Time130.0580.028
Type:Position110.030.761
Time:Position1390.078<0.001
Type:Time:Position1370.0170.965
Table 4. Overall average moisture content of panel sections at different fan speeds for different time periods.
Fan Speed (m/s)Drying Time (h)1P-MC (%)2P-MC (%)
-0 (wet)22.62 ± 1625.71 ± 17
5.12420.2 ± 1.720.1 ± 4
4816.5 ± 1.518.2 ± 1.8
7220.5 ± 4.118.7 ± 2.1
5.82414.96 ± 0.420.4 ± 0.7
4814.2 ± 0.313.9 ± 0.8
7214.5 ± 0.713 ± 0.4
6.62415.3 ± 2.412.7 ± 3
4814.7 ± 0.214.6 ± 0.2
7214.2 ± 0.314.6 ± 0.4
Table 5. ANOVA results for fan drying trial (summary of three-panel data), the study of effects of panel, type (1P, 2P), and position (depth) on moisture content changes.
Source of Variation d.f.Meanp
Type (1P, 2P)10.001570.348
Position (depth/section)180.009<0.001
Panel Type20.001440.442
Panel Position360.0026<0.001
Type: Position180.0027<0.001
Panel: Type: Position360.00098<0.001
Disclaimer/Publisher’s Note: The statements, opinions and data contained in all publications are solely those of the individual author(s) and contributor(s) and not of MDPI and/or the editor(s). MDPI and/or the editor(s) disclaim responsibility for any injury to people or property resulting from any ideas, methods, instructions or products referred to in the content.