Article

Effects of Competition on the Vertical Distribution of Foliage Biomass within the Crowns of Planted Korean Pine Trees in Northeast China

1
College of Forestry, Shenyang Agricultural University, Shenyang 110866, China
2
Liaoning Academy of Forestry Sciences, Shenyang 110032, China
3
State Key Laboratory of Tree Genetics and Breeding, Key Laboratory of Tree Breeding and Cultivation of State Forestry and Grassland Administration, Research Institute of Forestry, Chinese Academy of Forestry, Beijing 100091, China
4
Jianshi Institute of Forestry Sciences, Enshi 445300, China
5
Xing’an Forestry and Grassland Protection Center, Wulanhaote 137400, China
*
Author to whom correspondence should be addressed.
Forests 2023, 14(5), 1005; https://doi.org/10.3390/f14051005
Submission received: 8 March 2023 / Revised: 29 March 2023 / Accepted: 14 April 2023 / Published: 12 May 2023
(This article belongs to the Section Forest Ecology and Management)

Abstract

:
The characteristics and distribution of foliage biomass are important aspects of the crown structures of trees. In this study, we developed a foliage biomass distribution model at the branch level and annual shoot level (i.e., all branches on an annual increment of the main tree bole) using a sample of 51 Korean pine trees that were destructively sampled in Liaoning Province, northeast China. A variety of independent variables, including branches, trees, and forest competition, were used as explanatory variables in the model development. Our results indicated that foliage biomass at the branch level increased with an increasing relative distance from the tree tip into the crown. The peak of the foliage biomass distribution shifted to the tree tip with increasing tree age. A power function, including branch diameter and competition variables, showed excellent performance in modeling branch foliage at the branch level. The final model, which included branch diameter, competition variables, and relative distance to branch base for the relative foliage density, showed best performance. The trees that showed advantageous growth ability also had a larger amount of foliage biomass.

1. Introduction

The forest canopy, denoting the aggregate of tree crowns, is essential for a variety of processes [1]. The canopy controls the growth and production of forests by housing the process of photosynthesis and also affects microclimates at various scales [2]. Canopy dynamics associated with ecological benefits play an essential role in the terrestrial carbon cycle, in climate feedbacks, and in forest management [3]. The crown of an individual tree is a primary element of the canopy affecting forest stand development and is thus a determinant in studying forest dynamics and functioning [2,4]. The spatial distribution of foliage biomass within the crown exerts a strong influence on light interception and thus directly affects photosynthesis, respiration, and transpiration [5,6]. For these reasons, it is important to study foliage biomass distribution within crowns.
The distribution and amount of foliage biomass of individual trees within the entire crown determine tree and stand growth [7,8]. Foliage biomass distribution is also related to shade tolerance and stand density and exerts an evident influence on competitive interactions, crown asymmetry, and tree bole values [9,10,11]. Foliage biomass is generally recognized as concentrating vertically in the central part of the crown; moving down from the tree tip toward the crown base, it first increases and then decreases [12,13]. In addition, a proportional relationship has been identified between the foliage biomass and the cross-sectional area of sapwood; this is termed pipe model theory [14]. For these reasons, evaluating the amount and distribution of tree foliage biomass is critically important in evaluating its biological functioning [12,15]. Because direct measurements of foliage biomass distribution are almost impossible to conduct in forest stands, allometric relationships have been used to obtain accurate measurements [16].
Light interception drives tree growth and so growth is generally related to leaf area [17]. Specific tree species with a high number of branches and high branch biomass exhibit greater productivity because they are able to develop a crown with a higher leaf area [18]. The leaf area of an individual tree is therefore closely related to photosynthesis and productivity [19]. Specific leaf area (SLA), defined as the ratio of leaf area to leaf dry biomass, is a useful measure which provides a good indicator of the potential photosynthetic rate and plant productivity [20,21]. Many studies have reported that the regularity of SLA increases from the tree tip downward to the crown base and that the amount and distribution of foliage biomass of the whole tree ultimately affects the canopy position of trees [12,22]. The characteristics and distribution of the foliage biomass and leaf area are indispensable factors affecting the microenvironment, the growth of individual trees, and forest stand development, which in turn influence the timber and nontimber values of forests [12].
The distribution of foliage biomass and its relations to tree dominance, crown size, and stand characteristics have been well documented [23]. The remarkable capacity of individual trees to forage for light at the crown level through branch development allows them to increase their occupation of the surrounding space at the stand level [2,24]. The length of the crown and the stem diameter at the base of the crown have both been found to be useful variables in the determination of allometric scaling for foliage biomass [25]. The crown ratio is considered another important structural and morphological trait and may contain ecological legacy information about the past of the individual tree, reflecting present and future tree growth [26]. Low crown ratio values are likely to be linked to low levels of leaf area and may result in variations in foliage distribution within the crown [23]. The growth of an individual tree in the forest stand is usually associated with competition with its neighbors. Competitive interactions between individual trees lead to the mortality of branches in the lower part of the crown [27]. For this reason, allometries of foliage biomass are generally used for predictive models that consider tree size and/or leaf characteristics as independent variables [20,28]. Neighbor competition typically produces a large effect on crown asymmetry and thus affects the amount of foliage and its distribution [29]. However, the variations in the amount and distribution of foliage biomass as a result of competition between neighboring trees at different social positions are still limited. The extent of foliage biomass observation is also important when predicting the foliage biomass distribution in forests [12]. For conifers with rigid branching, a central vertical stem supporting whorls of branches is related to annual growth increments, which are defined as annual shoots [30,31]. Studying the effect of neighbor competition on annual shoot level foliage biomass distribution is essentially important for the forest management practice. However, the response of foliage biomass distribution to neighbor competition at the annual shoot level remains unclear.
Korean pine (Pinus koraiensis Siebold and Zucc.) is an ecologically and economically important tree species in northeast China. In addition to the economic benefits derived from the seeds of Korean pine, its timber is also very valuable and is widely used in industrial production [32,33]. The goal of the present study was to develop a foliage biomass model for planted Korean pine in northeast China at the individual tree level and the annual shoot level (all branches on an annual increment of the main tree bole). We also sought to examine the variation in foliage biomass distribution of different individual trees in response to competition from their nearest neighbors and the wider forest stand.

2. Materials and Methods

2.1. Study Area

The present study was conducted at Dabiangou and Beisanjia forest farms, which are located at an approximate straight-line distance of 50 km from each other in Qingyuan County (124°20′–125°28′ E, 41°47′–42°28′ N) of Liaoning Province, which is the most southerly Chinese province where Korean pine trees can grow. The research of Korean pine in this area also provides reference for potential distribution of this tree species. The study region is characterized by a typical monsoon climate, with hot, rainy summers and cold, dry winters. Annual precipitation ranges from 700 to 800 mm, and most precipitation occurs from July to September. The total annual evaporation capacity is 1275 mm. The annual temperature ranges from −37.6 °C to 37.2 °C, with a mean temperature of 5.3 °C. There are approximately 120 to 139 frost-free days every year. The altitude in the study area ranges from 136 to 1100 m above sea level. The main tree species are Larix gmelinii (Rupr.) Kuzen, Pinus koraiensis Siebold and Zucc., Quercus mongolica Fisch, Pinus tabuliformis Carr., and Picea asperata Mast.

2.2. Sample Plot Establishment and Sample Tree Selection

A total of 51 Korean pine sample trees were selected and destructively measured in 2021. In July and August, in Dabiangou forest farm, 6 forest stands aged 8–56 years were selected. In 5 of these stands, 3 sample plots were established; in the remaining stand, a single plot was established. To expand the sample size aged 40–56 years, 1 forest stand aged 43 years was selected, and 1 sample plot was established in Beisanjia forest farm in October. The site quality and the local topography for the two forest farms are similar. In all, a total of 17 sample plots were established (Table 1). All the sample plots were rectangular in shape, and all had an area of 0.06 ha (20 m × 30 m). Descriptive statistics of all the sample plots from the Dabiangou and Beisanjia forest farms are shown in Table 1; these include stand age, quadratic mean diameter (Dg), dominant tree height (Hdom), stand density and crown width (CW). For all the trees in each plot, diameter at breast height (DBH, cm), defined as 1.3 m above ground level, was measured using a diameter tape. Total tree height (HT, m) and height to crown base (HCB, m) were measured using a Vertex IV Ultrasonic Hypsometer (Haglöf, Torsång, Sweden). The crown width (CW, m) in the four cardinal directions (north, east, south, and west) was measured using a measuring tape.
For the 16 sample plots from Dabiangou forest farm, trees were ranked in descending order by DBH. The cumulative basal area of each sample plot was calculated and was divided into five even intervals, each representing approximately 20% of the total plot basal area. The average size of trees within the first, third, and fifth intervals for each plot was calculated; these were defined as dominant trees, intermediate trees, and suppressed trees, respectively. Finally, 1 dominant tree, 1 intermediate tree, and 1 suppressed tree were selected from each sample plot. Therefore, 48 trees were selected in Dabiangou forest farm. From the single sample plot in Beisanjia forest farm, 3 dominant trees were selected, using a similar classification approach to that used at Dabiangou. In total, 51 sample trees were selected for study purposes, and a summary of statistics for the variables of these sample trees is shown in Table 2. To keep the permanent sample plot intact and ensure that it could be measured again in the future, all the sample trees were chosen outside the plots in which the condition was similar to the sample plot. To calculate the pressure exerted upon sample trees from their nearest neighbor trees, we first defined as neighbors those trees with crowns contacting the sample tree. The neighbor trees were also located outside the sample plot and located around the sample tree.
The DBH, HT, and CW of neighboring trees in the four cardinal directions relative to the sample tree were then measured; the direction of these trees and their distance from the sample tree were also recorded in the field. In all, a total of 219 nearest neighbor trees were measured.

2.3. Branch Analysis and Foliage Biomass Calculation

Before felling, the DBH, HT, HCB, and CW of all the sample trees were measured, and a vertical line from the stem base to the breast height was marked on the magnetic north side of the tree bole to determine the azimuth of the branches. The sample trees were then felled using a chainsaw—as carefully as possible, to avoid damage to the branches—and the line on the north side was extended to the tree tip. The stem was cut into 1 m sections from the tree base to the tree tip, and the section shorter than 1 m was recognized as the tree tip for study purposes. Branch measurements were then carried out from the tree tip downward to the crown base. Each section was erected at the ground level, and the attributes of branch diameter (BD), branch length (LBR), branch chord length (BC), branch angle (VA), branch azimuth (AZ), and distance between the branch base and the tree tip (L) were measured in all living branches from each section. The distance between the tree tip and the lowest live branch that was contiguous to the former whorl was defined as the crown length (CL, m). The crown ratio (CR) was defined as CR = CL/HT. The vertical distance between the branch tip and tree tip was termed DINC and was calculated as DINC = L − BC × cos (VA). To eliminate the effect of the tree height, the relative position of the branch within the crown (RDINC) was defined as RDINC = DINC/CL. The graphic description for the main tree and branch variables is shown in Figure 1.
Each stem section was separated into stem and branch + foliage components after the branch attributes were measured. The total green weight of each branch with foliage attached (i.e., a foliated branch) was weighed as soon as the branches were cut from the tree bole in the field. The entire live crown was divided into three equal sections by dividing crown length by 3. For each layer, one median-sized and healthy branch with no insect damage was randomly selected as a sample branch, and the foliage was then detached. The branch without foliage and the foliage itself were separately weighed immediately after the foliage was detached in the field. For each sample branch, an approximately 100 g subsample of foliage was bagged for laboratory drying at 70 °C to a constant weight and the moisture content of the needles was applied to branch wet weight to calculate a total sample branch needle dry weight. Descriptive information of the potentially independent variables used in the model development is shown in Table 3. The summary statistics for all the sample branches and for the branch attributes are shown in Table 4.

2.4. Foliage Biomass Distribution Model Development

Using the foliage biomass of the sample branches, we developed Equations to predict foliage biomass for the other branches within the entire crown at the branch level. For the branch level, the basic independent variables considered in the model included branch age, basal diameter, branch length, and branch position defined as the distance between the branch base to tree tip in the crown [12].
Based on the primary graphic analysis of foliage biomass against the candidate independent variables at the branch level, a power model with branch diameter as the primary explanatory variable was selected as the basic model, as follows.
F B i j k = β 0 i × B D β 1 i + ε i j k
where FBijk is the foliage biomass for the ith branch of the jth section from the kth individual tree, BD is the branch diameter, β 0 i and β 1 i are model parameters for the ith tree to be estimated using ordinary least square estimation, and ε i j k is the error term. We sequentially tested the other variables, including branch age (ABR), diameter at breast height (DBH), and branch length (LBR), as well as variables related to position in crown and to competition. Following the study of Schabenberger and Pierce (2002) [34], a likelihood ratio test was used to test whether the inclusion of a variance model significantly improved the fit of the model. For each value of β0 and β1 for the individual trees, the independent variables that displayed the best linear unbiased estimates were evaluated. In addition, the other potential explanatory variables and the transformations were sequentially tested to ensure that all the fits were approximate correct [12]. We sequentially tested other potential independent variables until the change in Akaike’s information criterion (△AIC) became less than 5 [12]. Following the study of Goudie et al. (2016), a likelihood ratio test was used to support the inclusion of other variables.
The foliage biomass of the branches located on the same annual shoot was calculated as the sum of the total foliage biomass for all the branches on the same annual increment of the main stem. The foliage biomass of the branches located on the same annual shoot was calculated as the sum of the total foliage biomass for all the branches on the same annual increment of the main stem. To model the foliage biomass distribution at the annual shoot level, the relative annual shoot foliage density was used as the dependent variable. For the annual shoot level, the basic independent variables considered in the model included the annual shoot age at the crown base, absolute or relative length of each shoot, and position of the annual shoot in the crown [12]. The beta probability density function is flexible, and the vertical trends of foliage biomass on the annual shoot level were therefore described using the beta probability density function [12,35] (Equation (2)).
F D R s i j = β 0 i × L R 1 i j β i i 1 L R 1 i j β 2 i + ε i j
where FDRs is the relative annual shoot foliage density, calculated as FDRs = FDs/CL, in which FDs is the annual shoot foliage density, calculated by dividing the foliage biomass of the annual shoots by the length of the ith shoot; CL is the crown length; LR1 is the relative distance down an annual shoot defined as the distance from the leader to the midpoint of the annual shoot divided by the distance between the base of the leader and height to the base node in which the midpoint of the shoot is half the length of the projection of the shoot onto the stem; i denotes the tree; and j denotes the annual shoot.
In addition to the independent variables at the branch level, annual shoot level and tree level, forest stand (CI1CI3, Equations (3)–(5)), and competition from nearest-neighbors trees (CI4, Equation (6)) were also computed and incorporated into the foliage biomass model [36,37], as follows:
C I 1 = D B H i d g
C I 2 = g i g ¯
C I 3 = B A L = d i < d j g i S
C I 4 = C L I i = 1 C L i C L i N h a i + i = 1 i j n C L i N h a i
where CLIi is the crown length index of the subject tree i and is a comprehensive competition index relating the stand density to the crown base of the subject tree and combines the horizontal and vertical competition effects; CLi is the crown length of the subject tree i; Nhai is the per hectare expansion factor of the subject tree i; CI1 is the ratio of the diameter of the subject tree to the quadratic mean diameter; CI2 is the ratio of the basal area of the subject tree to the mean basal area of the stand; and CI3 is the sum of the basal areas of those trees with a diameter greater than that of the subject tree [38].
In our study, 3 branches were sampled from each individual tree. By such means, the error term of the regression model would not be independent or uncorrelated. A mixed-effect model that showed good performance in modeling the dataset with a correlated error term was also used [39]. The variance model was evaluated by likelihood to test if its inclusion significantly improved the goodness of fit of the equation [34]. The mixed-effect model integrated tree-level random variations into the base model. All possible parameter combinations were considered as mixed-effects parameters and the model with the smallest AIC and RMSE, and largest Log-likelihood and Ra2, was selected as the best model. The first-order autoregressive structure was used to resolve the autocorrelation in the residuals within the same tree. The heteroscedasticity of error variance was modeled using power and exponential variance functions [34]. All analyses and parameter estimates were conducted using the nlme package of R software [40,41].

3. Results

3.1. Foliage Biomass Distribution at the Branch Level

As for model (1), the estimates for β0 and β1 were 0.2972 (p < 0.001) and 1.9981 (p < 0.001). Likelihood ratio tests showed that β0 had significant random effects. Sequential building of a foliage biomass distribution model at the branch level suggested that the final prediction model at the branch level is shown as Equation (7).
F B = a 0 × B D a 1 × C I 2 a 2
where a0a2 are fixed model parameters to be estimated and a1 is regarded as the random effect showed the best performance. The other variables in Equation (7) are as defined above. For the competition variables, CI2 showed the best performance. We also compared the nearest-neighbor competition variables but found no significant effects on the model performance. The Ra2 of the final model was 0.44. The goodness-of-fit statistics and model parameter estimates of model (7) are shown in Table 5. The estimates of the fixed parameters for model (7) are shown in Table 6. Using the developed foliage biomass model (7), the foliage biomass for the other branches was predicted. The foliage biomass at the branch level increased with increasing relative depth into the crown from the tree tip and then decreased.
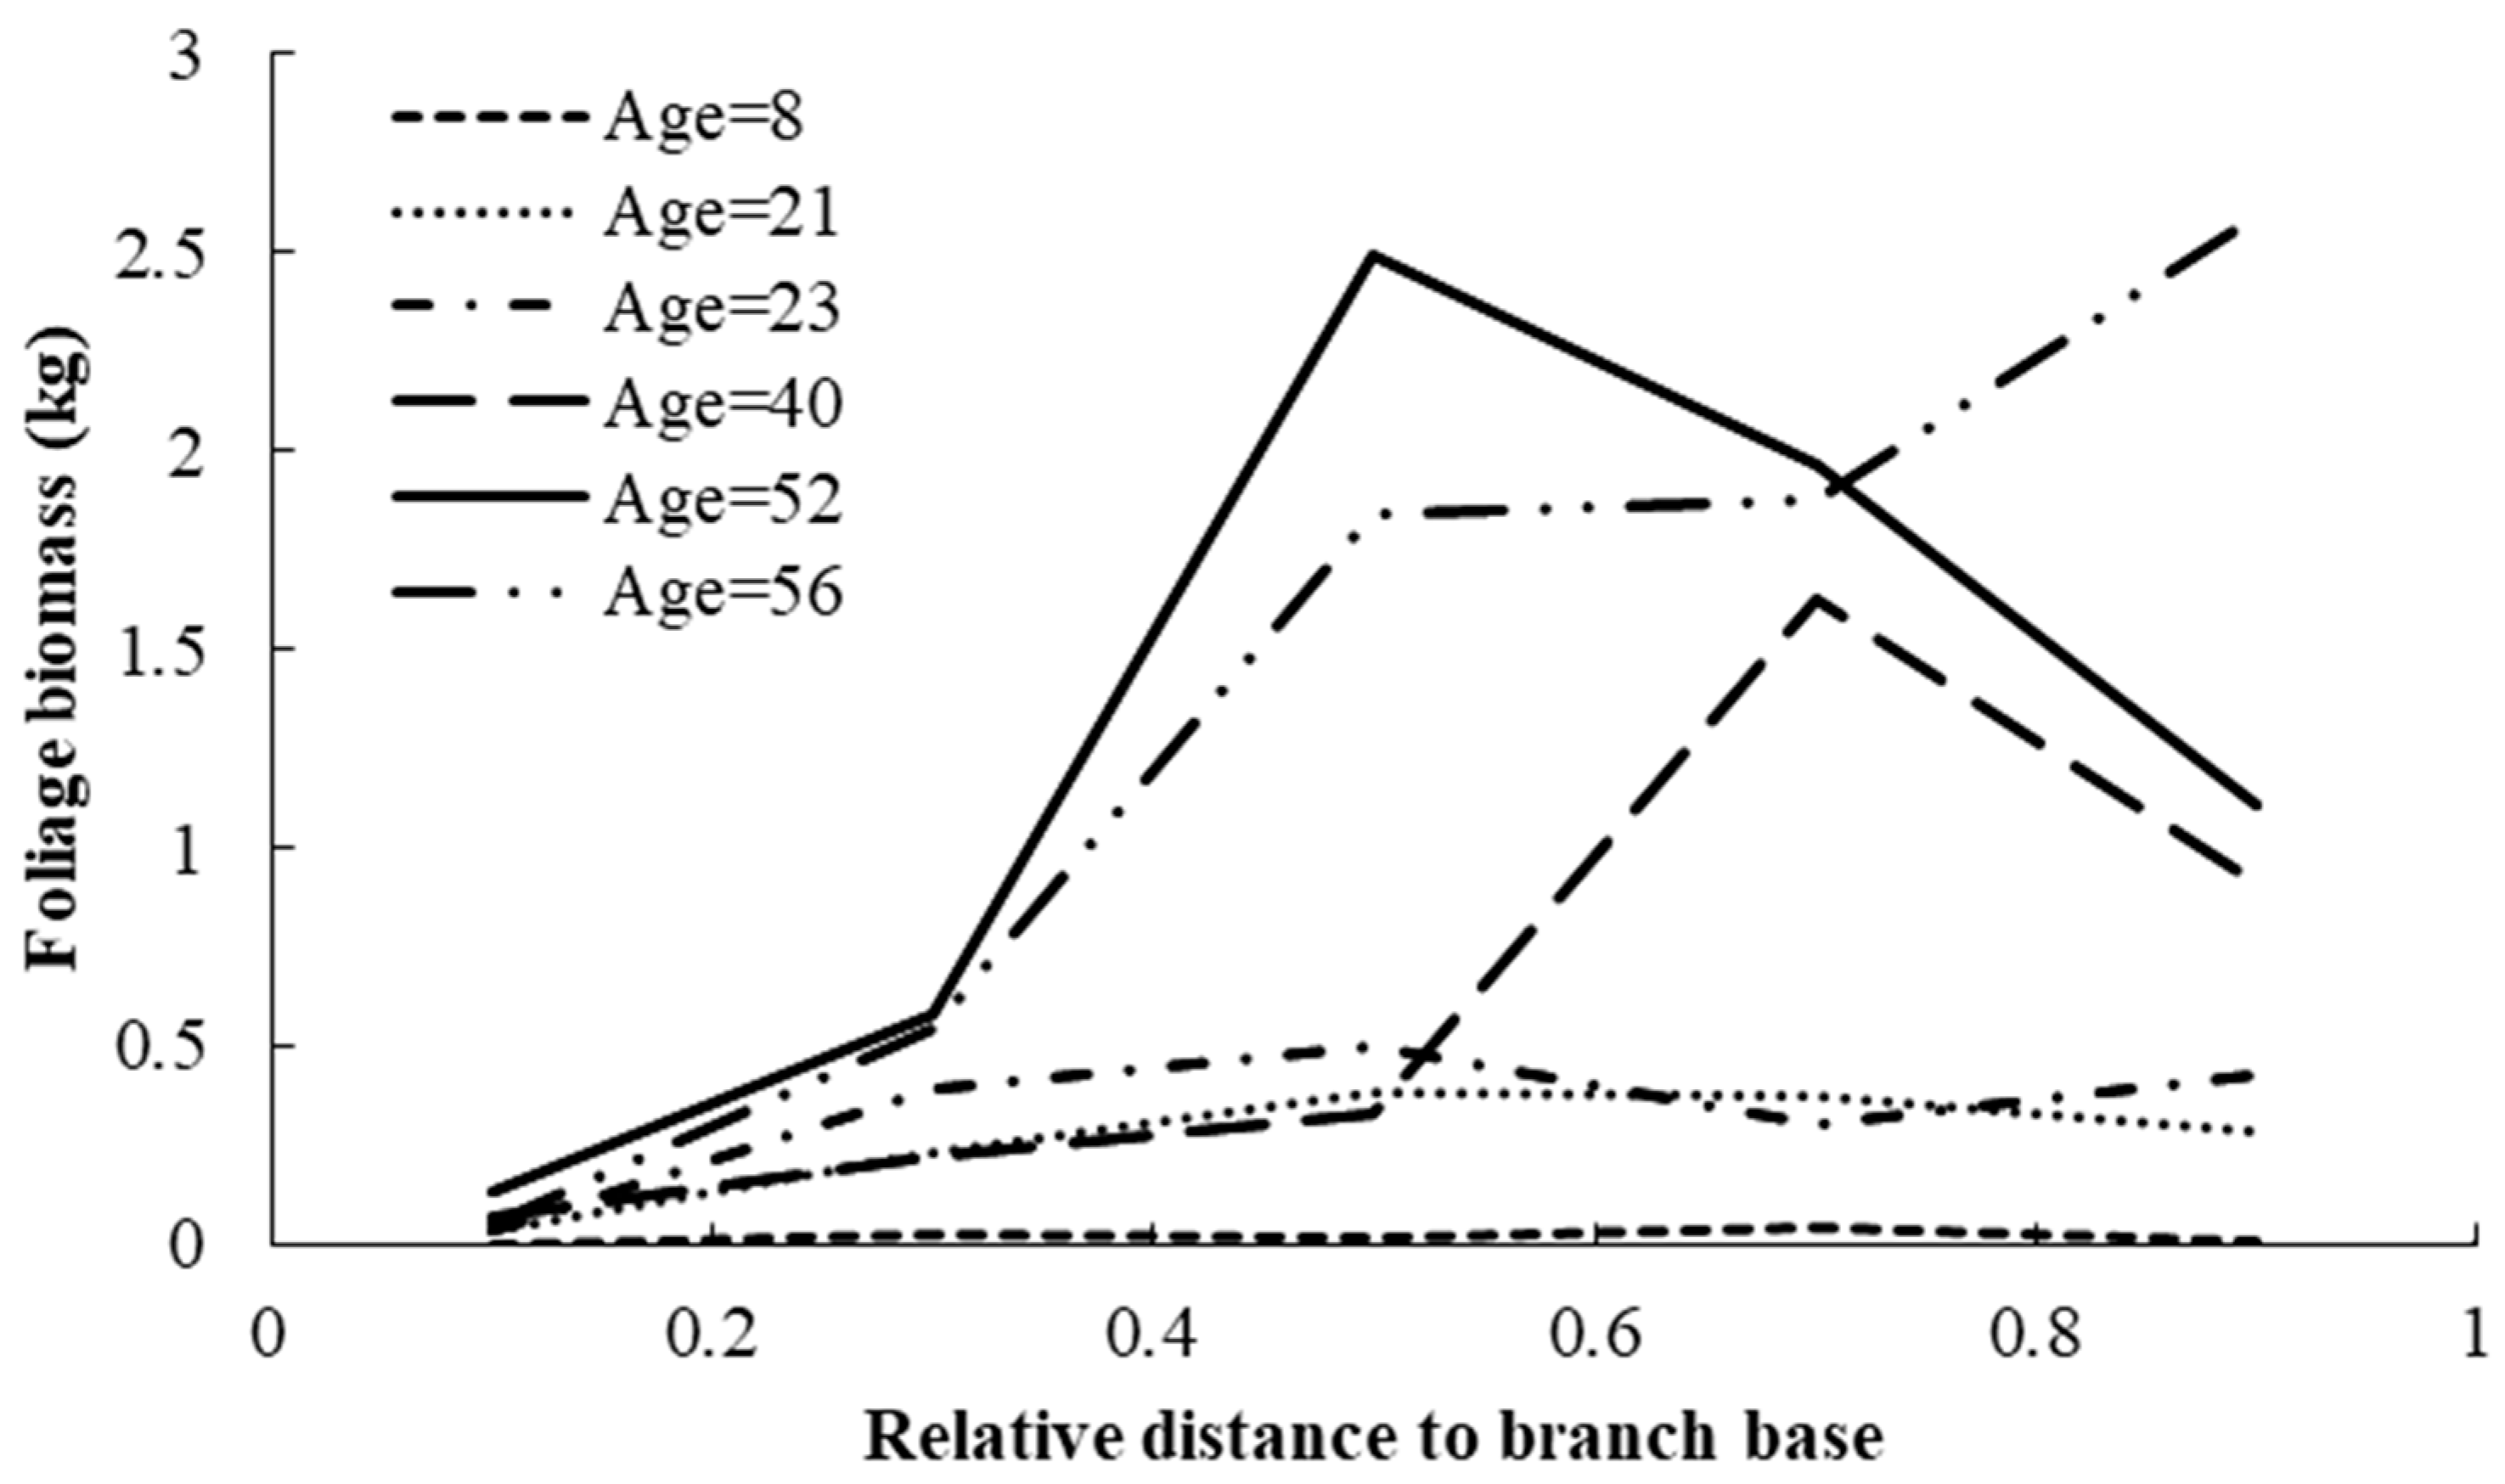
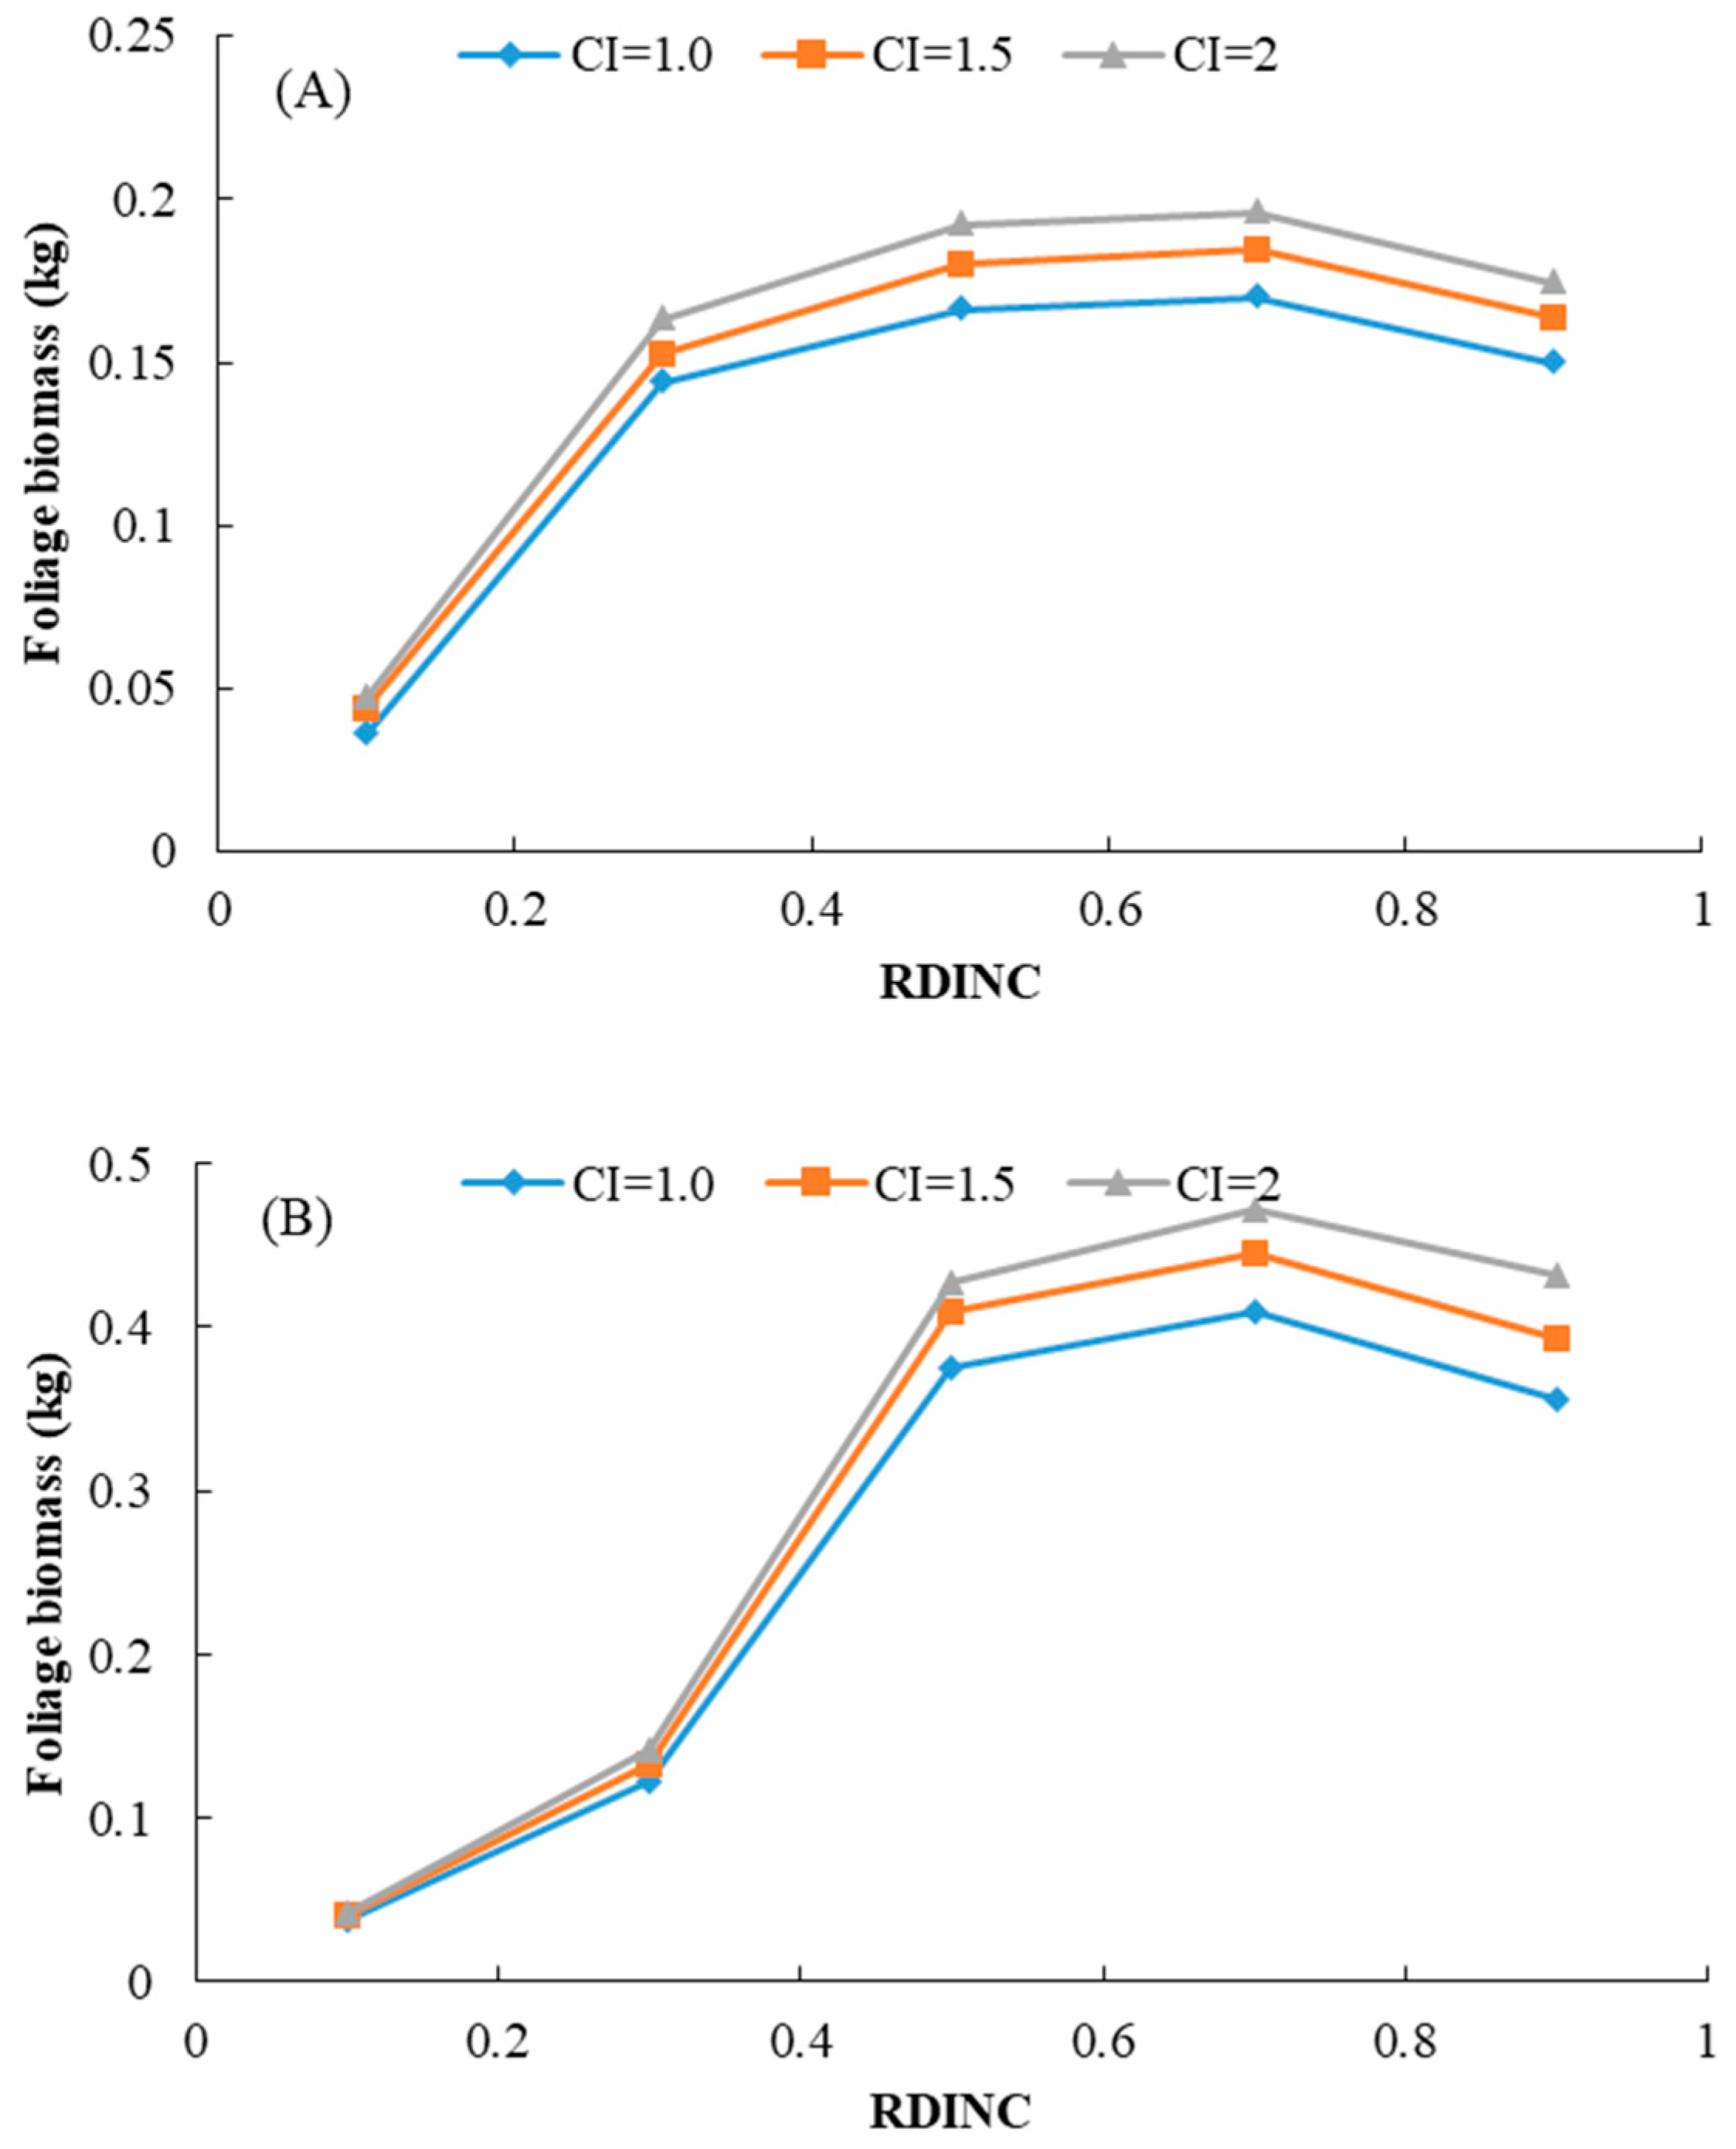
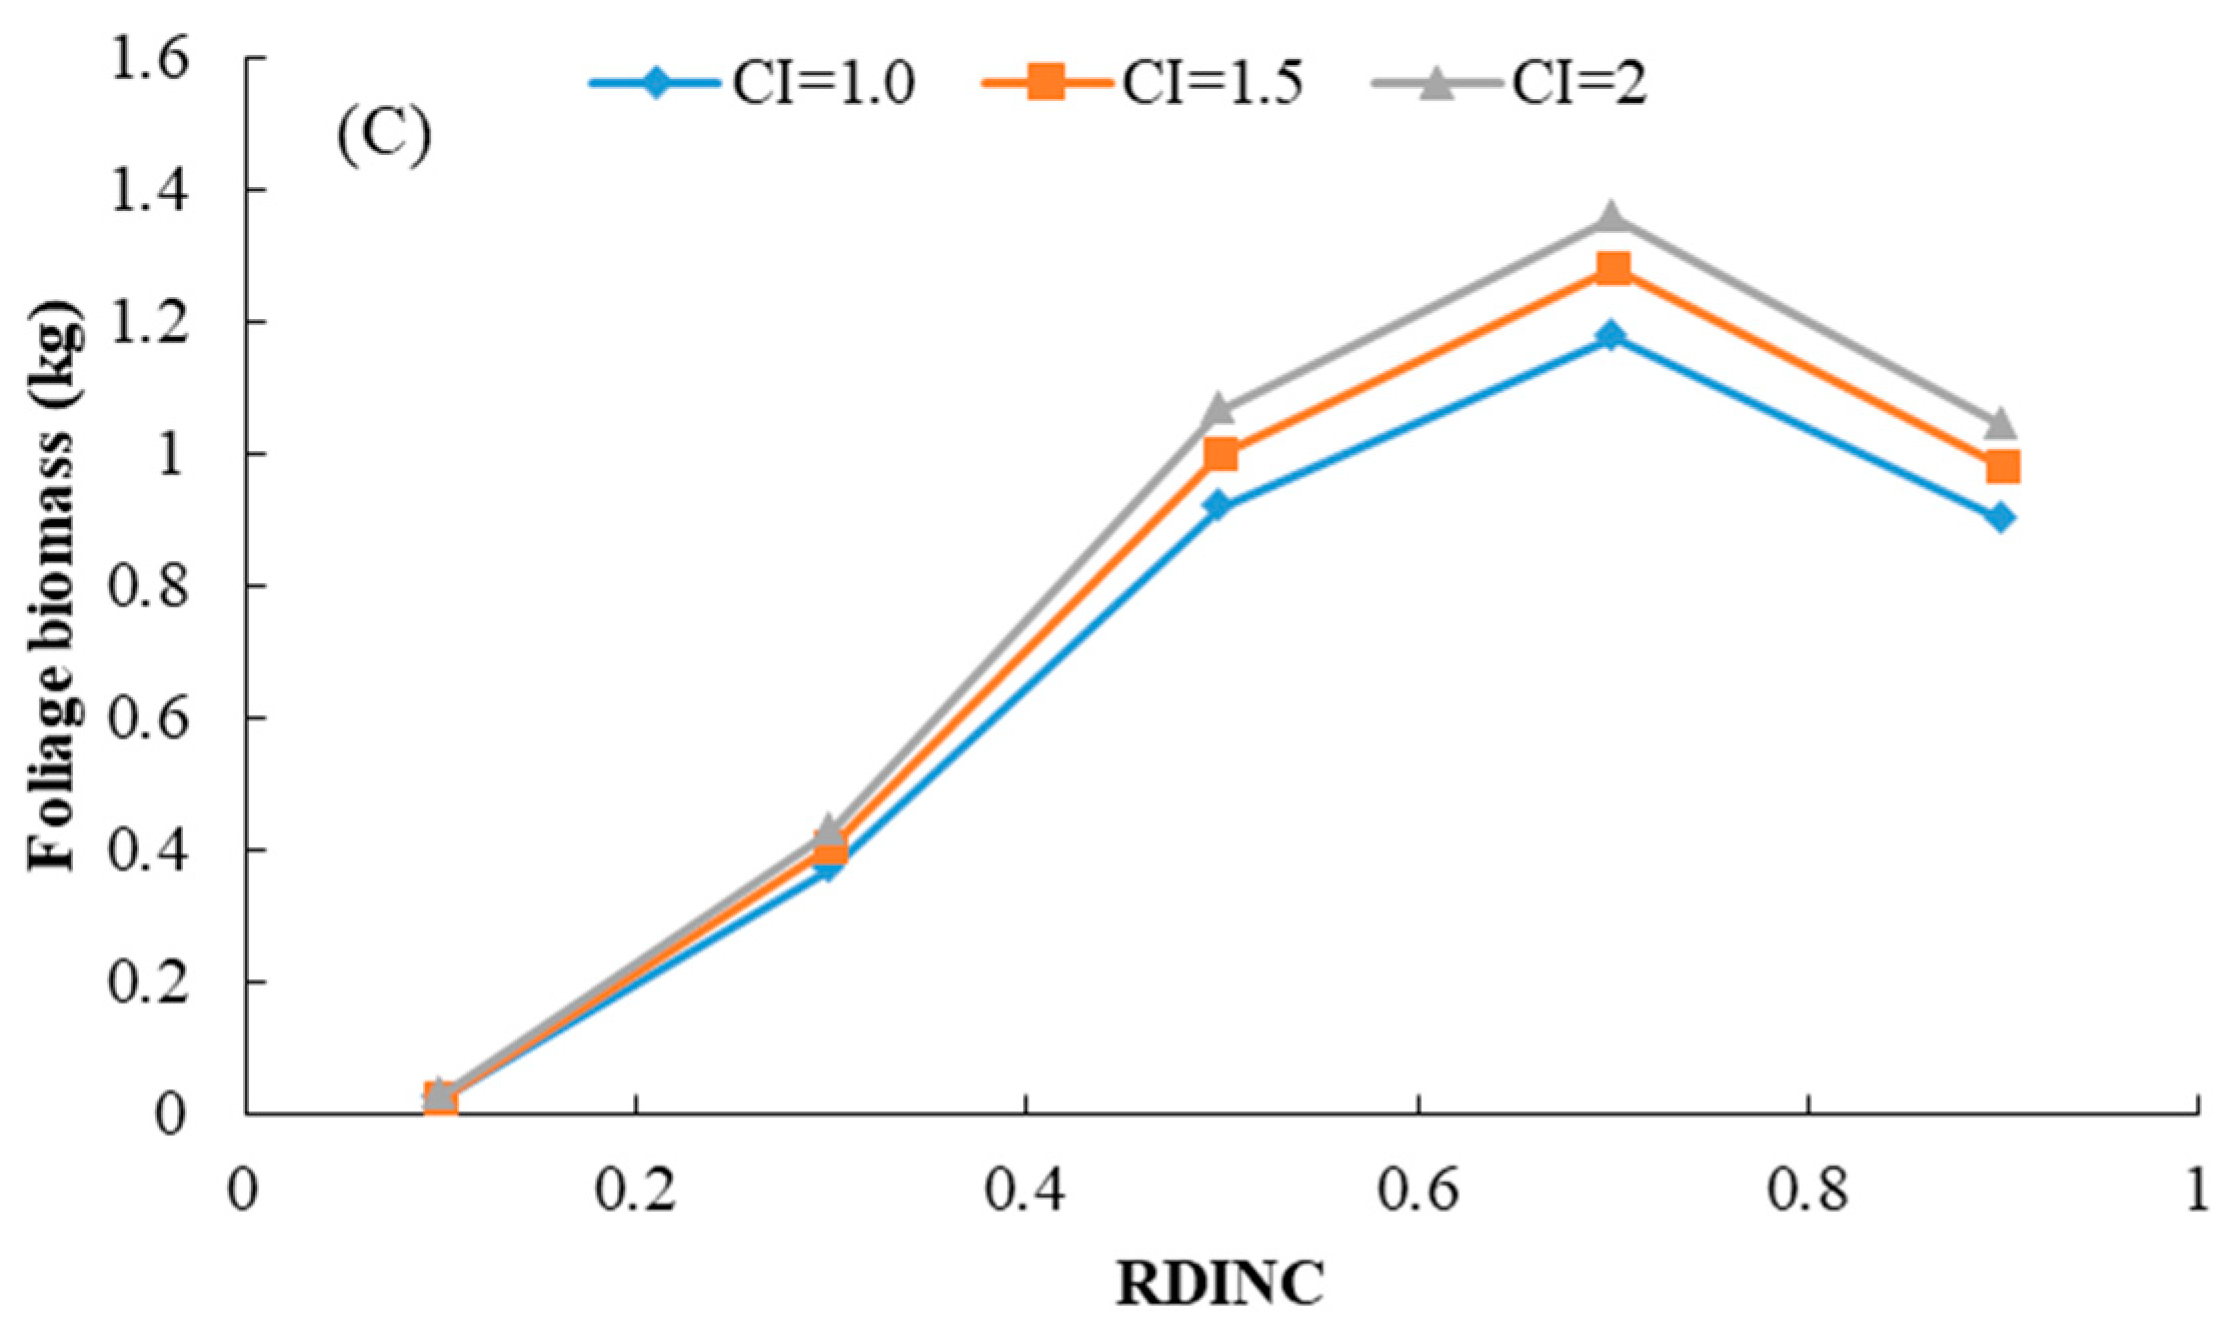
Using model (7), foliage biomass of each living branch was predicted with the same age and the predicted foliage biomass distribution within the crown for the trees of different ages is shown in Figure 2. Relative distance to the branch base is defined as the ratio of the distance between tree tip and branch base and crown length. This result indicated that the model showed good performance in foliage biomass prediction at the branch level. The foliage biomass increased with increasing tree age, and the predicted peak of the foliage biomass distribution at the branch level also shifted to the tree tip. The effect of competition on the foliage biomass distribution is shown in Figure 3. This result indicated that the foliage biomass increased with increasing CI2 for trees of different ages. The trees that showed advantageous growth ability also had a larger amount of foliage biomass.

3.2. Foliage Biomass Distribution at the Annual Shoot Level

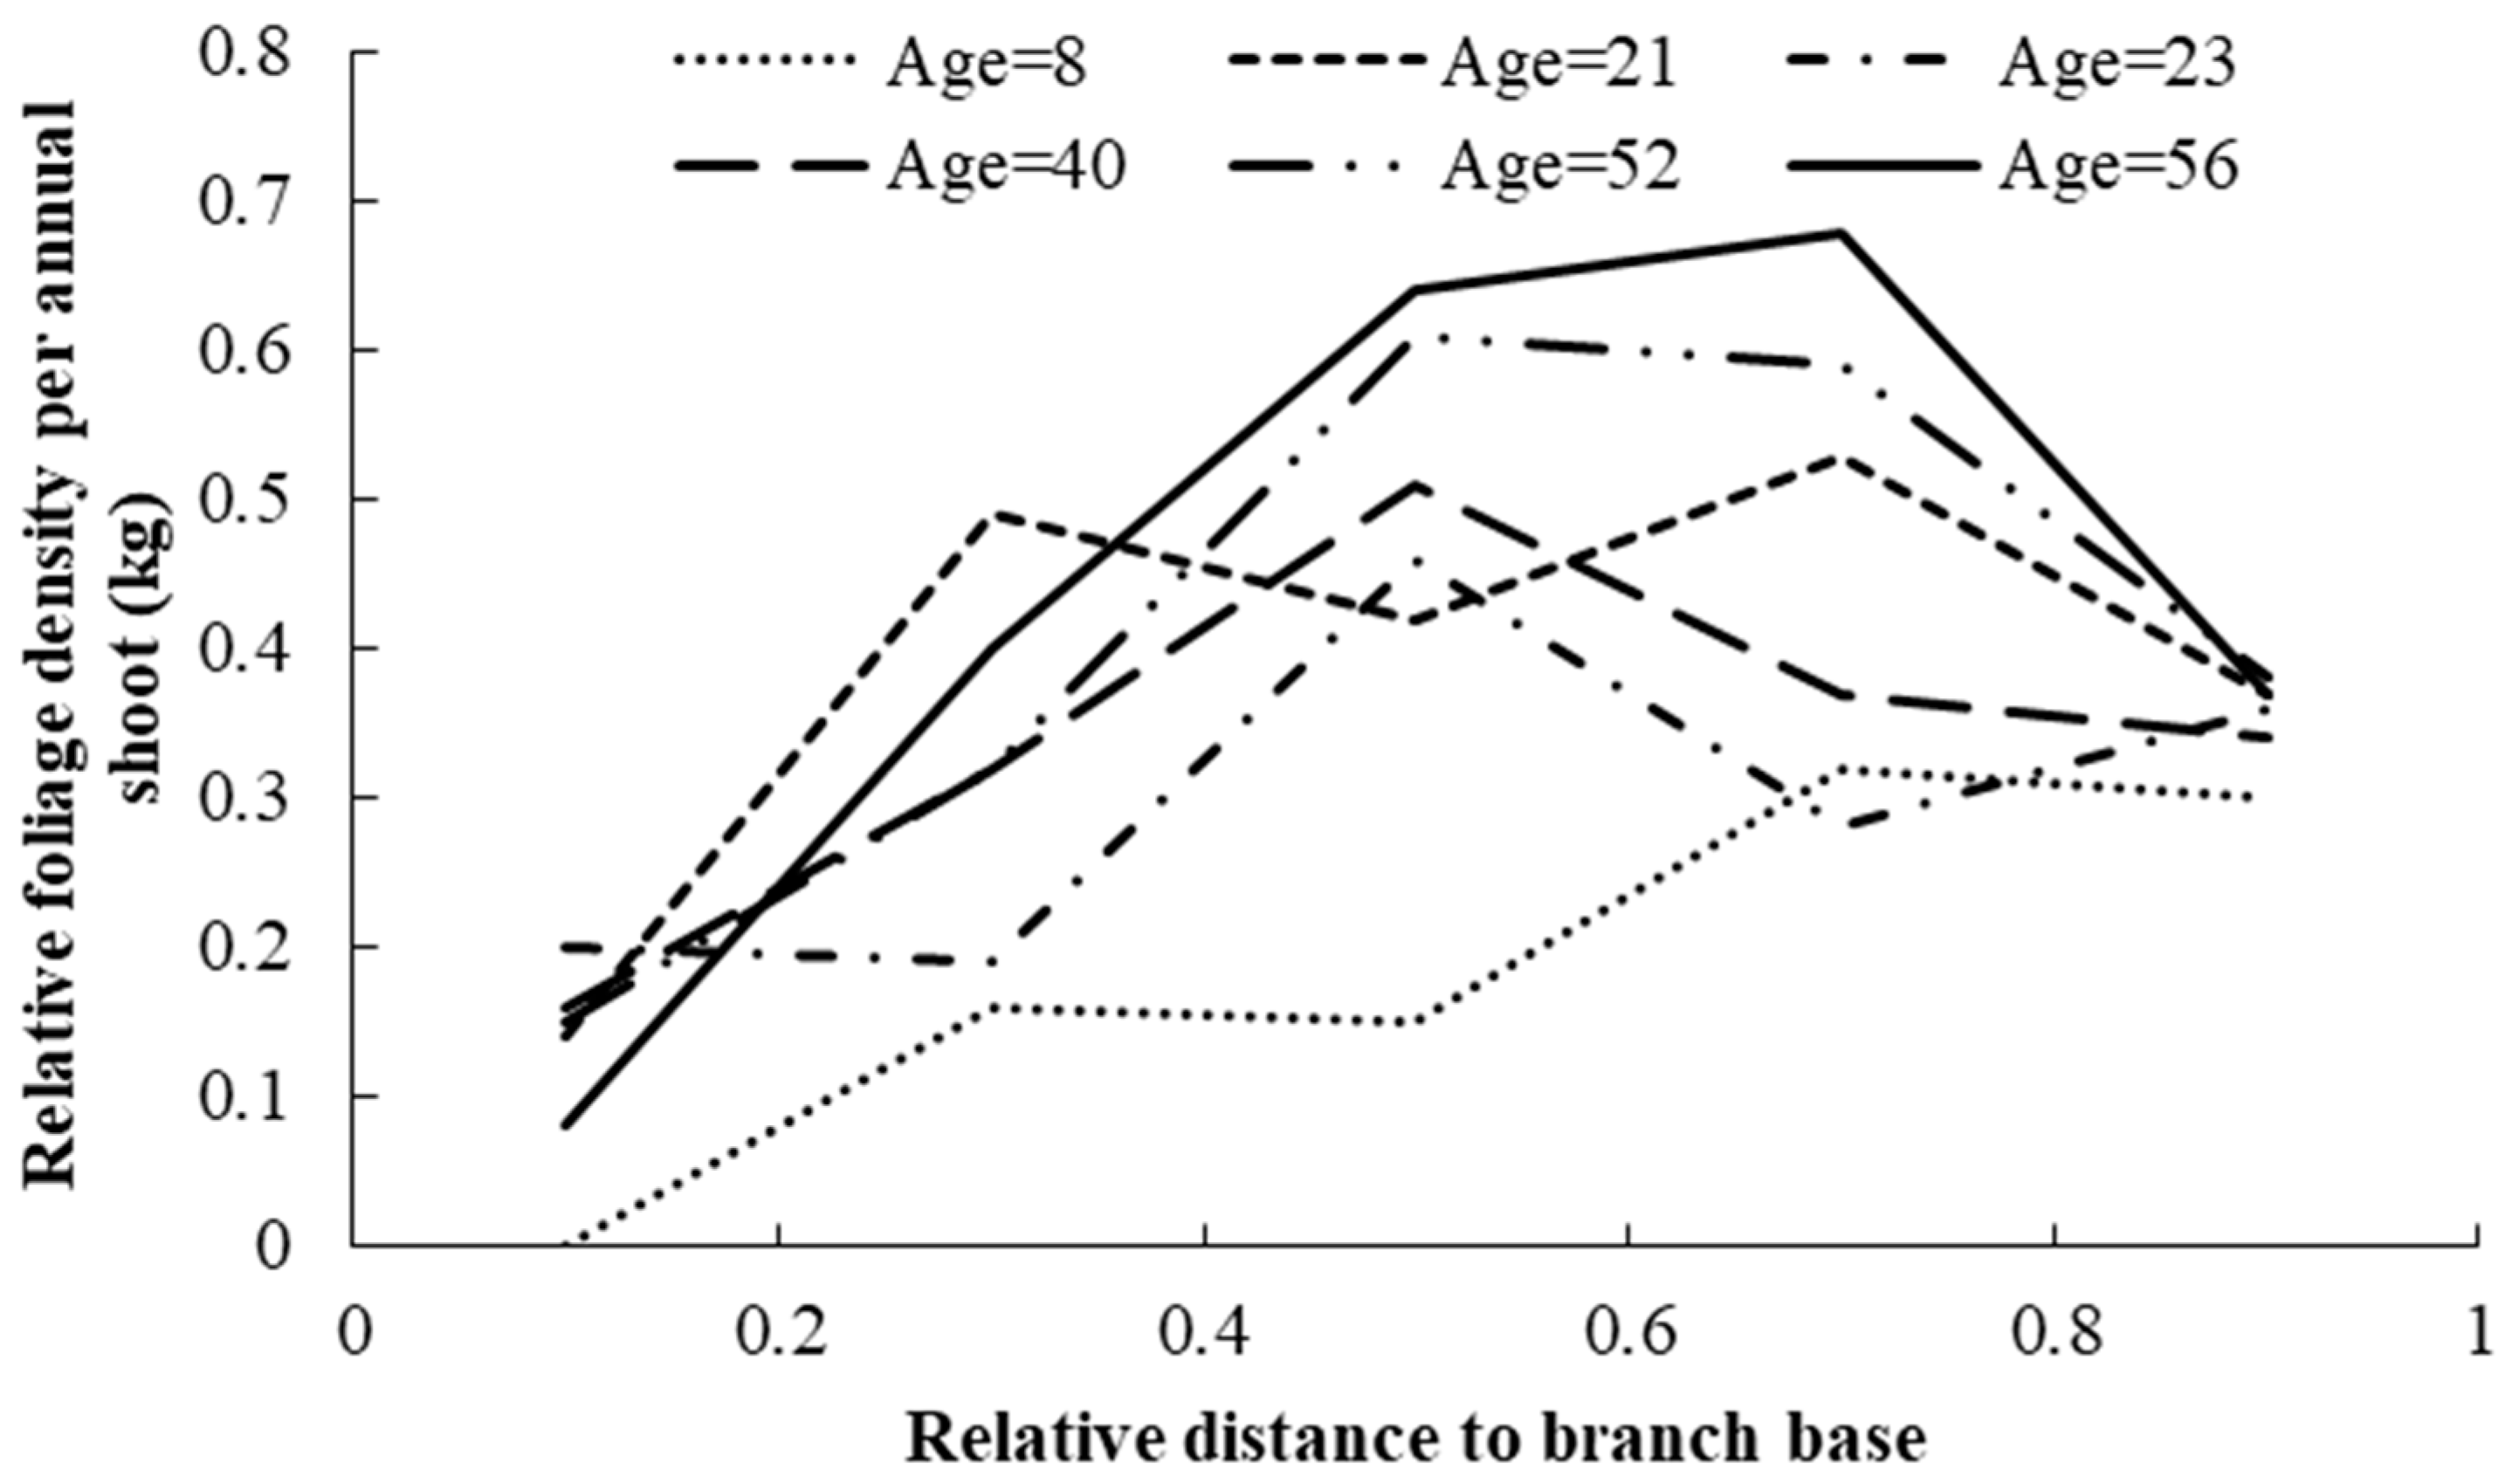
The relative foliage density per annual shoot (FDR) over the relative distance from the base of the leader shifted higher in the crown with the growth of individual trees. Similar to the foliage biomass distribution at the branch level, the peak distribution for the relative foliage density per annual shoot shifted up toward the tree tip with the growth of individual trees. Model (2) was used as the basic model to fit the FDRs. Similar to the approach used for foliage biomass distribution at the branch level, other variables, including BDm, and CI1, were sequentially tested and finally included in the prediction model, as shown in Equation (8).
F D R s = B D m ( b 0 + u 0 ) × C I 1 b 1 × L R 1 b 2 × ( 1 L R 1 ) b 3
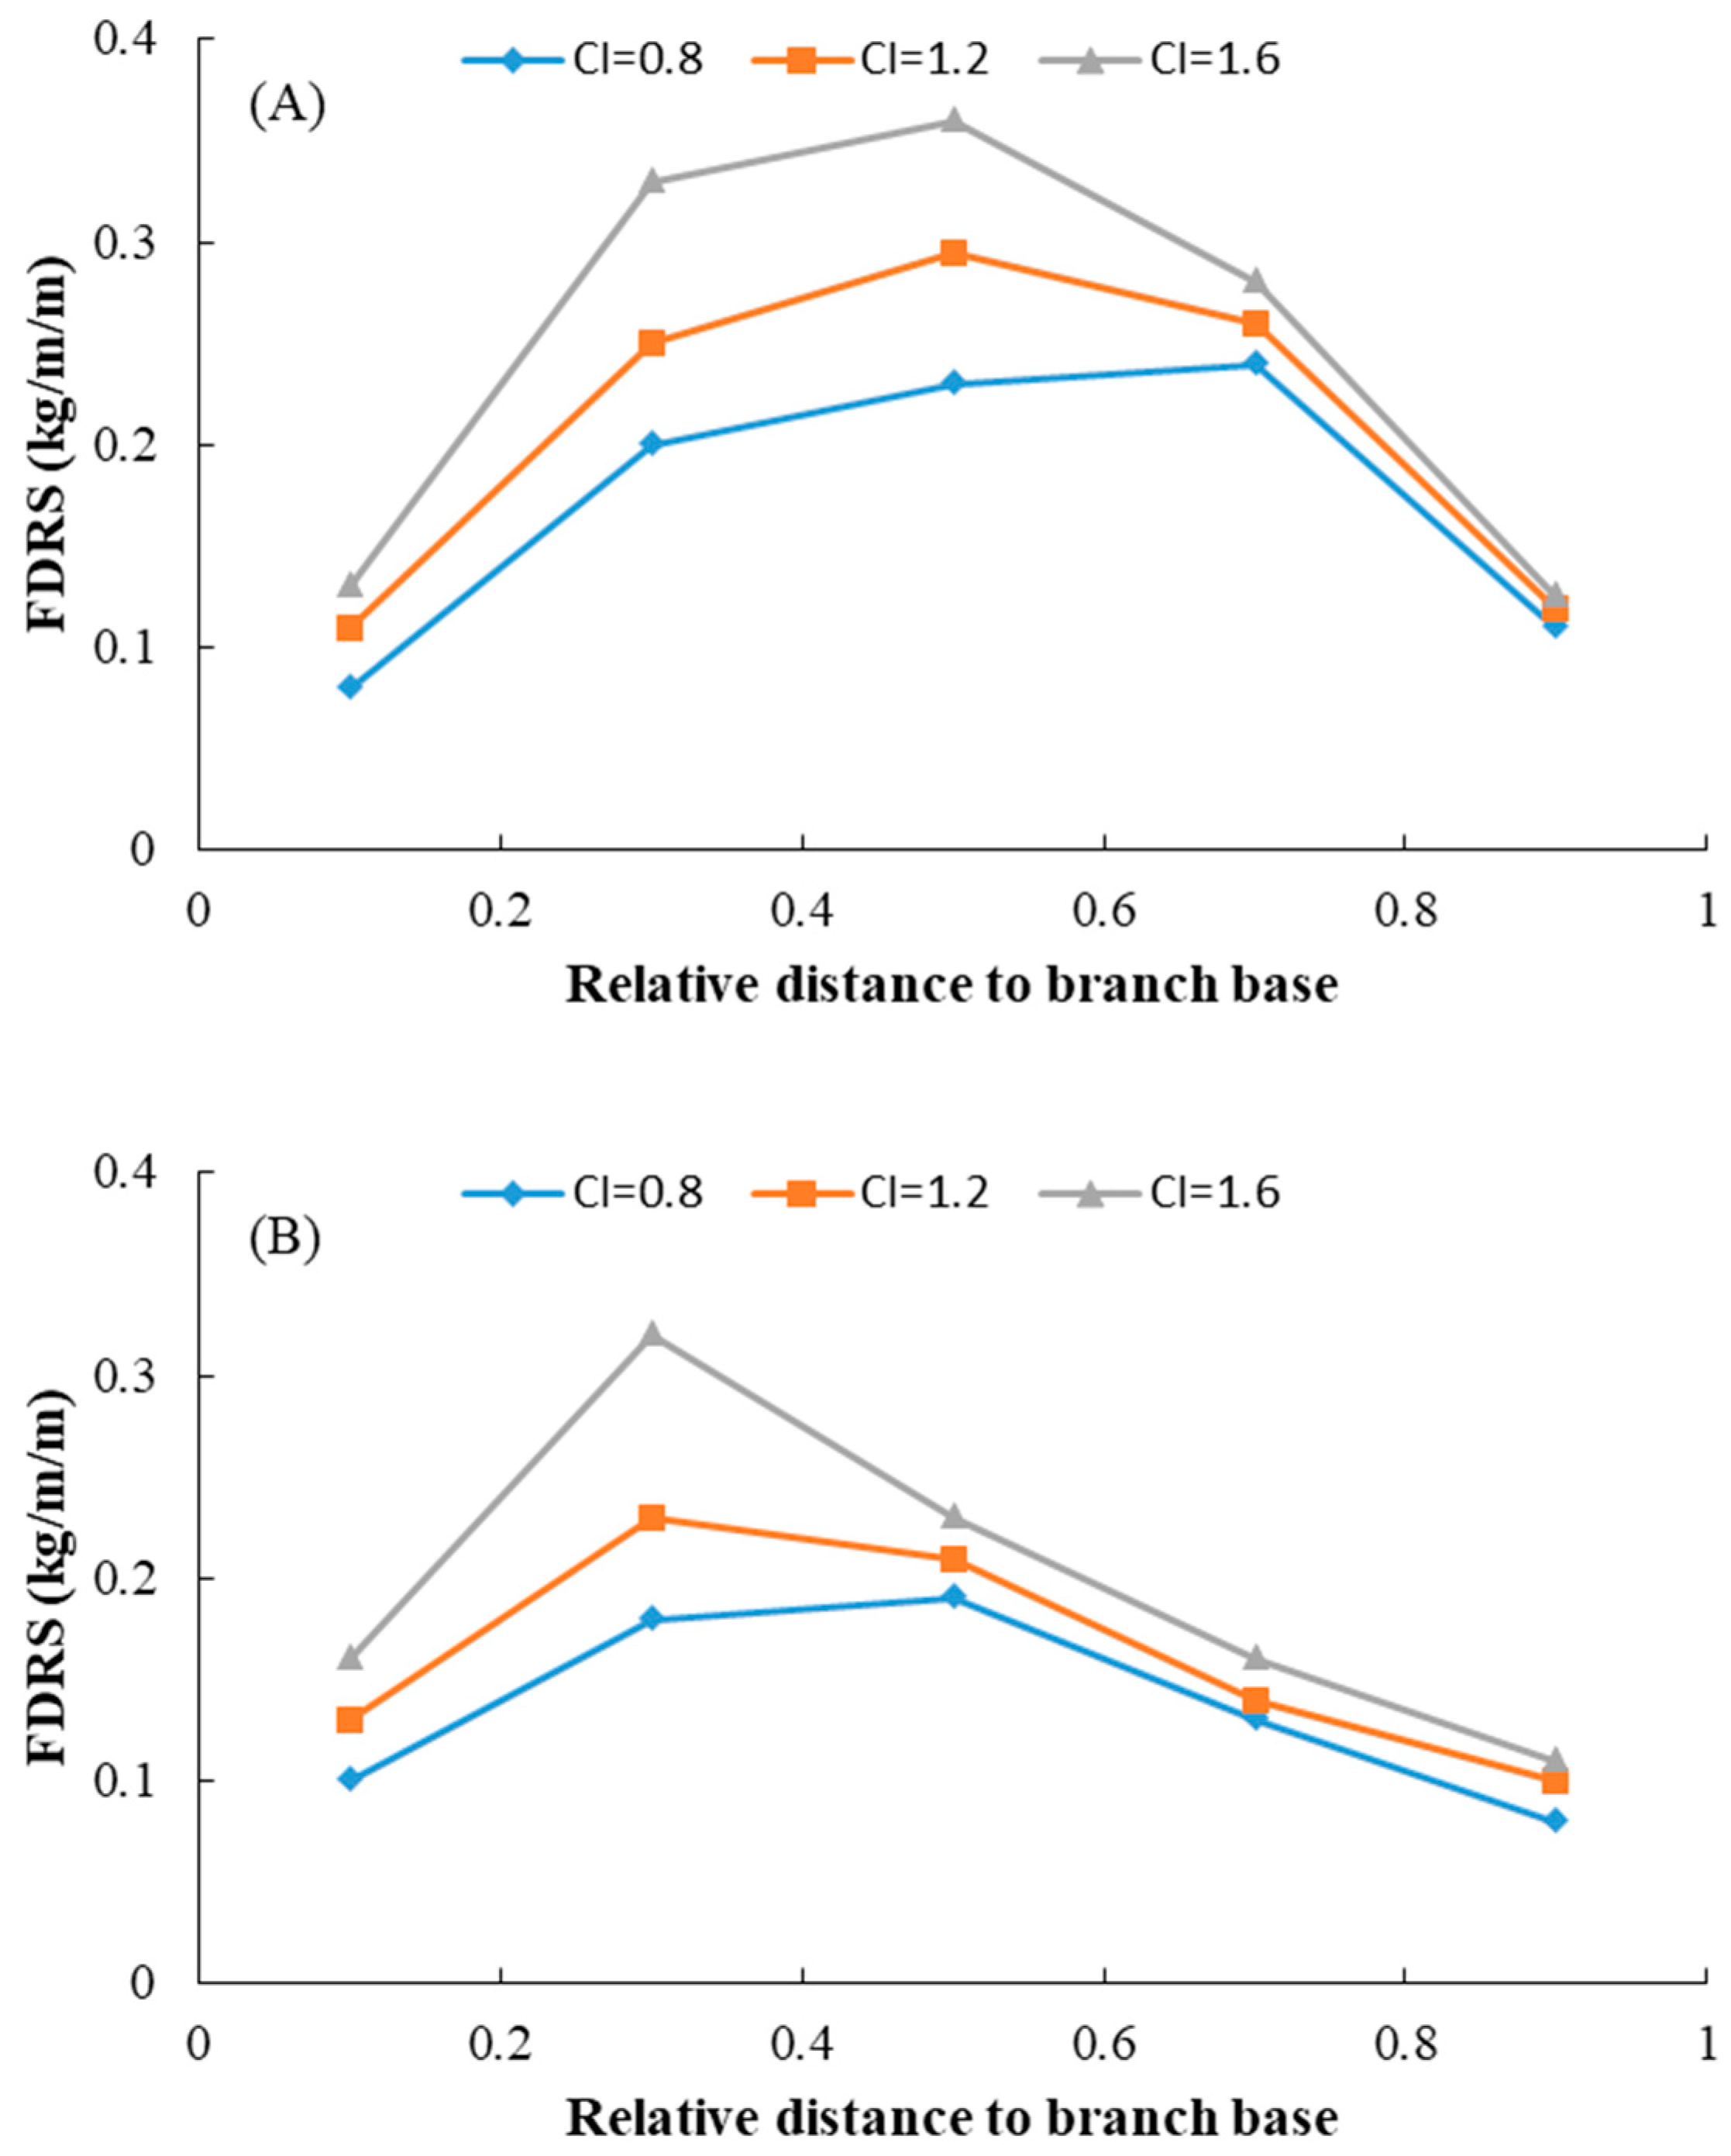
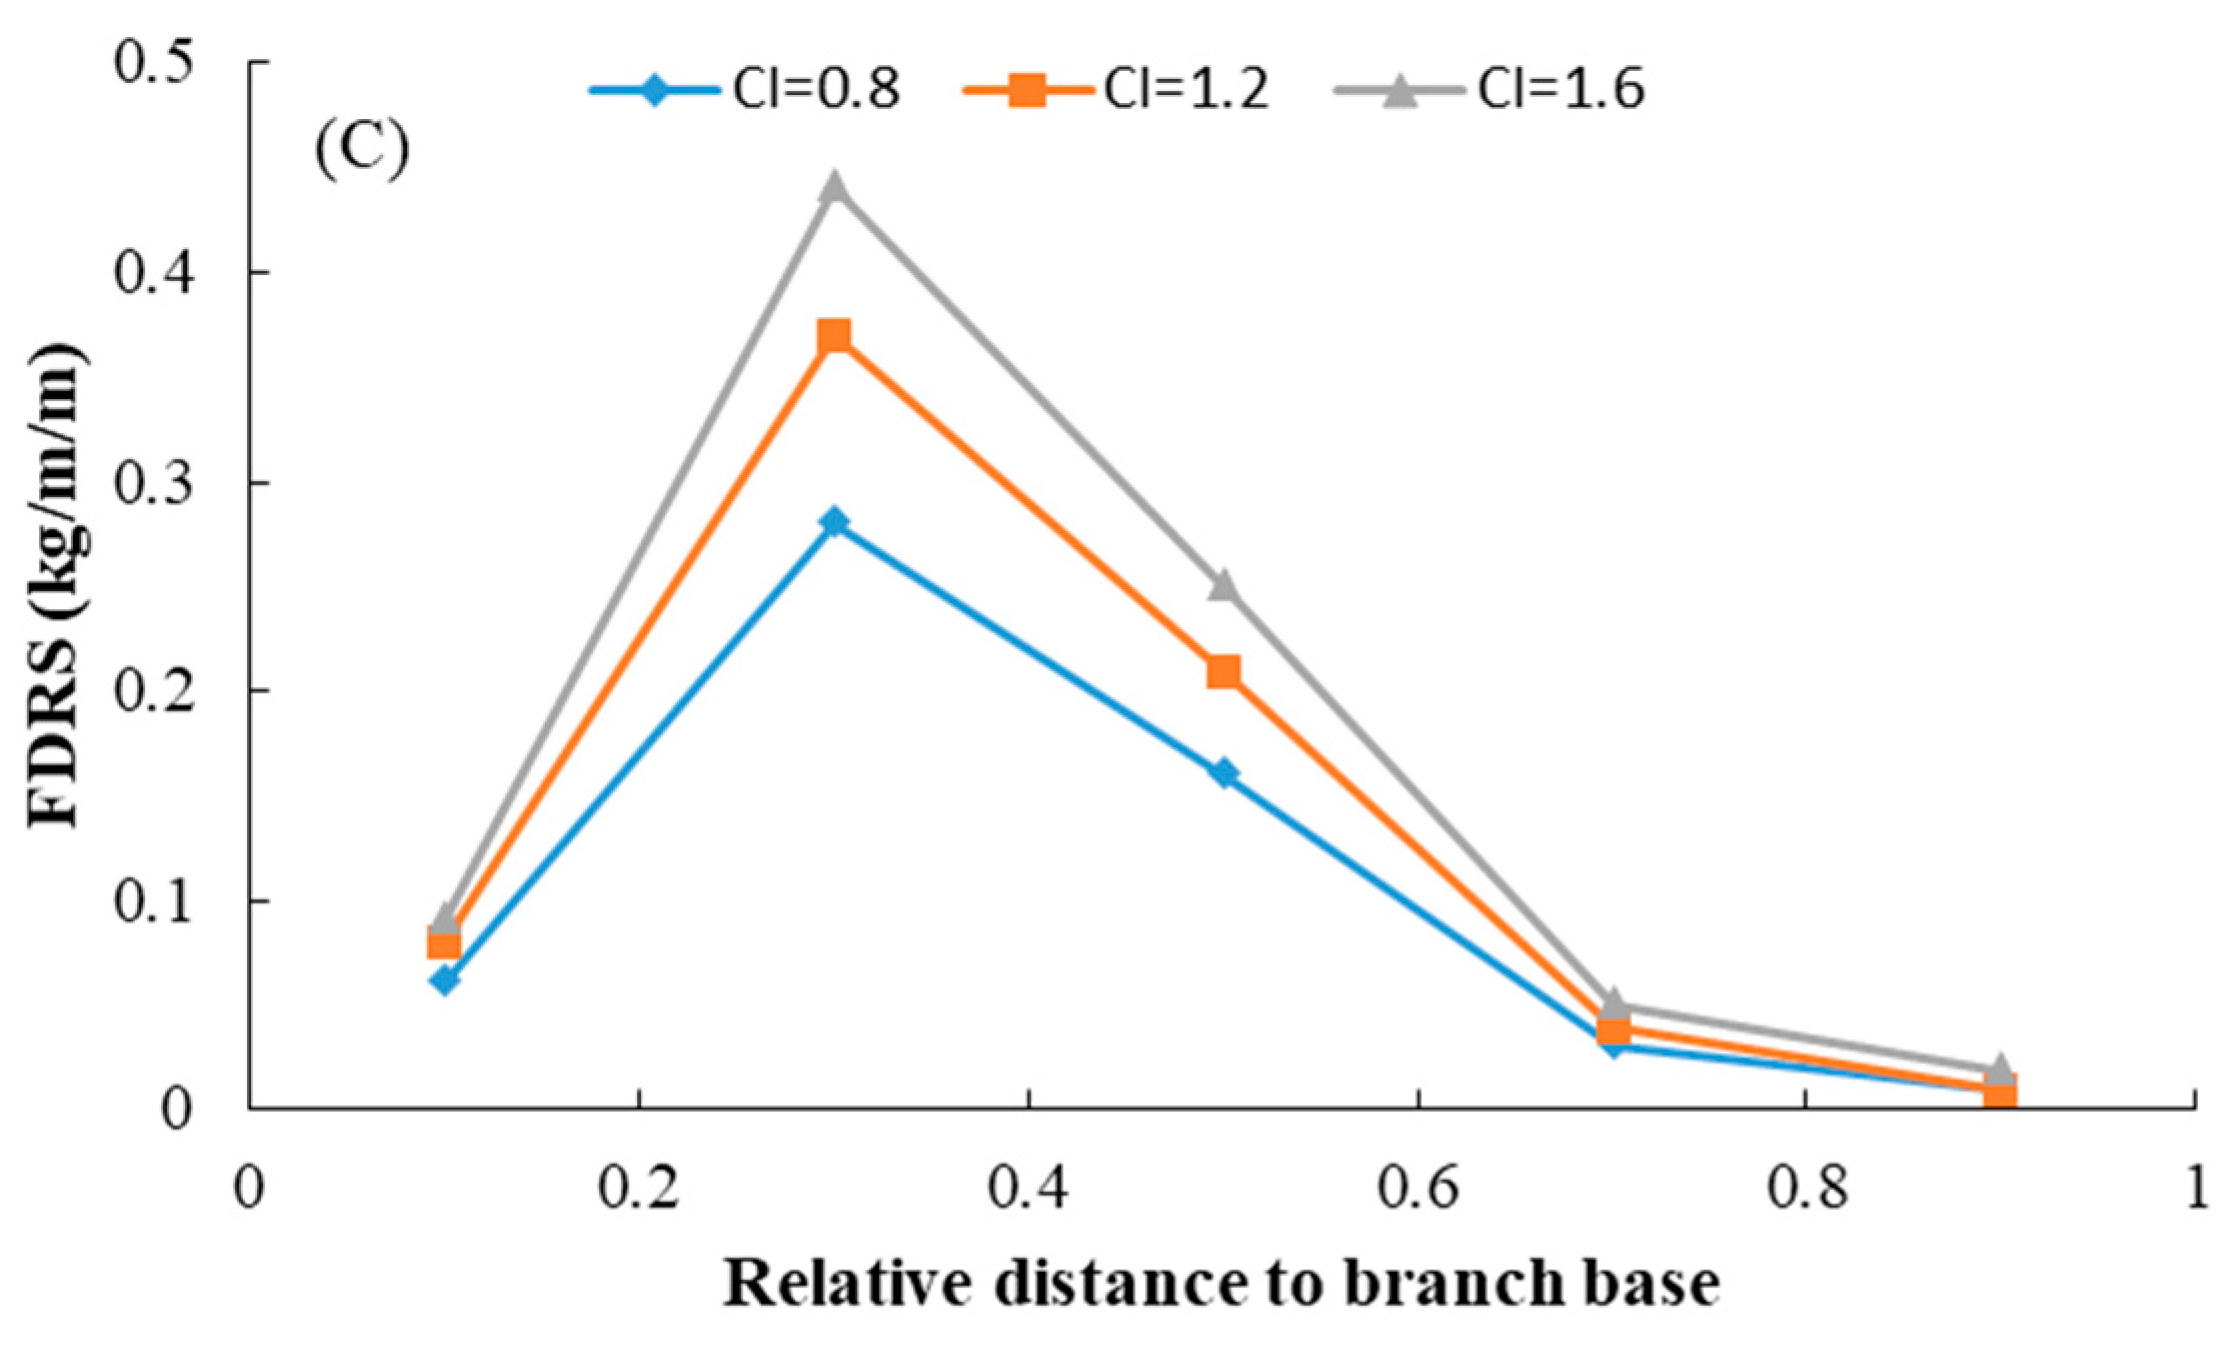
where BDm is the mean branch diameter, b0b3 are model parameters to be estimated, u0 is the random effect, and all other parameters are defined as above. For the final model, the likelihood ratio test indicated that parameter b1 as the random effect showed the best performance. The goodness-of-fit of model (8) is shown in Table 5, and estimates for all the parameters of Equation (8) are shown in Table 6. Based on the test results, all the parameters were significantly different from zero, and the symbols of the parameters were consistent with the biological reasoning of each variable. The predicted FDRs along the tree bole within the entire crown are shown in Figure 4. In a similar way to the foliage biomass at the branch level, the relative foliage density per annual shoot within the crown first increased and then decreased as it moved toward the crown base. FDRs also increased with increasing tree age. The effect of competition on the FDRs is shown in Figure 5. This result indicated that those trees with a strong competitive advantage usually displayed larger foliage biomass at all ages compared to less dominant trees.

4. Discussion

The display of leaves on branches and in the crown is a strategy used by individual trees to optimize radiation interception [42]. The quantity and distribution of foliage biomass expresses the suitability of trees to the microenvironment and thus exerts a large impact on tree growth, on stand dynamics, and on the timber and nontimber values of forests [12]. The spatial distribution of foliage biomass is also a crucial characteristic of canopy architecture because the amount and distribution of intercepted radiation intrinsically depend on the crown structure of the individual trees [43,44]. The importance of the vertical distribution of foliage biomass has already been emphasized for Douglas fir [45,46], jack pine [34], and loblolly pine [18].
We found that there was more foliage biomass in the upper part of the crown of younger trees, but in contrast, more foliage biomass in the lower crown of older trees. The upper foliar layer within the crown is generally the main location of photosynthesis converting more solar energy within the foliage component biomass [47]. In addition, the upper crown also tends to maximize the light available to the foliage component in the higher crown of individual trees, at least for species adapted for direct rather than diffuse light. Therefore, it suggests that younger trees are much more vigorous than older trees in intercepting light sources in forest stands [12,48]. Dependable allometric predictive equations based on branch- and tree-level dimensions can estimate foliage biomass and have been widely reported [49,50]. The foliar biomass allometric relationship is an important component for predicting growth and carbon circulation in many growth models [11,51]. The extent of observed foliage biomass is essential for evaluating the distribution of foliage within forest stands. Therefore, we studied and compared the foliage biomass at the branch and annual shoot scales, similar to the study of Goudie et al. (2016) [12]. Branch characteristics, such as branch diameter, branch length, and branch position within the crown, are generally considered the main variables used to predict foliage biomass for many tree species [52]. We found that foliage biomass increased with branch diameter at both the branch level and annual shoot level, as shown by the parameter estimates for a2 and b2 in Equations (7) and (8), respectively (Table 6), and the results of our study are consistent with those of Xiao and Ceulemans (2004) [43]. However, branch length is only a significant variable for the foliage biomass model at the branch level; it is not significant at the annual shoot level. We examined the relationships between foliage biomass at branch level and the mean branch diameter and mean branch length and found that mean branch diameter explained most variability. The foliage biomass at the branch level increased with increasing branch length. Branch age is another important variable in the foliage biomass distribution model at the branch level [52]. The foliage biomass at the branch level increased with increasing branch age for the other branch-, tree-, and stand-level variables (Table 6). HRCC is a reflection of the location of crown contact with neighboring trees and emphasized the effect of the relative position of the crown to the neighboring trees on foliage biomass distribution [12]. Crown contact with neighboring trees also reflected the neighbor density and thus limited the crown development [53]. DBH and CR were two other important tree-level variables for the foliage biomass. The foliage biomass at branch level and annual shoot level decreased with the increasing of CR at the same LR1 when other variables were unchanged. CR reflects the vigor of individual trees and despite the HRCC level. Therefore, we included CR in the final model.
The vertical distribution of foliage biomass is generally changeable when trees face different competitive environments and different stages of stand development [53,54]. In the present study, only the ratio of the diameter of the subject tree to the quadratic mean diameter (CI1) was significant for predicting the foliage biomass distribution at both the branch level and annual shoot level. The foliage biomass at both branch level and annual shoot level increased with increasing of CI1 for trees of different ages. It indicates the trees which showed advantageous growth ability also had a larger amount of foliage. As shown in Figure 3 and Figure 5, the larger trees were more sensitive to the level of competition than the smaller trees in our study, which was similar to the study of Yu et al. (2009) [55]. Foliage biomass is concentrated vertically in the central part of the crown, but the annual shoot foliage biomass is much more sensitive to competition than the branch foliage biomass at the branch level [12]. This may be the reason why the competition variable showed a larger effect than the foliage biomass at the annual shoot level [56,57]. In our study, we also observed that relative distance to crown contact (HRCC) also had an effect on the foliage biomass of Korean pines, and this is consistent with the results of Goudie et al. (2016) [12] and Meng et al. (2006) [58].
Foliage display within the crown is critical to photosynthesis and thus the tree growth potential. Therefore, we developed the foliage biomass model within the crown at both branch level and annual shoot level for the native tree species of Korean pine in northeast China. The crown structure of individual trees strongly determines how foliage is arranged [12]. The purpose of developing foliage biomass distribution models is to determine what factors are important for determining tree and stand photosynthetic potential. Lots of forest management activities directly or indirectly affect crown structure and foliage biomass distribution [57]. Understanding how forest management activities affect foliage biomass distribution at different levels is especially useful in the evaluation of different silvicultural systems [58]. For instance, pruning to remove lower branches is an activity decreasing the size of the knotty core and restricting the development of loose knots. In addition, pruning activity changes the foliage biomass distribution within the crown. Therefore, quantifying the effects of different factors on foliage biomass distribution will provide a reference to determine the pruning height of individual trees. In addition, detailed knowledge of branch and foliage biomass allocation patterns will also be extremely useful in evaluating the effect of deploying such species in more mixed silvicultural settings in the future. However, our model did not take foliage attributes such as needle angle inclination into consideration, which may also show a large impact on the foliage biomass, though further study will be required to elucidate this.

5. Conclusions

The distribution of foliage biomass at the branch level and annual shoot level was studied for planted Korean pine in northeast China. The Ra2 of the foliage biomass distribution models at branch level and annual shoot level was 0.85 and 0.53, respectively. The mean observed peak of the foliage biomass distribution was 0.63. The foliage biomass at the branch level increased with increasing relative depth into the crown from the tree tip. The peak of the foliage biomass distribution shifted to the tree tip with increasing tree age. The power function, including branch diameter, branch length, branch age, height to crown contact, crown ratio, diameter at breast height, and competition variables, showed excellent performance in modeling branch foliage at the branch level. The relative foliage density per annual shoot (FDRs) over the relative distance from the base of the leader shifted higher in the crown with the age of individual trees. The final model included DBH, branch diameter, branch age, crown ratio, and competition variables. The foliage biomass model developed at the branch level and annual shoot level showed good performance and was successful in reflecting the effects of competition status on tree foliar biomass allocation. The present study provides a reference for forest management decision making, for instance, the pruning intensity determination for individual trees. This approach to quantifying foliage allocation patterns in relation to tree and stand competition indices will be invaluable for quantifying the effects of alternative silvicultural approaches (e.g., changes in thinning intensity) on stand production, carbon stocks, and other ecosystem services.

Author Contributions

Conceptualization, H.G.; Formal analysis, H.G.; Funding acquisition, H.G.; Investigation, J.F., Y.H. and Y.S.; Methodology, H.G.; Project administration, J.F., D.C. and G.D.; Writing—original draft, H.G. All authors have read and agreed to the published version of the manuscript.

Funding

This study was financed by National Key Research and Development Program of China (2022YFD2201800-02), the start-up funds for postdoctoral research from Shenyang Agricultural University (770221030), and the start-up funds for postdoctoral research from Shenyang Agricultural University (X2021036). The authors are grateful to the students who contributed to our field investigation.

Data Availability Statement

Not applicable.

Acknowledgments

We would like to thank Dabiangou Forest Farm and its staff for their help in the field activities. We would also like to thank all anonymous reviewers for their valuable suggestions.

Conflicts of Interest

The authors declare no conflict of interest.

References

  1. Porté, A.; Bosc, A.; Champion, I.; Loustau, D. Estimating the foliage area of Maritime pine (Pinus pinaster Aït.) branches and crowns with application to modelling the foliage area distribution in the crown. Ann. For. Sci. 2000, 57, 73–86. [Google Scholar] [CrossRef]
  2. Han, Q.; Kabeya, D.; Saito, S.; Araki, M.G.; Kawasaki, T.; Migita, C.; Chiba, Y. Thinning alters crown dynamics and biomass increment within aboveground tissues in young stand of Chamaecyparis obtusa. J. For. Res. 2014, 19, 184–193. [Google Scholar] [CrossRef]
  3. Forrester, D.I.; Medhurst, J.L.; Wood, M.; Beadle, C.L.; Valencia, J.C. Growth and physiological responses to silviculture for producing solid-wood products from Eucalyptus plantations: An Australian perspective. For. Ecol. Manag. 2010, 259, 1819–1835. [Google Scholar] [CrossRef]
  4. Horn, H.S. The Adaptive Geometry of Trees; Princeton University Press: Princeton, NJ, USA, 1971. [Google Scholar]
  5. Tahvanainen, T.; Forss, E. Individual tree models for the crown biomass distribution of Scots pine, Norway spruce and birch in Finland. For. Ecol. Manag. 2008, 255, 455–467. [Google Scholar] [CrossRef]
  6. Uria-Diez, J.; Pommerening, A. Crown plasticity in Scots pine (Pinus sylvestris L.) as a strategy of adaptation to competition and environmental factors. Ecol. Model. 2017, 356, 117–126. [Google Scholar] [CrossRef]
  7. DeRose, R.; Seymour, R.S. Patterns of leaf area index during stand development in even-aged balsam fir-red spruce stands. Can. J. For. Res. 2010, 40, 629–637. [Google Scholar] [CrossRef]
  8. Weiskittel, A.R.; Kershaw, J.A., Jr.; Hofmeyer, P.V.; Seymour, R.S. Species differences in total and vertical distribution of branch- and tree-level leaf area for the five primary conifer species in Maine, USA. For. Ecol. Manag. 2009, 258, 1695–1703. [Google Scholar] [CrossRef]
  9. Lintunen, A.; Sievänen, R.; Kaitaniemi, P.; Perttunen, J. Models of 3D crown structure for Scots pine (Pinus sylvestris) and silver birch (Betula pendula) grown in mixed forest. Can. J. For. Res. 2011, 41, 1779–1794. [Google Scholar] [CrossRef]
  10. Ford, E.D. The dynamic relationship between plant architecture and competition. Front. Plant Sci. 2014, 5, 275. [Google Scholar] [CrossRef]
  11. Power, H.; Schneider, R.; Berninger, F. Understanding changes in black (Picea marina) and white spruce (Picea glauca) foliage biomass and leaf area characteristics. Trees 2014, 28, 345–357. [Google Scholar] [CrossRef]
  12. Goudie, G.W.; Parish, R.; Antos, J.A. Foliage biomass and specific leaf area equations at the branch, annual shoot and whole-tree levels for lodgepole pine and white spruce in British Columbia. For. Ecol. Manag. 2016, 361, 286–297. [Google Scholar] [CrossRef]
  13. Schneider, R.; Fortin, M.; Ung, C.H.; Swift, D.E.; Zhang, S.Y. Modeling Jack Pine (Pinus banksiana) foliage density distribution. For. Sci. 2011, 57, 180–188. [Google Scholar]
  14. Shinozaki, K.; Yoda, K.; Hozumi, K.; Kira, T. A quantitative analysis of plant form: The pipe model theory. I. Basic analyses. Jpn. J. Ecol. 1964, 14, 97–105. [Google Scholar]
  15. Wang, Y.P.; Jarvis, P.G. Influence of shoot structure on the photosynthesis of Sitka spruce (Picea sitchensis). Funct. Ecol. 1993, 7, 433–451. [Google Scholar] [CrossRef]
  16. Baldwin, V.C., Jr.; Peterson, K.D.; Burkhart, H.E.; Amateis, R.L.; Dougherty, P.M. Equations for estimating loblolly pine branch and foliage weight and surface area distributions. Can. J. For. Res. 1997, 27, 918–927. [Google Scholar] [CrossRef]
  17. Santos, V.A.H.F.; Ferreira, M.J. Are photosynthetic leaf traits related to the first-year growth of tropical tree seedlings? A light-induced plasticity test in a secondary forest enrichment planting. For. Ecol. Manag. 2020, 460, 117900. [Google Scholar] [CrossRef]
  18. Albaugh, T.J.; Maier, C.A.; Campoe, O.C.; Yáñez, M.A.; Carbaugh, E.D.; Carter, D.R.; Cook, R.L.; Rubilar, R.A.; Fox, T.R. Crown architecture, crown leaf area distribution, and individual tree growth efficiency vary across site, genetic entry, and planting density. Trees 2020, 34, 73–88. [Google Scholar] [CrossRef]
  19. Brinkhoff, R.; Mendham, D.; Hunt, M.; Unwin, G.; Hovenden, M. Nitrogen fertiliser only increases leaf area in the lower crown of mid-rotation Eucalyptus nitens plantations. For. Ecol. Manag. 2022, 508, 120048. [Google Scholar] [CrossRef]
  20. Adji, B.I.; Akaffou, D.S.; Kouassi, K.H.; Houphouet, Y.P.; Reffye, P.D.; Duminil, J.; Jaeger, M.; Sabatier, S. Allometric models for non-destructive estimation of dry biomass and leaf area in Khaya senegalensis (Desr.) A. Juss., 1830 (Meliaceae), Pterocarpus erinaceus Poir., 1804 (Fabaceae) and Parkia biglobosa, Jack, R. Br., 1830 (Fabaceae). Trees 2021, 35, 1905–1920. [Google Scholar] [CrossRef]
  21. Lin, S.; Niklas, K.J.; Wan, Y.; Holscher, D.; Hui, C.; Ding, Y.; Shi, P. Leaf shape influences the scaling of leaf dry mass vs. area: A test case using bamboos. Ann. For. Sci. 2020, 77, 11. [Google Scholar] [CrossRef]
  22. Weiskittel, A.R.; Temesgen, H.; Wilson, D.S.; Maguire, D.A. Sources of within and between-stand variability in specific leaf area of three ecologically distinct conifer species. Ann. For. Sci. 2020, 65, 103. [Google Scholar] [CrossRef]
  23. Xu, M.; Harrington, T.B. Foliage biomass distribution of loblolly pine as affected by tree dominance, crown size, and stand characteristics. Can. J. For. Res. 1998, 28, 887–892. [Google Scholar] [CrossRef]
  24. Longuetaud, F.; Seifert, T.; Leban, J.-M.; Pretzsch, H. Analysis of long-term dynamics of crowns of sessile oaks at the stand level by means of spatial statistics. For. Ecol. Manag. 2008, 255, 2007–2019. [Google Scholar] [CrossRef]
  25. Mäkelä, A.; Valentine, H.T. Crown ratio influences allometric scaling in trees. Ecology 2006, 87, 2967–2972. [Google Scholar] [CrossRef]
  26. Pretzsch, H. Tree growth as affected by stem and crown structure. Trees 2021, 35, 947–960. [Google Scholar] [CrossRef]
  27. Antos, J.A.; Parish, R.; Nigh, G.D. Effects of neighbours on crown length of Abies lasiocarpa and Picea engelmannii in two old growth stands in British Columbia. Can. J. For. Res. 2020, 40, 638–647. [Google Scholar] [CrossRef]
  28. Seleznyova, A.N.; Greer, D.H. Effects of temperature and leaf position on leaf area expansion of Kiwifruit (Actinidia deliciosa) shoots: Development of a modeling framework. Ann. Bot. 2001, 88, 605–615. [Google Scholar] [CrossRef]
  29. Brisson, J. Neighborhood competition and crown asymmetry in Acer saccharum. Can. J. For. Res. 2001, 31, 2151–2159. [Google Scholar] [CrossRef]
  30. Schneider, R.; Berninger, F.; Ung, C.H.; Mäkelä, A.; Swift, D.E.; Zhang, S.Y. Within crown variation in the relationship between foliage biomass and sapwood area in Jack pine. Tree Physiol. 2011, 31, 22–29. [Google Scholar] [CrossRef]
  31. Linnell Nemec, A.F.; Parish, R.; Goudie, J.W. Modelling number, vertical distribution, and size of live branches on coniferous tree species in British Columbia. Can. J. For. Res. 2012, 42, 1072–1090. [Google Scholar] [CrossRef]
  32. Gao, H.L.; Bi, H.Q.; Li, F.R. Modelling conifer crown profiles as nonlinear conditional quantiles: An example with planted Korean pine in northeast China. For. Ecol. Manag. 2017, 398, 101–115. [Google Scholar] [CrossRef]
  33. Piao, Z.; Tang, L.; Swihart, R.K.; Wang, S. Human–wildlife competition for Korean pine seeds: Vertebrate responses and implications for mixed forests on Changbai Mountain, China. Ann. For. Sci. 2011, 68, 911–919. [Google Scholar] [CrossRef]
  34. Schabenberger, O.; Pierce, F.J. Contemporary Statistical Models for the Plant and Soil Sciences; CRC Press: Boca Raton, FL, USA, 2002; 738p. [Google Scholar]
  35. Wang, Y.P.; Jarvis, P.G.; Benson, M.L. Two-dimensional needle-area density distribution within the crowns of Pinus radiata. For. Ecol. Manag. 1990, 32, 217–237. [Google Scholar] [CrossRef]
  36. Sun, Y.X.; Feng, J.; Chen, D.S.; Gao, H.L.; Zou, H.T. Developing crown shape model considering a novel competition index—A case for Korean pine plantation in northeast China. Can. J. For. Res. 2022, 52, 1128–1139. [Google Scholar] [CrossRef]
  37. Ledermann, T. A non-linear model to predict crown recession of Norway spruce (Picea abies [L.] Karst.) in Austria. Eur. J. For. Res. 2011, 130, 521–531. [Google Scholar] [CrossRef]
  38. Kahriman, A.; Şahin, A.; Sönmez, T.; Yavuz, M. A novel approach to selecting a competition index: The effect of competition on individual tree diameter growth of Calabrian pine. Can. J. For. Res. 2018, 48, 1217–1226. [Google Scholar] [CrossRef]
  39. Pinheiro, J.C.; Bates, D.M. Mixed-Effects Models in S and S-Plus; Springer: New York, NY, USA, 2000. [Google Scholar]
  40. Pinheiro, J.; Bates, D.; DebRoy, S.; Sarkar, D. nlme: Linear and Nonlinear Mixed Effects Models. R Package Version 3.1-160. 2000. Available online: http://CRAN.R-project.org/package=nlme (accessed on 10 October 2022).
  41. R Core Team. R: A Language and Environment for Statistical Computing; R Foundation for Statistical Computing: Vienna, Austria, 2019; Available online: https://www.R-project.org/ (accessed on 15 November 2019).
  42. Rayachhetry, M.B.; Van, T.K.; Center, T.D.; Laroche, F. Dry weight estimation of the aboveground components of Melaleuca quinquenervia trees in southern Florida. For. Ecol. Manag. 2001, 142, 281–290. [Google Scholar] [CrossRef]
  43. Xiao, C.W.; Ceulemans, R. Allometric relationships for below- and aboveground biomass of young Scots pines. For. Ecol. Manag. 2004, 203, 177–186. [Google Scholar] [CrossRef]
  44. Stenberg, P.; Kuuluvainen, T.; Kellomaki, S.; Grace, J.; Jokela, E.J.; Gholz, H.L. Crown structure, light interception and productivity of pine trees and stands. Ecol. Bull. 1994, 43, 20–34. [Google Scholar]
  45. Ishii, H.; Wilson, M.E. Crown structure of old-growth Douglas-fir in the western Cascade range, Washington. Can. J. For. Res. 2001, 31, 1250–1261. [Google Scholar] [CrossRef]
  46. Maguire, D.A.; Bennett, W.S. Patterns in vertical distribution of foliage in young coastal Douglas-fir. Can. J. For. Res. 1996, 26, 1991–2005. [Google Scholar] [CrossRef]
  47. Sternberg, M.; Shoshany, M. Aboveground biomass allocation and water content relationships in Mediterranean trees and shrubs in two climatological regions in Israel. Plant Ecol. 2001, 157, 171–179. [Google Scholar] [CrossRef]
  48. Mäkelä, A.; Vanninen, P. Vertical structure of Scots pine crowns in different age and size classes. Trees 2001, 15, 385–392. [Google Scholar] [CrossRef]
  49. Leroy, C.; Saint-Andre, L.; Auclair, D. Practical methods for nondestructive measurement of tree leaf area. Agrofor. Syst. 2007, 71, 99–108. [Google Scholar] [CrossRef]
  50. Fourcaud, T.; Zhang, X.P.; Stokes, A.; Lambers, H.; Koerner, C. Plant growth modelling and applications: The increasing importance of plant architecture in growth models. Ann. Bot. 2008, 101, 1053–1063. [Google Scholar] [CrossRef]
  51. Bascietto, M.; De Cinti, B.; Matteucci, G.; Cescatti, A. Biometric assessment of aboveground carbon pools and fluxes in three European forests by randomized branch sampling. For. Ecol. Manag. 2012, 267, 172–181. [Google Scholar] [CrossRef]
  52. Helmisaari, H.S.; Makkonen, K.; Kellomäki, S.; Valtonen, E.; Mälkönen, E. Below- and above-ground biomass, production and nitrogen use in Scots pine stands in eastern Finland. For. Ecol. Manag. 2002, 165, 317–326. [Google Scholar] [CrossRef]
  53. Garber, S.M.; Maguire, D.A. The response of vertical foliage distribution to spacing and species composition in mixed conifer stands in central Oregon. For. Ecol. Manag. 2005, 211, 341–355. [Google Scholar] [CrossRef]
  54. Gspaltl, M.; Bauerle, W.; Binkley, D.; Sterba, H. Leaf area and light use efficiency patterns of Norway spruce under different thinning regimes and age classes. For. Ecol. Manag. 2011, 288, 49–59. [Google Scholar] [CrossRef]
  55. Yu, M.H.; Canham, C.D.; Peters, C.M. A neighborhood analysis: Effects of crowding on tree growth in a single-tree selectively logged forest. In Proceedings of the 94th ESA Annual Convention 2009, Albuqerque, NM, USA, 2–7 August 2009. [Google Scholar]
  56. Marshall, J.D.; Monserud, R.A. Foliage height influences specific leaf area of three conifer species. Can. J. For. Res. 2003, 33, 164–170. [Google Scholar] [CrossRef]
  57. Duursma, R.A.; Mäkelä, A.; Reid, D.E.B.; Jokela, E.J.; Portcb, A.J.; Roberts, S.D. Self-shading affects allometric scaling in trees. Funct. Ecol. 2010, 24, 723–730. [Google Scholar] [CrossRef]
  58. Meng, S.X.; Rudnicki, M.; Lieffers, V.J.; Reid, D.E.B.; Silins, U. Preventing crown collisions increases the crown cover and leaf area of maturing lodgepole pine. J. Ecol. 2006, 94, 681–686. [Google Scholar] [CrossRef]
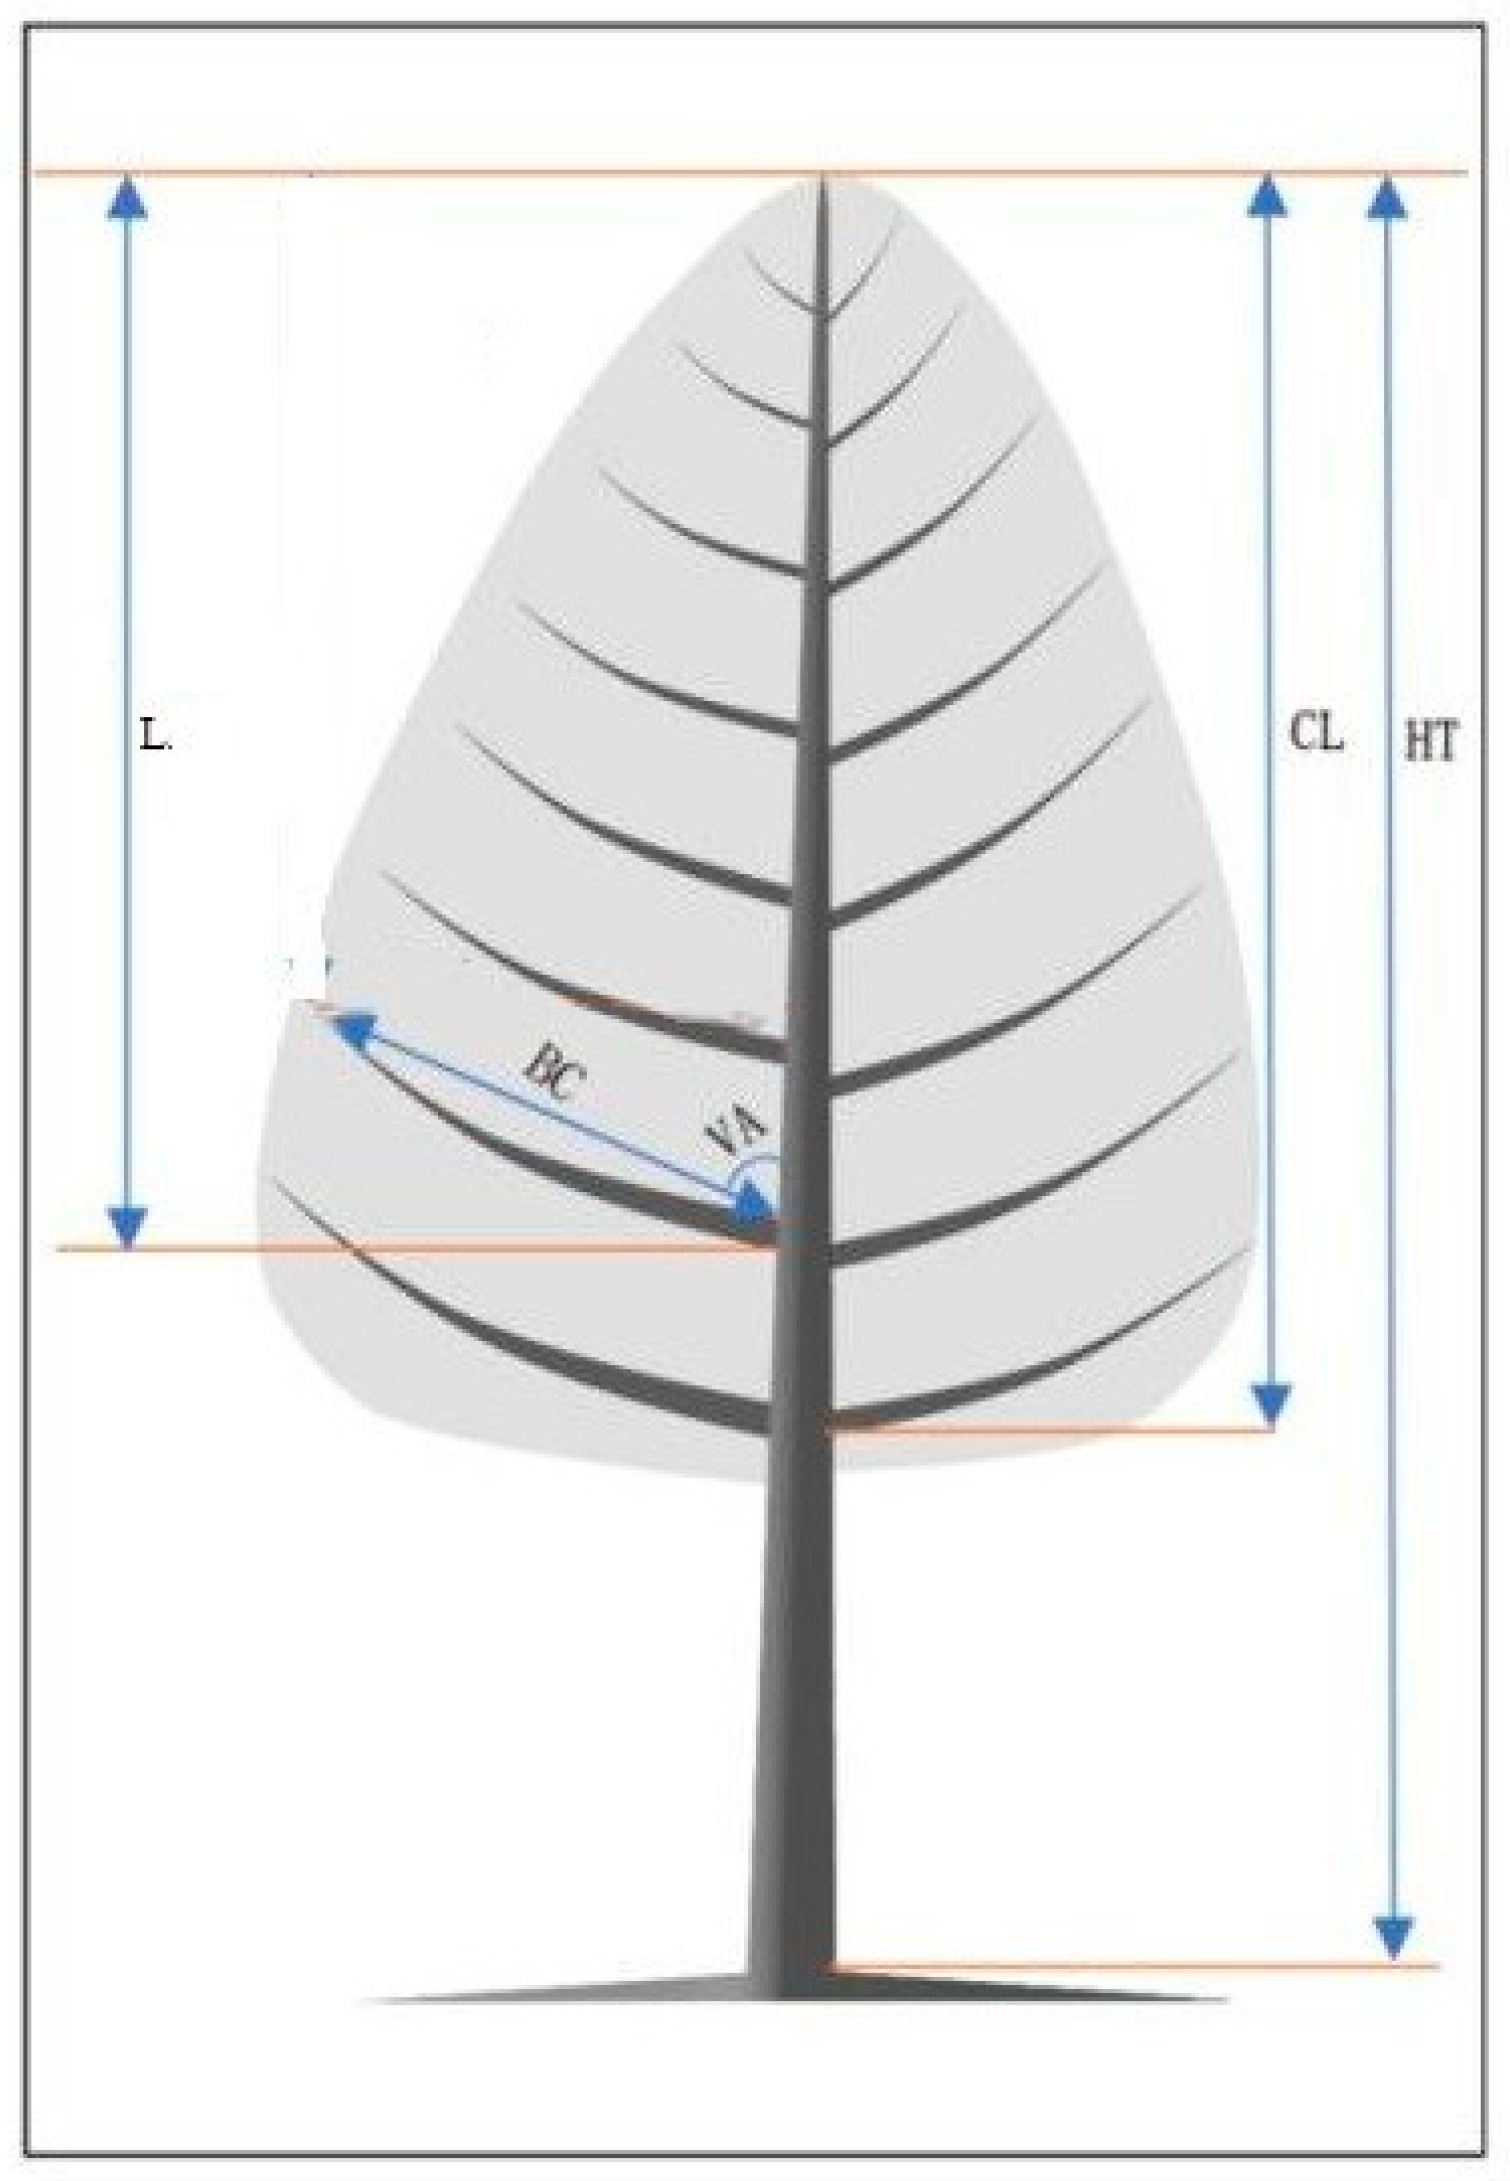
Figure 1. Graphic description for tree and branch variables.
Forests 14 01005 g001
Figure 2. Variations in foliage biomass distribution within the entire crown for individual planted Korean pine trees of different ages in northeast China.
Forests 14 01005 g002
Figure 3. Effect of competition on the foliage biomass distribution within the entire crown for three different planted Korean pine trees (For (A), age = 21 years, DBH = 18.7 cm, CL = 7.75 m; for (B), age = 40 years, DBH = 24.2 cm, CL = 7.63 m; for (C), age = 52 years, DBH = 29.5 cm, CL = 12.38 m).
Forests 14 01005 g003aForests 14 01005 g003b
Figure 4. Variations in relative foliage biomass density per annual shoot within the entire crown for individual planted Korean pine trees of different ages in northeast China.
Forests 14 01005 g004
Figure 5. Effect of competition on the variations in relative foliage biomass density per annual shoot within the entire crown for individual planted Korean pine trees of different ages in northeast China (For (A), age = 21 years, DBH = 18.7 cm, CL = 7.75 m; for (B), age = 40 years, DBH = 24.2 cm, CL = 7.63 m; for (C), age = 52 years, DBH = 29.5 cm, CL = 12.38 m).
Forests 14 01005 g005aForests 14 01005 g005b
Table 1. Summary of the descriptive statistics of stand age, quadratic mean diameter (Dg), dominant tree height (Hdom), density and crown width (CW) for the sample plots used to conduct the destructive tree sampling in Dabiangou (DBG) and Beisanjia forest farms (BSJ). Ns is the number of sample plots selected in each forest stand to conduct destructive tree sampling. Nt is the number of sample trees selected in each forest stand.
LocationStand Age (Year)NsNtDg (cm)Hdom (m)Density (Trees ha−1)CW (m)
DBG8391.82.219170.55
213913.811.418061.71
233912.911.512561.62
403923.616.87002.21
523931.720.73223.11
561335.121.02333.68
BSJ431325.316.26802.99
Table 2. Descriptive statistics for the attributes of 51 planted Korean pine trees (19 dominant trees, 16 intermediate trees, and 16 suppressed trees) from Dabiangou forest farm and Beisanjia forest farm in Liaoning Province, northeast China. DBH is the diameter at breast height, HT is the total tree height, HD is the ratio of HT and DBH, and CR is the ratio between crown length and HT. Std is the standard error of the mean for each variable.
Tree ClassStatisticsAge (Year)DBH (cm)HT (m)HDCR
Dominant
tree
Mean ± Std34 ± 1524.7 ± 11.712.8 ± 5.60.56 ± 0.110.69 ± 0.18
Min.83.52.50.450.46
Max.5643.120.20.841.02
Intermediate
tree
Mean ± Std33 ± 1619.4 ± 10.911.8 ± 5.80.68 ± 0.170.69 ± 0.15
Min82.02.10.500.44
Max5636.119.71.051.04
Suppressed
tree
Mean ± Std33 ± 1614.9 ± 9.110.7 ± 5.70.89 ± 0.360.65 ± 0.15
Min81.11.80.590.41
Max5629.518.61.810.93
Table 3. Description of potentially independent variables used in the foliage biomass distribution at the branch level and annual shoot level.
SymbolDefinitionMeasure
Branch level
LBRBranch lengthThe length of a natural stretch from bole pith to branch tip
BCBranch chord lengthThe length between the bole pith and branch tip
ABRBranch ageRing numbers at the branch base
HRCCRelative distance to crown contactRatio of distance between HT and branch base height to the distance between HT and crown contact height to the neighboring trees
LR1Relative distance down an annual shootDistance from the leader to the midpoint of the annual shoot divided by the distance between base of leader and height to base node
FDRsRelative annual shoot foliage densityRatio of annual shoot foliage density to the top of the first annual shoot below the live crown void of live branches
Tree level
DBHDiameter at the breast height
CRCrown ratioRatio of crown length and total tree height
HTTree height
FBFoliage biomassFoliage biomass for the specific branch
Competition
CI1Competition index 1Ratio of the diameter of the subject tree to the quadratic mean diameter
CI2Competition index 2Ratio of the basal area of the subject tree to the mean basal area of the stand
CI3Competition index 3Sum of the basal areas of those trees with a diameter greater than that of the subject tree
CI4Competition index 4Relating the stand density to the crown base of the subject tree and combines the horizontal and vertical competition effects
Table 4. Statistics of the foliage biomass of the total tree and annual shoots for the 51 planted Korean pine trees from Dabiangou forest farm and Beisanjia forest farm in Liaoning Province, northeast China. Q1 and Q3 are the 25% and 75% quantiles, respectively.
Tree StatusAttributesMeanStdMin.Max.
Dominant treeFoliage biomass per branch (g)282.9452.20.23861.3
Branch diameter (BD, mm)28.0718.832.2896.95
Branch length (BL, cm)215.4163.91.0760.0
Branch chord length (BC, mm)196.2148.51.0692.0
branch angle (VA, °)42183135
Intermediate treeFoliage biomass per branch (g)285.5612.10.13670.1
Branch diameter (BD, mm)22.9514.902.1777.01
Branch length (BL, cm)174.5131.41.0637.0
Branch chord length (BC, mm)161.5121.41.0601.0
branch angle (VA, °)37175130
Suppressed treeFoliage biomass per branch (g)137.1239.40.12122.9
Branch diameter (BD, mm)17.5012.201.3669.00
Branch length (BL, cm)140.0116.41.0682
Branch chord length (BC, mm)130.2107.91.0625
branch angle (VA,°)43205150
Table 5. Goodness-of-fit statistics for the foliage biomass distribution at the branch level and annual shoot level for planted Korean pine trees from Dabiangou forest farm and Beisanjia forest farm in Liaoning Province, northeast China.
ModelRandom EffectsVariance FunctionAIC−2loglikelihoodRMSERa2
Equation (7)u4 σ u 1 = 0.031244654450283.80.44
Equation (8)u2 σ b 2 = 0.0151393−371.40.310.28
Table 6. Parameter estimates for the foliage biomass distribution model at the branch level and annual shoot level for planted Korean pine trees from Dabiangou forest farm and Beisanjia forest farm in Liaoning Province, northeast China.
Equation (7)Equation (8)
ParameterEstimateStdpParameterEstimateStdp
a00.20960.06050.0006b00.84590.0580<0.0001
a12.04710.0712<0.0001b10.64390.0918<0.0001
a20.21100.08730.0158b21.65390.1006<0.0001
b35.61050.3341<0.0001
Disclaimer/Publisher’s Note: The statements, opinions and data contained in all publications are solely those of the individual author(s) and contributor(s) and not of MDPI and/or the editor(s). MDPI and/or the editor(s) disclaim responsibility for any injury to people or property resulting from any ideas, methods, instructions or products referred to in the content.