
Direct and Carry-Over Effects of Temperature Drive Height Increment of Scots Pine in the North-Eastern Baltic Sea Region

 ,
,  , , ,
, , , 
Abstract
1. Introduction
2. Material and Methods
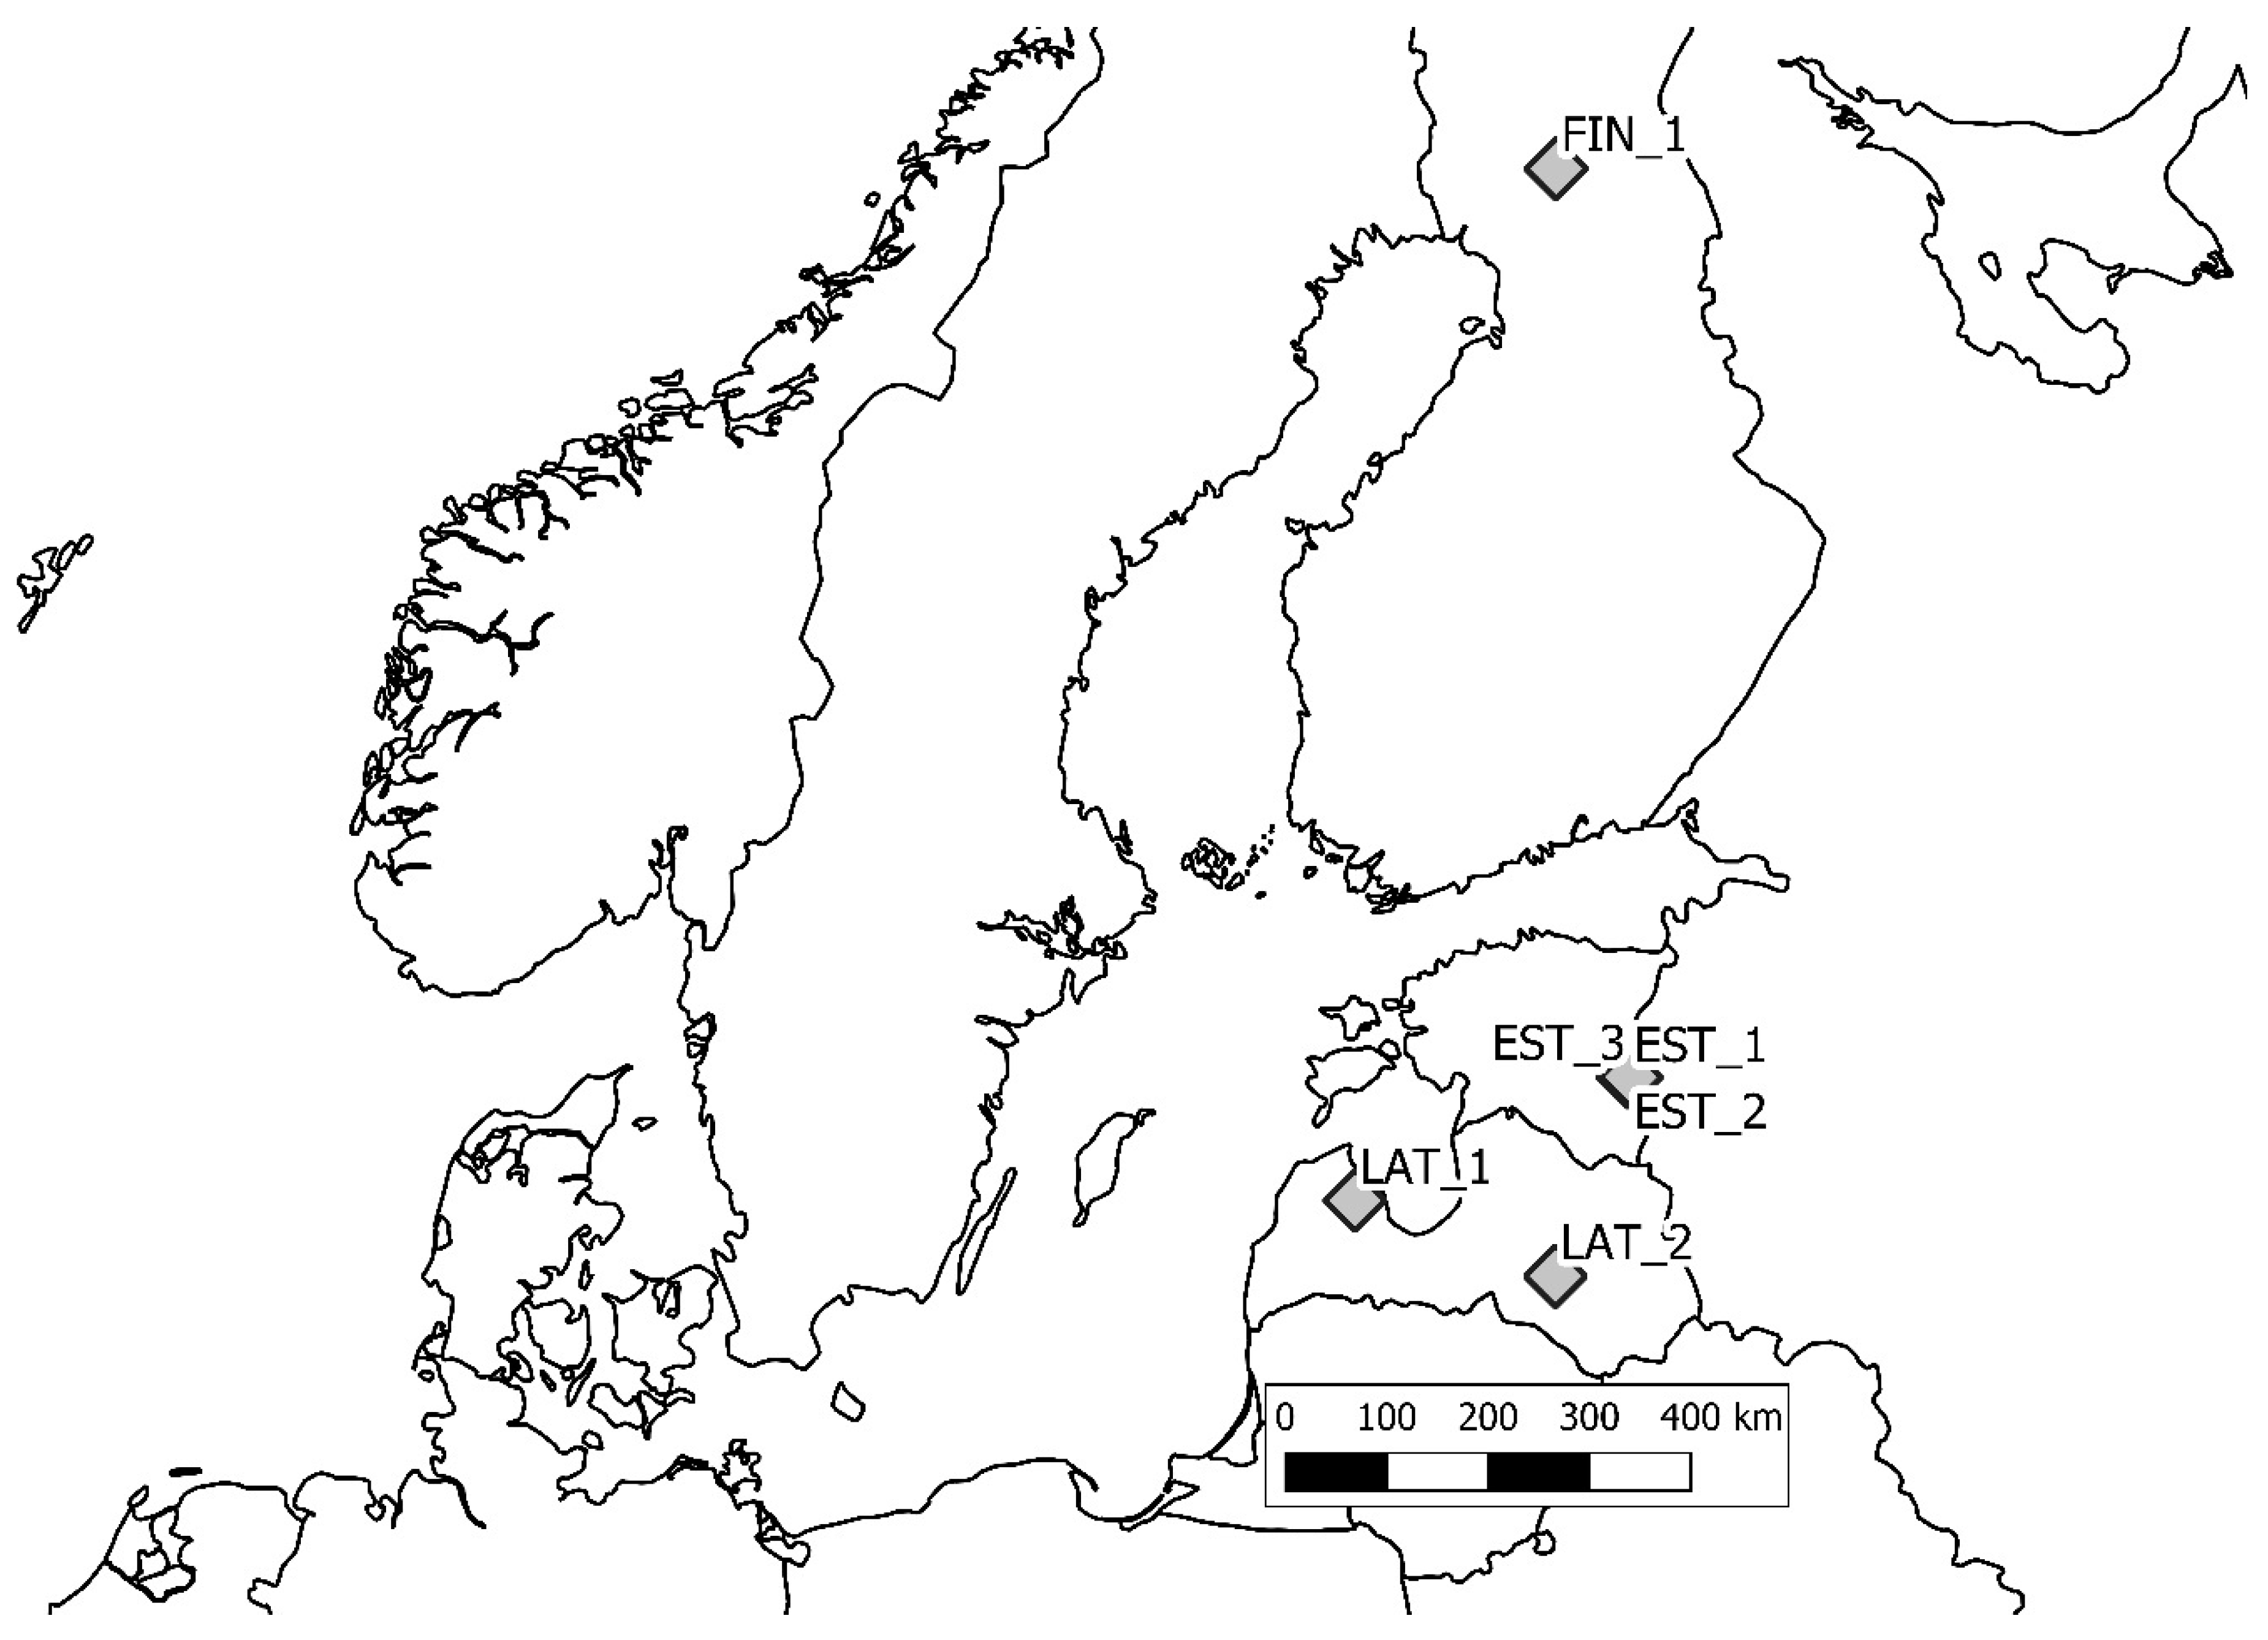
2.1. Dataset
2.2. Data Analysis
3. Results
4. Discussion
5. Conclusions
Author Contributions
Funding
Institutional Review Board Statement
Informed Consent Statement
Data Availability Statement
Acknowledgments
Conflicts of Interest
References
- Buras, A.; Menzel, A. Projecting tree species composition changes of European forests for 2061-2090 under RCP 4.5 and RCP 8.5 Scenarios. Front. Plant Sci. 2019, 9, N1986. [Google Scholar] [CrossRef] [PubMed]
- Isaac-Renton, M.; Montwe, D.; Hamann, A.; Spiecker, H.; Cherubini, P.; Treydte, K. Northern forest tree populations are physiologically maladapted to drought. Nat. Commun. 2018, 9, 5254. [Google Scholar] [CrossRef] [PubMed]
- Aitken, S.N.; Bemmels, J.B. Time to get moving: Assisted gene flow of forest trees. Evol. Appl. 2016, 9, 271–290. [Google Scholar] [CrossRef] [PubMed]
- Matisons, R.; Elferts, D.; Krišāns, O.; Schneck, V.; Gärtner, H.; Bast, A.; Wojda, T.; Kowalczyk, J.; Jansons, Ā. Non-linear regional weather-growth relationships indicate limited adaptability of the eastern Baltic Scots pine. For. Ecol. Manag. 2021, 479, N118600. [Google Scholar] [CrossRef]
- Matisons, R.; Elferts, D.; Krišāns, O.; Schneck, V.; Gärtner, H.; Wojda, T.; Kowalczyk, J.; Jansons, Ā. Nonlinear weather-growth relationships suggest disproportional growth changes of Norway spruce in the eastern Baltic region. Forests 2021, 12, 661. [Google Scholar] [CrossRef]
- Cavin, L.; Jump, A.S. Highest drought sensitivity and lowest resistance to growth suppression are found in the range core of the tree Fagus sylvatica L. not the equatorial range edge. Glob. Chang. Biol. 2017, 23, 362–379. [Google Scholar] [CrossRef]
- Huber, N.; Bugmann, H.; Cailleret, M.; Bircher, N.; Lafond, V. Stand-scale climate change impacts on forests over large areas: Transient responses and projection uncertainties. Ecol. Appl. 2021, 31, e02313. [Google Scholar] [CrossRef]
- Harvey, J.; Smiljanić, M.; Scharnweber, T.; Buras, A.; Cedro, A.; Cruz-García, R.; Drobyshev, I.; Janecka, K.; Jansons, Ā.; Kaczka, R.; et al. Tree growth influenced by warming winter climate and summer moisture availability in northern temperate forests. Glob. Chang. Biol. 2020, 26, 2505–2518. [Google Scholar] [CrossRef]
- Wilmking, M.; van der Maaten-Theunissen, M.; van der Maaten, E.; Scharnweber, T.; Buras, A.; Biermann, C.; Gurskaya, M.; Hallinger, M.; Lange, J.; Shetti, R.; et al. Global assessment of relationships between climate and tree growth. Glob. Chang. Biol. 2020, 26, 3212–3220. [Google Scholar] [CrossRef] [PubMed]
- Kalliokoski, T.; Mäkelä, A.; Fronzek, S.; Minunno, F.; Peltoniemi, M. Decomposing sources of uncertainty in climate change projections of boreal forest primary production. Agron. For. Meteorol. 2018, 262, 192–205. [Google Scholar] [CrossRef]
- Zhang, Z.; Babst, F.; Bellassen, V.; Frank, D.; Launois, T.; Tan, K.; Ciais, P.; Poulter, B. Converging climate sensitivities of European forests between observed radial tree growth and vegetation models. Ecosystems 2018, 21, 410–425. [Google Scholar] [CrossRef]
- Xu, K.; Wang, X.; Liang, P.; An, H.; Sun, H.; Han, W.; Li, Q. Tree-ring widths are good proxies of annual variation in forest productivity in temperate forests. Sci. Rep. 2017, 7, 1945. [Google Scholar] [CrossRef] [PubMed]
- Breed, M.F.; Harrison, P.A.; Bischoff, A.; Durruty, P.; Gellie, N.J.C.; Gonzales, E.K.; Havens, K.; Karmann, M.; Kilkenny, F.F.; Krauss, S.L.; et al. Priority actions to improve provenance decision-making. BioScience 2018, 68, 510–516. [Google Scholar] [CrossRef]
- Housset, J.M.; Nadeau, S.; Isabel, N.; Depardieu, C.; Duchesne, I.; Lenz, P.; Girardin, M.P. Tree rings provide a new class of phenotypes for genetic associations that foster insights into adaptation of conifers to climate change. New Phytol. 2018, 218, 630–645. [Google Scholar] [CrossRef]
- Salminen, H.; Jalkanen, R. Modelling the effect of temperature on height increment of Scots pine at high latitudes. Silva Fenn. 2005, 39, 497–508. [Google Scholar] [CrossRef]
- Mäkinen, H.; Jyske, T.; Nöjd, P. Dynamics of diameter and height increment of Norway spruce and Scots pine in southern Finland. Ann. For. Sci. 2018, 75, N28. [Google Scholar] [CrossRef]
- Jansons, Ā.; Matisons, R.; Zadiņa, M.; Sisenis, L.; Jansons, J. The effect of climatic factors on height increment of Scots pine in sites differing by continentality in Latvia. Silva Fenn. 2015, 49, N1262. [Google Scholar] [CrossRef]
- Salminen, H.; Jalkanen, R. Intra-annual height increment of Pinus sylvestris at high latitudes in Finland. Tree Physiol. 2007, 27, 1347–1353. [Google Scholar] [CrossRef]
- Kellomäki, S.; Ikonen, V.P.; Peltola, H.; Kolström, T. Modelling the structural growth of Scots pine with implications for wood quality. Ecol. Model. 1999, 122, 117–134. [Google Scholar] [CrossRef]
- Loehle, C. Height growth rate tradeoffs determine northern and southern range limits for trees. J. Biogeogr. 1998, 25, 735–742. [Google Scholar] [CrossRef]
- Metslaid, S.; Sims, A.; Kangur, A.; Hordo, M.; Jogiste, K.; Kiviste, A.; Hari, P. Growth patterns from different forest generations of Scots pine in Estonia. J. For. Res. 2011, 16, 237–243. [Google Scholar] [CrossRef]
- Mäkinen, H. The suitability of height and radial increment variation in Pinus sylvestris (L.) for expressing environmental signals. For. Ecol. Manag. 1998, 112, 191–197. [Google Scholar] [CrossRef]
- Nunes, L.; Patricio, M.; Tome, J.; Tome, M. Modeling dominant height growth of maritime pine in Portugal using GADA methodology with parameters depending on soil and climate variables. Ann. For. Sci. 2011, 68, 311–323. [Google Scholar] [CrossRef]
- Pensa, M.; Salminen, H.; Jalkanen, R. A 250-year-long height-increment chronology for Pinus sylvestris at the northern coniferous timberline: A novel tool for reconstructing past summer temperatures? Dendrochronologia 2005, 22, 75–81. [Google Scholar] [CrossRef]
- Reich, P.B.; Oleksyn, J. Climate warming will reduce growth and survival of Scots pine except in the far north. Ecol. Lett. 2008, 11, 588–597. [Google Scholar] [CrossRef]
- Nabais, C.; Hansen, J.K.; David-Schwartz, R.; Klisz, M.; López, R.; Rozenberg, P. The effect of climate on wood density: What provenance trials tell us? For. Ecol. Manag. 2018, 408, 148–156. [Google Scholar] [CrossRef]
- Moran, E.; Lauder, J.; Musser, C.; Stathos, A.; Shu, M. The genetics of drought tolerance in conifers. New Phytol. 2017, 216, 1034–1048. [Google Scholar] [CrossRef]
- Way, D.A.; Oren, R. Differential responses to changes in growth temperature between trees from different functional groups and biomes: A review and synthesis of data. Tree Physiol. 2010, 30, 669–688. [Google Scholar] [CrossRef]
- Nabuurs, G.J.; Verkerk, P.J.; Schelhaas, M.J.; González Olabarria, J.R.; Trasobares, A.; Cienciala, E. Climate-Smart Forestry: Mitigation Impacts in Three European Regions. European Forest Institute. 2018. Available online: https://www.efi.int/sites/default/files/files/publication-bank/2018/efi_fstp_6_2018.pdf (accessed on 15 February 2020).
- Jansons, Ā.; Matisons, R.; Baumanis, I.; Puriņa, L. Effect of climatic factors on height increment of Scots pine in experimental plantation in Kalsnava, Latvia. For. Ecol. Manag. 2013, 306, 185–191. [Google Scholar] [CrossRef]
- Oleksyn, J.; Reich, P.B.; Tjoelker, M.G.; Chalupka, W. Biogeographic differences in shoot elongation pattern among European Scots pine populations. For. Ecol. Manag. 2001, 148, 207–220. [Google Scholar] [CrossRef]
- Lanner, R.M. Patterns of shoot development in Pinus and their relationship to growth potential. In Tree Physiology and Yield Improvement; Cannell, M.G.R., Last, F.T., Eds.; Academic Press: London, UK, 1976; pp. 223–243. [Google Scholar]
- Lanner, R.M. On the insensitivity of height growth to spacing. For. Ecol. Manag. 1985, 13, 143–148. [Google Scholar] [CrossRef]
- Friedrichs, D.A.; Büntgen, U.; Frank, D.C.; Esper, J.; Neuwirth, B.; Löffler, J. Complex climate controls on 20th century oak growth in Central-West Germany. Tree Physiol. 2009, 29, 39–51. [Google Scholar] [CrossRef] [PubMed]
- Allen, C.D.; Breshears, D.D.; McDowell, N.G. On underestimation of global vulnerability to tree mortality and forest die-off from hotter drought in the Anthropocene. Ecosphere 2015, 6, 1–55. [Google Scholar] [CrossRef]
- Choat, B.; Jansen, S.; Brodribb, T.J.; Cochard, H.; Delzon, S.; Bhaskar, R.; Bucci, S.J.; Feild, T.S.; Gleason, S.M.; Hacke, U.G.; et al. Global convergence in the vulnerability of forests to drought. Nature 2012, 491, 752–755. [Google Scholar] [CrossRef]
- Lloyd, A.H.; Duffy, P.A.; Mann, D.H. Nonlinear responses of white spruce growth to climate variability in interior Alaska. Can. J. For. Res. 2013, 43, 331–343. [Google Scholar] [CrossRef]
- Lloyd, A.H.; Bunn, A.G.; Berner, L. A latitudinal gradient in tree growth response to climate warming in the Siberian taiga. Glob. Chang. Biol. 2011, 17, 1935–1945. [Google Scholar] [CrossRef]
- Fei, S.; Desprez, J.M.; Potter, K.M.; Jo, I.; Knott, J.A.; Oswalt, C.M. Divergence of species responses to climate change. Sci. Adv. 2017, 3, e1603055. [Google Scholar] [CrossRef]
- Meier, H.E.M.; Kniebusch, M.; Dieterich, C.; Gröger, M.; Zorita, E.; Elmgren, R.; Myrberg, K.; Ahola, M.P.; Bartosova, A.; Bonsdorff, E.; et al. Climate change in the Baltic Sea region: A summary. Earth Syst. Dynam. Discuss. 2022, 13, 457–593. [Google Scholar] [CrossRef]
- Harris, I.; Osborn, T.J.; Jones, P.; Lister, D. Version 4 of the CRU TS monthly high-resolution gridded multivariate climate dataset. Sci. Data 2020, 7, 109. [Google Scholar] [CrossRef]
- Vicente-Serrano, S.M.; Begueria, S.; Lopez-Moreno, J.I. A multiscalar drought index sensitive to global warming: The standardized precipitation evapotranspiration index—SPEI. J. Clim. 2010, 23, 1696–1718. [Google Scholar] [CrossRef]
- Lanner, R.M. Development of the terminal bud and shoot of slash pine saplings. For. Sci. 1978, 24, 167–179. [Google Scholar]
- Holmes, R. Computer-assisted quality control in tree-ring dating and measurement. Tree-Ring Bull. 1983, 43, 69–78. [Google Scholar]
- Cook, E.R. The decomposition of tree-ring series for environmental studies. Tree-Ring Bull. 1987, 47, 37–59. [Google Scholar]
- Bunn, A.G. A dendrochronology program library in R (dplR). Dendrochronologia 2008, 26, 115–124. [Google Scholar] [CrossRef]
- Wigley, T.M.L.; Briffa, K.R.; Jones, P.D. On the average value of correlated time series, with applications in dendroclimatology and hydrometeorology. J. Clim. Appl. Meteorol. 1984, 23, 201–213. [Google Scholar] [CrossRef]
- Zang, C.; Biondi, F. treeclim: An R package for the numerical calibration of proxy-climate relationships. Ecography 2015, 38, 431–436. [Google Scholar] [CrossRef]
- Wood, S.N. Fast stable restricted maximum likelihood and marginal likelihood estimation of semiparametric generalized linear models. J. R. Stat. Soc. B 2011, 73, 3–36. [Google Scholar] [CrossRef]
- R Core Team. R: A Language and Environment for Statistical Computing; R Foundation for Statistical Computing: Vienna, Austria. 2022. Available online: https://www.R-project.org/ (accessed on 26 October 2022).
- von Arx, G.; Arzac, A.; Fonti, P.; Frank, D.; Zweifel, R.; Rigling, A.; Galiano, L.; Gessler, A.; Olano, J.M. Responses of sapwood ray parenchyma and non-structural carbohydrates of Pinus sylvestris to drought and long-term irrigation. Funct. Ecol. 2017, 31, 1371–1382. [Google Scholar] [CrossRef]
- Restaino, C.M.; Peterson, D.L.; Littell, J. Increased water deficit decreases Douglas fir growth throughout western US forests. Proc. Nat. Acad. Sci. USA 2016, 113, 9557–9562. [Google Scholar] [CrossRef]
- Prendin, A.L.; Mayr, S.; Beikircher, B.; von Arx, G.; Petit, G. Xylem anatomical adjustments prioritize hydraulic efficiency over safety as Norway spruce trees grow taller. Tree Physiol. 2018, 38, 1088–1097. [Google Scholar] [CrossRef]
- Buras, A.; Schunk, C.; Zeiträg, C.; Herrmann, C.; Kaiser, L.; Lemme, H.; Straub, C.; Taeger, S.; Gößwein, S.; Klemmt, H.-J.; et al. Are Scots pine forest edges particularly prone to drought-induced mortality? Environ. Res. Lett. 2018, 13, N025001. [Google Scholar] [CrossRef]
- Hacket-Pain, A.; Ascoli, D.; Berretti, R.; Mencuccini, M.; Motta, R.; Nola, P.; Piussi, P.; Ruffinatto, F.; Vacchiano, G. Temperature and masting control Norway spruce growth, but with high individual tree variability. For. Ecol. Manag. 2019, 438, 142–150. [Google Scholar] [CrossRef]
- Lloret, F.; Keeling, E.G.; Sala, A. Components of tree resilience: Effects of successive low-growth episodes in old ponderosa pine forests. Oikos 2011, 120, 1909–1920. [Google Scholar] [CrossRef]
- Billings, S.A.; Glaser, S.M.; Boone, A.S.; Stephen, F.M. Nonlinear tree growth dynamics predict resilience to disturbance. Ecosphere 2015, 6, 1–13. [Google Scholar] [CrossRef]
- Kottek, M.; Grieser, J.; Beck, C.; Rudolf, B.; Rubel, F. World map of the Köppen-Geiger climate classification updated. Meteorol. Z. 2006, 15, 259–263. [Google Scholar] [CrossRef]
- Henttonen, H.M.; Mäkinen, H.; Heiskanen, J.; Peltoniemi, M.; Lauren, A.; Hordo, M. Response of radial increment variation of Scots pine to temperature, precipitation and soil water content along a latitudinal gradient across Finland and Estonia. Agric. For. Meteorol. 2014, 198, 294–308. [Google Scholar] [CrossRef]
- Beck, E.H.; Heim, R.; Hansen, J. Plant resistance to cold stress: Mechanisms and environmental signals triggering frost hardening and dehardening. J. Biosci. 2004, 29, 449–459. [Google Scholar] [CrossRef]
- Ögren, E. Relationship between temperature, respiratory loss of sugar and premature dehardening in dormant Scots pine seedlings. Tree Physiol. 1997, 17, 47–51. [Google Scholar] [CrossRef]
- Jyske, T.; Mäkinen, H.; Kalliokoski, T.; Nöjd, P. Intra-annual tracheid production of Norway spruce and Scots pine across a latitudinal gradient in Finland. Agron. For. Meteorol. 2014, 194, 241–254. [Google Scholar] [CrossRef]
- Cuny, H.E.; Fonti, P.; Rathgeber, C.B.; von Arx, G.; Peters, R.L.; Frank, D.C. Couplings in cell differentiation kinetics mitigate air temperature influence on conifer wood anatomy. Plant Cell Environ. 2019, 4, 1222–1232. [Google Scholar] [CrossRef]
- White, M.A.; Running, S.W.; Thornton, P.E. The impact of growing-season length variability on carbon assimilation and evapotranspiration over 88 years in the eastern US deciduous forest. Int. J. Biometeorol. 1999, 42, 139–145. [Google Scholar] [CrossRef] [PubMed]
- Pensa, M.; Sepp, M.; Jalkanen, R. Connections between climatic variables and the growth and needle dynamics of Scots pine (Pinus sylvestris L.) in Estonia and Lapland. Int. J. Biometeorol. 2006, 50, 205–214. [Google Scholar] [CrossRef] [PubMed]
- Strand, M.; Löfvenius, M.O.; Bergsten, U.; Lundmark, T.; Rosvall, O. Height growth of planted conifer seedlings in relation to solar radiation and position in Scots pine shelterwood. For. Ecol. Manag. 2006, 224, 258–265. [Google Scholar] [CrossRef]
- Katrevics, J.; Neimane, U.; Dzerina, B.; Kitenberga, M.; Jansons, J.; Jansons, A. Environmental factors affecting formation of lammas shoots in young stands of Norway spruce (Picea abies Karst.) in Latvia. iForest 2018, 11, 809–815. [Google Scholar] [CrossRef]
- Jansons, A.; Neimane, U.; Dzerina, B.; Adamovics, A. Influence of lammas shoots on height of young Scots pines in Latvia. Agron. Res. 2016, 14, 407–417. [Google Scholar]


| FIN_1 | EST_1 | EST_2 | EST_3 | LAT_1 | LAT_2 | |
|---|---|---|---|---|---|---|
| Locality | Northern Finland, Rovaniemi | Eastern part of Estonia, Jarvselja | Eastern part of Estonia, Jarvselja | Eastern part of Estonia, Jarvselja | Western part of Latvia, Skede | Eastern part of Latvia, Kalsnava |
| Lat., °N | 66.38 | 58.32 | 58.32 | 58.31 | 57.26 | 56.58 |
| Lon., °E | 26.67 | 27.24 | 27.25 | 27.30 | 22.69 | 25.94 |
| Soil | Mesotrophic, dryish heath | Eutrophic, mineral free draining | Eutrophic, mineral free draining | Eutrophic, mineral free draining | Mesotrophic, mineral free draining | Mesotrophic, mineral free draining |
| Stand origin | Naturally regenerated | Seeded | Seeded | Seeded | Naturally regenerated | Naturally regenerated |
| Age | 29–35 | 113–116 | 53–75 | 39–43 | 104–108 | 78–87 |
| DBH (±st. dev.), cm | 13.8 ± 0.8 | 44.0 ± 5.7 | 31.6 ± 3.2 | 29.7 ± 5.3 | 42.3 ± 6.1 | 39.8 ± 5.9 |
| H (±st. dev.), m | 9.8 ± 0.7 | 32.3 ± 2.4 | 28.8 ± 1.0 | 24.0 ± 0.8 | 29.9 ± 2.5 | 27.4 ± 1.7 |
| Trees sampled | 20 | 10 | 13 | 10 | 20 | 20 |
| Reference | [15] | [21] | [21] | [21] | [17] | [17] |
| FIN_1 | EST_1-3 | LAT_1 | LAT_2 | |
|---|---|---|---|---|
| Mean annual temperature (±st. deviation) | 0.8 ± 1.1 | 5.4 ± 1.0 | 6.3 ± 0.9 | 5.8 ± 0.8 |
| Mean minimum February temperature | −15.9 | −9.1 | −5.8 | −7.9 |
| Mean maximum February temperature | −6.8 | −2.5 | −0.5 | −1.7 |
| Mean February temperature | −11.3 | −5.8 | −3.1 | −4.8 |
| Mean minimum July temperature | 10.3 | 11.9 | 12.1 | 11.8 |
| Mean maximum July temperature | 20.7 | 22.5 | 20.7 | 22.1 |
| Mean July temperature | 15.5 | 17.2 | 16.4 | 16.9 |
| Mean minimum May-September temperature | 6.2 | 8.9 | 9.5 | 9.1 |
| Mean maximum May-September temperature | 15.9 | 19.3 | 18.0 | 19.3 |
| Mean May-September temperature | 11.0 | 14.1 | 13.7 | 14.2 |
| Mean annual precipitation sum (±st. deviation) | 495 ± 71 | 618 ± 80 | 691 ± 93 | 673 ± 80 |
| Mean annual precipitation sum (±st. deviation) | 271 ± 53 | 341 ± 80 | 322 ± 70 | 346 ± 72 |
| FIN_1 | EST_1 | EST_2 | EST_3 | LAT_1 | LAT_2 | |
|---|---|---|---|---|---|---|
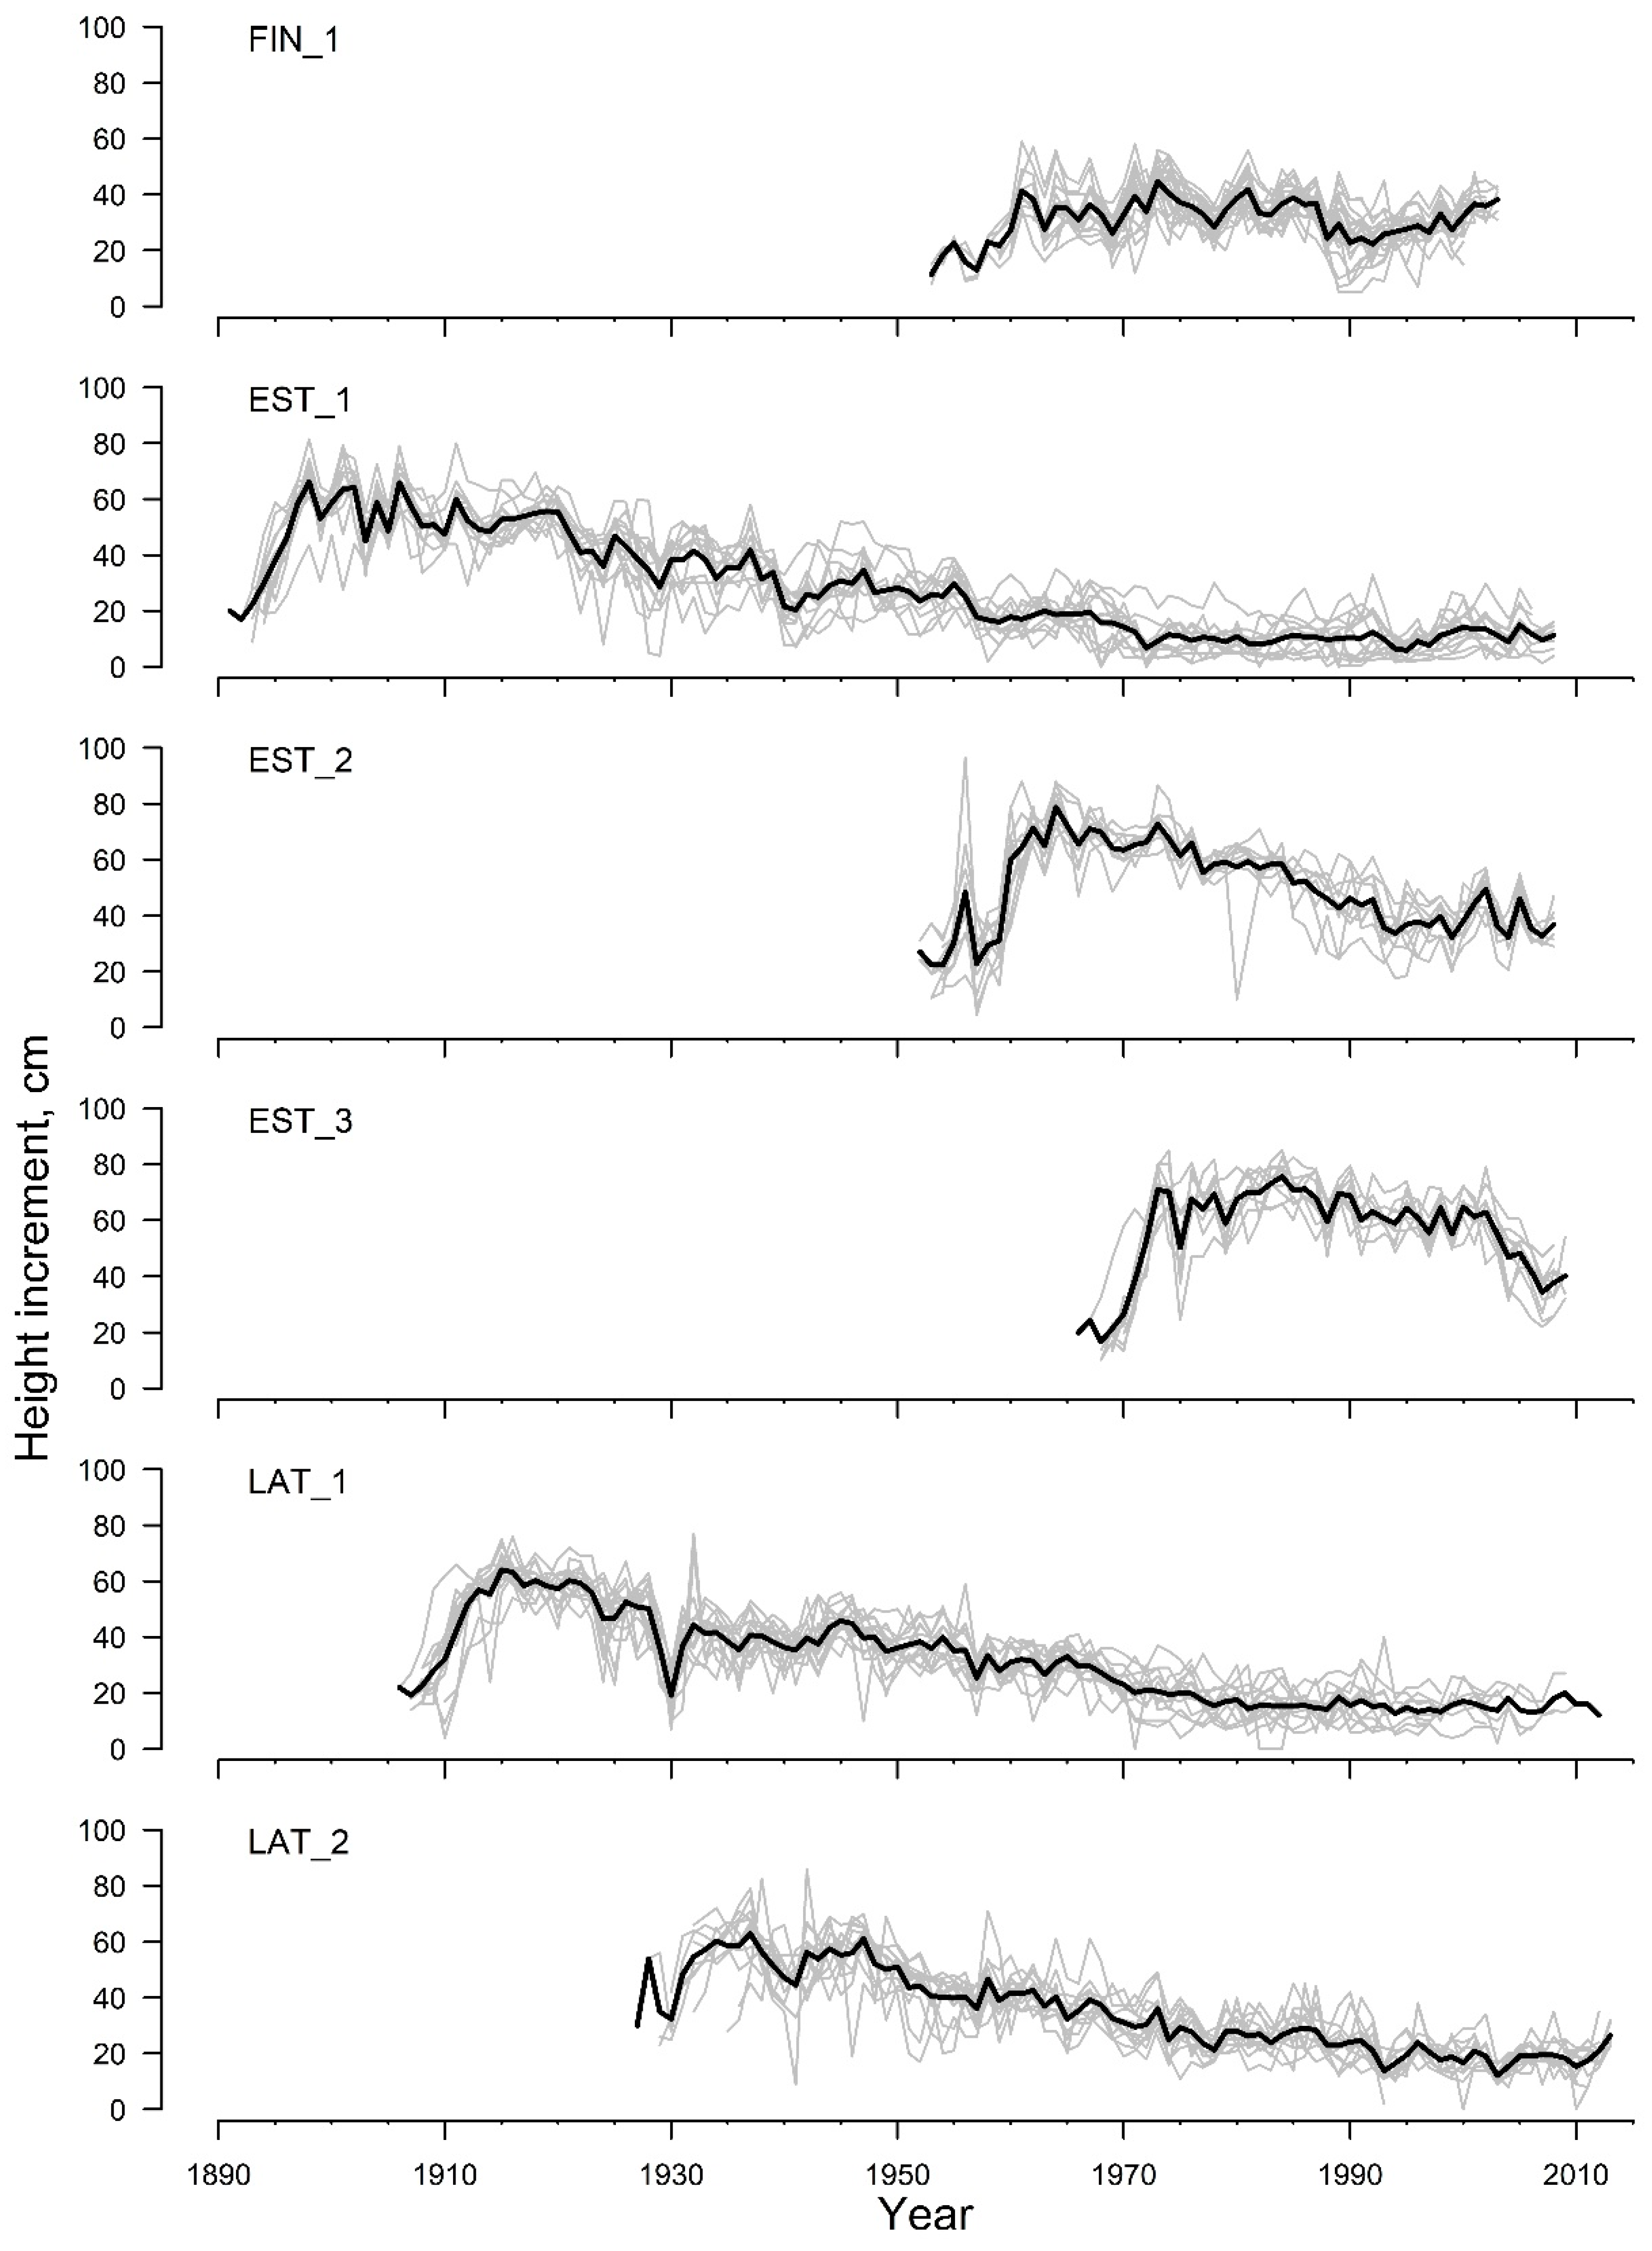
| Timespan | 1953–2003 | 1891–2008 | 1952–2008 | 1966–2009 | 1906–2012 | 1927–2013 |
| Mean HI, cm | 32.3 | 28.5 | 50.1 | 58.0 | 33.6 | 34.3 |
| St. dev. HI, cm | 8.2 | 18.6 | 16.7 | 15.2 | 15.6 | 15.3 |
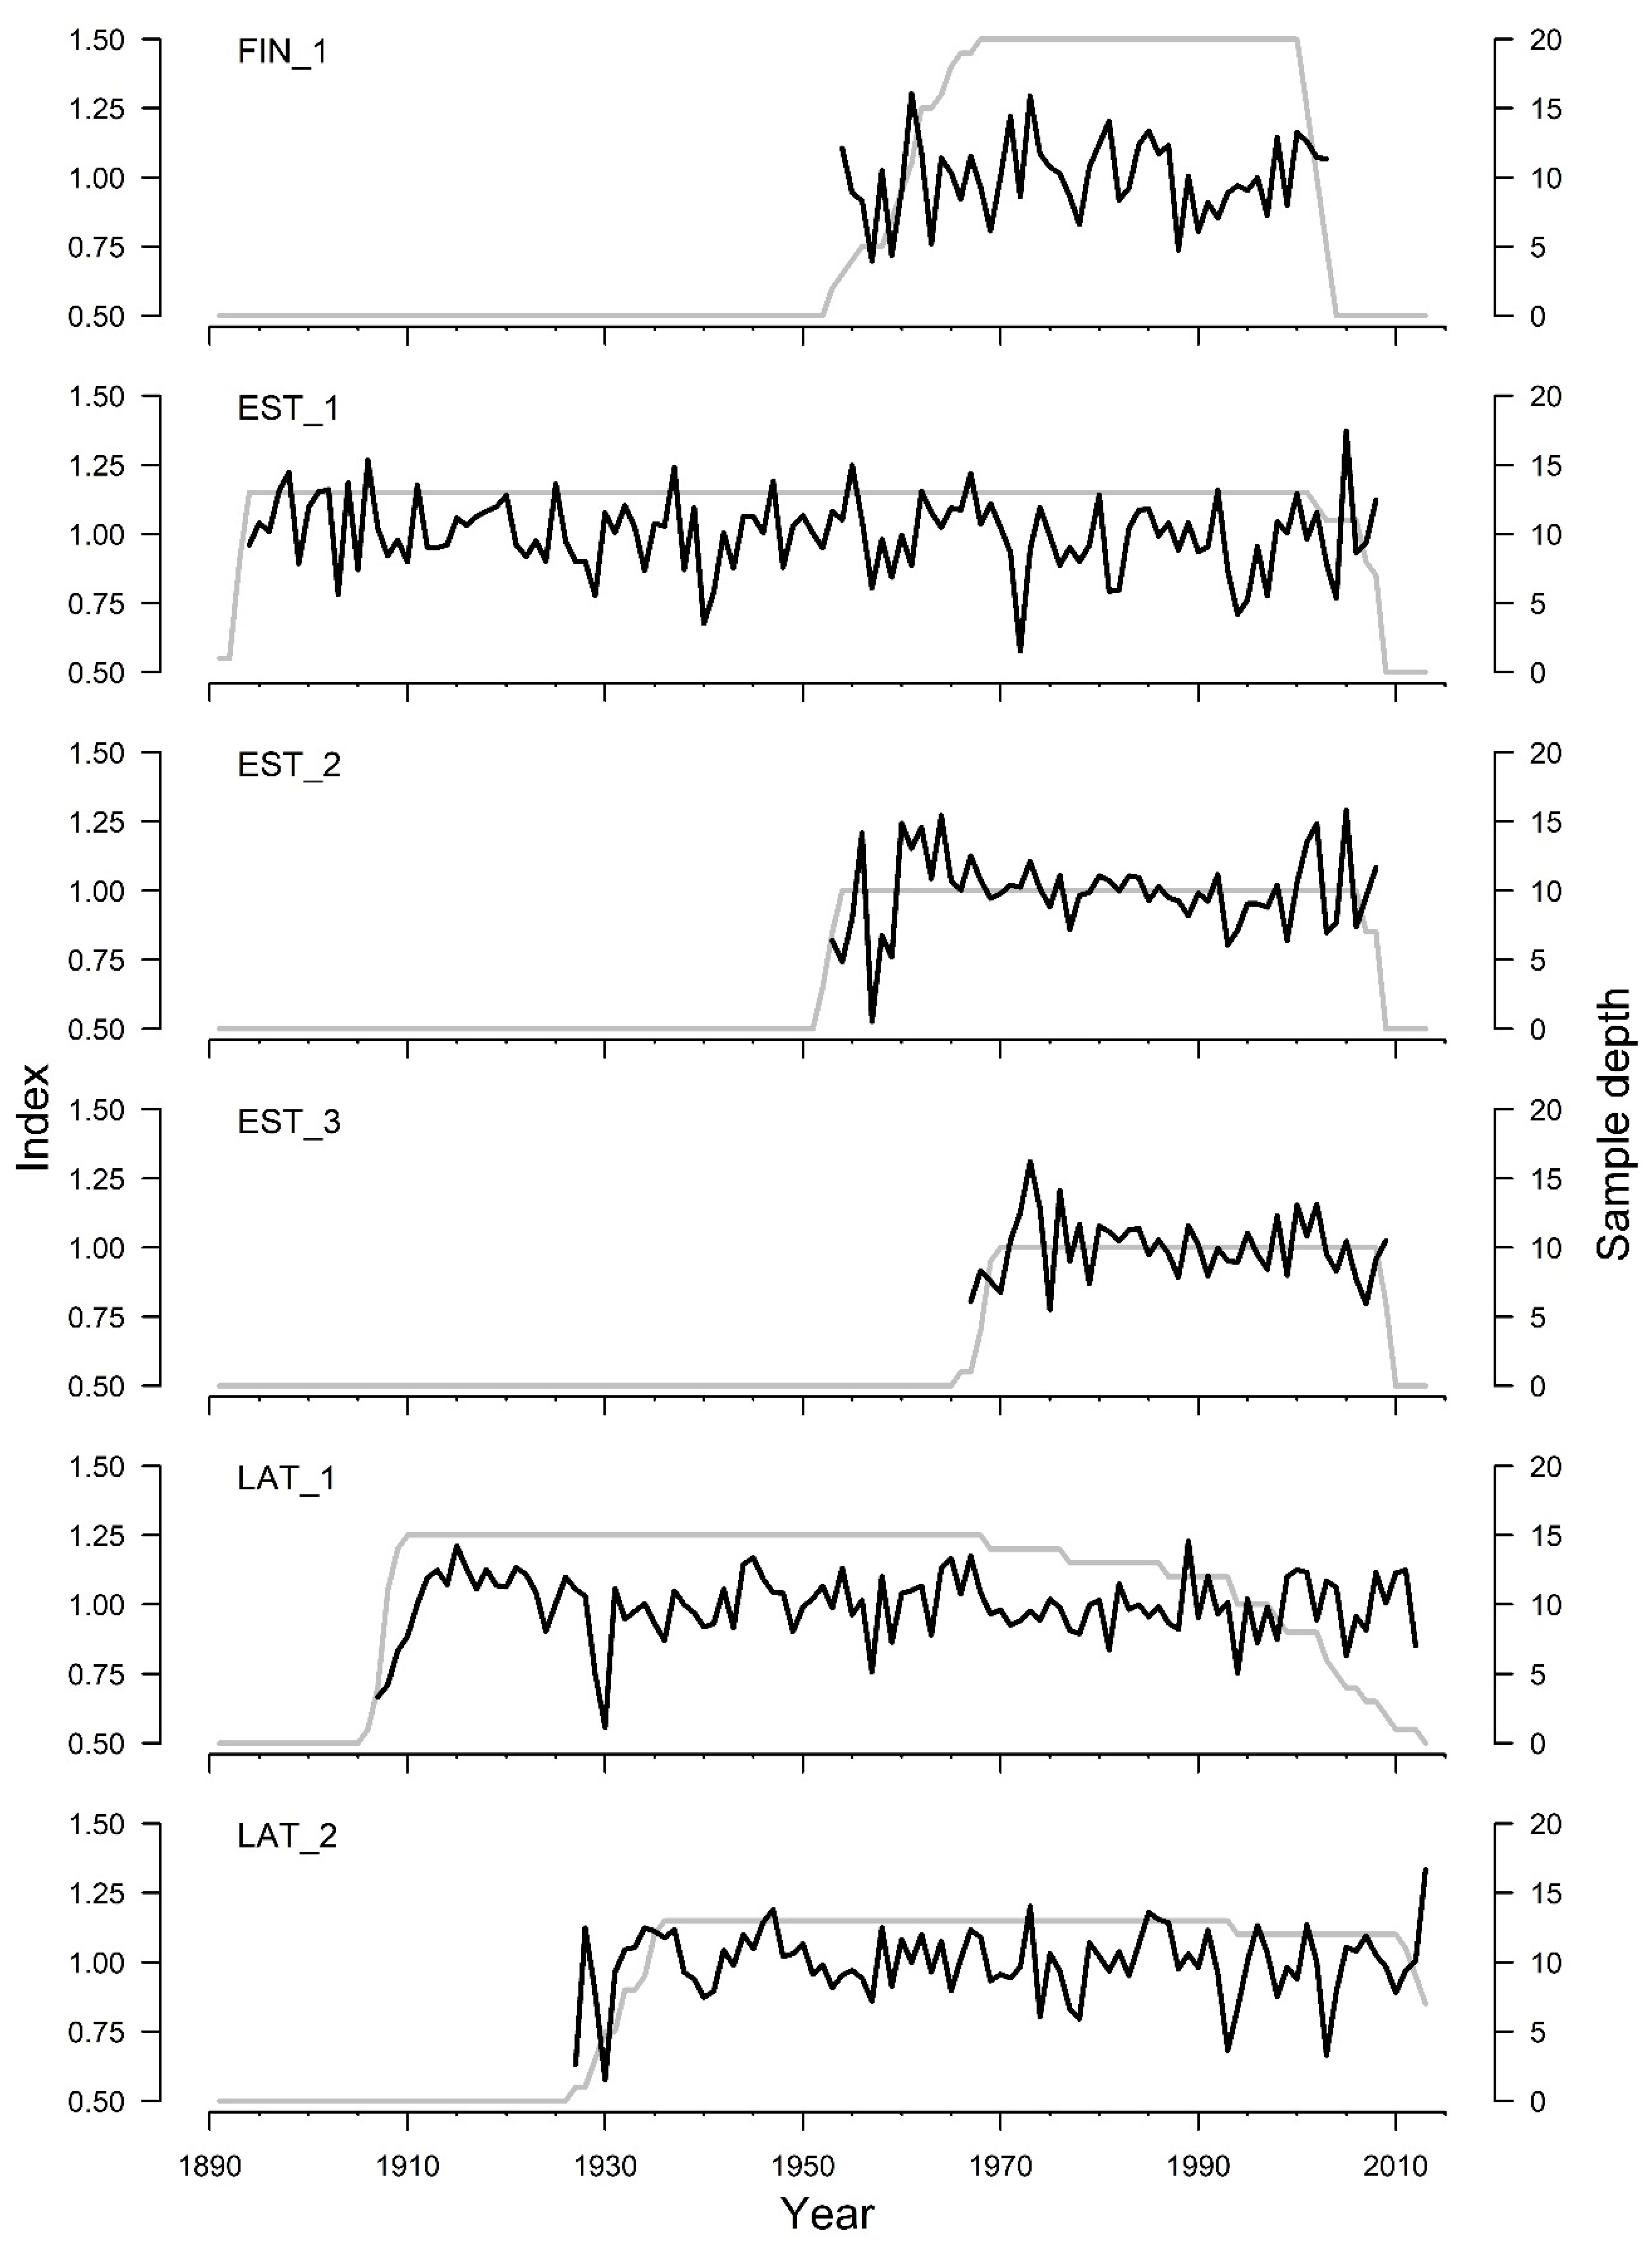
| Number of time series | 20 | 13 | 10 | 10 | 15 | 13 |
| Mean interseries correlation | 0.47 | 0.28 | 0.56 | 0.58 | 0.34 | 0.29 |
| Expressed population signal | 0.88 | 0.86 | 0.89 | 0.87 | 0.88 | 0.85 |
| Signal-to-noise ratio | 7.42 | 6.04 | 8.03 | 6.48 | 7.06 | 4.64 |
| First order autocorrelation | 0.32 | 0.40 | 0.38 | 0.43 | 0.34 | 0.21 |
| Gini coefficient | 0.13 | 0.17 | 0.11 | 0.10 | 0.13 | 0.12 |
| Mean sensitivity | 0.21 | 0.27 | 0.17 | 0.15 | 0.22 | 0.2 |
| Mean synchronicity (Gleichläufigkeit) | 0.70 | 0.64 | 0.71 | 0.72 | 0.61 | 0.62 |
| Fixed Effects (Smoothing Terms) | Effective Degree of Freedom | F-Value |
|---|---|---|
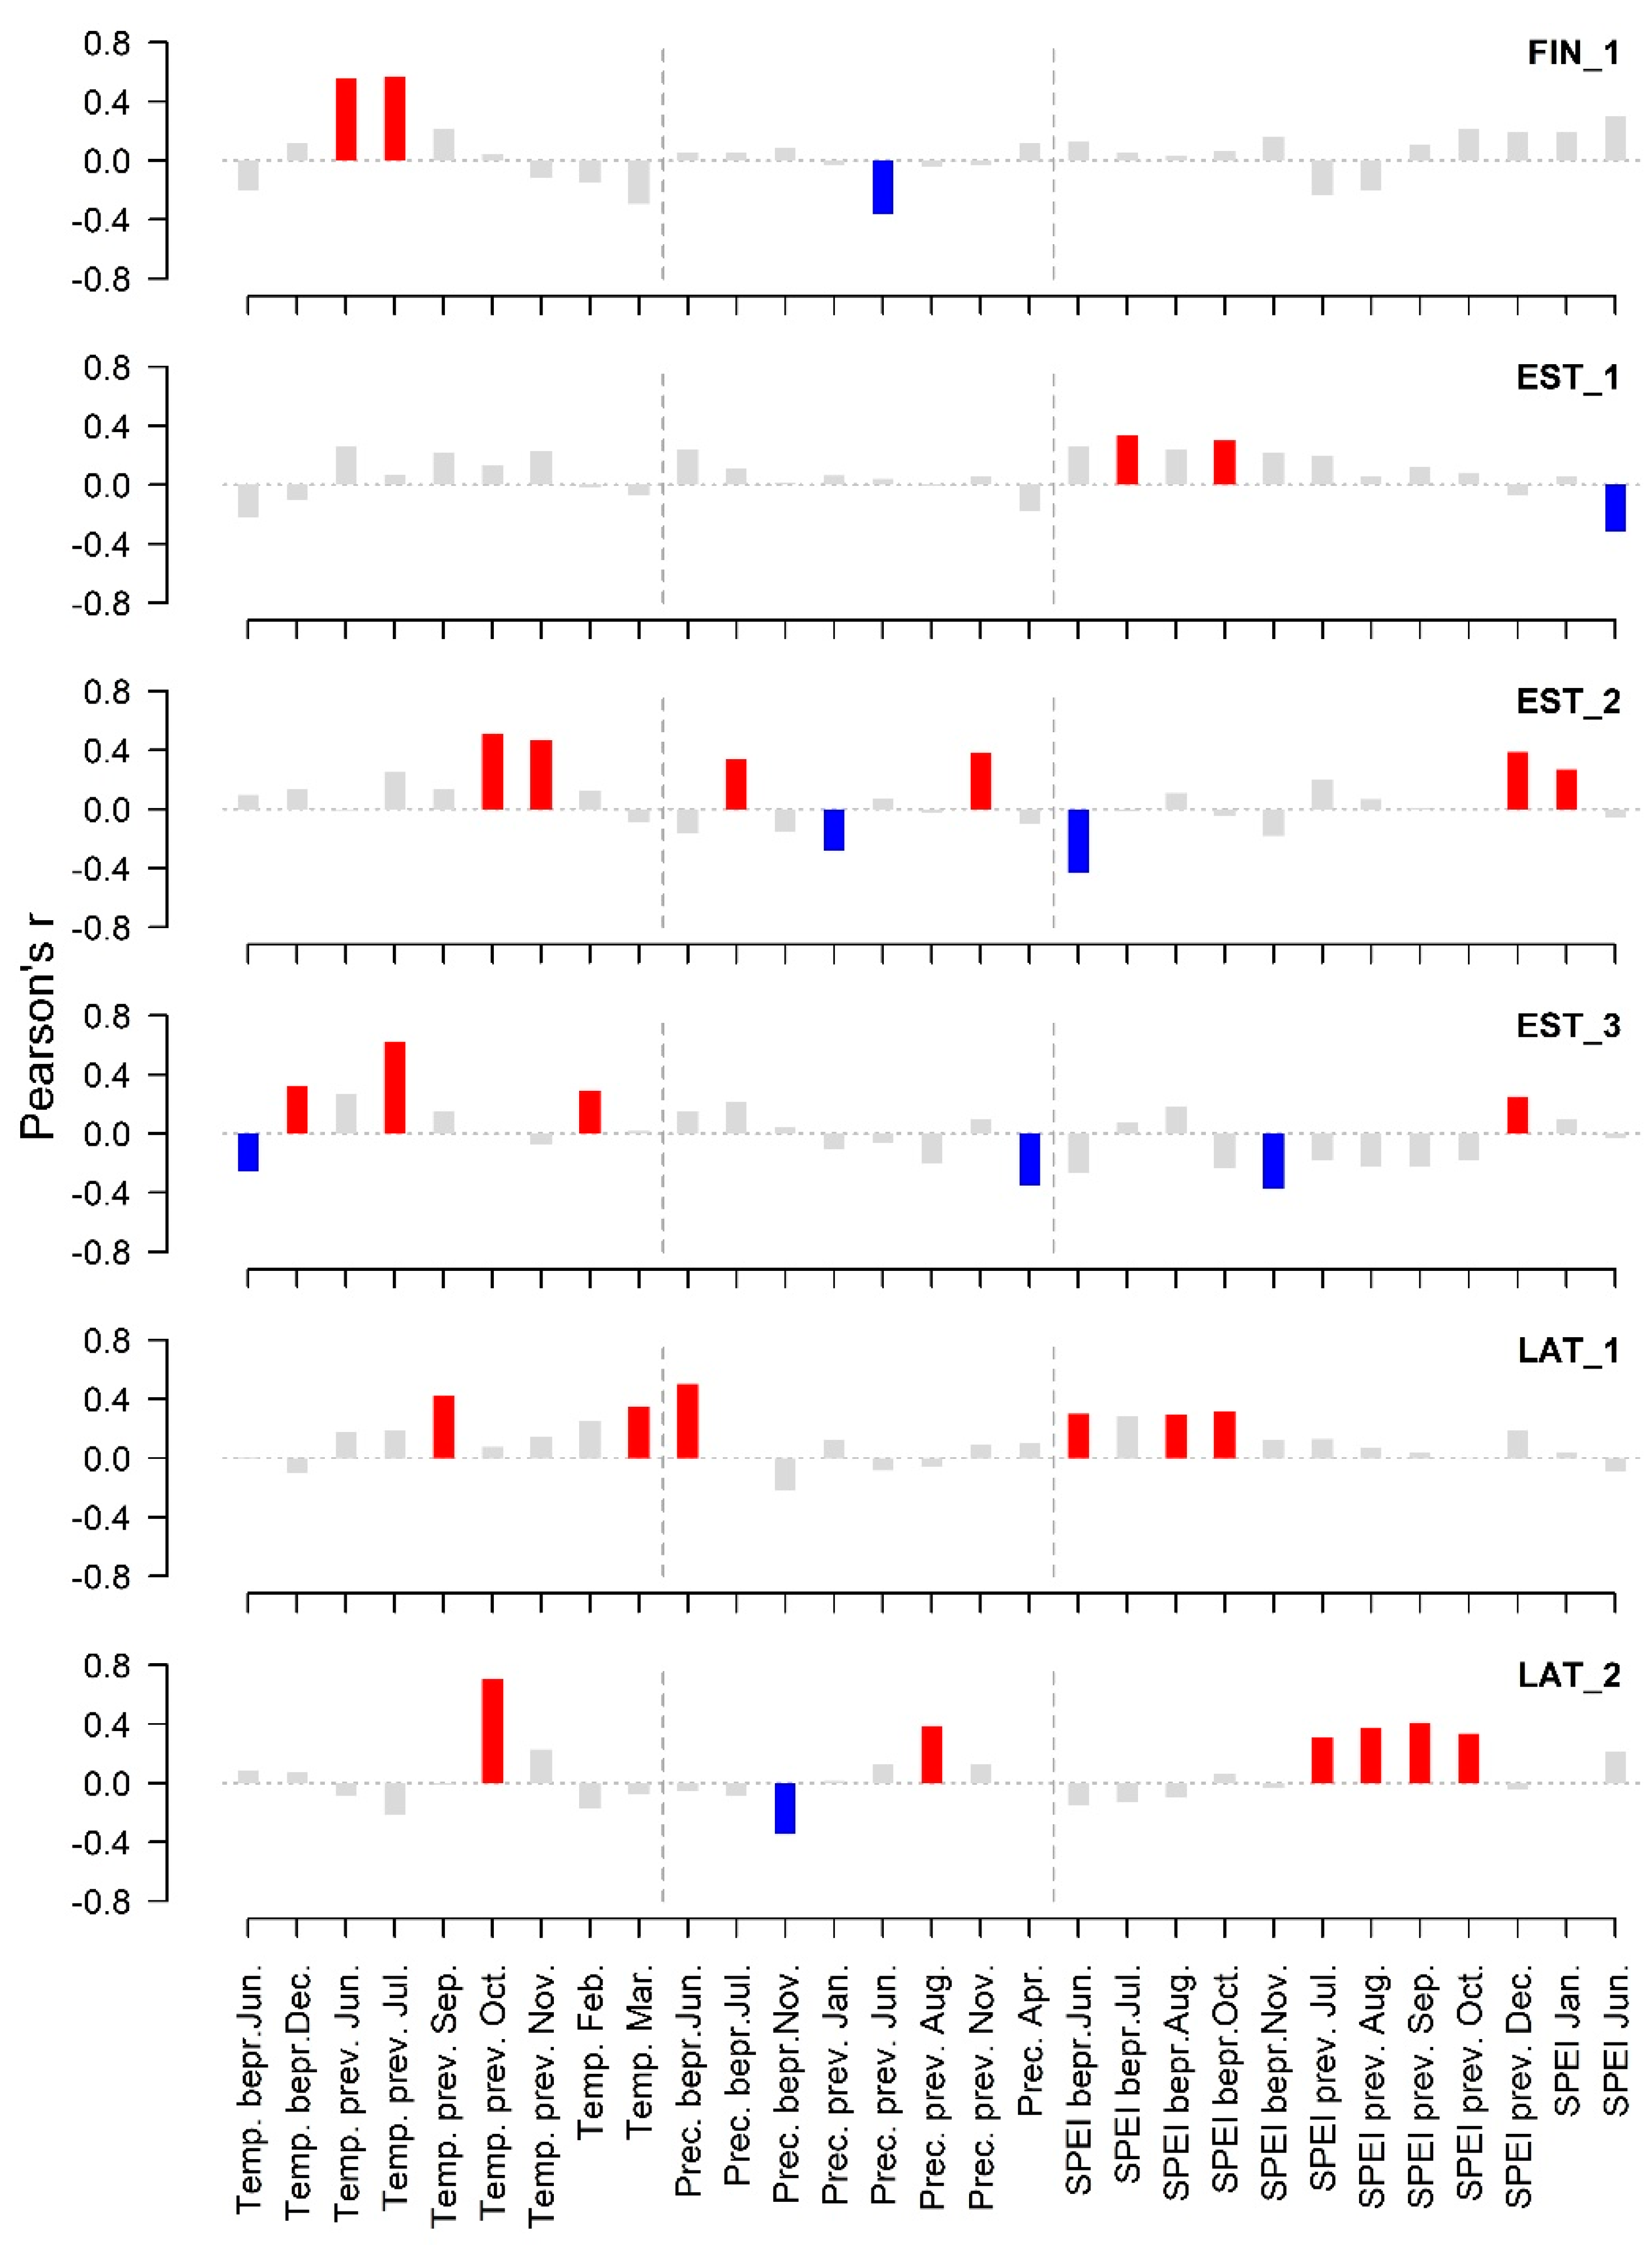
| Mean temperature. bepr. August | 1.39 | 8.87 *** |
| Mean temperature prev. June | 2.13 | 7.11 ** |
| Mean temperature prev. July | 1.00 | 15.21 *** |
| Mean temperature prev. October | 2.06 | 10.39 *** |
| Mean temperature January–February | 1.00 | 5.09 * |
| Minimum mean June–July temperature | 1.00 | 4.66 * |
| Mean temperature August | 1.00 | 11.90 *** |
| Precipitation sum August | 1.00 | 6.83 ** |
| Random Effects (Variance) | ||
| Stand (site) | 3.49 × 10⁻⁵ | |
| Year | 1.23 × 10⁻² | |
| Residual | 8.91 × 10⁻⁷ | |
| Model Performance | ||
| Autocorrelation term | 0.02 | |
| Marginal R2 | 0.38 | |
| Conditional R2 | 0.72 | |
| REML (calibration) | 0.11 | |
| REML (verification) | 0.14 | |
Disclaimer/Publisher’s Note: The statements, opinions and data contained in all publications are solely those of the individual author(s) and contributor(s) and not of MDPI and/or the editor(s). MDPI and/or the editor(s) disclaim responsibility for any injury to people or property resulting from any ideas, methods, instructions or products referred to in the content. |
© 2023 by the authors. Licensee MDPI, Basel, Switzerland. This article is an open access article distributed under the terms and conditions of the Creative Commons Attribution (CC BY) license (https://creativecommons.org/licenses/by/4.0/).
Share and Cite
Matisons, R.; Metslaid, S.; Hordo, M.; Kask, R.; Kangur, A.; Salminen, H.; Jansons, Ā. Direct and Carry-Over Effects of Temperature Drive Height Increment of Scots Pine in the North-Eastern Baltic Sea Region. Forests 2023, 14, 791. https://doi.org/10.3390/f14040791
Matisons R, Metslaid S, Hordo M, Kask R, Kangur A, Salminen H, Jansons Ā. Direct and Carry-Over Effects of Temperature Drive Height Increment of Scots Pine in the North-Eastern Baltic Sea Region. Forests. 2023; 14(4):791. https://doi.org/10.3390/f14040791
Chicago/Turabian StyleMatisons, Roberts, Sandra Metslaid, Maris Hordo, Regino Kask, Ahto Kangur, Hannu Salminen, and Āris Jansons. 2023. "Direct and Carry-Over Effects of Temperature Drive Height Increment of Scots Pine in the North-Eastern Baltic Sea Region" Forests 14, no. 4: 791. https://doi.org/10.3390/f14040791
APA StyleMatisons, R., Metslaid, S., Hordo, M., Kask, R., Kangur, A., Salminen, H., & Jansons, Ā. (2023). Direct and Carry-Over Effects of Temperature Drive Height Increment of Scots Pine in the North-Eastern Baltic Sea Region. Forests, 14(4), 791. https://doi.org/10.3390/f14040791