
Has the Development of the Non-Timber Forest Products Industry Achieved Poverty Alleviation? Evidence from Lower-Income Forest Areas in Yunnan Province


Abstract
1. Introduction
2. Materials and Methods
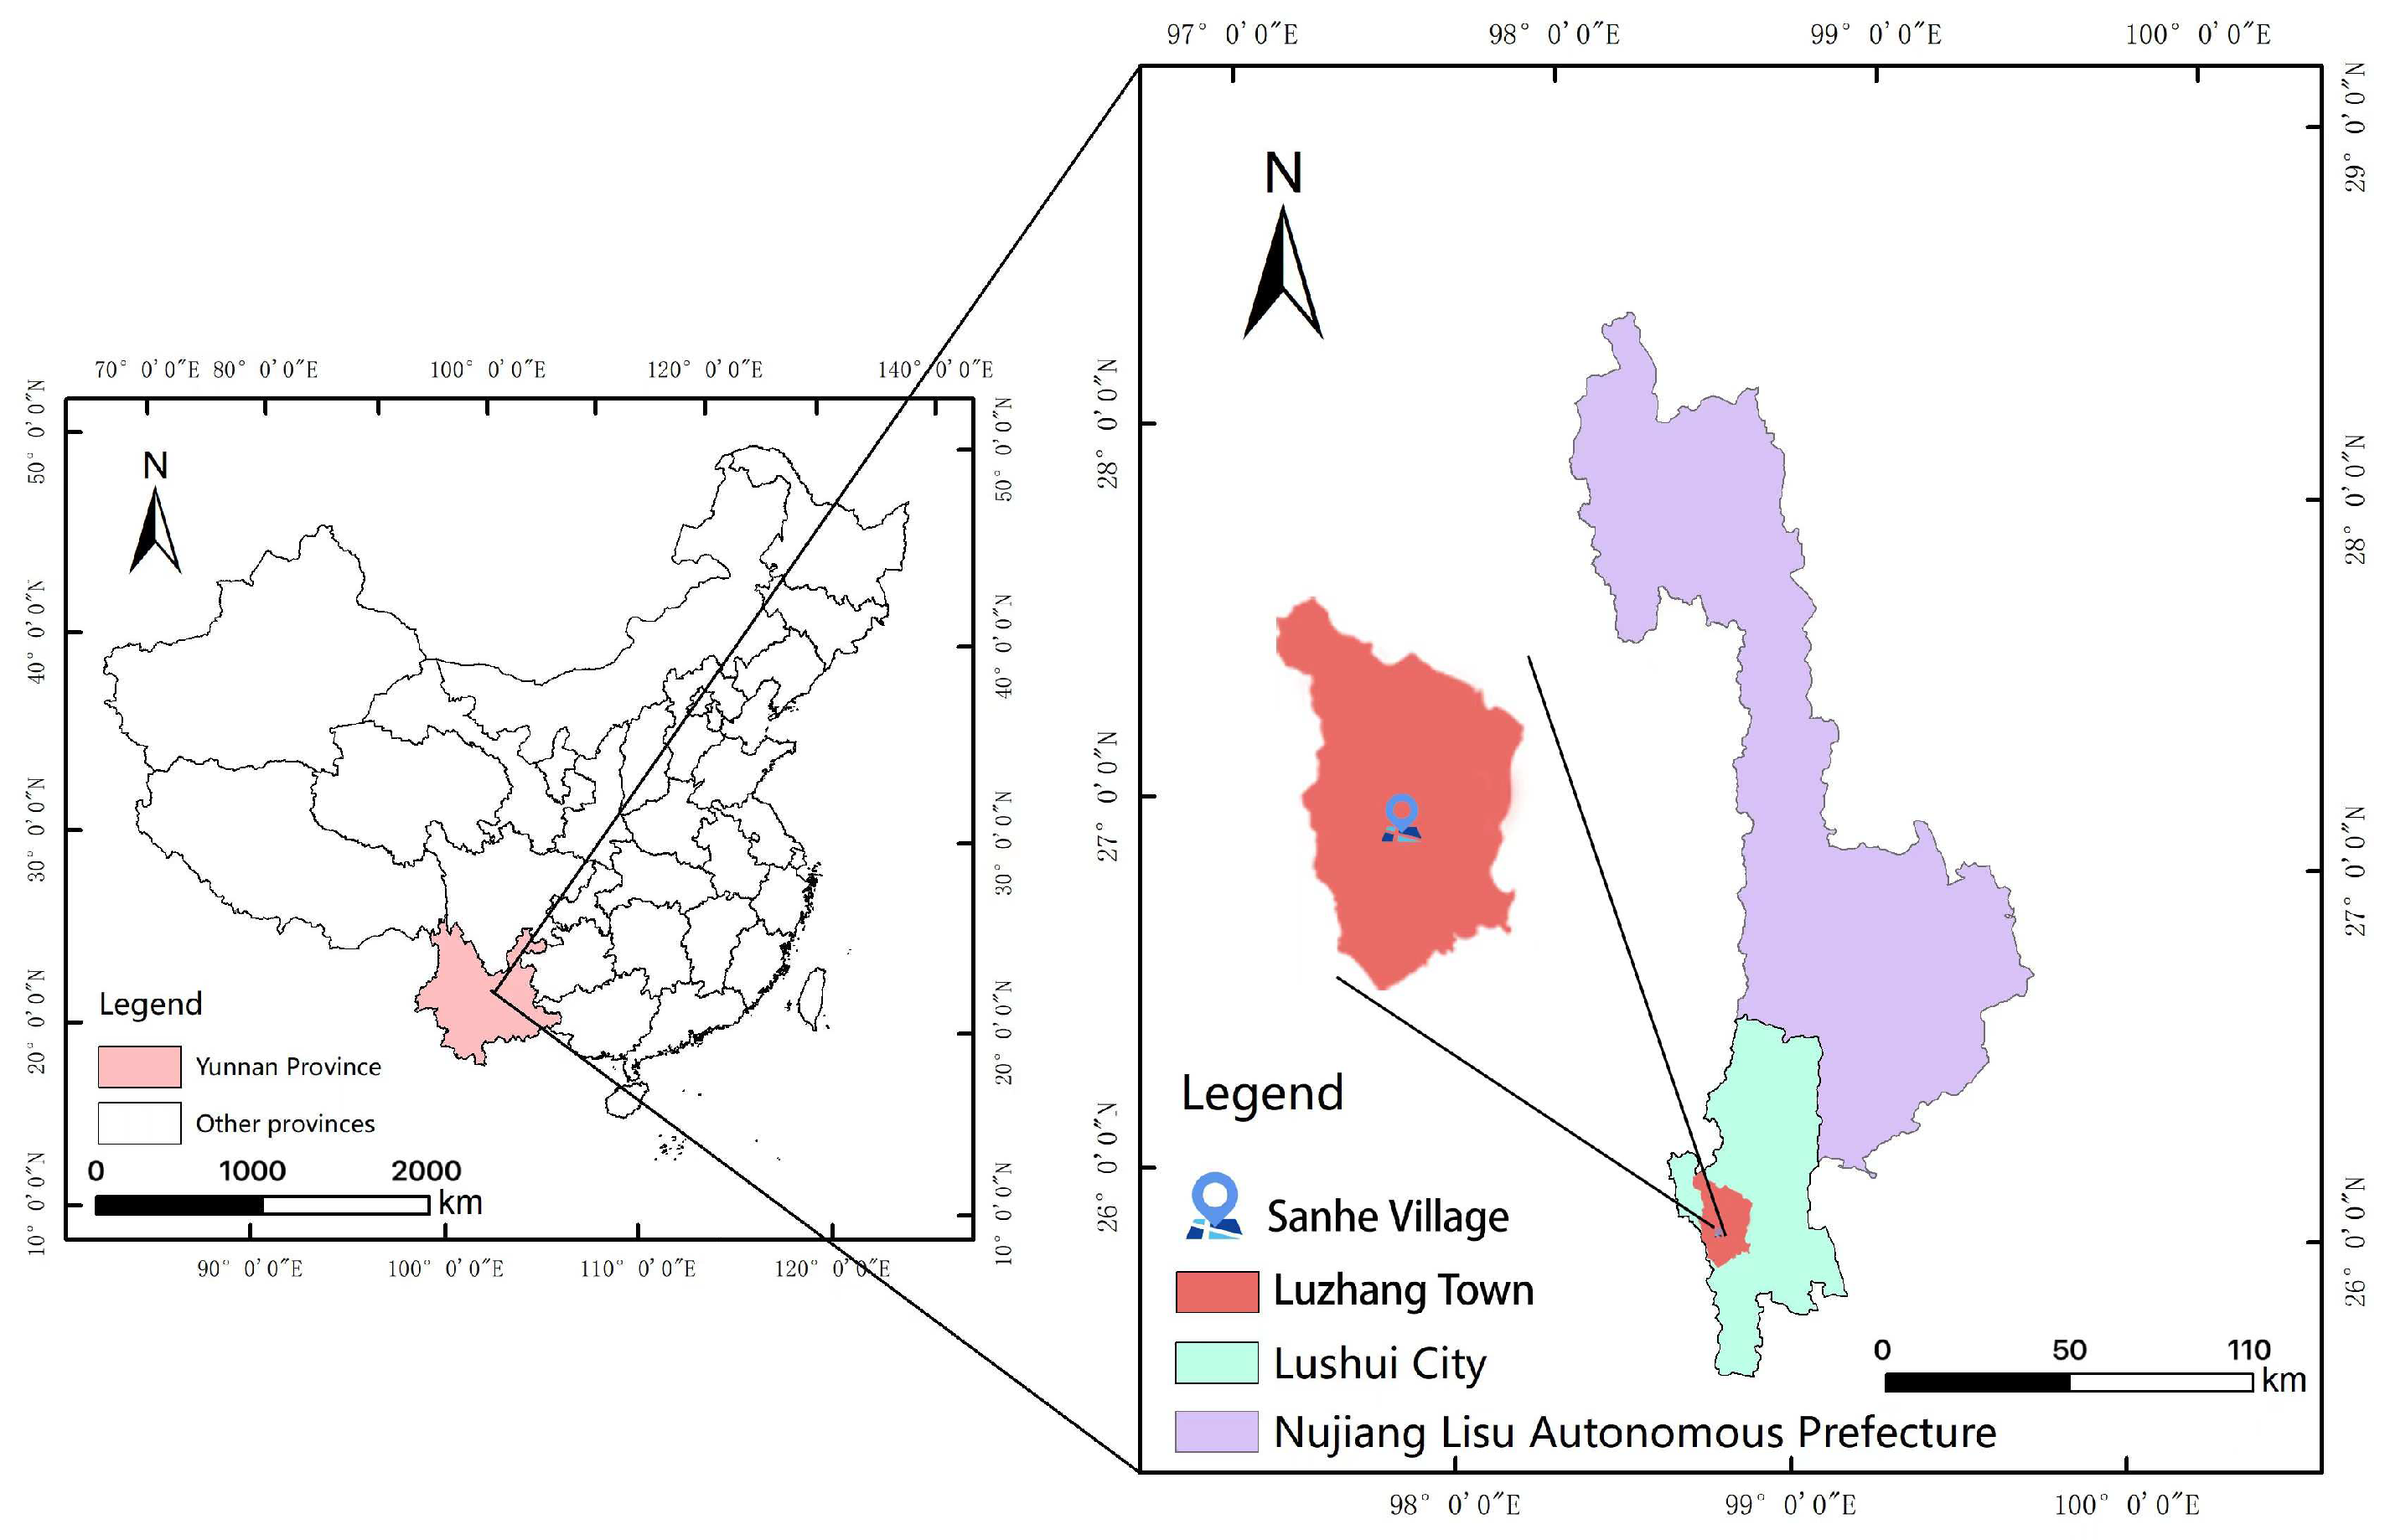
2.1. Study Area
2.2. Data Sources
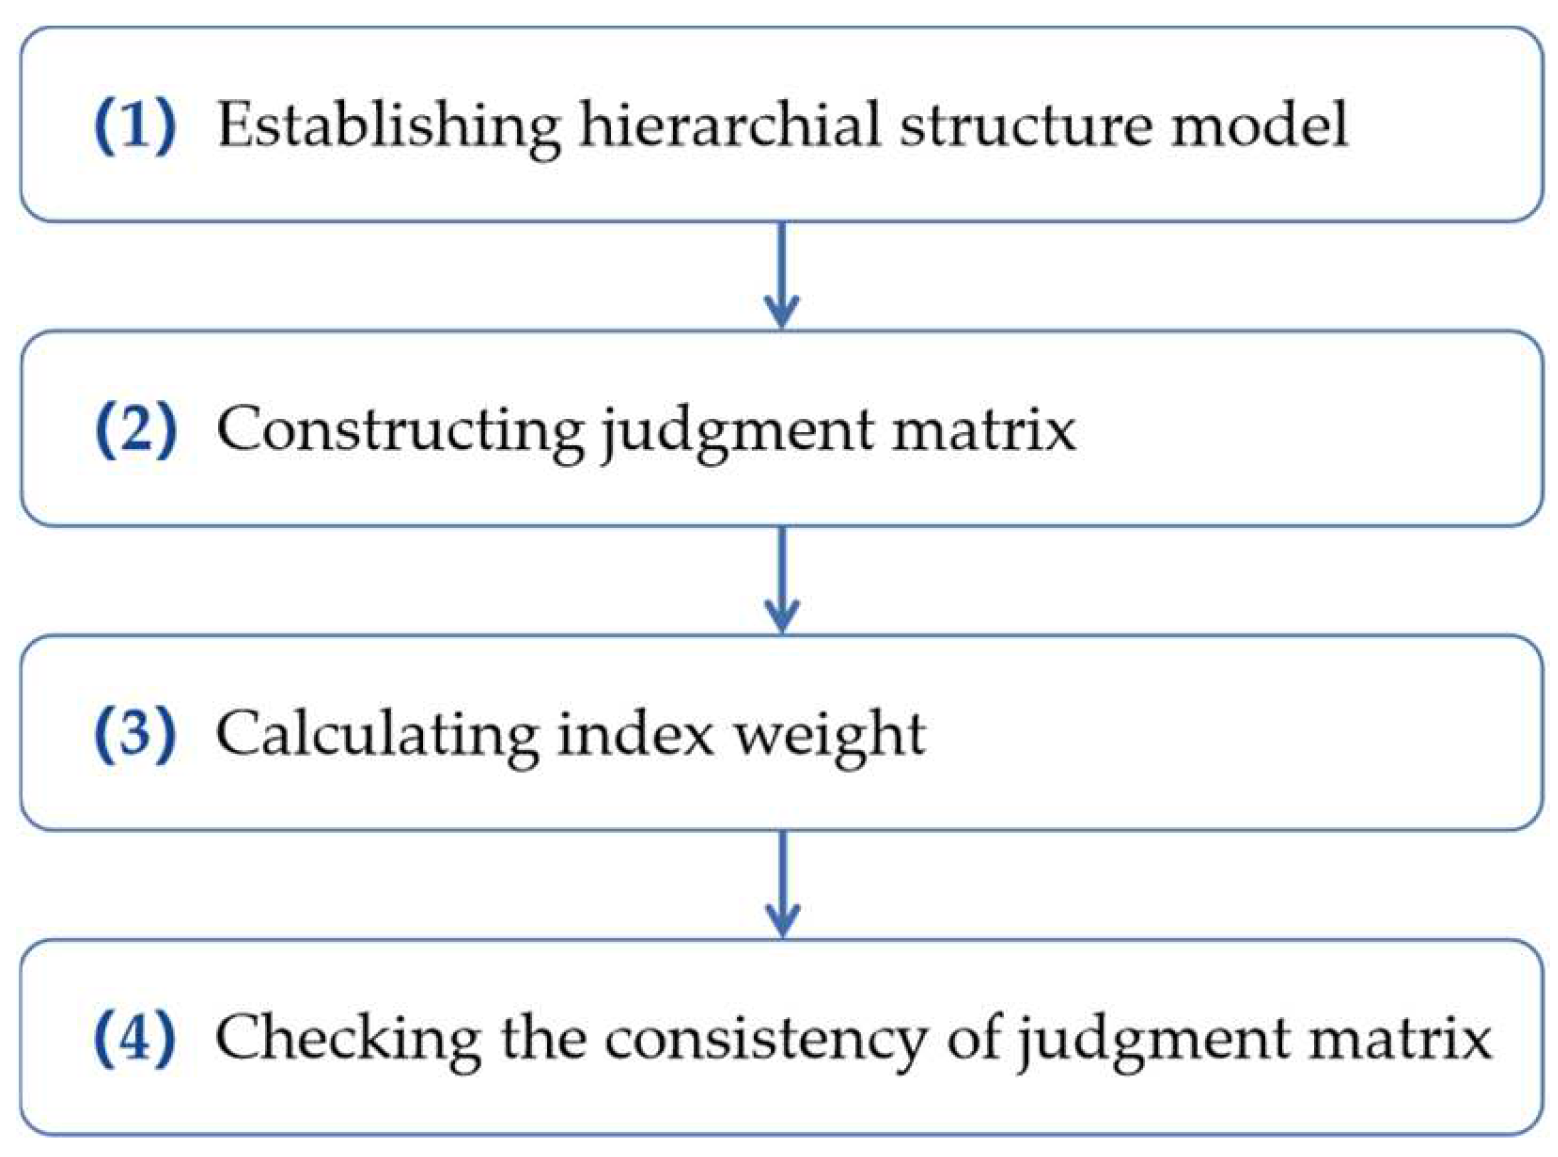
2.3. Analytic Hierarchy Process
2.3.1. Establishing the Hierarchical Structure Model
2.3.2. Constructing the Judgment Matrix
2.3.3. Calculating the Index Weights
- (1)
- Calculate the geometric mean value of each line of the judgment matrix using the root squaring method:where aij represents the elements in the ith row and the jth column of the original judgment matrix, n represents the number of indicators and represents the geometric mean of the ith row of the original judgment matrix.
- (2)
- Normalize the geometric mean of each line to obtain the respective eigenvectors:where Wi represents the weight of the ith indicator, n represents the number of indicators and represents the geometric mean value of the ith line of the original judgment matrix.
2.3.4. Checking the Consistency of the Judgment Matrix
- (1)
- Calculate the maximum eigenvalue of the judgment matrix:where n is the matrix order and Wi is the weight coefficient value of the desired index.
- (2)
- Calculate the consistency index (C.I.):
- (3)
- Calculate the consistency ratio (C.R.):where R.I. is the average random consistency index, which is fixed and known. The R.I. values are shown in Table 6.
2.4. Comprehensive Evaluation Method
2.4.1. Determining the Index Reference Values
2.4.2. Calculating the Index Scores
3. Results
3.1. Basic Information of the Households
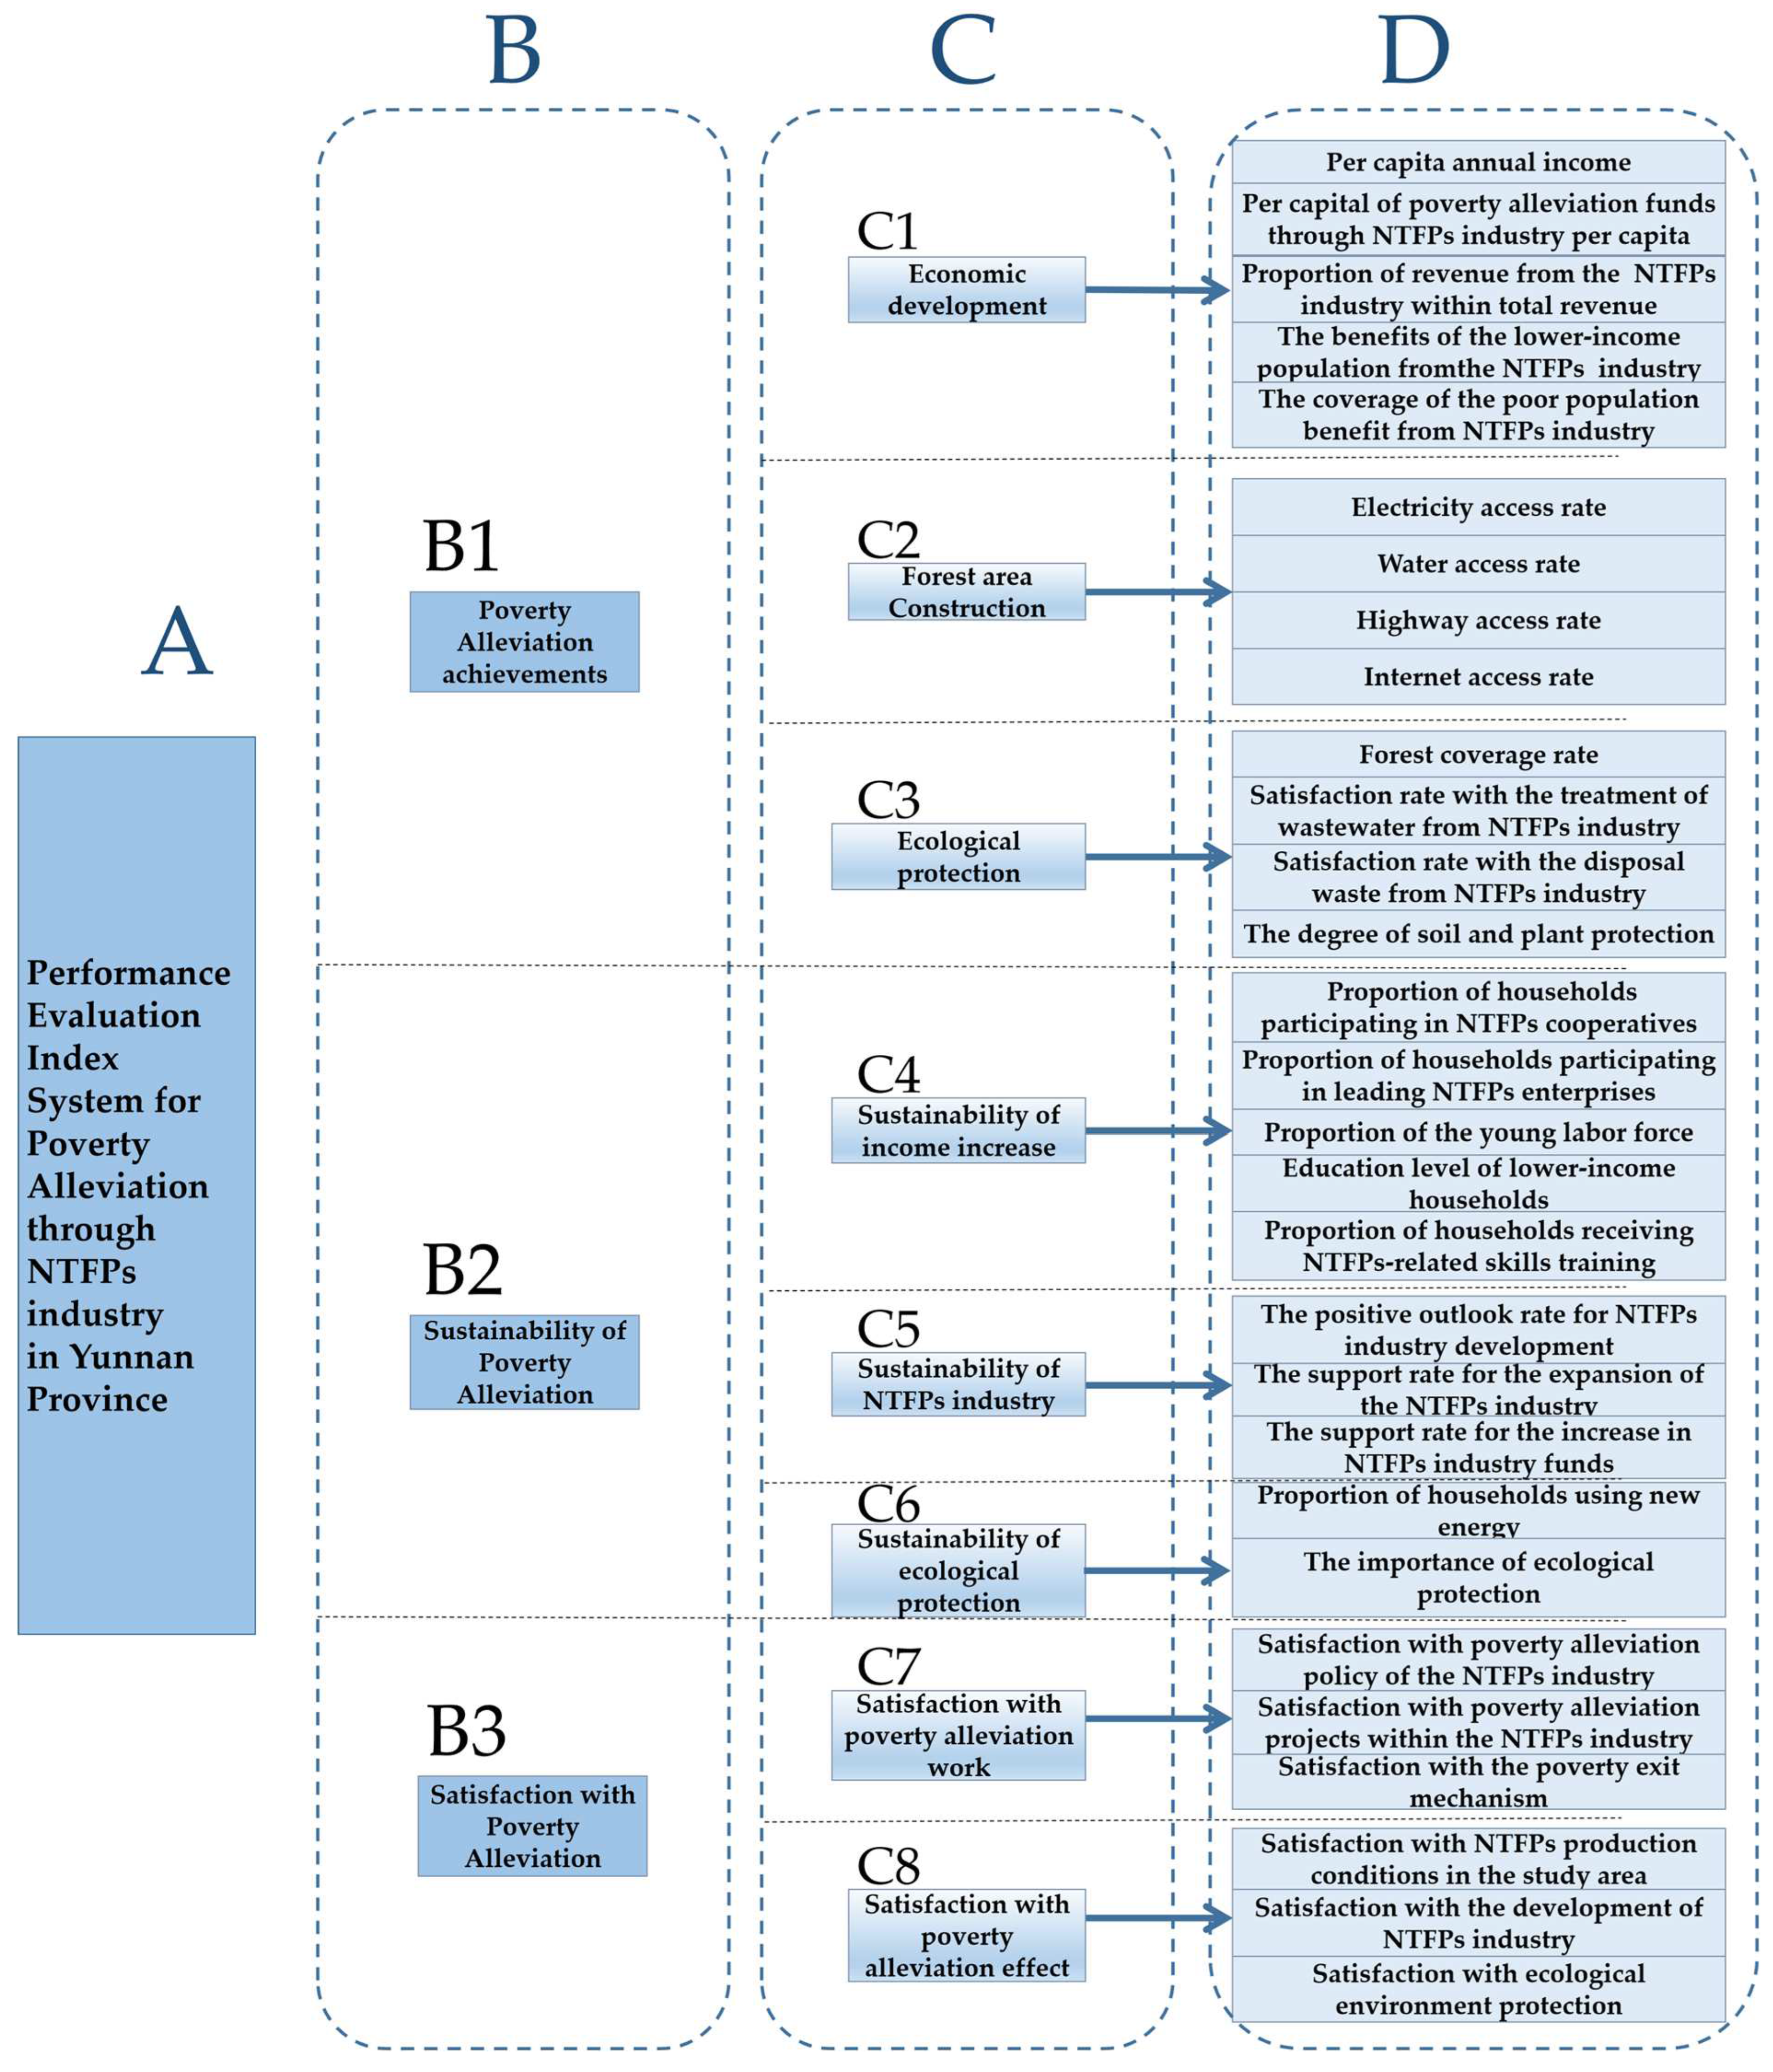
3.2. The Performance Evaluation Index System
3.3. Poverty Alleviation Performance of the NTFPs Industry
4. Discussion
4.1. Analysis of the Performance Evaluation Index System
4.2. Analysis of Poverty Alleviation Performance
4.2.1. The Achievement of Poverty Alleviation
4.2.2. The Sustainability of Poverty Alleviation
4.2.3. Satisfaction with Poverty Alleviation
5. Conclusions and Implications
Author Contributions
Funding
Informed Consent Statement
Data Availability Statement
Acknowledgments
Conflicts of Interest
Appendix A
Appendix A.1. Outline of Interviews
Appendix A.1.1. Outline of Interviews with Forestry Departments at All Levels
- (1)
- Basic information: forestry resources (forest coverage, forest area, etc.); types, distribution and scale of NTFPs industry;
- (2)
- Development status: yield of products NTFPs; management benefits (economic benefits, ecological benefits and social benefits);
- (3)
- Poverty alleviation: the feasibility and importance of poverty alleviation through NTFPs industry; the advantages, disadvantages, opportunities and challenges of poverty alleviation through NTFPs industry; the mode, effect and problems of poverty alleviation through NTFPs industry.
Appendix A.1.2. Outline of Interviews with Poverty Alleviation Offices at All Levels
- (1)
- Poverty profile: distribution and basic situation of poor counties (villages); poor households;
- (2)
- Poverty alleviation projects: the types, proportion and benefits of poverty alleviation through NTFPs industry;
- (3)
- Poverty alleviation: poverty alleviation policies and implementation; farmers’ participation; enterprise poverty alleviation efforts;
- (4)
- Poverty alleviation evaluation: achievements, problems, difficulties and improvement measures.
Appendix A.1.3. Outline of Interviews with Village Cadres in Poverty-Stricken Counties
- (1)
- Basic information: number of households (total number of households, number of poor households); population (total population, number of poor people); area (total area, forest land area, cultivated land area, etc.); economic income; income composition; industrial structure;
- (2)
- Forest resources (main tree species types of economic forests, area, proportion and subsidies of public welfare forests); the development status of NTFPs industry; the development of cooperatives and enterprises about NTFPs industry.
Appendix B
Judgment Matrix

| Poverty Alleviation Achievements | Sustainability of Poverty Alleviation | Satisfaction with Poverty Alleviation | |
|---|---|---|---|
| Poverty Alleviation achievements | 1.0000 | 1.7500 | 3.3333 |
| Sustainability of Poverty Alleviation | 0.5714 | 1.0000 | 3.6250 |
| Satisfaction with Poverty Alleviation | 0.3000 | 0.2759 | 1.0000 |
| Economic Development | Forest Area Construction | Ecological Protection | |
|---|---|---|---|
| Economic development | 1.0000 | 2.4444 | 1.4444 |
| Forest area Construction | 0.4091 | 1.0000 | 1.0000 |
| Ecological protection | 0.6923 | 1.0000 | 1.0000 |
| Sustainability of Income Increase | Sustainability of NTFPs Industry | Sustainability of Ecological Protection | |
|---|---|---|---|
| Sustainability of income increase | 1.0000 | 3.6667 | 2.2500 |
| Sustainability of NTFPs industry | 0.2727 | 1.0000 | 1.1429 |
| Sustainability of ecological protection | 0.4444 | 0.8750 | 1.0000 |
| Satisfaction with Poverty Alleviation Work | Satisfaction with Poverty Alleviation Effect | |
|---|---|---|
| Satisfaction with poverty alleviation work | 1.0000 | 0.8333 |
| Satisfaction with poverty alleviation effect | 1.2000 | 1.0000 |
| Per Capita Annual Income | Per Capita Poverty Alleviation Funds for the NTFPs Industry | Proportion of Poverty Alleviation through the NTFPs Industry | Proportion of Revenue from the NTFPs Industry within Total Revenue | The Benefits to the Lower-Income Population from the NTFPs Industry | |
|---|---|---|---|---|---|
| Per capita annual income | 1.0000 | 2.4000 | 2.4444 | 3.0000 | 2.6250 |
| Per capita poverty alleviation funds for the NTFPs industry | 0.4167 | 1.0000 | 2.6000 | 2.3333 | 1.4286 |
| Proportion of poverty alleviation through the NTFPs industry | 0.4091 | 0.3846 | 1.0000 | 2.1111 | 2.3750 |
| Proportion of revenue from the NTFPs industry within total revenue | 0.3333 | 0.4286 | 0.4737 | 1.0000 | 1.88889 |
| The benefits to the lower-income population from the NTFPs industry | 0.3810 | 0.7000 | 0.4211 | 0.5294 | 1.0000 |
| Electricity Access Rate | Water Access Rate | Highway Access Rate | Internet Access Rate | |
|---|---|---|---|---|
| Electricity access rate | 1.0000 | 1.625 | 1.7143 | 2.6667 |
| Water access rate | 0.6154 | 1.0000 | 1.6667 | 2.5000 |
| Highway access rate | 0.5833 | 0.6000 | 1.0000 | 2.8889 |
| Internet access rate | 0.3750 | 0.4000 | 0.3462 | 1.0000 |
| Forest Coverage Rate | Satisfaction Rate with the Treatment of Wastewater from the NTFPs Industry | Satisfaction Rate with the Disposal of Waste from the NTFPs Industry | The Degree of Soil and Plant Protection | |
|---|---|---|---|---|
| Forest coverage rate | 1.0000 | 1.7500 | 2.1111 | 1.6667 |
| Satisfaction rate with the treatment of wastewater from the NTFPs industry | 0.5714 | 1.0000 | 2.2857 | 1.4444 |
| Satisfaction rate with the disposal of waste from the NTFPs industry | 0.4737 | 0.4375 | 1.0000 | 0.6667 |
| The degree of soil and plant protection | 0.6000 | 0.6923 | 1.5000 | 1.0000 |
| Proportion of Households Participating in NTFPs Cooperatives | Proportion of Households Participating in Leading NTFPs Enterprises | Proportion of the Young Labor Force | Education level of Lower-Income Households | Proportion of Households Receiving NTFPs-Related Skills Training | |
|---|---|---|---|---|---|
| Proportion of households participating in NTFPs cooperatives | 1 | 1.8571 | 1.2857 | 1 | 0.8889 |
| Proportion of households participating in leading NTFPs enterprises | 0.5385 | 1 | 1.3750 | 1.7778 | 1.8000 |
| Proportion of the young labor force | 0.7778 | 0.7273 | 1 | 1.1667 | 1.4000 |
| Education level of lower-income households | 1 | 0.5625 | 0.8571 | 1 | 1.88889 |
| Proportion of households receiving NTFPs-related skills training | 1.1250 | 0.5556 | 0.7143 | 0.5294 | 1 |
| The Positive Outlook Rate for NTFPs Industry Development | The Support Rate for the Expansion of the NTFPs Industry | The Support Rate for the Increase in NTFPs Industry Funds | |
|---|---|---|---|
| The positive outlook rate for NTFPs industry development | 1.0000 | 1.2857 | 1.2222 |
| The support rate for the expansion of the NTFPs industry | 0.7778 | 1.0000 | 1.0000 |
| The support rate for the increase in NTFPs industry funds | 0.8182 | 1.0000 | 1.0000 |
| Proportion of Households Using New Energy | The Importance of Ecological Protection | |
|---|---|---|
| Proportion of households using new energy | 1.0000 | 1.8889 |
| The importance of ecological protection | 0.5294 | 1.0000 |
| Satisfaction with the Poverty Alleviation Policy of the NTFPs Industry | Satisfaction with Poverty Alleviation Projects within the NTFPs Industry | Satisfaction with the Poverty Exit Mechanism | |
|---|---|---|---|
| Satisfaction with the poverty alleviation policy of the NTFPs industry | 1.0000 | 1.2857 | 1.2222 |
| Satisfaction with poverty alleviation projects within the NTFPs industry | 0.7778 | 1.0000 | 1.0000 |
| Satisfaction with the poverty exit mechanism | 0.8182 | 1.0000 | 1.0000 |
| Satisfaction with the NTFPs Production Conditions in the Study Area | Satisfaction with the Development of NTFPs Industry | Satisfaction with Ecological Environment Protection | |
|---|---|---|---|
| Satisfaction with the NTFPs production conditions in the study area | 1.0000 | 1.2857 | 1.2222 |
| Satisfaction with the development of NTFPs industry | 0.7778 | 1.0000 | 1.0000 |
| Satisfaction with ecological environment protection | 0.8182 | 1.0000 | 1.0000 |
References
- Lundmark, R.; Lundgren, T.; Olofsson, E. Meeting challenges in forestry: Improving performance and competitiveness. Forests 2021, 12, 208. [Google Scholar] [CrossRef]
- Gren, I.M.; Amuakwa-Mensah, F. Multifunctional Forestry and Interaction with Site Quality. Forests 2020, 11, 29. [Google Scholar] [CrossRef]
- Campbell, J.L.; Driscoll, C.T.; Jones, J.A.; Boose, E.R.; Dugan, H.A.; Groffman, P.M.; Jackson, C.R.; Jones, J.B.; Juday, G.P.; Lottig, N.R.; et al. Forest and Freshwater Ecosystem Responses to Climate Change and Variability at US LTER Sites. Bioscience 2022, 72, 851–870. [Google Scholar] [CrossRef]
- Sibelet, N.; Posada, K.E.; Gutierrez-Montes, I.A. Agroforestry systems provide firewood for livelihood improvement in Guatemala. Bois Et For. Des Trop. 2019, 340, 91–102. [Google Scholar] [CrossRef]
- Gould, W.A.; Wadsworth, F.H.; Quinones, M.; Fain, S.J.; Alvarez-Berrios, N.L. Land Use, Conservation, Forestry, and Agriculture in Puerto Rico. Forests 2017, 8, 242. [Google Scholar] [CrossRef]
- Rasmussen, L.V.; Watkins, C.; Agrawal, A. Forest contributions to livelihoods in changing agriculture-forest landscapes. For. Policy Econ. 2017, 84, 1–8. [Google Scholar] [CrossRef]
- Zhang, P.; Shao, G.; Zhao, G.; Le Master, D.C.; Parker, G.R.; Dunning, J.B.; Li, Q. China’s Forest Policy for the 21st Century. Science 2000, 288, 2135–2136. [Google Scholar] [CrossRef]
- Xu, C.; Cheng, B.; Zhang, M. Classification-Based Forest Management Program and Farmers’ Income: Evidence from Collective Forest Area in Southern China. China Agric. Econ. Rev. 2022, 14, 646–659. [Google Scholar] [CrossRef]
- de Jong, W.; Pokorny, B.; Katila, P.; Galloway, G.; Pacheco, P. Community Forestry and the Sustainable Development Goals: A Two Way Street. Forests 2018, 9, 331. [Google Scholar] [CrossRef]
- Yang, X.J.; Xu, J.T.; Xu, X.J.; Yi, Y.Y.; Hyde, W.F. Collective forest tenure reform and household energy consumption: A case study in Yunnan Province, China. China Econ. Rev. 2020, 60, 101134. [Google Scholar] [CrossRef]
- Brown, M. Diversity and Adaptation in Local Forest Governance in Yunnan, China. Hum. Ecol. 2020, 48, 253–265. [Google Scholar] [CrossRef]
- Dou, Y.Q.; Li, Q.L.; Li, M.H.; Li, Y. Typical Case Study on Under-Forestry Industry Poverty Alleviation. For. Econ. 2018, 40, 67–71. (In Chinese) [Google Scholar] [CrossRef]
- Gao, H.; Ouyang, Z.Y.; Chen, S.B.; van Koppen, C.S.A. Role of culturally protected forests in biodiversity conservation in Southeast China. Bio. Cons. 2013, 22, 531–544. [Google Scholar] [CrossRef]
- Hao, Y.; Xu, Y.L.; Zhang, J.J.; Hu, X.L.; Huang, J.B.; Chang, C.P.; Guo, Y.Q. Relationship between forest resources and economic growth: Empirical evidence from China. J. Cleaner Prod. 2019, 214, 848–859. [Google Scholar] [CrossRef]
- Dou, Y.Q.; Zhang, X.M.; Li, Y.; Zhu, Y.S. Analysis on the typical case of achieving poverty alleviation strategy through the development of under-forest industry. Issues For. Econ. 2021, 41, 27–33. (In Chinese) [Google Scholar] [CrossRef]
- Pradhan, P.; Singh, M. Role of non-timber forest products (NTFPs) in sustaining forest-based livelihoods: A case study of Ribdi village of West Sikkim, India. Indian J. Tradit. Know. 2019, 18, 595–609. [Google Scholar]
- Wahlen, C.B. Opportunities for making the invisible visible: Towards an improved understanding of the economic contributions of NTFPs. For. Policy Econ. 2017, 84, 11–19. [Google Scholar] [CrossRef]
- Liu, S.L.; Xu, J.T. Livelihood mushroomed: Examining household level impacts of non-timber forest products (NTFPs) under new management regime in China’s state forests. For. Policy Econ 2019, 98, 44–53. [Google Scholar] [CrossRef]
- Ambrose-Oji, B. The contribution of NTFPs to the livelihoods of the ‘forest poor’: Evidence from the tropical forest zone of south-west Cameroon. Int. For. Res. 2003, 5, 106–117. [Google Scholar] [CrossRef]
- Heubach, K.; Wittig, R.; Nuppenau, E.A.; Hahn, K. The economic importance of non-timber forest products (NTFPs) for livelihood maintenance of rural west African communities: A case study from northern Benin. Ecol. Econ. 2012, 70, 1991–2001. [Google Scholar] [CrossRef]
- Mukul, S.A.; Rashid, A.Z.M.M.; Uddin, M.B.; Khan, N.A. Role of non-timber forest products in sustaining forest-based livelihoods and rural households’ resilience capacity in and around protected area: A Bangladesh study. J. Environ. Plan. Manag. 2016, 59, 628–642. [Google Scholar] [CrossRef]
- Pasaribu, G.; Winarni, I.; Gusti, R.E.P.; Maharani, R.; Fernandes; Harianja, A.H.; Saragih, G.S.; Turjaman, M.; Tampubolon, A.P.; Kuspradini, H.; et al. Current Challenges and Prospects of Indonesian Non-Timber Forest Products (NTFPs): A Review. Forests. 2021, 12, 1743. [Google Scholar] [CrossRef]
- Khosravi, S.; Maleknia, R.; Khedrizadeh, M. Understanding the Contribution of Non-timber Forest Products to the Livelihoods of Forest Dwellers in the Northern Zagros in Iran. Small-Scale For. 2017, 16, 235–248. [Google Scholar] [CrossRef]
- Yan, W. Evaluation and Research of Ecological Tourism’s Comprehensive Benefits to the Development of Forestry. Agro. Food Ind. Hi-Tech. 2017, 28, 2449–2452. [Google Scholar]
- Danks, C.M. Benefits of community-based forestry in the US: Lessons from a demonstration programme. Int. For. Rev. 2009, 11, 171–185. [Google Scholar] [CrossRef]
- Feurer, M.; Gritten, D.; Than, M.M. Community Forestry for Livelihoods: Benefiting from Myanmar’s Mangroves. Forests 2018, 9, 150. [Google Scholar] [CrossRef]
- Lu, S.S.; Sun, H.S.; Zhou, Y.; Qin, F.; Guan, X.L. Examining the impact of forestry policy on poor and non-poor farmers’ income and production input in collective forest areas in China. J. Clean. Prod. 2020, 276, 123784. [Google Scholar] [CrossRef]
- Wang, H.; He, M.Y.; Ran, N.; Xie, D.; Wang, Q.; Teng, M.J.; Wang, P.C. China’s Key Forestry Ecological Development Programs: Implementation, Environmental Impact and Challenges. Forests 2021, 12, 101. [Google Scholar] [CrossRef]
- Zhang, X.; Ke, S.; Xu, T.; Qiao, D. Review of China’s forestry industry over the past 70 years and an outlook for the future. Int. For. Rev. 2020, 22, 269–282. [Google Scholar] [CrossRef]
- Wang, G.P.; Innes, J.L.; Dai, S.Y.; He, G.H. Achieving sustainable rural development in Southern China: The contribution of bamboo forestry. Int. J. Sus. Dev. World Ecol. 2008, 15, 484–495. [Google Scholar] [CrossRef]
- Chen, S.; Yao, S.B. Evaluation of Forestry Ecological Efficiency: A Spatiotemporal Empirical Study Based on China’s Provinces. Forests 2021, 12, 142. [Google Scholar] [CrossRef]
- Sanhe Village: An Ecological Model in the Hinterland of Gaoligong Mountain. Available online: https://www.mzhb.com/142787.html (accessed on 4 April 2023).
- Sanhe Village, Lushui City, Nujiang Prefecture: People and Birds View Each Other and Become Rich through Ecology. Available online: http://lcj.yn.gov.cn/html/2022/meitikanlincao_0519/65952.html (accessed on 4 April 2023).
- Dou, Y.Q.; Li, Q.L.; Li, M.H.; Li, Y. Typical case study of poverty alleviation in the agroforestry industry of Yunnan Province. For. Econ. 2018, 40, 67–71. (In Chinese) [Google Scholar]
- Yu, D.J.; Kou, G.; Xu, Z.S.; Shi, S.S. Analysis of Collaboration Evolution in AHP Research: 1982–2018. Int. J. Inf. Technol. Decis. 2021, 20, 7–36. [Google Scholar] [CrossRef]
- Liu, Y.; Eckert, C.M.; Earl, C. A review of fuzzy AHP methods for decision-making with subjective judgements. Expert Syst. Appl. 2020, 161, 113738. [Google Scholar] [CrossRef]
- Ishizaka, A.; Labib, A. Review of the main developments in the analytic hierarchy process. Expert Syst. Appl. 2011, 38, 14336–14345. [Google Scholar] [CrossRef]
- Saaty, T.L. The Analytic Hierarchy Process: Planning, Priority Setting, Resources Allocation; Mcgraw-Hill: New York, NY, USA, 1980. [Google Scholar]
- Saaty, T.L. Rank According to Perron: A New Insight. Math. Mag. 1987, 60, 211–213. [Google Scholar] [CrossRef]
- Yu, C.S. A GP-AHP method for solving group decision-making fuzzy AHP problems. Comput. Oper. Res. 2002, 29, 1969–2001. [Google Scholar] [CrossRef]
- Dong, Q.X.; Cooper, O. An orders-of-magnitude AHP supply chain risk assessment framework. Int. J. Prod. Econ. 2016, 182, 144–156. [Google Scholar] [CrossRef]
- Pant, S.; Kumar, A.; Ram, M.; Klochkov, Y.; Sharma, H.K. Consistency Indices in Analytic Hierarchy Process: A Review. Mathematics 2022, 10, 1206. [Google Scholar] [CrossRef]
- Wu, Z.R.; Xu, B.; Gu, C.S.; Li, Z.C. Comprehensive evaluation methods for dam service status. Sci. China-Technol. Sci. 2012, 55, 2300–2312. [Google Scholar] [CrossRef]
- Bland, A.C.; Kreiter, C.D.; Gordon, J.A. The psychometric properties of five scoring methods applied to the script concordance test. Acad. Med. 2005, 80, 395–399. [Google Scholar] [CrossRef] [PubMed]
- Vaidya, O.S.; Kumar, S. Analytic hierarchy process: An overview of applications. Eur. J. Oper. Res. 2006, 169, 1–29. [Google Scholar] [CrossRef]
- Liberatore, M.J.; Nydick, R.L. The analytic hierarchy process in medical and health care decision making: A literature review. Eur. J. Oper. Res. 2008, 189, 194–207. [Google Scholar] [CrossRef]
- Subramanian, N.; Ramanathan, R.A. review of applications of Analytic Hierarchy Process in operations management. Int. J. Prod. Econ. 2012, 138, 215–241. [Google Scholar] [CrossRef]
- Dos Santos, P.H.; Neves, S.M.; Sant’Anna, D.O.; de Oliveira, C.H.; Carvalho, H.D. The analytic hierarchy process supporting decision making for sustainable development: An overview of applications. J. Clean. Prod. 2019, 121, 119–138. [Google Scholar] [CrossRef]
- Goushehgir, Z.; Feghhi, J.; Innes, J.L. Challenges Facing the Improvement of Forest Management in the Hyrcanian Forests of Iran. Forests 2023, 13, 2180. [Google Scholar] [CrossRef]
- Epanda, M.A.; Donkeng, R.T.; Nonga, F.N.; Frynta, D.; Adi, N.N.; Willie, J.; Speelman, S. Contribution of Non-Timber Forest Product Valorisation to the Livelihood Assets of Local People in the Northern Periphery of the Dja Faunal Reserve, East Cameroon. Forests 2020, 11, 1019. [Google Scholar] [CrossRef]
- Mulenga, B.P.; Richardson, R.B.; Tembo, G.; Mapemba, L. Rural household participation in markets for non-timber forest products in Zambia. Environ. Dev. Econ. 2014, 19, 487–504. [Google Scholar] [CrossRef]
- Melaku, E.; Ewnetu, Z.; Teketay, D. Non-timber forest products and household incomes in Bonga forest area, southwestern Ethiopia. J. For. Res. 2014, 25, 215–223. [Google Scholar] [CrossRef]
- Delgado, T.S.; McCall, M.K.; Lopez-Binnquist, C. Non-Timber Forest Products: Small Matters, Big Significance, and the Complexity of Reaching a Workable Definition for Sustainability. Small-Scale For. 2022, 22, 37–68. [Google Scholar] [CrossRef]
- Uprety, Y.; Poudel, R.C.; Gurung, J.; Chettri, N.; Chaudhary, R.P. Traditional use and management of NTFPs in Kangchenjunga Landscape: Implications for conservation and livelihoods. J. Ethnobiol. Ethnomed. 2016, 12, 19. [Google Scholar] [CrossRef] [PubMed]
- Silva, T.C.; Araujo, E.C.G.; Lins, T.R.D.; Reis, C.A.; Sanquetta, C.R.; da Rocha, M.P. Non-Timber Forest Products in Brazil: A Bibliometric and a State of the Art Review. Sustainability 2020, 12, 7151. [Google Scholar] [CrossRef]
- Shackleton, C.; Shackleton, S. The importance of non-timber forest products in rural livelihood security and as safety nets: A review of evidence from South Africa. S. Afr. J. Sci. 2004, 100, 658–664. [Google Scholar]
- Han, F. Study on the Development of Under-Forest Economy and Its Impact on Forest Farmers. Master’s Thesis, Beijing Forestry University, Beijing, China, 2015. (In Chinese). [Google Scholar]
- Bai, H.; Liu, G.Z.; Zhang, X.R.; Ye, Y.L.; Fang, Y.L. Calculation of the Contribution of Forestry to Poverty Alleviation in Southern Shaanxi and Empirical Analysis of Its Influencing Factors. J. N. For. Univ. 2021, 36, 290–296. (In Chinese) [Google Scholar]
- Shen, Y.Y. Study on the Growth of Under-Forest Economy and Farmers’ Income in Guizhou Province. Master’s Thesis, Guizhou University, Guizhou, China, 2021. (In Chinese). [Google Scholar]


| Number | Type of NTFPs | Planting Area (ha) | Yield (kg/ha) | Income (CNY/ha) | Average Annual Income (CNY Million) |
|---|---|---|---|---|---|
| 1 | Konjak | 250.00 | 3.5 × 10⁴ | 5.0 × 10³ | 1.2 × 10⁶ |
| 2 | Mangnolia officinalis | 13.33 | 3.4 × 10³ | 6.0 × 10⁴ | 8.0 × 10⁵ |
| 3 | Aralia chinensis | 7.33 | 4.2 × 10³ | 7.5 × 10⁴ | 5.5 × 10⁵ |
| 4 | Paris polyphylla | 3.33 | 6.8 × 10³ | 1.5 × 10⁶ | 5.0 × 10⁶ |
| 5 | Aucklandia costus Falc. | 6.67 | 2.8 × 10⁴ | 4.5 × 10⁴ | 3.0 × 10⁵ |
| 6 | Phellodendron chinense Schneid. | 33.33 | 4.1 × 10⁴ | 9.0 × 10⁴ | 3.0 × 10⁶ |
| 7 | Citrus × limon | 1.00 | 4.5 × 10⁴ | 9.0 × 10⁴ | 9.0 × 10⁴ |
| 8 | Tea | 13.33 | 3.8 × 10³ | 3.0 × 10⁴ | 4.0 × 10⁵ |
| 9 | Ecological vegetables | 10.00 | - | 4.9 × 10⁴ | 4.9 × 10⁵ |
| 10 | Amomum tsao-ko | 13.33 | 7.5 × 10³ | 1.5 × 10⁴ | 2.0 × 10⁵ |
| 11 | Walnut | 26.67 | 1.5 × 10³ | 1.5 × 10⁴ | 4.0 × 10⁵ |
| Variables | Scope of Variables |
|---|---|
| Basic information | Gender, age, ethnicity, education level, etc. |
| Financial situation | Income and expenditure, poverty alleviation policies and measures, etc. |
| Forest land management | Forest land area, non-timber forest products management, etc. |
| Organizational forms | Cooperative organizations, enterprises, etc. |
| Skills training | Willingness to train, content, effects, etc. |
| Indicator Element Layer | Interpretation |
|---|---|
| Per capita annual income | The average annual income per person, which reflects the economic situation of the household |
| Per capita poverty alleviation funds for the NTFPs industry | Funds provided to lower-income farmers by the government to develop the NTFPs industry |
| Proportion of poverty alleviation through the NTFPs industry | The proportion of lower-income households who achieve poverty alleviation through the NTFPs industry, which can explain the contribution rate of the NTFPs industry to lower-income households |
| Proportion of revenue from the NTFPs industry within total revenue | The proportion of lower-income households who achieve poverty alleviation through the NTFPs industry, which reflects the direct economic benefits of the NTFPs industry for lower-income households |
| The benefits to the lower-income population from the NTFPs industry | The number of lower-income households participating in the NTFPs industry (higher values indicate a stronger driving force of the NTFPs industry on the economy of lower-income households) |
| Electricity access rate Water access rate Highway access rate Internet access rate | The electricity, water, highway and internet access rates in the study area, which indicate improvements in the production conditions of the NTFPs industry |
| Forest coverage rate | Forest coverage rate is an important indicator reflecting the amount of forest resources and forest land occupation in a region, which is an important indicator for the sustainable development of ecological environments |
| Satisfaction rate with the treatment of wastewater from the NTFPs industry Satisfaction rate with the disposal of waste from the NTFPs industry | NTFPs industry development can produce sewage and domestic garbage (the more satisfied lower-income households are with the waste treatment, the lower the impact of the NTFPs industry on the ecological environment) |
| The degree of soil and plant protection | The development of the NTFPs industry affects surrounding soil and plant ecosystems (the degree of soil and plant protection reflects the impact of NTFPs industry development on ecosystems) |
| Proportion of households participating in NTFPs cooperatives Proportion of households participating in leading NTFPs enterprise | Cooperatives and enterprises can integrate resources and provide technology, markets and other services for the development of the NTFPs industry (the higher the proportion of lower-income households participating in cooperatives and enterprises, the stronger their developmental capacity) |
| Proportion of the young labor force | The young labor force is vital for the development of the NTFPs industry (the higher the proportion of the young labor force, the more sustainable the income increase) |
| Education level of lower-income households | The higher the education level of lower-income households, the more positive their thinking, the higher their degree of training and the stronger their developmental ability |
| Proportion of households receiving NTFPs-related skills training | The more that lower-income households receive training related to the NTFPs industry, the more sustainable the poverty alleviation performance of the NFTPs industry |
| The positive outlook rate for NTFPs industry development | Households are the main body of the development of the NTFPs industry (the more optimistic they are about the industry, the more sustainable its development) |
| The support rate for the expansion of the NTFPs industry | Expanding the scale of the NTFPs industry is conducive to the further development of the NTFPs industry and the sustainable poverty alleviation performance of the NTFPs industry |
| The support rate for the increase in NTFPs industry funds | Lower-income households can use their funds for the development of various industries (the higher the proportion of funds used for the development of the NTFPs industry, the more sustainable the NTFPs industry) |
| Proportion of households using new energy | The use of new energy is conducive to ecological environment protection (the proportion of households using new energy reflects the sustainability of ecological protection) |
| The importance of ecological protection | The degree to which lower-income households think ecological protection is important directly reflects the sustainability of ecological protection |
| Satisfaction with the poverty alleviation policy of the NTFPs industry | The policy is an important basis and guarantee for carrying out poverty alleviation through the NTFPs industry (the satisfaction of lower-income households with the poverty alleviation policy of the NTFPs industry directly reflects the implementation of the poverty alleviation policy) |
| Satisfaction with poverty alleviation projects within the NTFPs industry | These projects are important for carrying out poverty alleviation through the NTFPs industry (the higher the satisfaction with the projects, the more suitable the projects are for local development and the more able they are to drive lower-income households out of poverty) |
| Satisfaction with the poverty exit mechanism | Whether the exit mechanism is fair and whether lower-income households are satisfied with the exit mechanism are important indicators for measuring satisfaction with poverty alleviation performance |
| Satisfaction with the NTFPs production conditions in the study area | This indicator demonstrates whether the current infrastructure meets the needs of NTFPs industry development in the view of lower-income households (the more satisfied lower-income households are with the production conditions, the more effective the poverty alleviation policy in improving the production conditions) |
| Satisfaction with the development of the NTFPs industry | The development of the NTFPs industry is an important indicator reflecting its poverty alleviation effect (the satisfaction of lower-income households with the development of the NTFPs industry measures their satisfaction with its poverty alleviation effect) |
| Satisfaction with ecological environment protection | The development of the NTFPs industry could not only improve economic situations but could also play a role in protecting the environment (the protection of ecological environments is also a reflection of the poverty alleviation effect) |
| Number | Comparison Values | Meaning |
|---|---|---|
| 1 | 1 | Both are of the same importance |
| 2 | 3 | The former is slightly more important than the latter |
| 3 | 5 | The former is somewhat more important than the latter |
| 4 | 7 | The former is much more important than the latter |
| 5 | 9 | The former is significantly more important than the latter |
| 6 | 2, 4, 6 and 8 | The intermediate values between the above adjacent judgments |
| Proportion of Households Participating in NTFPs Cooperatives | Proportion of Households Participating in Leading NTFPs Enterprises | Proportion of the Young Labor Force | Average Education Level of the Young Labor Force | Proportion of Households Receiving Professional Skills Training Related to the NTFPs Industry | |
|---|---|---|---|---|---|
| Proportion of households participating in NTFPs cooperatives | 1 | 1.8571 | 1.2857 | 1 | 0.8889 |
| Proportion of households participating in leading NTFPs enterprises | 0.5385 | 1 | 1.3750 | 1.7778 | 1.8000 |
| Proportion of the young labor force | 0.7778 | 0.7273 | 1 | 1.1667 | 1.4000 |
| Average education level of the young labor force | 1 | 0.5625 | 0.8571 | 1 | 1.88889 |
| Proportion of households receiving professional skills training related to the NTFPs industry | 1.1250 | 0.5556 | 0.7143 | 0.5294 | 1 |
| n * | 1 | 2 | 3 | 4 | 5 | 6 | 7 | 8 | 9 | 10 | 11 | 12 | 13 | 14 | 15 |
|---|---|---|---|---|---|---|---|---|---|---|---|---|---|---|---|
| R.I. | 0 | 0 | 0.52 | 0.89 | 1.12 | 1.26 | 1.36 | 1.41 | 1.46 | 1.49 | 1.52 | 1.54 | 1.56 | 1.58 | 1.59 |
| Judgement Matrix | λmax | n | C.I. | C.R. |
|---|---|---|---|---|
| A–B | 3.0462 | 3 | 0.0231 | 0.0444 |
| B1–C | 3.0308 | 3 | 0.0154 | 0.0296 |
| B2–C | 3.0431 | 3 | 0.0216 | 0.0415 |
| B3–C | 2.0000 | 2 | 0 | 0 |
| C1–D | 5.2985 | 5 | 0.0746 | 0.0666 |
| C2–D | 4.0755 | 4 | 0.0252 | 0.0283 |
| C3–D | 4.0386 | 4 | 0.0129 | 0.0145 |
| C4–D | 5.2276 | 5 | 0.0569 | 0.0508 |
| C5–D | 3.0003 | 3 | 0.0002 | 0.0003 |
| C6–D | 2.0000 | 2 | 0 | 0 |
| C7–D | 3.0047 | 3 | 0.0024 | 0.0045 |
| C8–D | 3.0249 | 3 | 0.0125 | 0.0239 |
| Indicator Element Layer | Unit | Investigation or Calculation Method | Reference Value | Determination Method * |
|---|---|---|---|---|
| Per capita annual income (D11) | CNY | Annual household net income/Permanent household population | CNY 2952 | A |
| Per capita poverty alleviation funds for the NTFPs industry (D12) | CNY | Poverty alleviation funds for the NTFPs industry/Total lower-income population | CNY 1193.52 | A |
| Proportion of poverty alleviation through the NTFPs industry (D13) | % | Population lifted out of poverty through the NTFPs industry/Total population lifted out of poverty × 100% | 26.5% | A |
| Proportion of revenue from the NTFPs industry within total revenue (D14) | % | NTFPs industry revenue/Total revenue × 100% | 3.5% | C |
| The benefits to the lower-income population from the NTFPs industry (D15) | % | Population lifted out of poverty through the NTFPs industry/Total lower-income population × 100% | 15% | A |
| Electricity access rate (D21) | % | Number of households with access to electricity/Total number of lower-income households × 100% | 100% | B |
| Water access rate (D22) | % | Number of households with access to water/Total number of lower-income households × 100% | 100% | B |
| Highway access rate (D23) | % | Number of households with access to highways/Total number of lower-income households × 100% | 100% | B |
| Internet access rate (D24) | % | Number of households with internet access/Total number of lower-income households × 100% | 100% | B |
| Forest coverage rate (D31) | % | Area of forest/Total land area × 100% | 78.98% | C |
| Satisfaction rate with the treatment of wastewater from the NTFPs industry (D32) | % | Number of lower-income households satisfied with the treatment of wastewater from the NTFPs industry/Total number of lower-income households × 100% | 100% | B |
| Satisfaction rate with the disposal of waste from the NTFPs industry (D33) | % | Number of lower-income households satisfied with the disposal of waste from the NTFPs industry/Total number of lower-income households × 100% | 100% | B |
| The degree of soil and plant protection (D34) | % | Number of lower-income households satisfied with soil and plant protection/Total number of lower-income households × 100% | 100% | B |
| The proportion of households participating in NTFPs cooperatives (D41) | % | Number of households participating in NTFPs cooperatives/Total number of lower-income households × 100% | 100% | B |
| The proportion of households participating in leading NTFPs enterprises (D42) | % | Number of households participating in leading NTFPs enterprises/Total number of lower-income households × 100% | 100% | B |
| Proportion of the young labor force (D43) | % | Labor force aged 16–44/Total labor force × 100% | 80% | D |
| Education level of lower-income households (D44) | Years | Total number of years in education of lower-income households/Total number of lower-income households | 7.06 | C |
| Proportion of households receiving NTFPs-related skills training (D45) | % | Number of households receiving NTFPs-related skills training/Total number of lower-income households × 100% | 100% | B |
| The positive outlook rate for NTFPs industry development (D51) | % | Number of households with a positive outlook on the NTFPs industry/Total number of lower-income households × 100% | 100% | B |
| The support rate for the expansion of the NTFPs industry (D52) | % | Number of households supporting the expansion of the NTFPs industry/Total number of lower-income households × 100% | 100% | B |
| The support rate for the increase in NTFPs industry funds (D53) | % | Funds for developing the NTFPs industry/Total funds for developing all industries × 100% | 100% | B |
| Proportion of households using new energy (D61) | % | Number of households using new energy/Total number of lower-income households × 100% | 100% | B |
| The importance of ecological protection (D62) | % | Number of lower-income households willing to invest time and money in ecological protection/Total number of lower-income households × 100% | 100% | B |
| Satisfaction with the poverty alleviation policy of the NTFPs industry (D71) | % | Number of households satisfied with the poverty alleviation policy of the NTFPs industry/Total number of lower-income households × 100% | 100% | B |
| Satisfaction with poverty alleviation projects within the NTFPs industry (D72) | % | Number of households satisfied with poverty alleviation projects within the NTFPs industry/Total number of lower-income households × 100% | 100% | B |
| Satisfaction with the poverty exit mechanism (D73) | % | Number of households satisfied with the poverty exit mechanism/Total number of lower-income households × 100% | 100% | B |
| Satisfaction with the NTFPs production conditions in the study area (D81) | % | Number of households satisfied with the NTFPs production conditions in the study area/Total number of lower-income households × 100% | 100% | B |
| Satisfaction with the development of the NTFPs industry (D82) | % | Number of households satisfied with the development of the NTFPs industry/Total number of lower-income households × 100% | 100% | B |
| Satisfaction with ecological environment protection (D83) | % | Number of households satisfied with their ecological environment/Total number of lower-income households × 100% | 100% | B |
| Characteristic | Category | Percentage |
|---|---|---|
| Gender | Male | 53.2% |
| Female | 46.8% | |
| Age * | 18–65 years old | 57.6% |
| 66–79 years old | 23.8% | |
| Over 80 years old | 18.6% | |
| Ethnicity | Han | 39.6% |
| Lisu | 58.3% | |
| Other | 2.1% | |
| Education level | Did not attend school | 4.6% |
| Primary school (Grades 1–6) | 25.6% | |
| Middle school (Grades 7–9) | 59.0% | |
| High school (Grades 10–) | 10.8% | |
| Social security ** | Medical insurance | 97.8% |
| Endowment insurance | 89.2% |
| Criterion Layer | Weight | Indicator Layer | Weight | Indicator Element Layer | Weight |
|---|---|---|---|---|---|
| The achievement of poverty alleviation (B1) | 0.5128 | Economic development (C1) | 0.2479 | Per capita annual income (D11) | 0.0925 |
| Per capita poverty alleviation funds for the NTFPs industry (D12) | 0.0423 | ||||
| Proportion of poverty alleviation through the NTFPs industry (D13) | 0.0587 | ||||
| Proportion of revenue from the NTFPs industry within total revenue (D14) | 0.0289 | ||||
| The benefits to the lower-income population from the NTFPs industry (D15) | 0.0255 | ||||
| Forest area construction (C2) | 0.1209 | Electricity access rate (D21) | 0.0452 | ||
| Water access rate (D22) | 0.0348 | ||||
| Highway access rate (D23) | 0.0277 | ||||
| Internet access rate (D24) | 0.0132 | ||||
| Ecological protection (C3) | 0.1440 | Forest coverage rate (D31) | 0.0537 | ||
| Satisfaction rate with the treatment of wastewater from the NTFPs industry (D32) | 0.0398 | ||||
| Satisfaction rate with the disposal of waste from the NTFPs industry (D33) | 0.0207 | ||||
| The degree of soil and plant protection (D34) | 0.0298 | ||||
| The sustainability of poverty alleviation (B2) | 0.3631 | Sustainability of income increase (C4) | 0.2140 | Proportion of households participating in NTFPs cooperatives (D41) | 0.0507 |
| Proportion of households participating in leading NTFPs enterprises (D42) | 0.0503 | ||||
| Proportion of the young labor force (D43) | 0.0399 | ||||
| Education level of lower-income households (D44) | 0.0411 | ||||
| Proportion of households receiving NTFPs-related skills training (D45) | 0.0320 | ||||
| Sustainability of the NTFPs industry (C5) | 0.0718 | The positive outlook rate for NTFPs industry development (D51) | 0.0277 | ||
| The support rate for the expansion of the NTFPs industry (D52) | 0.0218 | ||||
| The support rate for the increase in NTFPs industry funds (D53) | 0.0223 | ||||
| Sustainability of ecological protection (C6) | 0.0773 | Proportion of households using new energy (D61) | 0.0505 | ||
| The importance of ecological protection (D62) | 0.0268 | ||||
| Satisfaction with poverty alleviation (B3) | 0.1241 | Satisfaction with poverty alleviation work (C7) | 0.0564 | Satisfaction with the poverty alleviation policy of the NTFPs industry (D71) | 0.0239 |
| Satisfaction with poverty alleviation projects within the NTFPs industry (D72) | 0.0219 | ||||
| Satisfaction with the poverty exit mechanism (D73) | 0.0106 | ||||
| Satisfaction with poverty alleviation effect (C8) | 0.0677 | Satisfaction with the NTFPs production conditions in the study area (D81) | 0.0312 | ||
| Satisfaction with the development of the NTFPs industry (D82) | 0.0265 | ||||
| Satisfaction with ecological environment protection (D83) | 0.0100 |
| Criterion Layer | Indicator Layer | Indicator Element Layer | Reference Value | Actual Value | Weight (%) | Actual Score |
|---|---|---|---|---|---|---|
| The achievement of poverty alleviation (B1) | Economic development (C1) | Per capita annual income (D11) | 2952 | 2958.62 | 9.25 | 9.27 |
| Per capita poverty alleviation funds for the NTFPs industry (D12) | 1193.52 | 862.57 | 4.23 | 3.06 | ||
| Proportion of poverty alleviation through the NTFPs industry (D13) | 26.50% | 34.28% | 5.87 | 7.59 | ||
| Proportion of revenue from the NTFPs industry within total revenue (D14) | 3.50% | 4.60% | 2.89 | 3.80 | ||
| The benefits to the lower-income population from the NTFPs industry (D15) | 15% | 17.50% | 2.55 | 2.98 | ||
| 24.79 | 26.7 | |||||
| Forest area construction (C2) | Electricity access rate (D21) | 100% | 95% | 4.52 | 4.29 | |
| Water access rate (D22) | 100% | 80% | 3.48 | 2.78 | ||
| Highway access rate (D23) | 100% | 85% | 2.77 | 2.35 | ||
| Internet access rate (D24) | 100% | 65% | 1.32 | 0.86 | ||
| 12.09 | 10.28 | |||||
| Ecological protection (C3) | Forest coverage rate (D31) | 78.98% | 92.00% | 5.37 | 6.26 | |
| Satisfaction rate with the treatment of wastewater from the NTFPs industry (D32) | 100% | 85.50% | 3.98 | 3.40 | ||
| Satisfaction rate with the disposal of waste from the NTFPs industry (D33) | 100% | 70.60% | 2.07 | 1.46 | ||
| The degree of soil and plant protection (D34) | 100% | 82.70% | 2.98 | 2.46 | ||
| 14.4 | 13.58 | |||||
| The sustainability of poverty alleviation (B2) | Sustainability of income increase (C4) | Proportion of households participating in NTFPs cooperatives (D41) | 100% | 70.80% | 5.07 | 3.59 |
| Proportion of households participating in leading NTFPs enterprises (D42) | 100% | 12.50% | 5.03 | 0.63 | ||
| Proportion of the young labor force (D43) | 80% | 46.80% | 3.99 | 2.33 | ||
| Education level of lower-income households (D44) | 7.06 | 5.90 | 4.11 | 3.43 | ||
| Proportion of households receiving NTFPs-related skills training (D45) | 100% | 68.50% | 3.20 | 2.19 | ||
| 21.4 | 12.17 | |||||
| Sustainability of the NTFPs industry (C5) | The positive outlook rate for NTFPs industry development (D51) | 100% | 45.40% | 2.77 | 1.26 | |
| The support rate for the expansion of the NTFPs industry (D52) | 100% | 61.90% | 2.18 | 1.35 | ||
| The support rate for the increase in NTFPs industry funds (D53) | 100% | 60.80% | 2.23 | 1.36 | ||
| 7.18 | 3.97 | |||||
| Sustainability of ecological construction (C6) | Proportion of households using new energy (D61) | 100% | 9.80% | 5.05 | 0.49 | |
| The importance of ecological protection (D62) | 100% | 72.50% | 2.68 | 1.94 | ||
| 7.73 | 2.43 | |||||
| Satisfaction with poverty alleviation (B3) | Satisfaction with poverty alleviation work (C7) | Satisfaction with the poverty alleviation policy of the NTFPs industry (D71) | 100% | 80.50% | 2.39 | 1.92 |
| Satisfaction with poverty alleviation projects within the NTFPs industry (D72) | 100% | 75.50% | 2.19 | 1.65 | ||
| Satisfaction with the poverty exit mechanism (D73) | 100% | 85.50% | 1.06 | 0.91 | ||
| 5.64 | 4.48 | |||||
| Satisfaction with poverty alleviation effect (C8) | Satisfaction with the NTFPs production conditions in the study area (D81) | 100% | 78.50% | 3.12 | 2.45 | |
| Satisfaction with the development of the NTFPs industry (D82) | 100% | 90.50% | 2.65 | 2.40 | ||
| Satisfaction with ecological environment protection (D83) | 100% | 86.50% | 1.00 | 0.87 | ||
| 6.77 | 5.72 | |||||
| Final score | 79.33 |
| Indicator Element Layer | Weight |
|---|---|
| Per capita annual income (D11) | 0.0925 |
| The proportion of poverty alleviation through the NTFPs industry (D13) | 0.0587 |
| Forest coverage rate (D31) | 0.0537 |
| Proportion of households participating in NTFPs cooperatives (D41) | 0.0507 |
| Proportion of households using new energy (D61) | 0.0505 |
| Proportion of households participating in leading NTFPs enterprises (D42) | 0.0503 |
| Electricity access rate (D21) | 0.0452 |
| Per capita poverty alleviation funds for the NTFPs industry (D12) | 0.0423 |
| Education level of lower-income households (D44) | 0.0411 |
| Proportion of the young labor force (D43) | 0.0399 |
| Satisfaction rate with the treatment of wastewater from the NTFPs industry (D32) | 0.0398 |
| Water access rate (D22) | 0.0348 |
| Proportion of households receiving NTFPs-related skills training (D45) | 0.0320 |
| Satisfaction with the NTFPs production conditions in the study area (D81) | 0.0312 |
| The degree of soil and plant protection (D34) | 0.0298 |
| Proportion of revenue from the NTFPs industry within total revenue (D14) | 0.0289 |
| Highway access rate (D23) | 0.0277 |
| The positive outlook rate for NTFPs industry development (D51) | 0.0277 |
| The importance of ecological protection (D62) | 0.0268 |
| Satisfaction with the development of the NTFPs industry (D82) | 0.0265 |
| The benefits to the lower-income population from the NTFPs industry (D15) | 0.0255 |
| Satisfaction with the poverty alleviation policy of the NTFPs industry (D71) | 0.0239 |
| The support rate for the increase in NTFPs industry funds (D53) | 0.0223 |
| Satisfaction with poverty alleviation projects within the NTFPs industry (D72) | 0.0219 |
| The support rate for the expansion of the NTFPs industry (D52) | 0.0218 |
| Satisfaction rate with the disposal of waste from the NTFPs industry (D33) | 0.0207 |
| Internet access rate (D24) | 0.0132 |
| Satisfaction with the poverty exit mechanism (D73) | 0.0106 |
| Satisfaction with ecological environment protection (D83) | 0.0100 |
Disclaimer/Publisher’s Note: The statements, opinions and data contained in all publications are solely those of the individual author(s) and contributor(s) and not of MDPI and/or the editor(s). MDPI and/or the editor(s) disclaim responsibility for any injury to people or property resulting from any ideas, methods, instructions or products referred to in the content. |
© 2023 by the authors. Licensee MDPI, Basel, Switzerland. This article is an open access article distributed under the terms and conditions of the Creative Commons Attribution (CC BY) license (https://creativecommons.org/licenses/by/4.0/).
Share and Cite
Dou, Y.; Wu, J.; Li, Y.; Chen, X.; Zhao, X. Has the Development of the Non-Timber Forest Products Industry Achieved Poverty Alleviation? Evidence from Lower-Income Forest Areas in Yunnan Province. Forests 2023, 14, 776. https://doi.org/10.3390/f14040776
Dou Y, Wu J, Li Y, Chen X, Zhao X. Has the Development of the Non-Timber Forest Products Industry Achieved Poverty Alleviation? Evidence from Lower-Income Forest Areas in Yunnan Province. Forests. 2023; 14(4):776. https://doi.org/10.3390/f14040776
Chicago/Turabian StyleDou, Yaquan, Jian Wu, Ya Li, Xingliang Chen, and Xiaodi Zhao. 2023. "Has the Development of the Non-Timber Forest Products Industry Achieved Poverty Alleviation? Evidence from Lower-Income Forest Areas in Yunnan Province" Forests 14, no. 4: 776. https://doi.org/10.3390/f14040776
APA StyleDou, Y., Wu, J., Li, Y., Chen, X., & Zhao, X. (2023). Has the Development of the Non-Timber Forest Products Industry Achieved Poverty Alleviation? Evidence from Lower-Income Forest Areas in Yunnan Province. Forests, 14(4), 776. https://doi.org/10.3390/f14040776