Abstract
Guizhou Province is a typical representative karst region in China, with poverty and a fragile ecology, and knowledge of vegetation dynamics and its response to climate changes and human activities can provide basic information for ecological environmental resource management. Based on MOD13Q1 NDVI remote sensing products and meteorological data, spatial-temporal variations of NDVI in Guizhou Province from 2000 to 2021 were investigated using trend analysis, a coefficient of variation and the Hurst index. Simultaneously, the response to climate change and human activities was also explored using partial correlation and residual analysis. It was concluded that, firstly, the regional average NDVI in Guizhou Province displays a significant improving trend, with a rate of 0.056/10a from 2000 to 2021. NDVI in Guizhou Province displays notable spatial heterogeneity, with high values mainly concentrated in forests and woody savanna regions in eastern and northwestern Guizhou and low values distributed in croplands and rapid urban expansion regions in western and central Guizhou. In addition, the overall spatial distribution of NDVI displays an upward trend, and the area of extreme and light significant improvement accounts for 81.0% of Guizhou total area. Secondly, the NDVI variation in Guizhou Province is relatively stable and the area of lower-to-moderate fluctuation accounts for 90.1% of Guizhou total area; meanwhile, the future trend of NDVI variation in Guizhou is largely sustainable. Thirdly, the NDVI variations in Guizhou are more strongly influenced by air temperature than precipitation; meanwhile, compared to climatic factors, human activities have a stronger impact on vegetation dynamics in Guizhou Province. Fourthly, the trend, stability, sustainability and relationship with climatic factors and human activities of NDVI variations are varied among different vegetation types. These results will provide valuable information for ecosystem restoration and environment protection in Guizhou Province.
1. Introduction
Vegetation is a crucial component of terrestrial ecosystems, and it serves to regulate energy exchange, the water and carbon cycle, and the ecological balance [1,2,3,4]. The vegetation patterns of a region are sensitive to climate changes and human activities including ecological projects and urbanization expansion [5,6]. Taking into account the fact that vegetation dynamics is a long and complicated process, monitoring long-term data with high resolution is essential to an exploration of the spatial-temporal variations in vegetation cover. As a scientific and rapid developing monitoring and research tool, satellite remote sensing techniques have been widely employed in the field of ecological conservation and climate changes [7,8]. With a long continuous period and good data availability, normalized difference vegetation index (NDVI), derived from the ratio of difference between red and near-infrared reflectance to their sum, is applied most frequently for examining vegetation dynamics and its response to climate changes and environmental variations from a regional to a global level at seasonal, inter-annual and decadal scales [9,10,11,12]. Recently, numerous studies have been performed on the spatial-temporal changes of vegetation and its response to climate factors employing the satellite-based NDVI data [13,14,15,16,17,18,19,20]. In general, vegetation greenness has shown an increasing trend since the 1980s across China and the globe, but with spatial heterogeneity [13,21,22]. It is very important to further examine the spatial and temporal variations of vegetation greenness on a regional scale for ecological protection and sustainable development [7,8].
Numerous studies have revealed that NDVI displays a close connection to climate variables on different spatial-temporal scales [23,24,25]. Temperature and precipitation were believed to be the two most critical climatic factors on modulating vegetation variations [26]. For instance, vegetation coverage has been positively connected to the increasing temperature, acting as a determining factor in the regulation of vegetation greenness in most parts of China [17,19,27]. In contrast, the connection between vegetation dynamics and precipitation is a feature of geospatial heterogeneity. Autumn vegetation greenness showed a negative connection to precipitation due to cloudy days with precipitation preventing solar radiation reaching the ground and inhibiting photosynthesis in the Heilongjiang River Basin [17]. Global surface temperature increased by 0.99 °C in 2001–2020 compared to 1850–1900, and global land average precipitation has probably increased since 1950 [28]. Thus, the responses of vegetation dynamics to climate change on a regional and global scale have come to be a research hotspot worldwide in recent years.
Beyond climate factors, human activities are emerging as a crucial factor regulating the spatial-temporal variations in vegetation greenness. Along with economic development and urban expansion, vegetation in developed regions and their surroundings has been destroyed to a certain degree [29,30,31]. Meanwhile, adhering to the strategy of sustainable development, the Chinese government has invested a large amount of human and financial resources to improve vegetation greenness and the ecological environment. A series of huge ecological restoration projects has been proposed, for instance the Natural Forest Conservation Program and the Grain to Green Project [32,33]. These projects are intended to protect existing natural vegetation, improving the Earth’s surface greenness, and to prevent desertification and soil erosion. A more profound understanding of distinguishing vegetation dynamics responses to the human activities is of great significance for ecological restoration strategies.
Guizhou Province, situated on the east side of the Yunnan-Guizhou Plateau, China, features karst rocky desertification and extremely fragile ecological conditions [34,35]. In recent years, with the support of China’s Great Western Development policy, Guizhou Province has experienced rapid socio-economic development, and the impacts of economic activities on ecological conditions have been deepening. Meanwhile, the temperature variation in Guizhou Province has featured a remarkable warming trend since 1960 and the warming rates have risen significantly since 1990 [36]. Variations of temperature, precipitation and land coverage will have an impact to some extent on vegetation dynamics. Some existing studies have explored the spatio-temporal characteristics of vegetation dynamics in Guizhou Province and southwest China [8,37,38,39]. Based on the SPOT VEGETATION data with 1-km spatial resolution, Tian et al. (2017) examined the spatio-temporal features of vegetation dynamics in karst and non-karst areas during 1999–2015, and found that the average NDVI of the karst region is lower compared to that in non-karst areas [38]. Wei et al. (2021) also estimated vegetation variations and their connection with climatic changes and human activities during 1982–2015 in different geographical locations based on the GIMM NDVI dataset with a horizontal resolution of 8-km [37]. The above-mentioned studies mainly concerned the difference of vegetation dynamics in different areas based on the satellite-based NDVI with relatively rough horizontal resolution. There has still not been enough research on the sustainability of vegetation dynamics and its future trend in Guizhou Province. At the same time, the responses to climate changes and human activities, sustainability, and the future trend of the NDVI for different vegetation types in Guizhou still lack systematic study. Therefore, it is essential to carry out research on long-term spatio-temporal vegetation dynamics and its responses to climate changes and human activities in Guizhou Provinces using datasets with higher spatial resolution. Meanwhile, we are also trying to establish how the NDVI in different vegetation types varies, as well as the responses to climate changes and human activities.
Based on the above ideas, this study analyzed more comprehensively the spatial-temporal variations of NDVI across Guizhou Province, and its responses to climate changes and human activities based on the MOD13Q1 NDVI with a higher horizontal resolution of 250 m × 250 m, and air temperature and precipitation from 83 meteorological stations in Guizhou Province from 2000 to 2021. The purposes of this study were to investigate the spatio-temporal variations, sustainability and the future trends of NDVI across Guizhou and for different vegetation types, and to quantitatively establish the responses of vegetation dynamics to climatic changes and human activities.
2. Materials and Methods
2.1. Study Area
Guizhou Province is located in the southwestern part of China (24°37′–29°13′ N, 103°36′–109°35′ N), and covers an area of 176,167 km2 (Figure 1a). The terrain increases from 121 m to 2887 m and has a declining slope from the west to the east, with an average altitude of 1100 m. Guizhou Province has the most concentrated distribution of karst landscape with abundant carbonate rocks, comprising 64.2% of the total area of the province [37]. The climate of Guizhou Province is a subtropical humid monsoon climate area. The annual average temperature is 15 °C, and the temperature for the coldest month (January) is between 3 °C and 6 °C, whilst that of the hottest month (July) is between 22 °C and 25 °C. Annual mean precipitation ranges from 1100–1300 mm and has an increasing slope from north to south [40]. Precipitation is mainly during April to October, accounting for nearly 80% of the total annual precipitation. Proper temperature and ample precipitation are beneficial to plants prospering and diversifying.
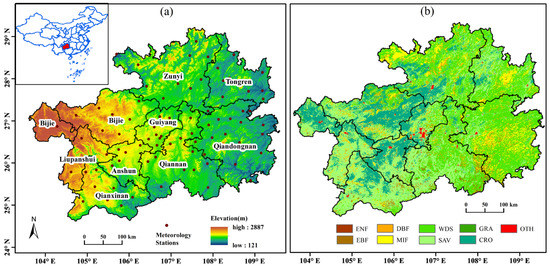
Figure 1.
(a) Elevation and location of 83 national benchmark/basic meteorologic stations. The inlets in (a) show the location of Guizhou province. (b) Spatial distribution of vegetation. ENF, EBF, DBF, MIF, WDS, SAV, GRA, CRO and OTH represent evergreen needleleaf forest, evergreen broadleaf forest, deciduous broadleaf forest, broadleaf and needleleaf mixed forest, woody savannas, savannas, grasslands, croplands, and others (including urban and built-up lands, barren, permanent wetlands), respectively.
2.2. Datasets
The datasets applied in the present study consist of meteorological site observation data, NDVI data, data on vegetation types, and altitude data. The meteorological data comprise monthly temperature and precipitation during 2000–2021 for 83 national benchmark/basic meteorologic stations in Guizhou Province, which was obtained from the China Meteorological Data (Figure 1a). These meteorological data include information about station number, latitude, longitude, elevation, year, month, as well as date of each observation, quality controlling code, and other information. Annual cumulative precipitation and average temperature is calculated using the sum and averages of daily values during the corresponding year, respectively. The consistency of the meteorological data was examined, and we found there was a small amount of missing data. The missing data at a station were ignored in this study. Furthermore, a bilinear interpolation method was adopted to obtain data about the annual average temperature and precipitation in the Guizhou region with a horizontal resolution of 250 m to match NDVI datasets.
The satellite-based NDVI data of Terra-MOD13Q1 V6 was gained from the Level-1 and Atmosphere Archive & Distribution System Distributed Active Archive Center (LAADS DAAC, https://ladsweb.modaps.eosdis.nasa.gov/search/order/1/MOD13Q1--6, accessed on 1 July 2022). The NDVI dataset has a 250 m horizontal resolution and a temporal resolution of 16 days and has been available from 2000 to the present. In order to minimize the impact of cloud cover, monthly NDVI was calculated based on the method of maximum value composite (MVC) from original data. The annual NDVI was then calculated as the average value from January to December for each year from 2000 to 2021. Owing to the fact that the NDVI data available start in February 18, the annual value of 2000 is calculated as the average value from February 18 to December in 2000.
Data about vegetation types were gained from the refined MODIS land cover product in 2020 (MCD12Q1, V6, https://ladsweb.modaps.eosdis.nasa.gov/search/order/1/MOD13Q1--6, accessed on 1 July 2022), which has a spatial resolution of 500m and has been re-interpolated to 250m resolution to match with NDVI dataset using a bilinear interpolation method. The International Geosphere Biosphere Programme (IGBP) classification scheme identifies seventeen land cover classes including eleven natural vegetation classes, three developed and mosaicked land classes, and three non-vegetated land classes. By applying the IGBP classification scheme, we extracted nine land cover types (Figure 1b): evergreen needleleaf forest (ENF), evergreen broadleaf forest (EBF), deciduous broadleaf forest (DBF), broadleaf and needleleaf mixed forest (MIF), woody savannas (WDS), savannas (SAV), grasslands (GRA), croplands (CRO), and others (OTH), respectively. Cropland consists of croplands and cropland natural vegetation mosaics, and others include urban and built-up lands, barren, permanent wetlands.
The data processing and maps in this study were generated by NCAR Command Language (NCL; The NCAR Command Language (Version 6.6.2) [Software]. (2019). Boulder, CO, USA: UCAR/NCAR/CISL/TDD. https://www.ncl.ucar.edu, accessed on 20 July 2022). The NCL is an interpreted language designed specifically for scientific data analysis and visualization, and supports those data stored in the format of NetCDF, GRIB, HDF, HDF-EOS, shapefile, ASCII, and binary. In view of the fact that the MODIS data (NDVI and land cover) and climate data are stored in HDF and ASCII formats, respectively, we can directly process and analyze them based on the NCL. Digital elevation data with a spatial resolution of 30 m were extracted from the Advanced Spaceborne Thermal Emission and Reflection Radiometer Global Digital Elevation Model (ASTER GDEM V3), which was downloaded from the geospatial data cloud platform (http://www.gscloud.cn, accessed on 2 November 2022). A shapefile of Guizhou gained from Resource and Environment Science and Data Center was employed to extract the Guizhou region (https://www.resdc.cn, accessed on 20 August 2022). In addition, in need of a special note is the fact that the maps of the study area and land cover were drawn by ArcGIS 10.5.
2.3. Research Methods
2.3.1. Trend Analysis Method
This study employs the Theil–Sen (TS) [41,42] trend estimation and Mann–Kendall (M–K) trend significance to examine the long-term trend of NDVI and climate factors. The TS trend estimation is insensitive to outliers, and it could be more precise for skewed and heteroskedastic data. It also competes well against non-robust least squares. The TS median trend is calculated using
where Xk and Xi indicate the NDVI values of years i and k, respectively. n is the length of the studying period (2000–2021, 22 years). The NDVI displays an increasing trend when the TS > 0, and vice versa.
TS = median ((Xk − Xi)/(k − i)); 0 < i< k < n
The M–K test is employed to evaluate statistical significance of TS trend. As a non-parametric test, the M–K method does not require the sample data to follow a certain distribution and is more resistant to outliers and data errors. Hence, it has been widely applied to detect a monotonic trend in the area of ecological and climate change. The M–K significance test is calculated as follows:
where
where and represent the NDVI values of years i and k, n is the length of time series (2000–2021, 22 years), and is the sgn function, respectively. The statistic Z follows a standard normal distribution, and its value varies between −∞ and +∞. It represents an increasing trend when the value of Z is greater than 0, and vice versa. A value of |Z| greater than 1.96 and 2.58 indicates that the trend is significantly exceeding the 0.01 and 0.05 confidence level. In this research, the NDVI trend is a classification based on the combination of the TS trend and the MK significance test (Table 1).

Table 1.
Classification of NDVI trend based on the TS trend and MK test.
2.3.2. Coefficient of Variation
The coefficient of variation (CV) can be employed to detect the spatial fluctuation of vegetation to mirror the discrete degree for the NDVI [43,44]. The CV can be calculated as follows [45]:
where represents the NDVI values of years i and n is the length of studying period (2000–2021, 22 years). indicates the value averaged from 2000 to 2021. A larger CV indicates greater fluctuation in annual variation of the NDVI, while a smaller CV represents more robustness in the NDVI variations. To further evaluate the variation degree in quantitative terms, based on the actual situation in Guizhou Province and with reference to completed research [38,46], the CV was classified as five levels, namely, lower fluctuation (CV < 0.086), low fluctuation (0.086 ≤ CV < 0.1081), moderate fluctuation (0.1081 ≤ CV < 0.1286), high fluctuation (0.1286 ≤ CV < 0.1558), and higher fluctuation (CV ≥ 0.1558).
2.3.3. Hurst Index
The Hurst index can be employed to mirror the future evolution trend of NDVI variations in Guizhou Province. The rescales range (R/S) analysis method has been used to calculate the Hurst index of annual average NDVI [47]. The basic procedure of the R/S analysis was referred to existing relevant studies [20,38] and was conducted by the NCL. It indicates that the future trend is random and inconclusive when the value of the Hurst index is equal to 0.5 (H = 0.5). Those values of the Hurst index range from 0.5 to 1 indicate that a variable trend of NDVI in future is sustainable and is in line with the past, meanwhile, a larger Hurst index indicates stronger sustainability. Those which range from 0 to 0.5 (0 < H < 0.5) reveal that the future trend of NDVI is unsustainable and contrary to that of the past, whilst a smaller Hurst index means weaker sustainability. In accordance with the combination of the TS trend and the Hurst index, we classified the NDVI variable trend of the future into nine categories. Details are illustrated in Table 2.
Table 2.
Classification for sustainability and trend of the NDVI.
2.3.4. Partial Correlation Analysis
NDVI variations are very complex and may be simultaneously influenced by both temperature and precipitation. Hence, the relationship of the NDVI to temperature and precipitation was examined by using the partial correlation method. The calculating Equation is displayed as follows:
where represents the annual average NDVI during 2000–2021, and indicate the temperature or precipitation. is the partial correlation coefficient between and when is fixed. , , and are the linear correlation between and , and , and , respectively. The degree of correlation is divided into six types. Details are described in Table 3.
Table 3.
Classification of partial correlation coefficients. R and |α| Represents partial correlation coefficient and confidence level.
2.3.5. Residual Analysis
The vegetation dynamics are simultaneously impacted by climate changes and human activities. In this study, the residual analysis method is employed to separate vegetation variations induced by human activities from variations due to climate changes [20,48]. Firstly, a multiple regression analysis method was used to calculate the predicted NDVI (NDVIpred) as follow formula, which could represent the impacts induced by climate changes.
Then, the differences between the observed and predicted NDVI calculated according to the following formula are the NDVI residuals (NDVIresi) representing the response of vegetation dynamics to human activities.
A combination of the TS trend and the MK test method was also employed to detect the change trend of residual NDVI during 2000 to 2021. When the trend of the residuals is insignificant, NDVI variations are explained by climatic trend. In contrast to the above, changes in NDVI are explained by human activities [20]. Referring to the method of Liu et al., 2021 [31] and Gao et al., 2022 [49], the relative contribution rates of climatic trend and human activities are calculated as follows:
rclim and rhuman represent the relative contribution rates of climatic changes and human activities, respectively. In addition, the specific definition and classification of the relative contribution rates of climatic changes and human activities are also illustrated in Table 4.
Table 4.
Relative contribution rates of climatic changes and human activities to NDVI trend.
3. Results
3.1. Vegetation Dynamics Trend during 2000–2021
3.1.1. Spatial Pattern
The spatial pattern of the average annual NDVI in Guizhou Province during 2000–2021 is displayed in Figure 2a. The overall vegetation distribution of NDVI in Guizhou Province featured a prominent spatial heterogeneity, decreasing from the southeast to the northwest. Higher NDVI values were distributed across Qiandongnan, northwestern Zunyi, eastern Tongren, Qiannan, and southeastern Qianxinan, due to the larger areas of forests and woody savannas with more evergreen plants. The planting of seasonal croplands in the west and rapid urban expansion and frequent human activities in the central urban areas have a large impact on NDVI variations, hence NDVI across these regions was notably lower than those over other regions. The NDVI values ranged from 0.07 to 0.79 and were mainly distributed between 0.5 to 0.8, accounting for about 93% of the total studying area (Figure 2b). Based on the TS trend and the MK test, the variations in annual mean NDVI (Figure 2c,d) showed a significant improving trend in the western, northern, and southwestern Guizhou Province, with an annual variable rate of up to 0.05/10a. The vegetation greenness showed a decreasing trend and was distributed in eastern Guizhou Province and scattered in the central urban built-up areas. For instance, a notably decreasing trend occurred across southern Guiyang, including Yunyan-Nanming old town, Guanshanhu, Huaxi, and Qingzhen district owing to rapid urban expansion. Meanwhile, notable vegetation greenness deterioration was also seen across the Huichuan and Bozhou districts in Zunyi. Therefore, vegetation variations in Guizhou Province displayed regional differences. In order to quantitatively examine NDVI variations, the vegetation changes in Guizhou Province during 2000–2021 were classified into six classes (Table 1), and the percentage of NDVI values for different grades was also counted in Figure 2e. Most vegetated regions (96.71%) showed an improving trend in Guizhou Province, including both an extremely and lightly significant improving trend, accounting for 68.18% and 12.83%, respectively. Only a small part (3.29%) displayed a decreasing trend, with an extremely and lightly significant decreasing trend accounting for 0.46% and 0.38%, respectively. Meanwhile, the percentages of the NDVI trend in different vegetation types were counted in Figure 2e. Over the last 22 years, the NDVI trends have been different for the eight vegetation types, and greater proportions in terms of improvement in vegetation were detected for savannas and woody savannas more than for forests, croplands and grasslands. Savannas account for 78.83% and 8.8% of areas with an extremely and lightly significant increasing trend, respectively, followed by woody savannas, mixed forests, evergreen broadleaf forests, evergreen needleleaf forests, and deciduous broadleaf forests. For croplands, 66.67% and 4.12% of areas displayed an extremely and lightly significant improvement, respectively, and the extremely and lightly significant increasing areas of grasslands were 42.14% and 7.72%. The regions with an extremely and lightly decreasing trend account for 11.81% and 5.78% for grasslands, 5.15% and 5.50% for croplands, respectively, however, the proportion of areas with a significant decrease for savannas, woody savannas, mixed forests, evergreen broadleaf forests, evergreen needleleaf forests, and deciduous broadleaf forests are nearly equal to zero.
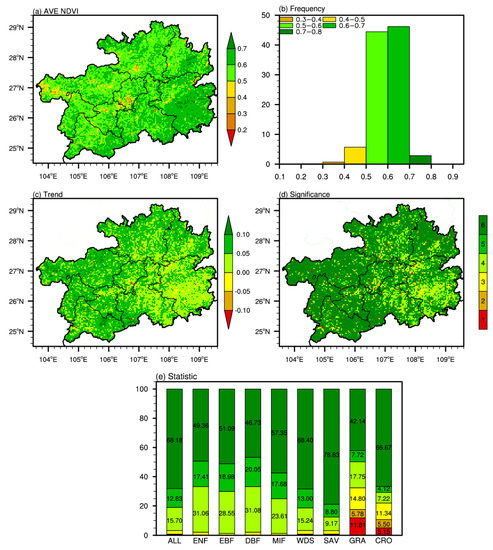
Figure 2.
Spatial distribution (a), frequency graph (b), MK trend (unit:/10a) (c), significance of NDVI trend (d), and statistical percentage of NDVI trend for Guizhou regional mean and different vegetation types (e). (e,d) share a common color bar. The specific details for the number 1 to 6 can be seen in Table 1. The symbols of “ALL” to “CRO” in (e) are the same as Figure 1b.
3.1.2. Temporal Variation
Figure 3 displays the interannual variation of the regional mean NDVI for the total studying area and the different vegetation types. Specifically, the regional mean NDVI displays a significant upward trend (0.056/10a), and it shows prominent interannual variations with a notable decreasing (improving) trend during 2000, 2005, 2010–2012, 2014, and 2020 (2001–2004, 2007–2009, 2013, 2015–2017, and 2021), respectively. These large decreasing years can well match with extreme climatic drought events [50]. The annual NDVI of different vegetation types ranges from highest to lowest in the following order: forests, woody savannas, savannas, grasslands, and croplands (Figure 3b). With regard to the temporal NDVI variations for mixed forests, evergreen broadleaf forests, evergreen needleleaf forests, and deciduous broadleaf forests are almost same at annual time scales, only the sum of the four forests was analyzed here. The NDVI value ranges from 0.55 to 0.76 for forests, was 0.51–0.68 for woody savannas, 0.45–0.61 for savannas, 0.40–0.48 for grasslands and 0.33–0.43 for croplands. The NDVI in different vegetation types also displayed a significant upward trend with forests (0.058/10a), woody savannas (0.058/10a), savannas (0.059/10a), grasslands (0.019/10a) and croplands (0.025/10a), respectively. The NDVI in the eight vegetation types are a strong response to the extreme drought with a large decreasing trend during 2009–2012.
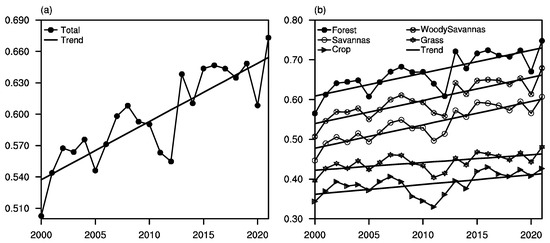
Figure 3.
Interannual variations in annual-mean NDVI for (a) regional mean in Guizhou Province, and (b) different vegetation types in Guizhou Province during 2000–2021.
3.2. Vegetation Stability and Sustainability
3.2.1. Stability
Referring to the classification method of Xu 2002 and Tian et al., 2017 [38,46], the vegetation stability was classified into five groups on the basis of the CV values. As shown in Figure 4, the CV ranged from 0.03 to 0.67. Specifically, areas of lower, low, and moderate fluctuation in NDVI accounted for 90.2%, whereas areas of high and higher fluctuations only accounted for 9.8%. These results indicate that the vegetation variations are stable in most parts of Guizhou Province. The spatial distribution of the CV value showed a decrease from the west to the east. Specifically, higher, high, and moderate fluctuations mainly occur across Bijie, Liupanshui, Anshun, Guiyang, northwestern Zunyi, western Tongren, Qianxinan, and southwestern Qiannan, whereas lower and low fluctuations mainly appear across Qiandongnan, southern Tongren, eastern Guiyang, and eastern Qiannan. The spatial distribution of vegetation stability was quite similar to that of the NDVI (Figure 2), indicating that high vegetation coverage tends to appear with high stability. Furthermore, proportions of areas for the stability in different vegetation types were also examined in Figure 4b. The stability was different among the eight vegetation types, with greater proportions of lower and low fluctuation appearing in evergreen needleleaf forests, deciduous broadleaf forests, evergreen broadleaf forests, and mixed forests compared to those of woody savannas, savannas, grasslands and croplands. The evergreen needleleaf forest accounted for 48.9%, 40.2%, and 10.7% of areas with lower, low, and moderate fluctuation, respectively, followed by deciduous broadleaf forests, evergreen broadleaf forests and mixed forests, respectively. For woody savannas, 32.9%, 40.5%, and 19.1% of areas showed lower, low, and moderate fluctuation, respectively. In addition, the lower, low, and moderate fluctuation areas of savannas were 16.1%, 36.7%, and 29.2%, and the proportion of higher and high fluctuation was 3.7% and 14.27%. In contrast, the proportion of higher and high fluctuation for grasslands and croplands were clearly greater than other vegetation types. Specifically, the croplands (grasslands) showed 60.8% (25.9%) and 19.59% (15.4%) higher and high fluctuation, which was consistent with the NDVI trend. It indicates that the vegetation type with a larger portion of the decreasing trend tends to be more unstable compared to that with a smaller portion of the decreasing trend.
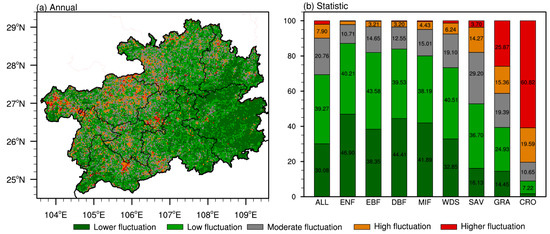
Figure 4.
Spatial distribution of NDVI stability levels in Guizhou from 2000 to 2021 (a), Statistical results of the percentage changes in NDVI stability for Guizhou regional mean and different vegetation types (b). The symbols of “ALL” to “CRO” in (b) are the same as Figure 1b.
3.2.2. Sustainability
The NDVI sustainability in Guizhou Province was also further examined using a Hurst index method in Figure 5. The spatial distribution of the Hurst index value exhibited a decrease from the west to east of the area studied, with higher values occurring across Bijie, Liupanshui, Qianxinan, northwestern Tongren, and southwestern Qiannan. Over the total region studied, the proportion of higher and high sustainability were 56.0% and 43.8%, respectively, whereas that of unsustainability was very small. Specifically, savannas, grasslands, and croplands showed the highest sustainability, followed by woody savannas and forests. Based on the combination of the TS trend, the MK test and the Hurst index, the sustainability of NDVI was classified into nine grades (Table 2). Consistent with the spatial pattern of NDVI trend, the vegetation greenness exhibited a sustainable significant increasing trend accounting for 80.9%, except for a small proportion (11.0%) of sustainable significant decrease scattered in central and eastern Guizhou Province. In addition, the sustainability of the NDVI trend in future is clearly different among the eight vegetation types. Specifically, the savannas and woody savannas exhibited the largest sustainable increasing trend, with the proportion of strong and light sustainable and significant increasing trends being 64.7%, 48.2% and 23.0%, 33.2%, respectively. Among the four types of forests, mixed forests exhibited the greatest proportion of strong and light sustainable significant increasing trends with 35.7% and 39.2%, followed by evergreen broadleaf forests (34.7%, 35.2%), evergreen needleleaf forests (32.3%, 34.2%) and deciduous broadleaf forests (28.7%, 38.0%), respectively. The proportion of strong and light sustainable significant increase for croplands and grasslands was 36.0%, 52.9% and 13.8%, 52.9%; meanwhile, the strong and light sustainable significant decrease was 4.8%, 12.7%, and 5.8%, 4.8%, respectively.
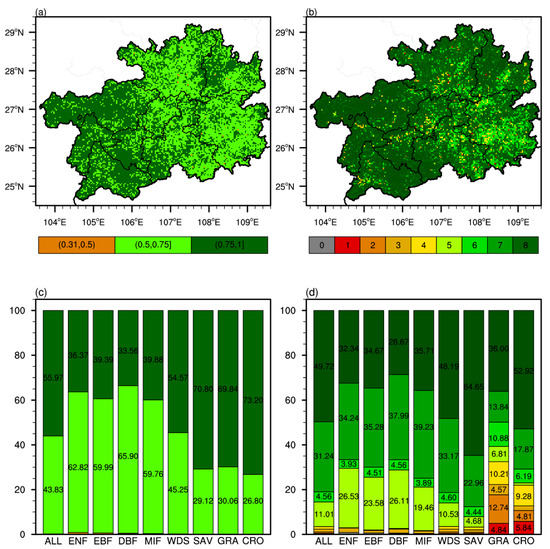
Figure 5.
Spatial distribution of the Hurst exponent (a), consistency of NDVI trend (b) in Guizhou from 2000–2021. Statistical results of the percentage changes in the Hurst exponent (c) and consistency (d) for Guizhou regional mean and different vegetation types. The symbols of “ALL” to “CRO” in (c–d) are the same as Figure 1b. The legend of (c,d) are the same as that of (a,b), respectively. Details of the number 1 to 8 are seen in Table 2.
Hence, according to the results above, vegetation greenness for the four types of forests showed the largest stability, followed by woody savannas and savannas. In contrast, vegetation greenness of croplands showed the weakest stability, followed by grasslands. In addition, vegetation greenness for woody savannas and savannas exhibited the largest sustainable significant increasing trend, followed by the forests and croplands, and the grasslands showed the smallest sustainable significant increasing trend. Meanwhile, the grasslands exhibited a larger sustainable significant decreasing trend, followed by croplands, compared to the other vegetation types with a small proportion of decreasing trends.
3.3. Climatic Changes
3.3.1. Spatial-Temporal Variations of Climatic Factors
Figure 6 shows the spatio-temporal variations of air temperature and precipitation. The regional annual mean temperature ranged from 15.1 °C (observed in 2012) and 16.4 °C (in 2016) during 2000 to 2021 in Guizhou Province, with an average value of 15.9 °C and standard deviation of 0.37 °C. The regional mean temperature exhibited a light increasing trend, with a change rate of 0.18 °C/10a, indicating a light warming trend in Guizhou Province during 2000 to 2021. Though the warming trend of the regional mean temperature in Guizhou Province is not significant, the spatial distribution showed prominent heterogeneity, with a significant increase over Weining, Shuicheng, Wangmo, Huishui, Libo, Qiandongnan, Shiqian, Songtao, Chishui and Xishui. Weak cooling trend appeared over Panxian, northern Tongzi, Deijiang and Duyun. The proportion of areas with a positive and negative trend accounted 60% and 40%, respectively, indicating that the overall temperature in Guizhou Province is characterized by a warming trend, which is weaker than warming both in the whole of China and globally. The regional annual mean precipitation ranged from 856.6 mm (observed in 2011) to 1449.0 mm (in 2020), with an average value of 1193.0 mm and a standard deviation of 144.4 mm. It exhibited an insignificant increasing trend in Guizhou Province during 2000–2021, with a change rate of 69.0 mm/10a. The lowest precipitation is 856.6 mm took place in 2011, which is well matched with the lowest NDVI value, which occurred in 2011 and 2012, indicating that the drought which took place in 2011 plays an important role in the NDVI variation in Guizhou Province. Although the regional mean of precipitation manifested a weak increasing trend, the spatial distribution showed prominent region features, for instance, significant increasing trend was seen over central Qiannan, western Qiandongnan, and eastern Tongren, and a weak decreasing trend appears across southern Zunyi and Panxian. Precipitation increased as a whole, with 59.2% of areas exhibiting an uptrend and 40.8% showing a downtrend, respectively.
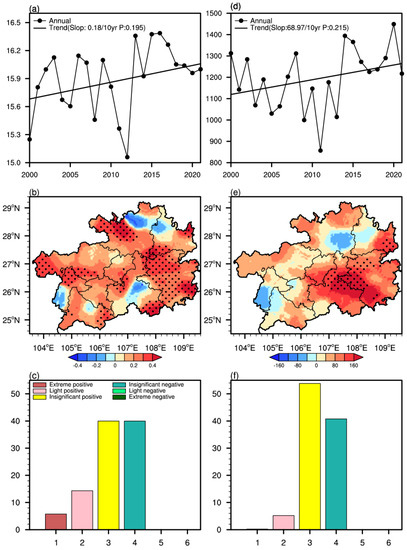
Figure 6.
Air temperature and precipitation variations in Guizhou from 2000 to 2021. Linear trend (a); spatial distribution of trend (coloring) and significance (dotted region) (b); statistical results of spatial trend (c). (d–f) is the same as (a–c), respectively, but for precipitation. The unit of the trend is °C/10 years for air temperature, and mm/10 years for precipitation. The dotted region in (b,e) represents the trend significant above the 0.05 confidence level. (c,f) shares a common legend.
3.3.2. Responses to Climatic Factors
The partial correlation coefficients between annual mean NDVI and temperature and precipitation were examined to detect the connection of vegetation dynamics and climate changes in Figure 7. The correlation was divided into six grades based on the combination of correlation coefficient and significance (Table 3). A definite positive correlation exists between the annual mean NDVI and temperature in most parts of the study areas, except for some negative correlations which appear across Panxian, northern Tongzi, Yanjiang, and which are scattered across some major urban areas. The areas with positive correlation coefficients accounted for 95.5%, with extreme significant, significant, and insignificant positive correlation accounting for 36.3%, 24.4%, and 34.6%, respectively, whereas the negative correlation only accounted for 4.7% of vegetation areas (Figure 7a–c). The connection between annual mean NDVI and temperature displayed a similar, notable distribution among different vegetation types. The annual mean NDVI for savannas exhibited the greatest proportion of significant positive correlations with temperature (68.5%), followed by evergreen broadleaf forests (66.5%), deciduous broadleaf forests (64.7%), mixed forests (63.1%), evergreen needleleaf forests (57.4%), woody savannas (56.8%), croplands (55.7%) and grasslands (39.6%), successively. In addition, the annual NDVI for grasslands displayed the greatest proportion (21%) of negative connections to temperature among the eight vegetation types.
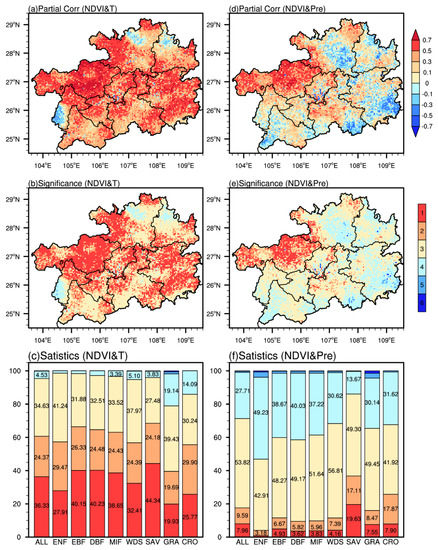
Figure 7.
Partial correlation between air temperature and NDVI in Guizhou from 2000 to 2021. (a) spatial distribution; (b) significance; (c) statistics results of spatial correlation for Guizhou regional mean and different vegetation types. (d–f) is the same as (a–c), but for precipitation. Numbers 1 to 6 in (b,c) denote extremely significant positive correlation (R > 0, p ≤ 0.01), significant positive correlation (R > 0, p ≤ 0.05), insignificant positive correlation (R > 0, p > 0.05), insignificant negative correlation (R < 0, p > 0.05), significant negative correlation (R < 0, p ≤ 0.05), extreme significant negative correlation (R < 0, p ≤ 0.01), correspondingly. The symbols of “ALL” to “CRO” in (c,f) are the same as Figure 1b. The legend of (c,e,f) are the same as that of (b).
The correlation between annual NDVI and precipitation showed notable spatial heterogeneity, with a positive correlation existing across Bijie, Shuicheng, Renhuai, Chishui, Daozhen, Kaiyang, central Qiannan, and negative correlation occurring over southeastern Zunyi, northeastern Tongren, southeastern Qiandongnan and Qiannan, southwestern Qianxinan, and central and southern Guiyang, respectively. The areas with positive correlation coefficients accounted for 71.4%, with extreme significant, significant, and insignificant positive correlation accounting for 8.0%, 10.0%, and 53.8%. The significant positive correlation was mainly distributed across Bijie, Renhuai, Chishui, Wuchuan, Kaiyang, and central Qiannan. However, the negative correlation between annual NDVI and precipitation accounted for 28.6%, and was mainly distributed across southern Zunyi, Yanjiang, southeastern Qiandongnan and Qiannan, southwestern Qianxinan, and parts of Guiyang. Specifically, significant negative correlation only accounted for 1.9%, and was mainly distributed across Yinping, Liping, and Libo. The connection between annual mean NDVI and precipitation exhibited notable differences among different vegetation types. The annual mean NDVI for savannas exhibited the greatest proportion of significant positive correlations (36.7%), followed by croplands (25.8%), grasslands (16.0%), woody savannas and evergreen broad forests (11.6%), mixed forests (9.8%), deciduous broadleaf forests (9.4%) and evergreen needleleaf forests (3.3%), successively. In addition, the annual NDVI for grasslands displayed a greater proportion (4.4%) of significant negative connections to precipitation. In general, spatial distribution for the response of annual mean NDVI in Guizhou Provinces to climatic factors exhibited notable heterogeneity, and NDVI variations were more influenced by temperature than precipitation.
3.4. Human Activities
The TS and MK analysis based on the temporal NDVI residual index, which was calculated as the regional average NDVI residual during 2000–2021 across Guizhou Province, exhibited an extreme significant increasing trend with an annual change rate of 0.035/10a (R2 = 0.67, p < 0.001; Figure 8a). The impact of human activities underwent a significant increase during 2000–2010 with an annual change rate of 0.05/10a (R2 = 0.55, p < 0.01) and an insignificant slow rising tendency during 2011–2021 with a change rate of 0.028/10a (R2 = 0.24, p = 0.13). In general, human activities in the last 22 years were favorable for improving vegetation greenness in Guizhou Province. The spatial distribution of NDVI residual exhibited an increasing trend across most parts of Guizhou Province, except for a decreasing trend scattered across Qiandongnan, southern Guiyang, southern Zunyi, Southern Bijie, and northern Zunyi. Specifically, extreme significant and significant increasing trends, accounting for 61.8%, were distributed across Bijie, Panxian, Qianxinan, southern Anshun, northwestern Guiyang, northern Zunyi, and northwestern Tongren; meanwhile, extreme significant and significant decreasing trends, only accounting for 0.72%, were scattered across the central urban area. The impacts of human activities to the NDVI variations varies from different vegetation types. For instance, the NDVI residual extracted based on savannas exhibited the largest significant increasing trend, accounting for 68.7%, successively, followed by woody savannas (63.6%), mixed forests (61.3%), croplands (57.7%), evergreen needleleaf forests and evergreen broadleaf forests (45.0%), deciduous broadleaf forests (39.7%) and grasslands (36.5%). In addition, the NDVI residual of grasslands and croplands also exhibited some extreme significant and significant decreasing trends, accounting for 7.1%, 4.8%, and 7.2%, 8.3%, respectively, whereas the proportions of significant decreasing trends for other vegetation types were nearly equal to zero.
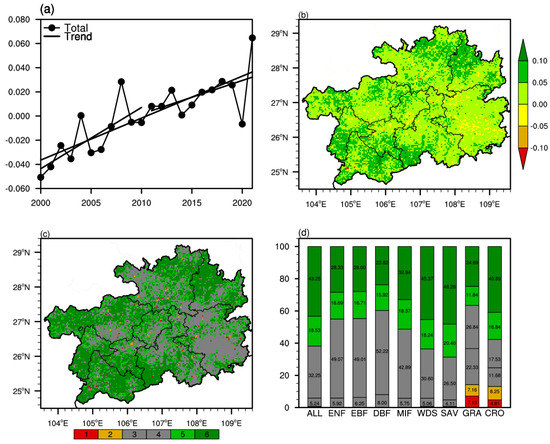
Figure 8.
Trends of the NDVI residuals in a regression of the averaged mean NDVI with respect to air temperature and precipitation. Regional mean (a), spatial distribution (b), significance (c), and statistical results of the percentage changes for Guizhou regional mean and different vegetation types. The numbers 1 to 6 and the symbols of “ALL” to “CRO” in (d) are the same as Figure 1b. The legend of (d) is the same as (c).
3.5. Evaluate Contribution of Climatic Factors and Human Activities
The above NDVI residual analysis reveals that human activities might lead to vegetation greenness improvement across most regions of the studying regions. In order to further evaluate the relative contribution rates of climatic factors and human activities in quantitative terms, referring to the methods of Liu et al., 2021 [31] and Gao et al., 2022 [49], the relative contribution rates is divided into six situations (Table 4). The relative contribution rates of climatic changes and human activities were calculated following the equation of , and , respectively. When the observed NDVI trend, predicted NDVI trend, and residual NDVI trend are greater than zero, this means that the contribution of climatic changes and human activities promote vegetation greeness improvement. If the observed and predicted NDVI trend are greater than zero but the NDVI residual trend is less than zero, the contribution of climatic factors to vegetation greeness improvement is 100% but that of human activities is zero, respectively. When the observed and residual NDVI trend are greater than zero but the predicted NDVI trend less than zero, the contribution of human activities to vegetation greeness is 100% but that of climatic changes is zero. In addition, when the observed NDVI trend is less than zero, the relative contribution of climatic factors and human activities to a decrease in vegetation greenness is similar to those greater than zero (details seen in Table 4). Figure 9 displays spatial distribution for relative contribution rates of climatic factors and human activities to vegetation greenness improvement and decrease, respectively. The climatic factors have a relatively stronger contribution (greater 60%) to vegetation greenness improvement across southern Guiyang, Bijie, Nayong, Zhijin, Xishui, Yuqing, Shiqian, Huangping, Shibin, Liping, Jinping, Jianhe and Taijiang. The stronger contribution of human activities (greater than 60%) to vegetation greenness improvement is mainly distributed across Hezhang county, Panxian, Liuzhi, Qianxinan, southern Anshun, Luodian, Pingtang, Duyun, northern Zunyi, northwestern Tongren, Songtao, Cenggong and Congjiang. The remaining areas with relative contribution rates of less than 60%, such as Weining, Shuicheng, Renhuai, Huishui, Daozhen, Songtao and northern Qiandongnan, indicate that climatic factors and human activities simultaneously promote vegetation greenness improvement. The decreasing parts of vegetation greenness scattered over Qiandongnan, southern Zunyi, Bijie, and Qianxinan, are mainly caused by human activities. Moreover, climatic factors result in vegetation greenness decreasing in the old town of Guiyang city and in some scattered places.
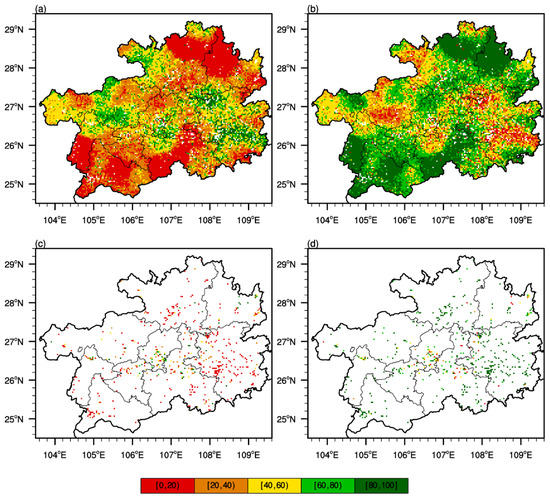
Figure 9.
Contribution to NDVI increasing trend for climate factors (a) and human activities (b). (c,d) is the same as (a,b), but for the NDVI decreasing trend. Definition of the contribution is described in Table 4.
Figure 10 exhibits the statistical percentage for the relative contribution rates of climatic factors and human activities to vegetation greenness in different vegetation types. Overall, the vegetation variation trend is mainly affected by human activities, with the proportion of strong contribution (greater than 60%) to vegetation greenness improvement and a decrease accounting for 57.2% and 80.1%, respectively. However, the strong contribution (greater than 60%) of climatic factors to the increase and decrease only accounts for 15.3% and 10.2%, respectively. In addition, the relative contribution rates of climatic factors and human activities shows a notable difference among the eight vegetation types. Specifically, for the vegetation greenness improving trend, the proportion of strong contribution (>60%) of human activities ranges from highest to lowest, in the following order: woody savannas (61.8%), evergreen needleleaf forests (58.2%), savannas and mixed forests (52.0%), evergreen broadleaf forests and grassland (49.0%), deciduous broadleaf forests (45.0%) and croplands (43.0%). For the vegetation greenness decreasing trend, the largest proportion of strong contribution (>60%) of human activities is observed by croplands (96.6%), followed by mixed forests (93.1%), evergreen broadleaf forests (90.5%), deciduous broadleaf forests (90.1%), evergreen needleleaf forests and woody savannas (80.0%), savannas (77.8%) and grasslands (75.4%). In contrast, the proportion for strong contribution (>60%) of climatic factors is obviously smaller compared to those of human activities, ranging from 9.3% (croplands) to 25.7% (deciduous broadleaf forests) for improving trends, and from 4.8% (mixed forests) to 14.2% (evergreen needleleaf forests) for decreasing trends, respectively. In general, compared to climatic factors, human activities have had a stronger influence on vegetation dynamics in Guizhou Province during the last 22 years.
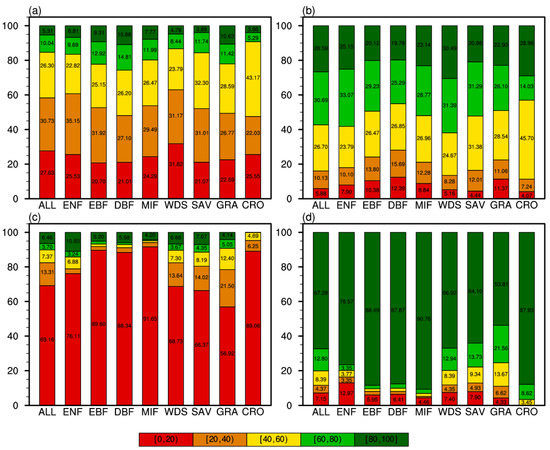
Figure 10.
Statistical percentage of Contribution to NDVI increasing trend for climate factors (a) and human activities (b). (c,d) is the same as (a,b), but for the NDVI decreasing trend. The symbols of “ALL” to “CRO” in (a,d) are the same as Figure 1b.
4. Discussion
The interannual variation of annual mean NDVI for different vegetation types in Guizhou Province experienced a notable increasing trend during 2000–2021 (Figure 2 and Figure 3) based on the MODIS13Q1 NDVI with a spatial resolution of 250 m × 250 m. Satellite remote sensing is an efficient way of detecting vegetation dynamics, but its insensitivity in well-vegetated areas may sometimes lead to some uncertain results [51,52]. The spatiotemporal patterns of NDVI variations in Guizhou Province are consistent with several previous studies based on different satellite remote sensing datasets and periods of study. For instance, the results based on SPOT VGT data with a 1 km × 1 km horizontal resolution during 1999–2015 [38], GIMMS NDVI data with an 8 km × 8 km resolution during 1982–2015 [37], and MOD13A1 NDVI data with a 1 km × 1 km resolution during 2001–2018 [31] also display an uptrend of NDVI variation in Guizhou Province. This phenomenon is inseparable from the combined effect of climatic factors and human activities. Since the late 1990s, a series of ecological restoration projects were lauched by the Chinese central government, which may have a large impact on vegetation dynamics in Guizhou Province [53]. Undoubtedly, land use and land cover change play a crucial role in vegetation dynamics. We also examined the land cover variations from 2001 to 2020 in Guizhou Province (Figure 11). Results indicate that the area of evergreen needleleaf forests, evergreen broadleaf forests, deciduous broafleaf forests and savannas showed a significant upward trend with a rate of 0.04%/10a, 0.91%/10a, 1.62%/10a and 2.54%/10a, and woody savannas, savannas, and grasslands with a notable decreasing trend of −1.61%/10a, −3.43%/10a, and −0.64%/10a, whereas the cropland showed an insignificant upward trend with 0.46%/10a, respectively. All of the vegetation cover types except for the croplands exceed the 0.001 confidence level. In addition, from 2001 to 2020, the four types of forests increased by 0.05%, 1.52%, 2.92%, and 5.34%, and the two types of savannas decreased by −2.66%, and −9.69%, respectively. The grasslands decreased by −1.17% and the croplands increased by 3.50%. Therefore, future work should focus on evaluating the effects of ecological restoration projects and land use and land cover change on the vegetation dynamics in Guizhou Province.
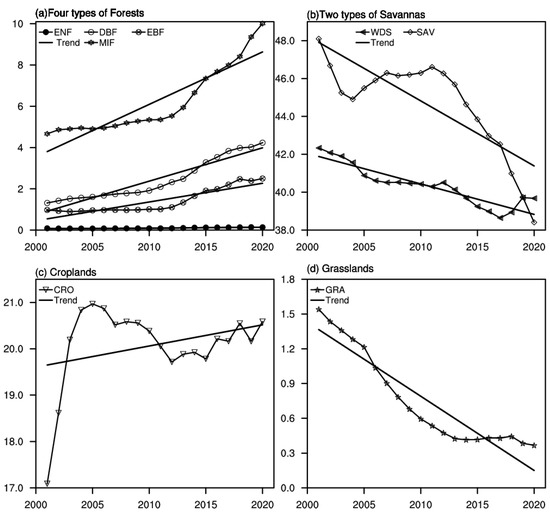
Figure 11.
The land cover changes of area portion (%) of Guizhou Province for four types of forests (a), woody savannas and savannas (b), croplands (c), and grasslands (d). The line without markers represents the long-term trend.
In terms of the climatic factors, the annual mean temperature and precipitation in Guizhou Province have increased in the past 22 years (Figure 6). Temperature was the main controlling climatic factor influencing vegetation dynamics in Guizhou Province when compared to precipitation. An increase in temperature could benefit vegetation growth through promoting photosynthesis, promoting absorption of organic matter by vegetation, and extending the growing period of vegetation [54,55,56]. An increase in weak precipitation in Bijie significantly promoted vegetation growth due to water depletion and excessive sunshine there. In addition, high precipitation over Qiandongnan and eastern Tongren is negatively correlated with the NDVI variations, which can be explained by the fact that higher precipitation generally enhances cloudy weather, decreasing downward solar radiation and thereby inhibiting photosynthesis and vegetation growth. However, this study mainly focuses on examining the contemporaneous connection between climatic factors and vegetation dynamics. Future studies need to be devoted to exploring the lag response of vegetation dynamics and phenology to climatic factors.
5. Conclusions
Based on the MOD13Q1 NDVI and meteorological datasets with a relatively high spatial resolution, this study examined the vegetation variations and its response to climatic factors and human activities in Guizhou Province during 2000–2021 based on methods of the maximum value composite, TS trend estimation, MK significant test, the coefficient of variation, the Hurst index, partial correlation analysis and residual analysis. The temporal change of NDVI displayed a significant increasing trend in most parts of the study region and for different vegetation types at different rates. In terms of spatial distribution, the average NDVI during 2000–2021 increased from the northwest to the southeast. The NDVI showed a significant improving trend in western, northern, and southwestern Guizhou Province, and a decreasing trend in eastern Guizhou Province and some central urban built-up areas. The NDVI trends are different for the eight vegetation types, with greater proportions of improving trends for savannas and woody savannas compared to those of forests, croplands and grasslands. The vegetation variations are very stable and sustainable in most parts of Guizhou Province. Vegetation greenness in forests showed the largest stability, followed by woody savannas and savannas. The croplands showed the weakest stability, followed by grasslands. Woody savannas and savannas exhibited the largest sustainable significant increasing trend, followed by forests and croplands, and grasslands show the smallest sustainable significant increasing trend. Meanwhile, grasslands exhibited a larger sustainable significant decreasing trend, followed by croplands. Furthermore, a partial correlation analysis of the climatic factors with NDVI variation showed that vegetation growth is strongly influenced by temperature rather than precipitation in most parts of the study areas. This study also evaluated the relative contribution rates of climatic factors and human activities. In general, compared to climatic factors, human activities have exerted a stronger influence on vegetation dynamics in Guizhou Province during the last 22 years.
Author Contributions
Conceptualization, X.X.; methodology, X.X. and Z.W.; data analysis, X.X.; data curation, X.X. and Z.W.; writing—review and editing X.X. and S.H.; writing—original draft preparation, X.X.; visualization, X.X. and S.H.; supervision, X.X.; project administration, X.X.; funding acquisition, X.X. All authors have read and agreed to the published version of the manuscript.
Funding
This research was funded by the National Natural Science Foundation (grant no. 41965004, 41705069).
Data Availability Statement
All data, or code generated or used during the study are available from the author by request (xxue@gzu.edu.cn).
Conflicts of Interest
The authors declare no conflict of interest.
References
- Puma, M.; Koster, R.; Cook, B.I. Phenological versus meteorological controls on land-atmosphere water and carbon fluxes. J. Geophys. Res. Biogeosci. 2013, 118, 14–29. [Google Scholar] [CrossRef]
- Walther, G.-R.; Post, E.; Convey, P.; Menzel, A.; Parmesan, C.; Beebee, T.J.C.; Fromentin, J.-M.; Hoegh-Guldberg, O.; Bairlein, F. Ecological responses to recent climate change. Nature 2002, 416, 389–395. [Google Scholar] [CrossRef]
- Arora, V. Modeling Vegetation as a Dynamic Component in Soil-Vegetation-Atmosphere Transfer Schemes and Hydrological Models. Rev. Geophys. 2008, 40, 1–3. [Google Scholar] [CrossRef]
- Eugster, W.; Rouse, W.R.; Pielke, R.A., Sr.; Mcfadden, J.P.; Baldocchi, D.D.; Kittel, T.G.F.; Chapin, F.S.; Liston, G.E.; Vidale, P.L.; Vaganov, E. Land-atmosphere energy exchange in Arctic tundra and boreal forest: Available data and feedbacks to climate. Glob. Change Biol. 2010, 6, 84–115. [Google Scholar] [CrossRef] [PubMed]
- Suzuki, R.; Masuda, K.; Dye, D.G. Interannual covariability between actual evapotranspiration and PAL and GIMMS NDVIs of northern Asia. Remote Sens. Environ. 2007, 106, 387–398. [Google Scholar] [CrossRef]
- Williams, N.; Torn, M.S. Vegetation controls on surface heat flux partitioning, and land-atmosphere coupling. Geophys. Res. Lett. 2015, 42, 9416–9424. [Google Scholar] [CrossRef]
- Pettorelli, N.; Vik, J.O.; Mysterud, A.; Gaillard, J.-M.; Tucker, C.J.; Stenseth, N.C. Using the satellite-derived NDVI to assess ecological responses to environmental change. Trends Ecol. Evol. 2005, 20, 503–510. [Google Scholar] [CrossRef] [PubMed]
- Tong, X.; Wang, K.; Yue, Y.; Brandt, M.; Liu, B.; Zhang, C.; Liao, C.; Fensholt, R. Quantifying the effectiveness of ecological restoration projects on long-term vegetation dynamics in the karst regions of Southwest China. Int. J. Appl. Earth Obs. Geoinf. 2017, 54, 105–113. [Google Scholar] [CrossRef]
- Bannari, A.; Morin, D.; Bonn, F.; Huete, A.R. A review of vegetation indices. Remote Sens. Rev. 1995, 13, 95–120. [Google Scholar] [CrossRef]
- Ichii, K.; Kawabata, A.; Yamaguchi, Y. Global correlation analysis for NDVI and climatic variables and NDVI trends: 1982–1990. Int. J. Remote Sens. 2002, 23, 3873–3878. [Google Scholar] [CrossRef]
- Piao, S.; Mohammat, A.; Fang, J.; Cai, Q.; Feng, J. NDVI-based increase in growth of temperate grasslands and its responses to climate changes in China. Glob. Environ. Chang. 2006, 16, 340–348. [Google Scholar] [CrossRef]
- Pinzon, J.E.; Tucker, C.J. A non-stationary 1981–2012 AVHRR NDVI3g time series. Remote Sens. 2014, 6, 6929–6960. [Google Scholar] [CrossRef]
- Zhu, Z.; Piao, S.; Myneni, R.B.; Huang, M.; Zeng, Z.; Canadell, J.G.; Ciais, P.; Sitch, S.; Friedlingstein, P.; Arneth, A.; et al. Greening of the Earth and its drivers. Nat. Clim. Chang. 2016, 6, 791–795. [Google Scholar] [CrossRef]
- Huang, K.; Xia, J.; Wang, Y.; Ahlström, A.; Chen, J.; Cook, R.B.; Cui, E.; Fang, Y.; Fisher, J.B.; Huntzinger, D.N.; et al. Enhanced peak growth of global vegetation and its key mechanisms. Nat. Ecol. Evol. 2018, 2, 1897–1905. [Google Scholar] [CrossRef]
- Fang, J.; Piao, S.; He, J.; Ma, W. Increasing terrestrial vegetation activity in China, 1982–1999. Sci. China Ser. C Life Sci. 2004, 47, 229–240. [Google Scholar] [CrossRef]
- Xu, X.; Piao, S.; Wang, X.; Chen, A.; Ciais, P.; Myneni, R.B. Spatio-temporal patterns of the area experiencing negative vegetation growth anomalies in China over the last three decades. Environ. Res. Lett. 2012, 7, 35701. [Google Scholar] [CrossRef]
- Chu, H.; Venevsky, S.; Wu, C.; Wang, M. NDVI-based vegetation dynamics and its response to climate changes at Amur-Heilongjiang River Basin from 1982 to 2015. Sci. Total Environ. 2018, 650, 2051–2062. [Google Scholar] [CrossRef]
- Sun, W.; Song, X.; Mu, X.; Gao, P.; Wang, F.; Zhao, G. Spatiotemporal vegetation cover variations associated with climate change and ecological restoration in the Loess Plateau. Agric. For. Meteorol. 2015, 209–210, 87–99. [Google Scholar] [CrossRef]
- Qu, S.; Wang, L.; Lin, A.; Zhu, H.; Yuan, M. What drives the vegetation restoration in Yangtze River basin, China: Climate change or anthropogenic factors? Ecol. Indic. 2018, 90, 438–450. [Google Scholar] [CrossRef]
- Jiang, L.; Guli·Jiapaer, G.; Bao, A.; Guo, H.; Ndayisaba, F. Vegetation dynamics and responses to climate change and human activities in Central Asia. Sci. Total Environ. 2017, 599–600, 967–980. [Google Scholar] [CrossRef]
- Chen, C.; Park, T.; Wang, X.; Piao, S.; Xu, B.; Chaturvedi, R.K.; Fuchs, R.; Brovkin, V.; Ciais, P.; Fensholt, R.; et al. China and India lead in greening of the world through land-use management. Nat. Sustain. 2019, 2, 122–129. [Google Scholar] [CrossRef]
- Zhou, L.; Tucker, C.J.; Kaufmann, R.K.; Slayback, D.; Shabanov, N.V.; Myneni, R.B. Variations in Northern Vegetation Activity Inferred from Satellite Data of Vegetation Index during 1981 to 1999. J. Geophys. Res. Atmos. 2001, 106, 20069–20083. [Google Scholar] [CrossRef]
- Gong, D.-Y.; Shi, P.-J. Northern hemispheric NDVI variations associated with large-scale climate indices in spring. Int. J. Remote Sens. 2003, 24, 2559–2566. [Google Scholar] [CrossRef]
- Huete, A. Ecology vegetation’s responses to climate variability. Nature 2016, 531, 181–182. [Google Scholar] [CrossRef]
- Yang, J.; Gong, P.; Fu, R.; Zhang, M.; Chen, J.; Liang, S.; Xu, B.; Shi, J.; Dickinson, R. The role of satellite remote sensing in climate change studies. Nat. Clim. Chang. 2013, 3, 875–883. [Google Scholar] [CrossRef]
- He, B.; Chen, A.; Wang, H.; Wang, Q. Dynamic Response of Satellite-Derived Vegetation Growth to Climate Change in the Three North Shelter Forest Region in China. Remote Sens. 2015, 7, 9998–10016. [Google Scholar] [CrossRef]
- Song, Y.; Ma, M. A statistical analysis of the relationship between climatic factors and the Normalized Difference Vegetation Index in China. Int. J. Remote Sens. 2011, 32, 3947–3965. [Google Scholar] [CrossRef]
- IPCC. Summary for policymakers. In Climate Change 2021: The Physical Science Basis; Contribution of Working Group I to the Sixth Assessment Report of the Intergovernmental Panel on Climate, Change; Masson-Delmotte, V., Zhai, P., Pirani, A., Connors, S.L., Péan, C., Berger, S., Caud, N., Chen, Y., Goldfarb, L., Gomis, M.I., et al., Eds.; Cambridge University Press: Cambridge, UK; New York, NY, USA, 2021; pp. 3–32. [Google Scholar]
- Wang, F.T.; An, P.L.; Huang, C.; Zhang, Z.; Hao, J.M. Is afforestation-induced land use change the main contributor to vegetation dynamics in the semiarid region of North China? Ecol. Indic. 2018, 88, 282–291. [Google Scholar] [CrossRef]
- Wang, X.; Du, P.; Chen, D.; Lin, C.; Zheng, H.; Guo, S. Characterizing urbanization-induced land surface phenology change from time-series remotely sensed images at fine spatio-temporal scale: A case study in Nanjing, China (2001–2018). J. Clean. Prod. 2020, 274, 122487. [Google Scholar] [CrossRef]
- Liu, Y.; Tian, J.; Liu, R.; Ding, L. Influences of Climate Change and Human Activities on NDVI Changes in China. Remote Sens. 2021, 13, 4326. [Google Scholar] [CrossRef]
- Delang, C.O.; Yuan, Z. China’s Grain for Green Program: A Review of the Largest Ecological Restoration and Rural Development Program in the World; Springer International Publishing: Cham, Switzerland, 2015; pp. 1–229. [Google Scholar]
- Xu, J.; Yin, R.; Li, Z.; Liu, C. China’s ecological rehabilitation: Unprecedented efforts, dramatic impacts, and requisite policies. Ecol. Econ. 2006, 57, 595–607. [Google Scholar] [CrossRef]
- Song, L.; Zhang, Y.; Fang, J.; Gu, Z. Karst development and the distribution of karst drainage systems in Dejiang, Guizhou Province, China. J. Hydrol. 1983, 61, 3–17. [Google Scholar] [CrossRef]
- Wang, S.-J.; Liu, Q.-M.; Zhang, D.-F. Karst rocky desertification in southwestern China: Geomorphology, landuse, impact and rehabilitation. Land Degrad. Dev. 2004, 15, 115–121. [Google Scholar] [CrossRef]
- Gu, F.; Gou, X.H.; Deng, Y.; Su, J.J.; Lin, W.; Yu, A.L. Analysis of temperature variations over the Yunnan-Guizhou Plateau from 1960 to 2014. J. Lanzhou Univ. Nat. Sci. 2018, 54, 721–730. (In Chinese) [Google Scholar]
- Wei, X.; Zhou, Q.; Luo, Y.; Cai, M.; Zhou, X.; Yan, W.; Peng, D.; Zhang, J. Vegetation dynamics and its response to driving factors in typical karst regions, Guizhou Province, China. Front. Earth Sci. 2021, 15, 167–183. [Google Scholar] [CrossRef]
- Tian, Y.; Bai, X.; Wang, S.; Qin, L.; Li, Y. Spatial-temporal changes of vegetation cover in Guizhou Province, Southern China. Chin. Geogr. Sci. 2017, 27, 25–38. [Google Scholar] [CrossRef]
- Liu, Y.; Zhou, Z.F.; Yan, L.H. Spatio-temporal variation in NDVI and its reponse to climate change and human activities in Guizhou province during 2001–2018. Bull. Soil Water Conserv. 2021, 41, 327–336. (In Chinese) [Google Scholar]
- Xiao, L.; Chen, X.; Zhang, R.; Zhang, Z. Spatiotemporal Evolution of Droughts and Their Teleconnections with Large-Scale Climate Indices over Guizhou Province in Southwest China. Water 2019, 11, 2104. [Google Scholar] [CrossRef]
- Theil, H. A rank-invariant method of linear and polynomial regression analysis. Ned. Akad. Wetenchappen Ser. A 1950, 53, 386–392. [Google Scholar]
- Sen, P.K. Estimates of the regression coefficient based on Kendall’s tau. J. Am. Stat. Assoc. 1968, 63, 1379–1389. [Google Scholar] [CrossRef]
- Tucker, C.J.; Newcomb, W.W.; Los, S.; Prince, S.D. Mean and inter-year variation of growing-season normalized difference vegetation index for the Sahel 1981-1989. Int. J. Remote Sens. 1991, 12, 1133–1135. [Google Scholar] [CrossRef]
- Milich, L.; Weiss, E. GAC NDVI interannual coefficient of variation (CoV) images: Ground truth sampling of the Sahel along north-south transects. Int. J. Remote Sens. 2000, 21, 235–260. [Google Scholar] [CrossRef]
- Whelen, T.; Siqueira, P. Coefficient of variation for use in crop area classification across multiple climates. Int. J. Appl. Earth Obs. Geoinf. 2018, 67, 114–122. [Google Scholar] [CrossRef]
- Xu, J.H. Mathematical Methods in Modern Geograph; Higher Education Press: Beijing, China, 2002; pp. 37–41. (In Chinese) [Google Scholar]
- Hurst, H.E. Long term storage capacity of reservoirs. Rest. Trans. Am. Soc. Civ. Eng. 1951, 116, 770–799. [Google Scholar] [CrossRef]
- Evans, J.; Geerken, R. Discrimination between climate and human-induced dryland degradation. J. Arid Environ. 2004, 57, 535–554. [Google Scholar] [CrossRef]
- Gao, W.; Zheng, C.; Liu, X.; Lu, Y.; Chen, Y.; Wei, Y.; Ma, Y. NDVI-based vegetation dynamics and their responses to climate change and human activities from 1982 to 2020: A case study in the Mu Us Sandy Land, China. Ecol. Indic. 2022, 137, 108745. [Google Scholar] [CrossRef]
- Cheng, Q.; Gao, L.; Chen, Y.; Liu, M.; Deng, H.; Chen, X. Temporal-Spatial Characteristics of Drought in Guizhou Province, China, Based on Multiple Drought Indices and Historical Disaster Records. Adv. Meteorol. 2018, 2018, 4721269. [Google Scholar] [CrossRef]
- Cao, Y.F.; Wang, Z.X.; Den, F.P. Fidelity performance of three filters for high quality NDVI time-series analysis. Remote Sens. Technol. Appl. 2010, 25, 118–125. (In Chinese) [Google Scholar]
- Wang, Z.X.; Liu, C.; Huete, A. From AVHRR-NDVI to MODIS-EVI: Advances in vegetation index research. Acta Ecol. Sin. 2003, 23, 979–987. (In Chinese) [Google Scholar]
- Liu, J.; Li, S.; Ouyang, Z.; Tam, C.; Chen, X. Ecological and socioeconomic effects of China’s policies for ecosystem services. Proc. Natl. Acad. Sci. USA 2008, 105, 9477–9482. [Google Scholar] [CrossRef] [PubMed]
- Sun, J.; Zhou, T.C.; Liu, M.; Chen, Y.C.; Liu, G.H.; Xu, M.; Shi, P.L.; Peng, F.; Tsunekawa, A.; Liu, Y.; et al. Water and heat availability re drivers of the aboveground plant carbon accumulation rate in alpine grasslands on the Tibetan plateau. Global Ecol. Biogeogr. 2019, 29, 50–64. [Google Scholar] [CrossRef]
- Wan, S.; Hui, D.; Wallace, L.; Luo, Y. Direct and indirect effects of experimental warming on ecosystem carbon processes in a tallgrass prairie. Glob. Biogeochem. Cycles 2005, 19, GB2014. [Google Scholar] [CrossRef]
- Dragoni, D.; Schmid, H.P.; Wayson, C.A.; Potter, H.; Grimmond, C.S.B.; Randolph, J.C. Evidence of increased net ecosystem productivity associated with a longer vegetated season in a deciduous forest in south-central Indiana, USA. Glob. Chang. Biol. 2011, 17, 886–897. [Google Scholar] [CrossRef]
Disclaimer/Publisher’s Note: The statements, opinions and data contained in all publications are solely those of the individual author(s) and contributor(s) and not of MDPI and/or the editor(s). MDPI and/or the editor(s) disclaim responsibility for any injury to people or property resulting from any ideas, methods, instructions or products referred to in the content. |
© 2023 by the authors. Licensee MDPI, Basel, Switzerland. This article is an open access article distributed under the terms and conditions of the Creative Commons Attribution (CC BY) license (https://creativecommons.org/licenses/by/4.0/).