Article

Reversible Impacts of a Cold Spell on Forest Cover, Tree Growth and Carbohydrates in Mediterranean Pine and Oak Forests

by
Jesús Julio Camarero
1,*,
Michele Colangelo
1,2,
Cristina Valeriano
1 and
Manuel Pizarro
1
1
Pyrenean Institute of Ecology (IPE-CSIC), Avda. Montañana 1005, E-50059 Zaragoza, Spain
2
School of Agriculture, Forest, Food and Environment Sciencies, Università della Basilicata, Viale dell’Ateneo Lucano 10, 85100 Potenza, Italy
*
Author to whom correspondence should be addressed.
Forests 2023, 14(4), 678; https://doi.org/10.3390/f14040678
Submission received: 23 February 2023 / Revised: 22 March 2023 / Accepted: 24 March 2023 / Published: 25 March 2023
(This article belongs to the Special Issue Forest Dieback and Tree Mortality Risks from Environmental Changes)

Abstract

:
Climate extremes such as cold spells are becoming more frequent as climate variability increases. However, few studies have evaluated the impacts of winter cold spells on forest cover, tree growth and leaf and sapwood non-structural carbohydrate (NSC) concentrations. We analyzed changes in tree cover using remote sensing data and compared the radial growth of coexisting and defoliated Pinus halepensis trees and non-defoliated P. halepensis and Pinus pinaster trees. We also compared NSC concentrations in leaves and sapwood of defoliated and non-defoliated P. halepensis and Quercus ilex trees. In January 2021, a rapid drop in temperatures led to minimum values (−21.3 °C) in eastern Spain and triggered canopy defoliation in several planted (P. halepensis) and native (Q. ilex) tree species. The cold spell led to a decrease in forest cover in the most defoliated stands and reduced radial growth of defoliated P. halepensis and sapwood NSC concentrations in P. halepensis and Q. ilex, particularly starch. Prior to the cold spell, defoliated P. halepensis trees significantly (p < 0.05) grew more (2.73 ± 1.70 mm) in response to wetter winter conditions than non-defoliated P. halepensis (2.29 ± 1.08 mm) and P. pinaster (1.39 mm) trees. Those P. halepensis individuals which grew faster at a young age were less resilient to the winter cold spell in later years. The study stands showed a high recovery capacity after the cold spell, but the Mediterranean drought-avoiding P. halepensis was the most affected species.

1. Introduction

A major component of current climate change is the increase in climate variability leading to a higher occurrence of climate extremes [1]. Under global warming, enhanced variability in temperature results in more frequent, intense and lasting heat waves, but also cold spells, despite trends towards fewer cold days. These climate extremes will impact forest growth, productivity and composition in different ways than normal climatic variability does [2]. Note that a climate extreme defined according to statistical or climatological criteria (e.g., any event rarer than the 10th or 90th percentiles) may not necessarily incur tree responses [3]. Therefore, adequate assessments of the impacts of climate extremes on forests are needed to determine if acclimate thresholds are surpassed and they are linked to meteorological anomalies defined by the tails of a distribution for a climate parameter. Long-term perspectives, as those provided by tree rings, are required to determine if the climate extreme pushes forests outside the range of variability [4]. These long-term approaches are particularly necessary in seasonally dry areas with a high climate variability such as the Mediterranean basin, where droughts and heat waves are frequent but cold spells could also occur [5].
Under climate warming, more frequent freeze–thaw cycles in winter may lead to frost damage and tree death, even in Mediterranean regions [4]. Cold-induced forest dieback after very cold and/or dry winter conditions has been frequently described in boreal and subalpine conifer forests [6], but there are also study cases at mid-elevation and mid-latitude sites subjected to seasonal drought [7]. However, few studies exist in Mediterranean regions [4] despite the fact that these rare climate extremes may also impact forests by impairing spring flush and constraining their capacity to recover after summer drought. Many Mediterranean tree species are of subtropical origin, and they are not well adapted to withstand rare cold spells [4].
The main drivers of plant responses to winter conditions are the variability of air and soil temperatures, phenological timing (e.g., tissue hardening) and physiological sensitivity of tissues to rapid drops in air temperatures [8]. These drivers must be considered when assessing the impacts of winter cold spells on forests. Here, we assessed the impacts of a rapid winter temperature drop on Mediterranean pine and oak forests following a retrospective, tree-ring-based approach. This allowed us to quantify the growth recovery after such a winter climate extreme.
From 8 to 10 January 2021, Storm Filomena crossed the Iberian Peninsula causing the biggest snowfalls in decades in central and eastern Spain and leading to record low temperatures during that period and afterwards [9]. The large amount of snowfall and the low temperatures caused huge economic losses in the Madrid metropolitan area but also affected agricultural (e.g., olive production) and ecological systems [9]. In eastern Spain, many of the affected forested areas are dominated by Mediterranean tree species such as Aleppo pine (Pinus halepensis Mill.), which are vulnerable to snow and wind damage, causing the breakage and death of big branches [10].
We followed a multi-proxy approach to assess the impacts of the cold spell on forests. To assess changes in forest cover and productivity, the Normalized Difference Vegetation Index (NDVI) was calculated using remote sensing imagery [11]. To evaluate changes in tree radial growth, we analyzed tree-ring width series of defoliated vs. non-defoliated planted P. halepensis trees. For comparison, we also sampled coexisting Pinus pinaster Ait., which showed lower damage (crown defoliation) after the cold spell as compared to P. halepensis. Lastly, to evaluate changes in carbon reserves, we analyzed the concentrations of non-structural carbohydrates (NSC) in leaves and stem sapwood in defoliated and non-defoliated P. halepensis and Quercus ilex L. individuals, since these were the most abundant planted and native tree species, respectively. We analyzed sapwood and leaf NSC concentrations because they represent a major pool of carbon in trees, correspond to C sinks (sapwood) and sources (leaves), and have been shown to respond to stressors such as drought and insect defoliation [12]. We hypothesize that tree species which are dominant in Mediterranean regions, where they avoid or tolerate drought and are considered of subtropical origin, such as P. halepensis or Q. ilex will show stronger damages attributed to the cold spell than P. pinaster, which can be found in colder mountain or northern locations. We also expect that the defoliated P. halepensis trees will show a stronger growth reduction in 2021 and lower NSC concentrations than non-defoliated P. halepensis trees and also a lower ability to recover growth after the 2021 winter cold spell. We expect a similar difference in leaf and sapwood NSCs when comparing defoliated and non-defoliated Q. ilex.

2. Materials and Methods

2.1. Study Sites, Field Sampling and Climate Data

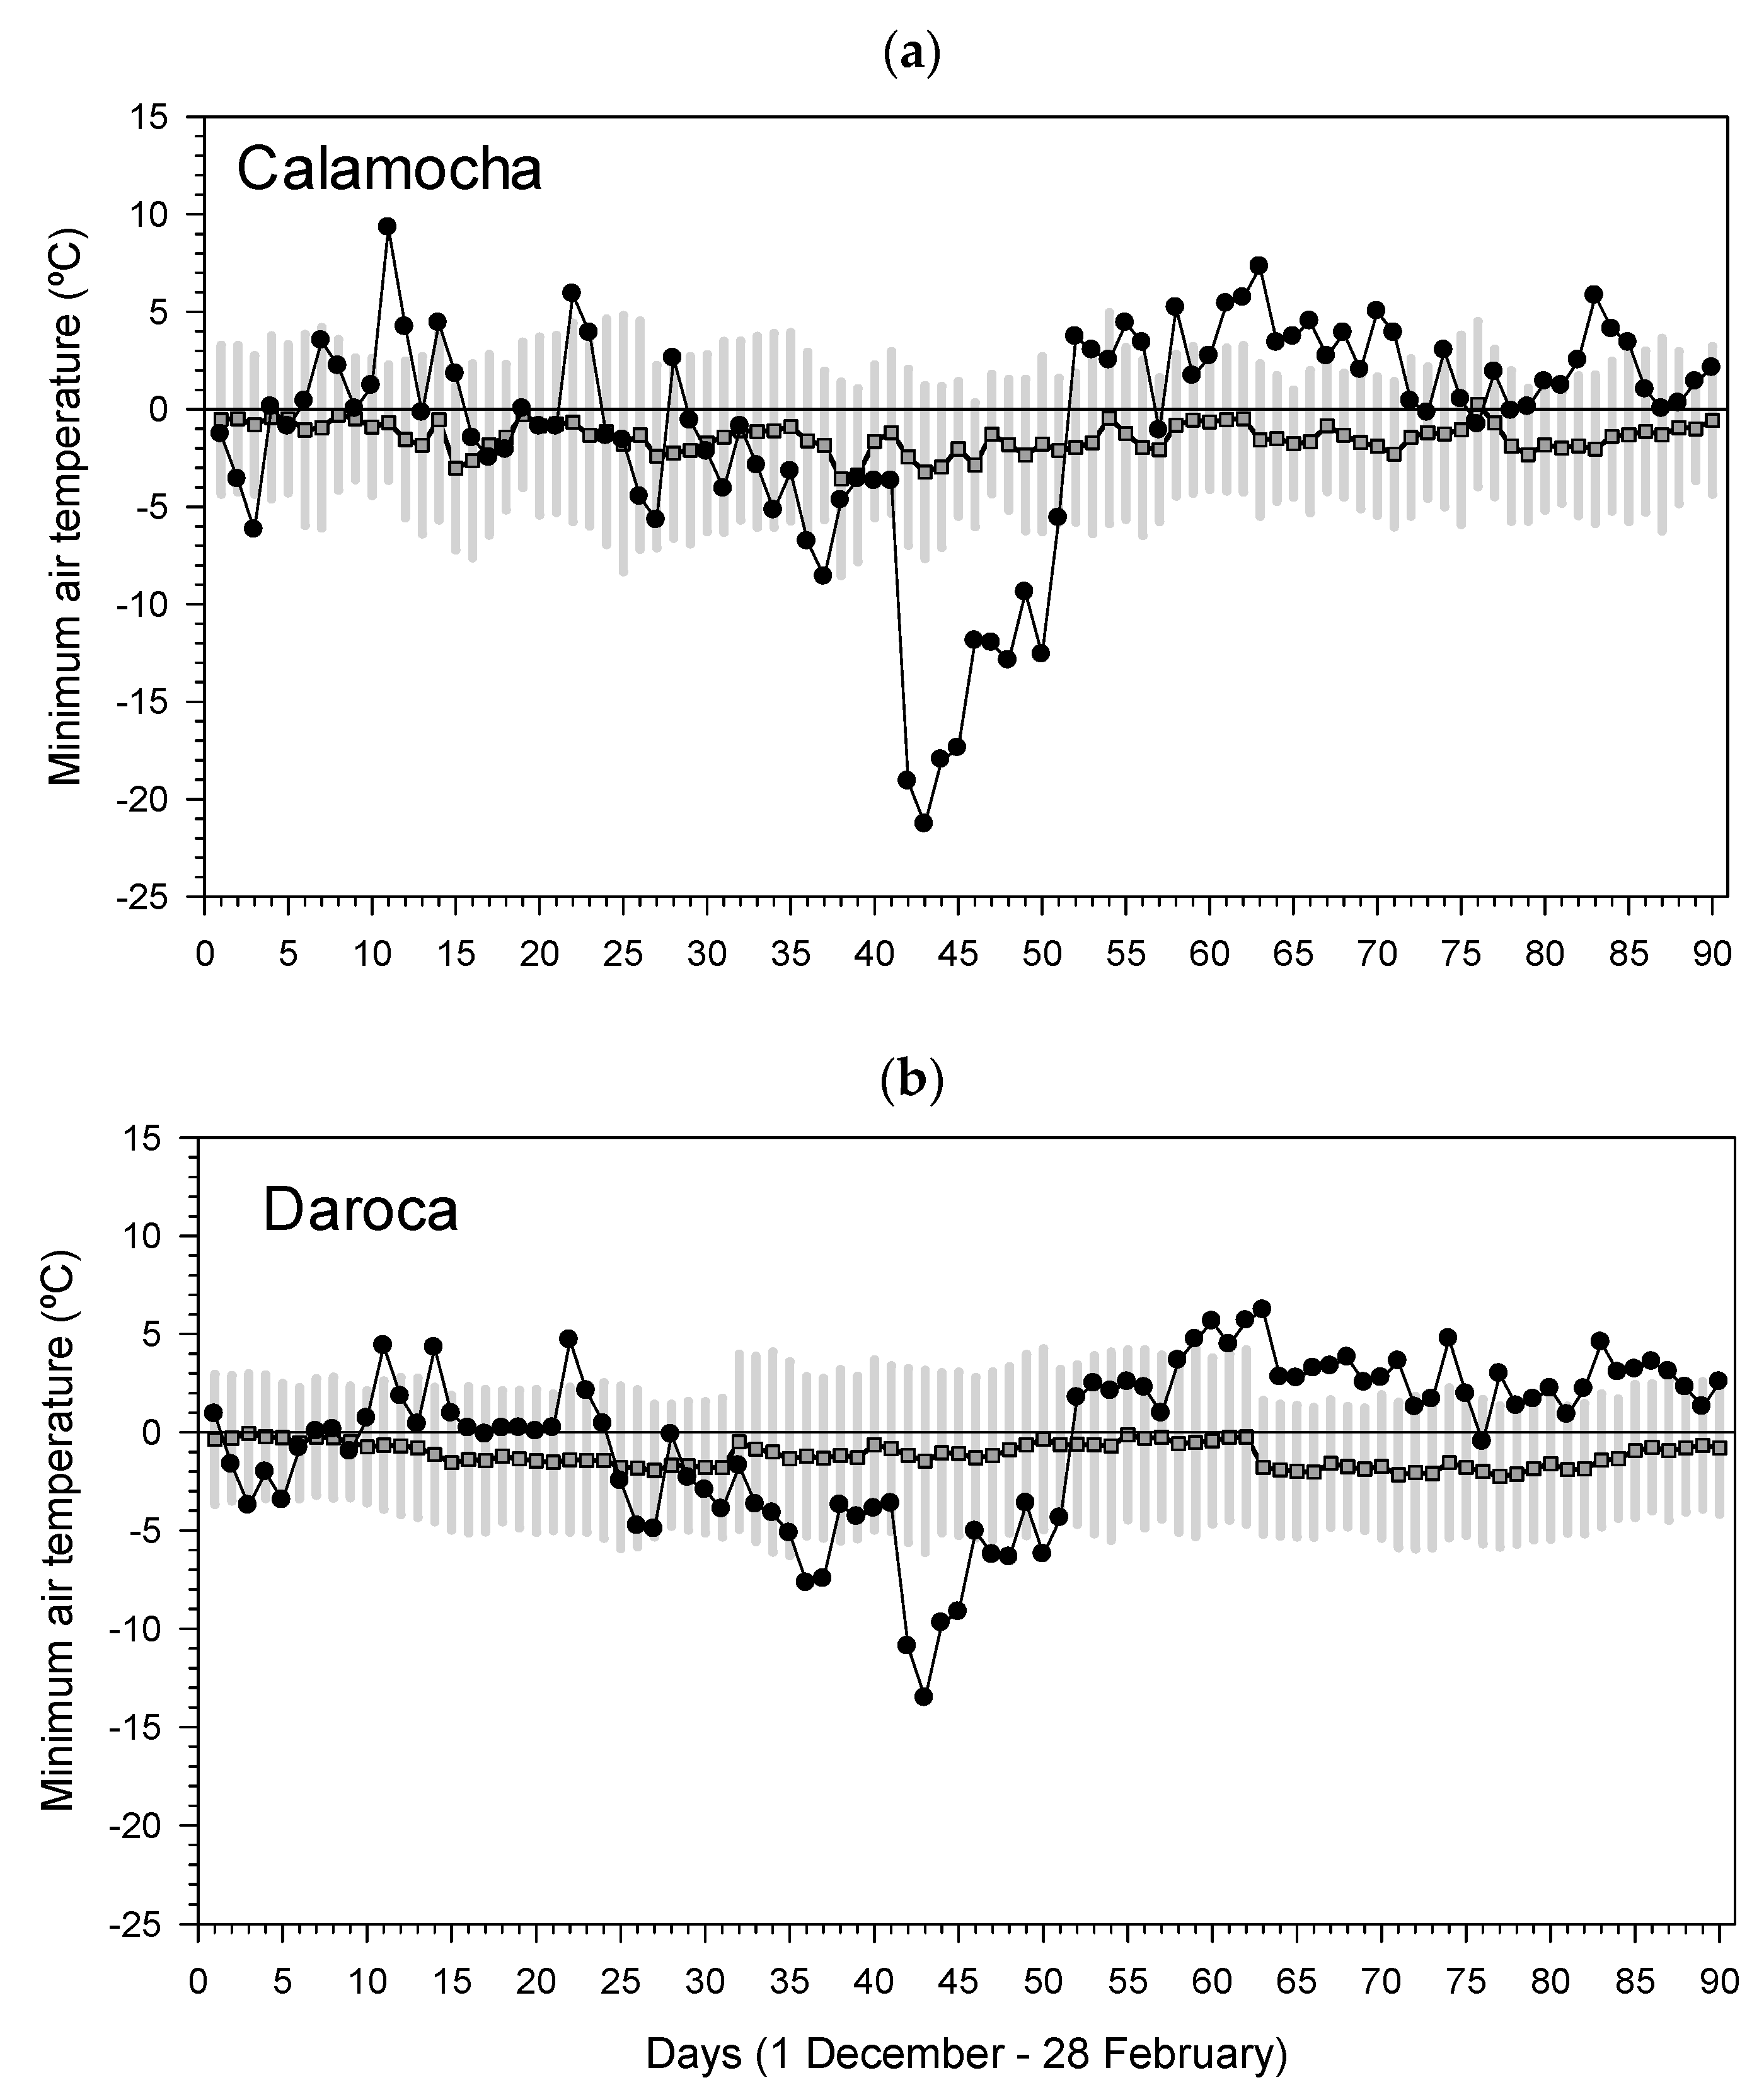
We sampled a study area situated in eastern Spain (Jiloca basin), near the towns of Calamocha and Daroca, subjected to continental Mediterranean conditions (cold winters, dry summers). In this area, very low minimum temperatures were recorded on 12 January 2021, about 12–18 °C lower than the long-term means (Figure 1).
We selected three mature pine stands for tree-ring analyses. They corresponded to pine plantations located around the “Cabezo Gordo” peak, located near Luco de Jiloca village (Teruel province, Aragón, eastern Spain). First, a stand of defoliated P. halepensis trees was selected (40.996° N, 1.306° W, 925 m a.s.l.). Second, a nearby P. halepensis stand (40.995° N, 1.305° W, 974 m a.s.l.) showing low defoliation was sampled for comparison. Both stands showed W-SW aspect and intermediate to steep slopes (10–30°). In each P. halepensis stand, six trees were sampled. Third, a nearby Pinus pinaster Ait. stand with low defoliation (40.998° N, 1.298° W, 1001 m a.sl) was sampled (n = 12 trees). This last stand showed intermediate slopes (15–20°) and SE aspect.
The study area is covered by plantations of drought-tolerant conifers (P. halepensis, P. pinaster, Pinus pinea L., Cupressus arizonica Greene, Thuja spp.) carried out since the early 20th century to reduce soil erosion and avoid flood damage. The plantations were undertaken in formerly cultivated terraced lands with a mean distance between pines of 6.5 m. Scattered almond trees (Prunus dulcis (Mill.) D.A. Webb) of former croplands appear near pines. The natural vegetation of the area is dominated by Q. ilex with minor hardwood species (Crataegus monogyna Jacq.) and typical Mediterranean shrubs (Genista scorpius (L.) DC., Thymus spp.). Soils are acid and formed on shales.
We used daily and monthly climate data (maximum and minimum temperatures, total precipitation) from the nearby Daroca (41.11° N, 1.41° W, 779 m a.s.l.; period 1920–2021) and Calamocha (40.93° N, 1.29° W, 890 m a.s.l.; period 1993–2021) meteorological stations. Climate in the study area is Mediterranean and continental, i.e., subject to dry summers and cold winters (Figure S1). The mean annual temperature varies from 11.0°C to 12.0 °C, with the warmest conditions in summer (mean temperatures of 20–22 °C) and the coldest ones in winter (mean temperatures of 1–3 °C). Mean minimum temperatures are negative in January and February (−0.2–−0.1 °C) when frosts are common. Mean annual precipitation is in the range of 415–436 mm with a climate water deficit of 230–259 mm. Such a dry period occurs from July to September, whereas soil moisture recharge mainly occurs in winter. In 2021, both the prior winter and summer were wet with values above the long-term averages. Thermal summer conditions were also normal. The 2021 cold spell was preceded by dry conditions in the 2005 and 2012 years [4].
Crown defoliation estimates were undertaken by the first two authors by comparing every tree with a reference tree with the maximum amount of foliage at each site and considering fallen, brown and red (dead) needles. Tree defoliation was assessed in September 2021 when trees were tagged and their diameter at breast height was measured at 1.3 m.
Sampling of tree cores was conducted in November 2022 when two tree cores were taken at 1.3 m from each selected tree separated by 180° and perpendicular to the slope using a 5 mm Pressler increment borer. Dendrochronological analyses were not conducted on Q. ilex because of their small size and more difficult cross-dating of annual rings.

2.2. Remote Sensing Information

The NDVI is a commonly used vegetation index, which measures changes in vegetation cover and photosynthetic active tissues (greenness), derived from the near-infrared and red channels of remotely sensed imagery [12,13]. We calculated the kernel version of the NDVI (kNDVI) at annual resolution and for the period 2000–2022 using the Google Earth Engine, a cloud-based platform for multitemporal analysis of satellite imagery. We analyzed 30 m resolution Landsat 7 ET+ images (USGS, NASA) in this study (images available at https://www.usgs.gov/landsat-missions/, accessed on 15 March 2023).
We obtained the kNDVI values for the two most affected areas dominated by P. halepensis and Q. ilex [14,15]. We eliminated cloudy images and harmonized different Landsat sensors (TM, ETM+, OLI) to obtain the annual kNDVI values, which were calculated as means of monthly values. The kNDVI values were obtained considering 50 m circular buffers centered in the two selected patches. The kNDVI is an improved version of the NDVI, which corrects part of saturation effects, phenological cycles and seasonal variations, and shows stronger correlations than the NDVI with gross primary production [15].

2.3. Tree-Ring Width Data

We used dendrochronology to quantify changes in radial growth and growth responses to drought, including resilience [16]. Cores were air-dried in the laboratory, glued into wooden supports, and their surface was sanded to enhance the visibility of tree-ring limits. Then, cores were scanned at 2400 dpi using a high-resolution scanner (Epson Expression 10.000 XL, Seiko Epson Corp., Suwa, Japan). Ring widths were measured with a 0.001 mm resolution using CDendro and CooRecorder software ver. 9.3.1 (Cybis Elektronik & Data AB, Stockholm, Sweden) [17]. Cross-dating was checked using COFECHA software [18], which allowed calculating moving correlations between the individual series and the mean series of each treatment.
To calculate climate–growth relationships, we removed age-, disturbance- or size-related influences on tree-ring width through detrending [16]. Individual tree-ring width series were detrended using a cubic smoothing spline with a 50% frequency response cutoff at 2/3 length of series. Then, autoregressive models were applied to each detrended series to remove the first-order autocorrelation and to obtain residual or pre-whitened ring-width chronologies. These indexed series were averaged by using a bi-weight robust mean to develop site-level mean series or chronologies for the three study sites.
We calculated several statistics to characterize growth variability, namely: the first-order autocorrelation (AR1) of ring-width series to measure the persistence in growth and the mean sensitivity (MSx), which is the relative change in width between consecutive rings of indexed, non-prewhitened data, i.e., standard chronologies [16,19]. We also obtained the mean inter-series correlation (Rbar), which measures the growth coherence among trees [19]. These variables were calculated over the common and best-replicated period of 1980–2021. Comparisons of growth and NSCs between stands or species were carried out using Mann–Whitney tests.
Climate–growth relationships were assessed by calculating Pearson correlations between monthly or annual (hydrological year) climate variables (mean temperature, total precipitation) from the Daroca station, which has a longer and more homogeneous record than Calamocha (Figure S2), and series of residual ring-width indices. Correlations were calculated as follows: (i) considering the best-replicated period 1980–2020, and (ii) from the prior to current September, since climate conditions in the previous year influence growth in the following year [16]. All analyses were carried out using the R statistical package ver. 4.1.3 [20]. Detrending, chronology building and the calculation of dendrochronological statistics were performed using the dplR package [21]. The resilience indices were calculated using the pointRes package [22]. Climate–growth correlations were calculated using the treeclim package [23].

2.4. Analyses of NSCs in Leaves and Sapwood

To analyze NSCs, sampling was conducted in the most defoliated P. halepensis stand and in a nearby Q. ilex population (40.960° N, 1.305° W, 873 m a.s.l., aspect W, slope 5°) which also showed defoliation after the 2021 cold spell (Figure 2). Sampling of leaves and sapwood for NSC analyses was carried out in early (29 June) and late summer (30 August) 2021, i.e., about 5.5 and 7.5 months after the January 2021 cold spell, respectively.
We collected leaves and sapwood within 10:00 and 12:00 h to avoid diurnal variability in NSC concentrations. Current-year leaves were collected from three branches located in the upper, light-exposed side of crowns since young needles account for a high proportion of total NSCs in conifers [24]. Stem sapwood samples were taken at 1.3 m using a Pressler increment borer.
After being collected in the field, needle and wood samples were taken to the laboratory in a portable cooler. Needles were oven-dried at 60 °C for 72 h. Wood samples were subsequently frozen and stored at −20 °C until freeze-dried after removing the bark and phloem. All dried samples were weighted and milled to a fine powder in a ball mill (Retsch Mixer MM301, Leeds, UK) prior to chemical analyses.
Soluble sugars were extracted with 80% (v/v) ethanol and their concentration determined colorimetrically at 490 nm, using the phenol–sulphuric method [25,26]. Starch and complex sugars remaining in the undissolved pellet after ethanol extractions were enzymatically reduced to glucose and analyzed [27,28]. To gelatinize starch, samples were incubated in a 4 cm3 sodium acetate buffer in a shaking water bath at 100 °C for 1 h. After cooling to room temperature, 1 cm3 of amyloglucosidase solution (0.5% amyloglucosidase 73.8 U/mg, Fluka 10,115, in acetate buffer) was added and the samples were incubated overnight for 16 h at 50 °C. After centrifugation, the concentration of starch and complex sugars as glucose equivalents was determined colorimetrically as described above using a spectrophotometer (Bio-Tek Instruments, Colmar, France). Enzyme blanks were included in each set of samples, and their absorption was subtracted from each sample’s absorbance prior to calculation of sugar content. The coefficient of variation of the extraction and measurement procedure determined from three independent replicates of the same powder did not exceed 8%.
NSCs measured after ethanol extraction are referred to as soluble sugars, and carbohydrates measured after enzymatic digestion are referred to as starch. Both are expressed in glucose equivalents. The sum of soluble sugars and starch is referred to as total NSCs.

3. Results

3.1. The Early January 2021 Cold Spell

On 12 January 2021, air temperatures reached minimum values of −21.3 °C and −13.5 °C in the Calamocha and Daroca meteorological stations, respectively (Figure 1). These low temperatures were significantly lower (p < 0.001) than the long-term means of each station and corresponded to a very extreme temperature range in an European geographical context (Figure S3).

3.2. Crown Damage and kNDVI

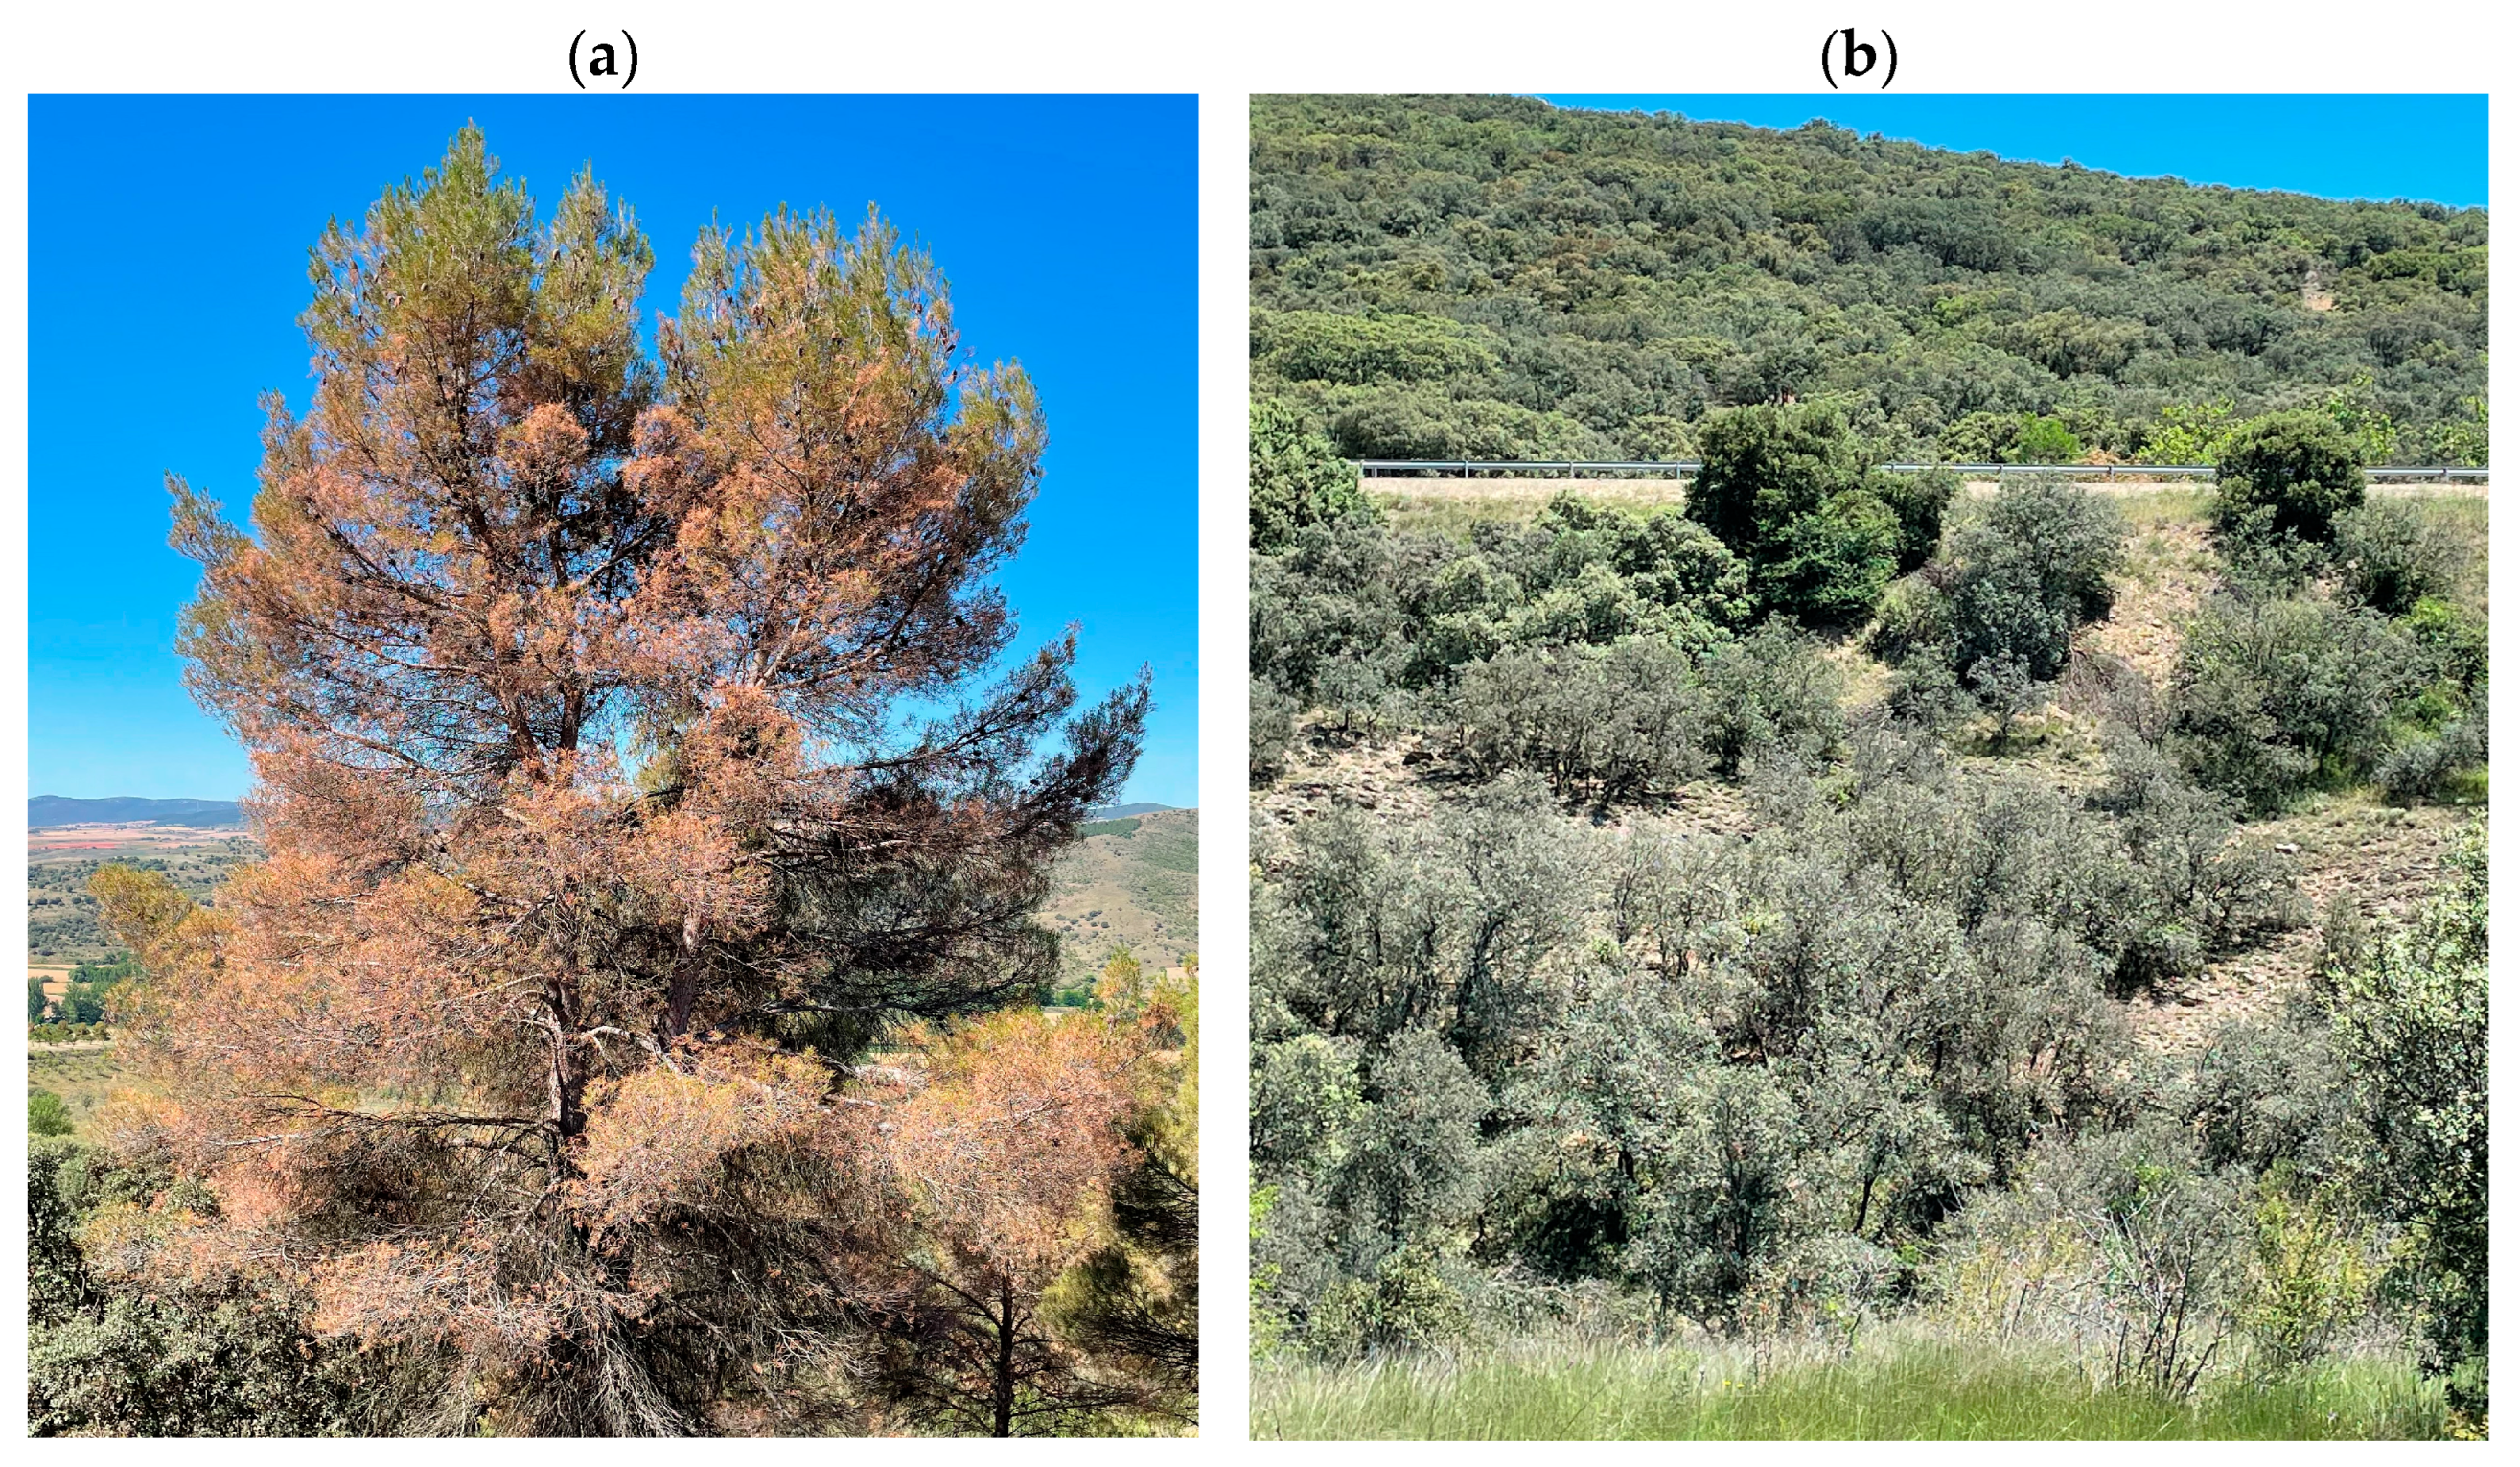
Damage (leaf browning and shedding, shoot and leaf death, crown defoliation) was observed in planted P. halepensis and C. arizonica trees, and also in the native Q. ilex, particularly at low elevation or in concave sites where temperature inversion could have favored the persistence of local cold air masses (Figure 2).
Some of the most damaged areas dominated by P. halepensis and Q. ilex were located at 40.996° N, 1.306° W (926 m a.s.l.) and at 41.220° N, 1.252° W (867 m a.s.l.), respectively (Figure 2). They were characterized by abundant leaf and shoot death and shedding, particularly in the case of Q. ilex which also showed dead buds and branches, with dead brown needles still attached to shoots in the case of P. halepensis.
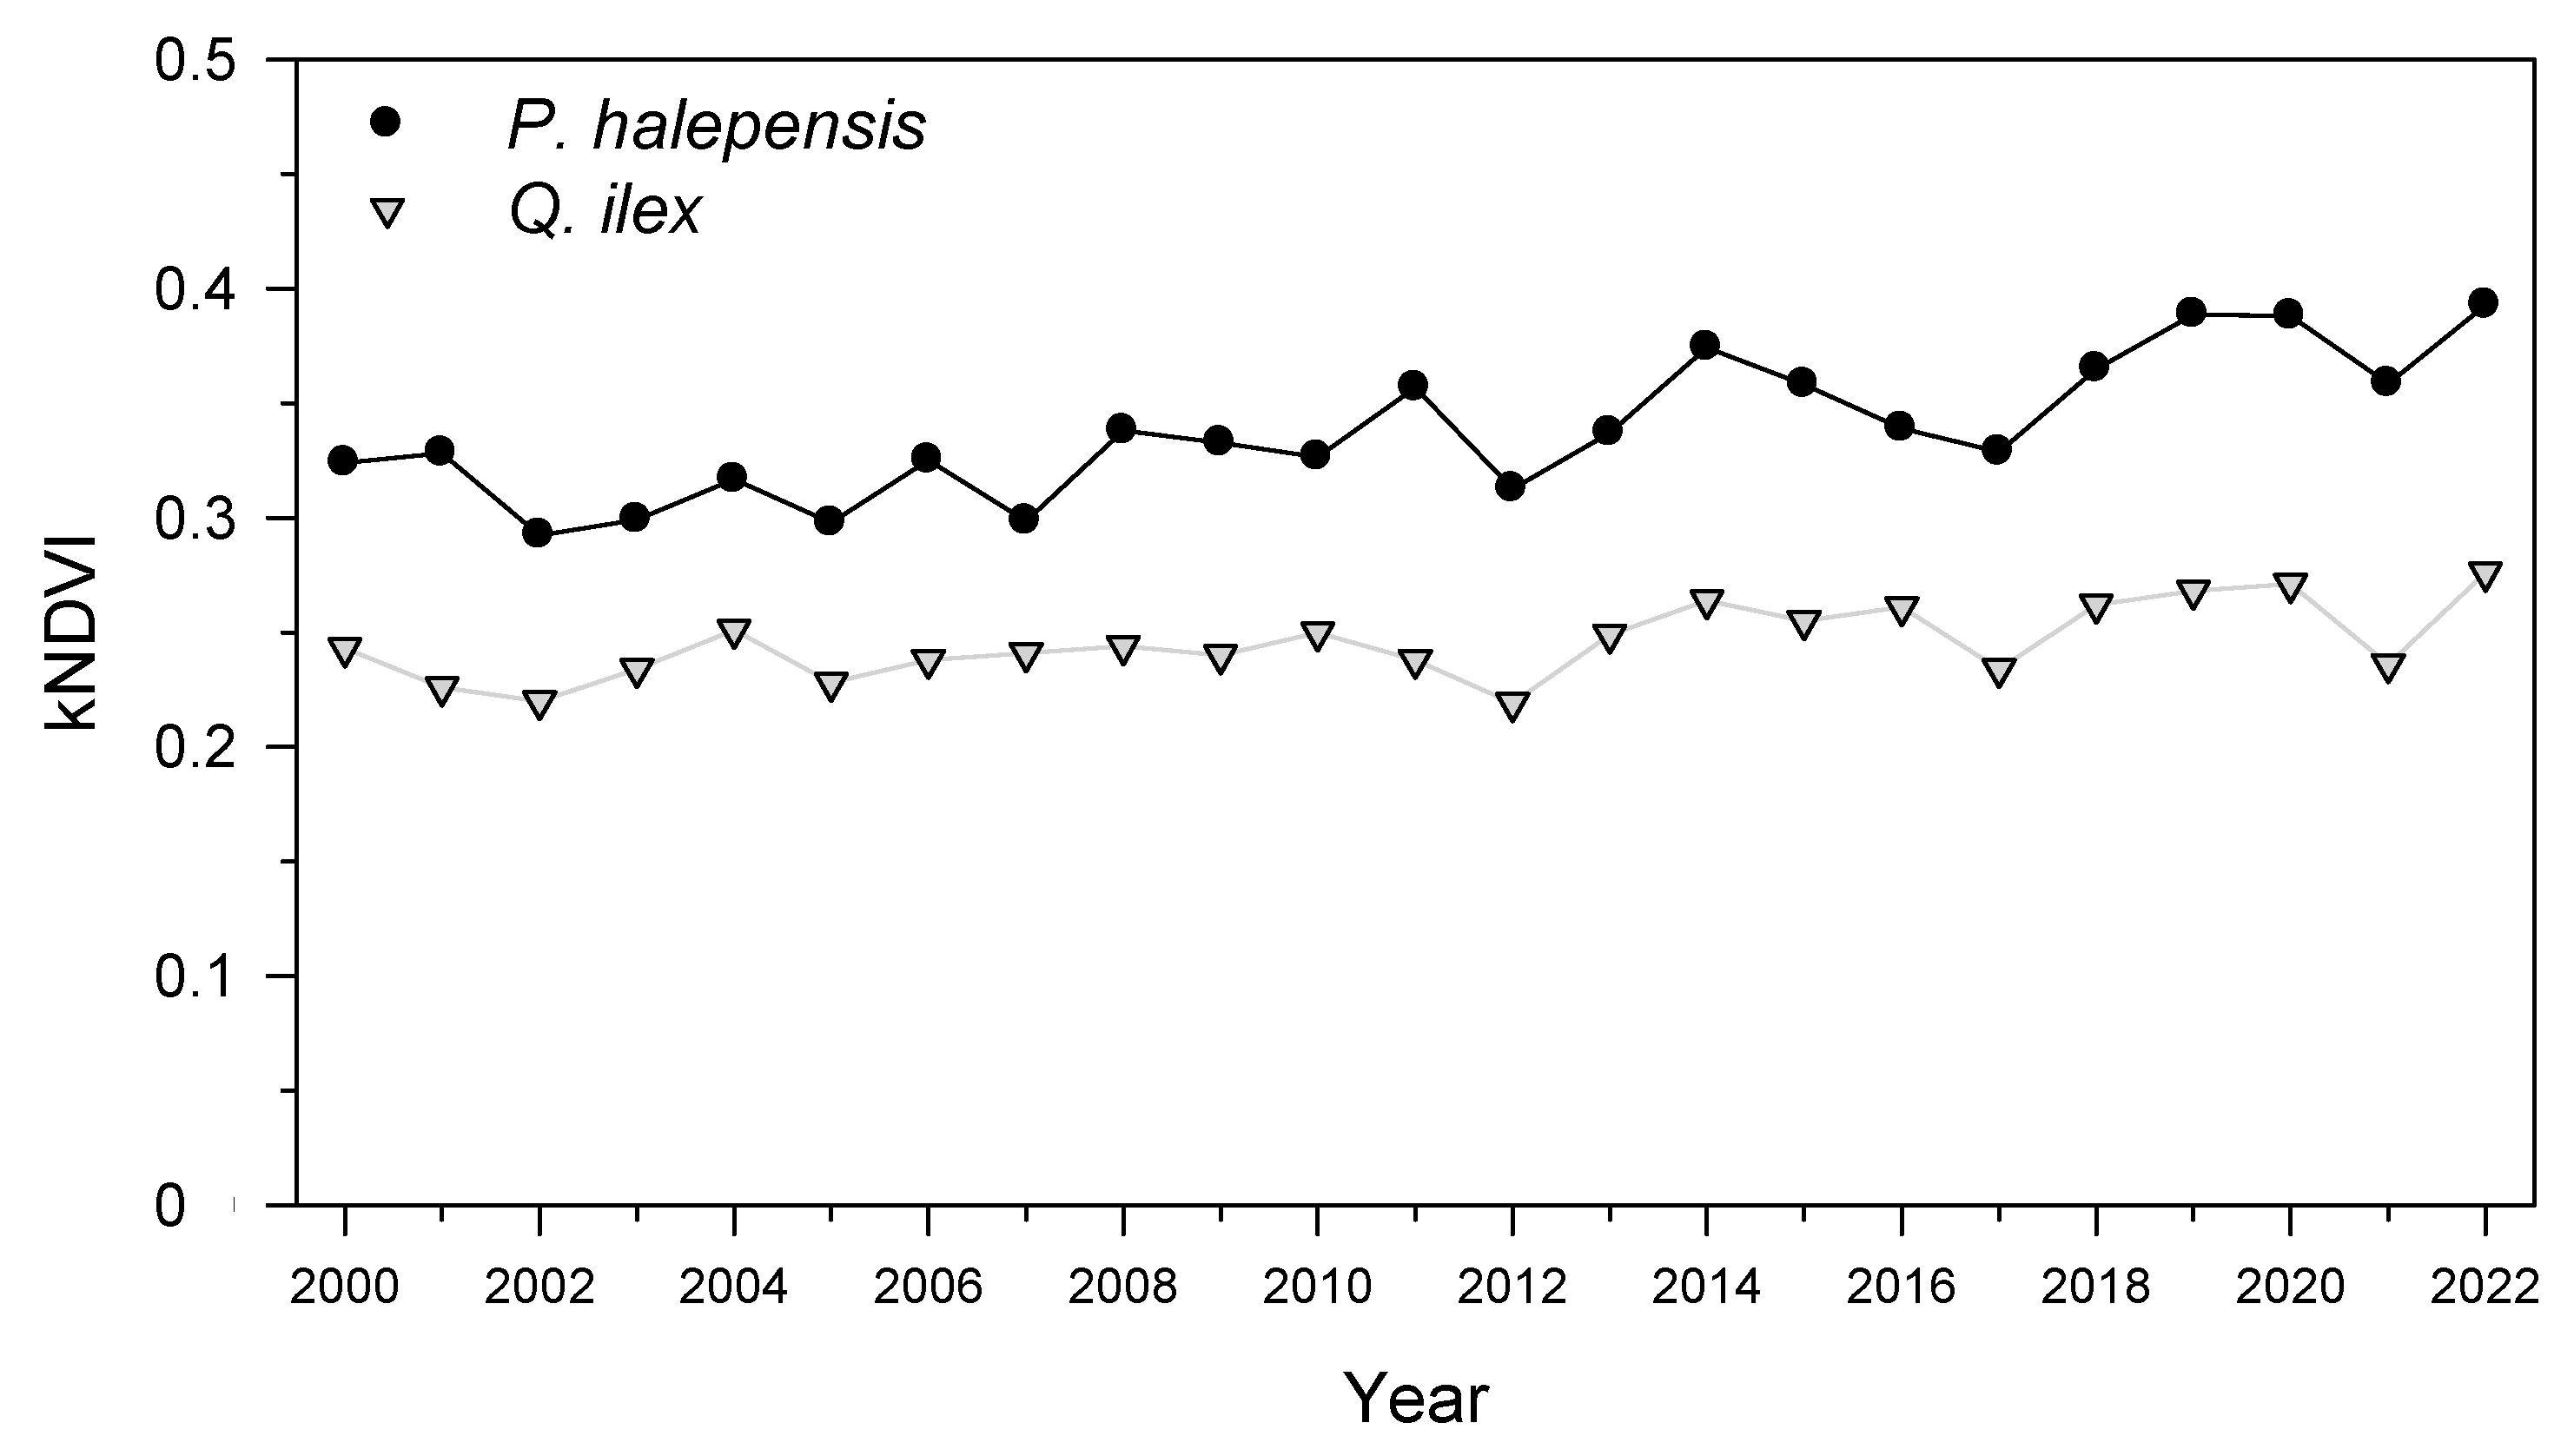
We detected a drop of kNDVI in 2021 in the defoliated P. halepensis (−8%) and Q. ilex (−13%) stands (Figure 3). Comparable drops were also observed in the dry 2005 (−6% to −9%) and 2012 (−8% to −12%) years. In 2022, kNDVI showed also a remarkable recovery in the previously affected P. halepensis (+9%) and Q. ilex (+17%) stands.

3.3. Growth Patterns and Responses to the Cold Spell

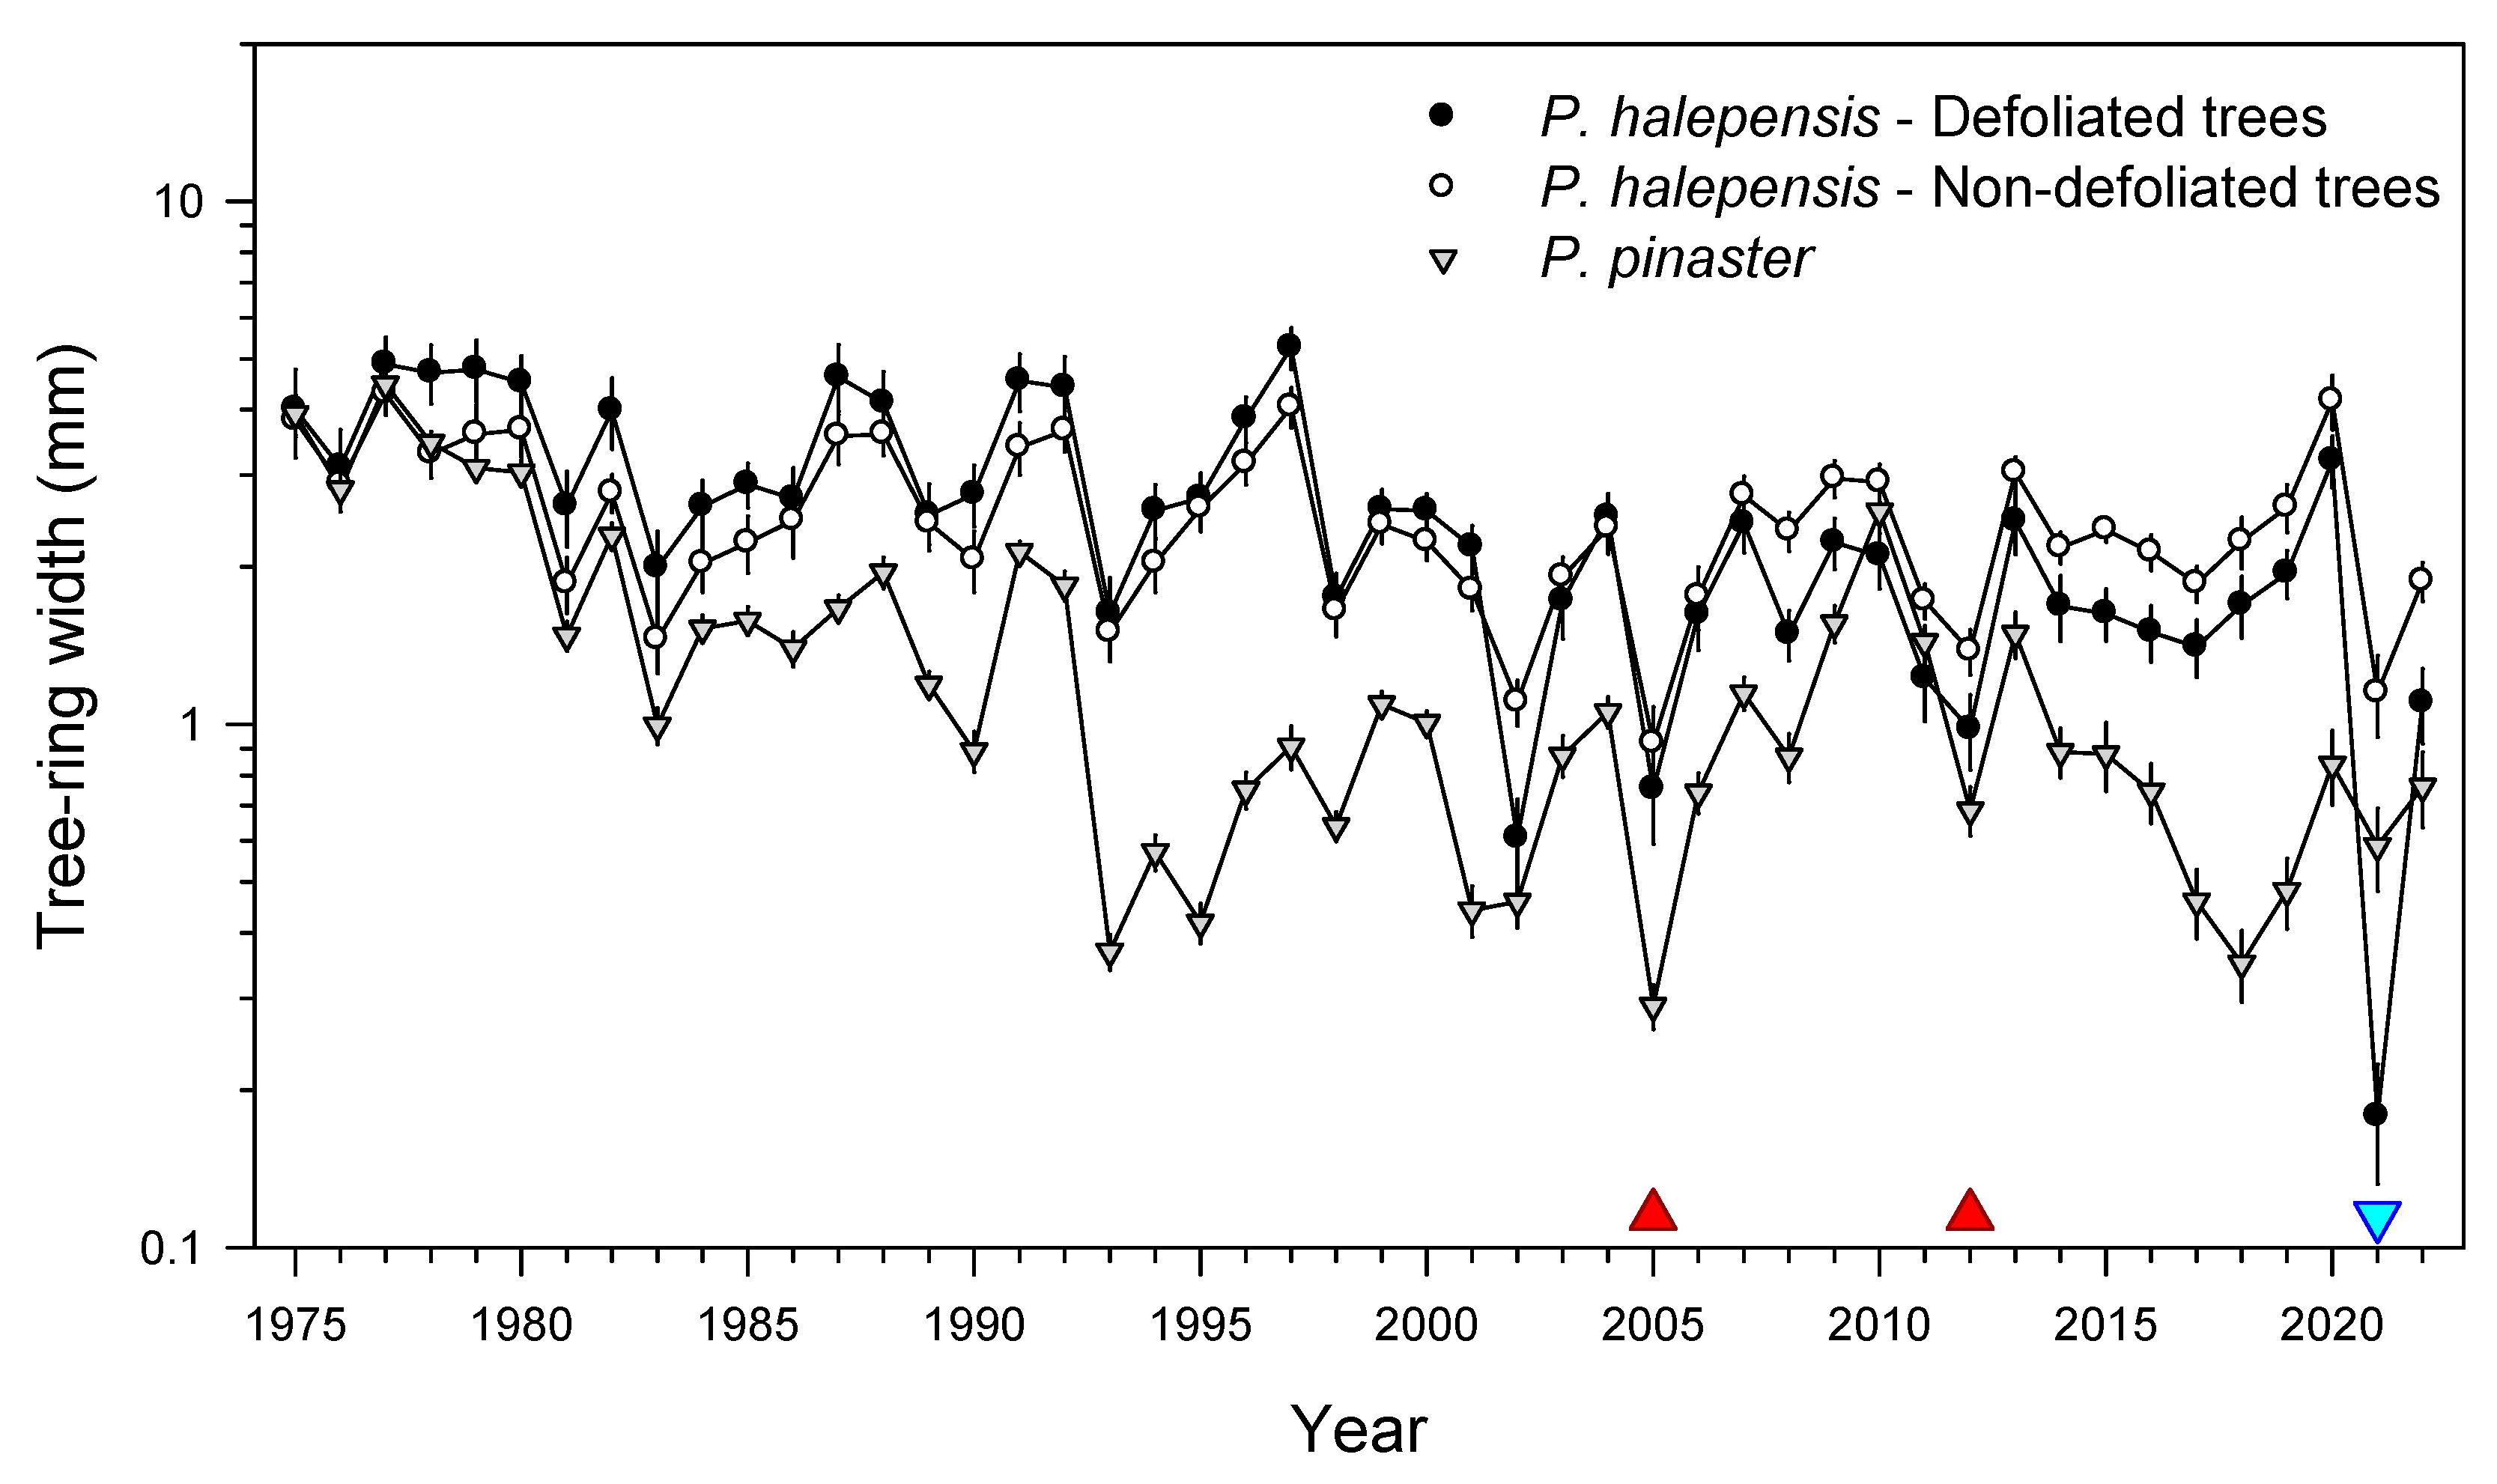
We found that currently defoliated P. halepensis trees were growing more in the past that non-defoliated conspecifics (Table 1), although they started to grow less than non-defoliated conspecifics from 2008 onwards, after the severe 2005 drought. Growth of sampled pines decreased during the 2005 and 2012 droughts, but a severe growth reduction was observed in 2021, which was significantly (p = 0.002) lower in defoliated P. halepensis trees than in non-defoliated conspecifics and P. pinaster trees (Table 1, Figure 4). The 2021 ring of defoliated trees was very narrow (0.52 ± 0.35 mm), and in half of them latewood was not produced. The post-2021 growth recovery was high in defoliated P. halepensis trees and intermediate in non-defoliated P. halepensis and P. pinaster trees. Defoliated P. halepensis trees showed a higher MSx but a lower Rbar than non-defoliated trees.

3.4. Growth Responses to Climate

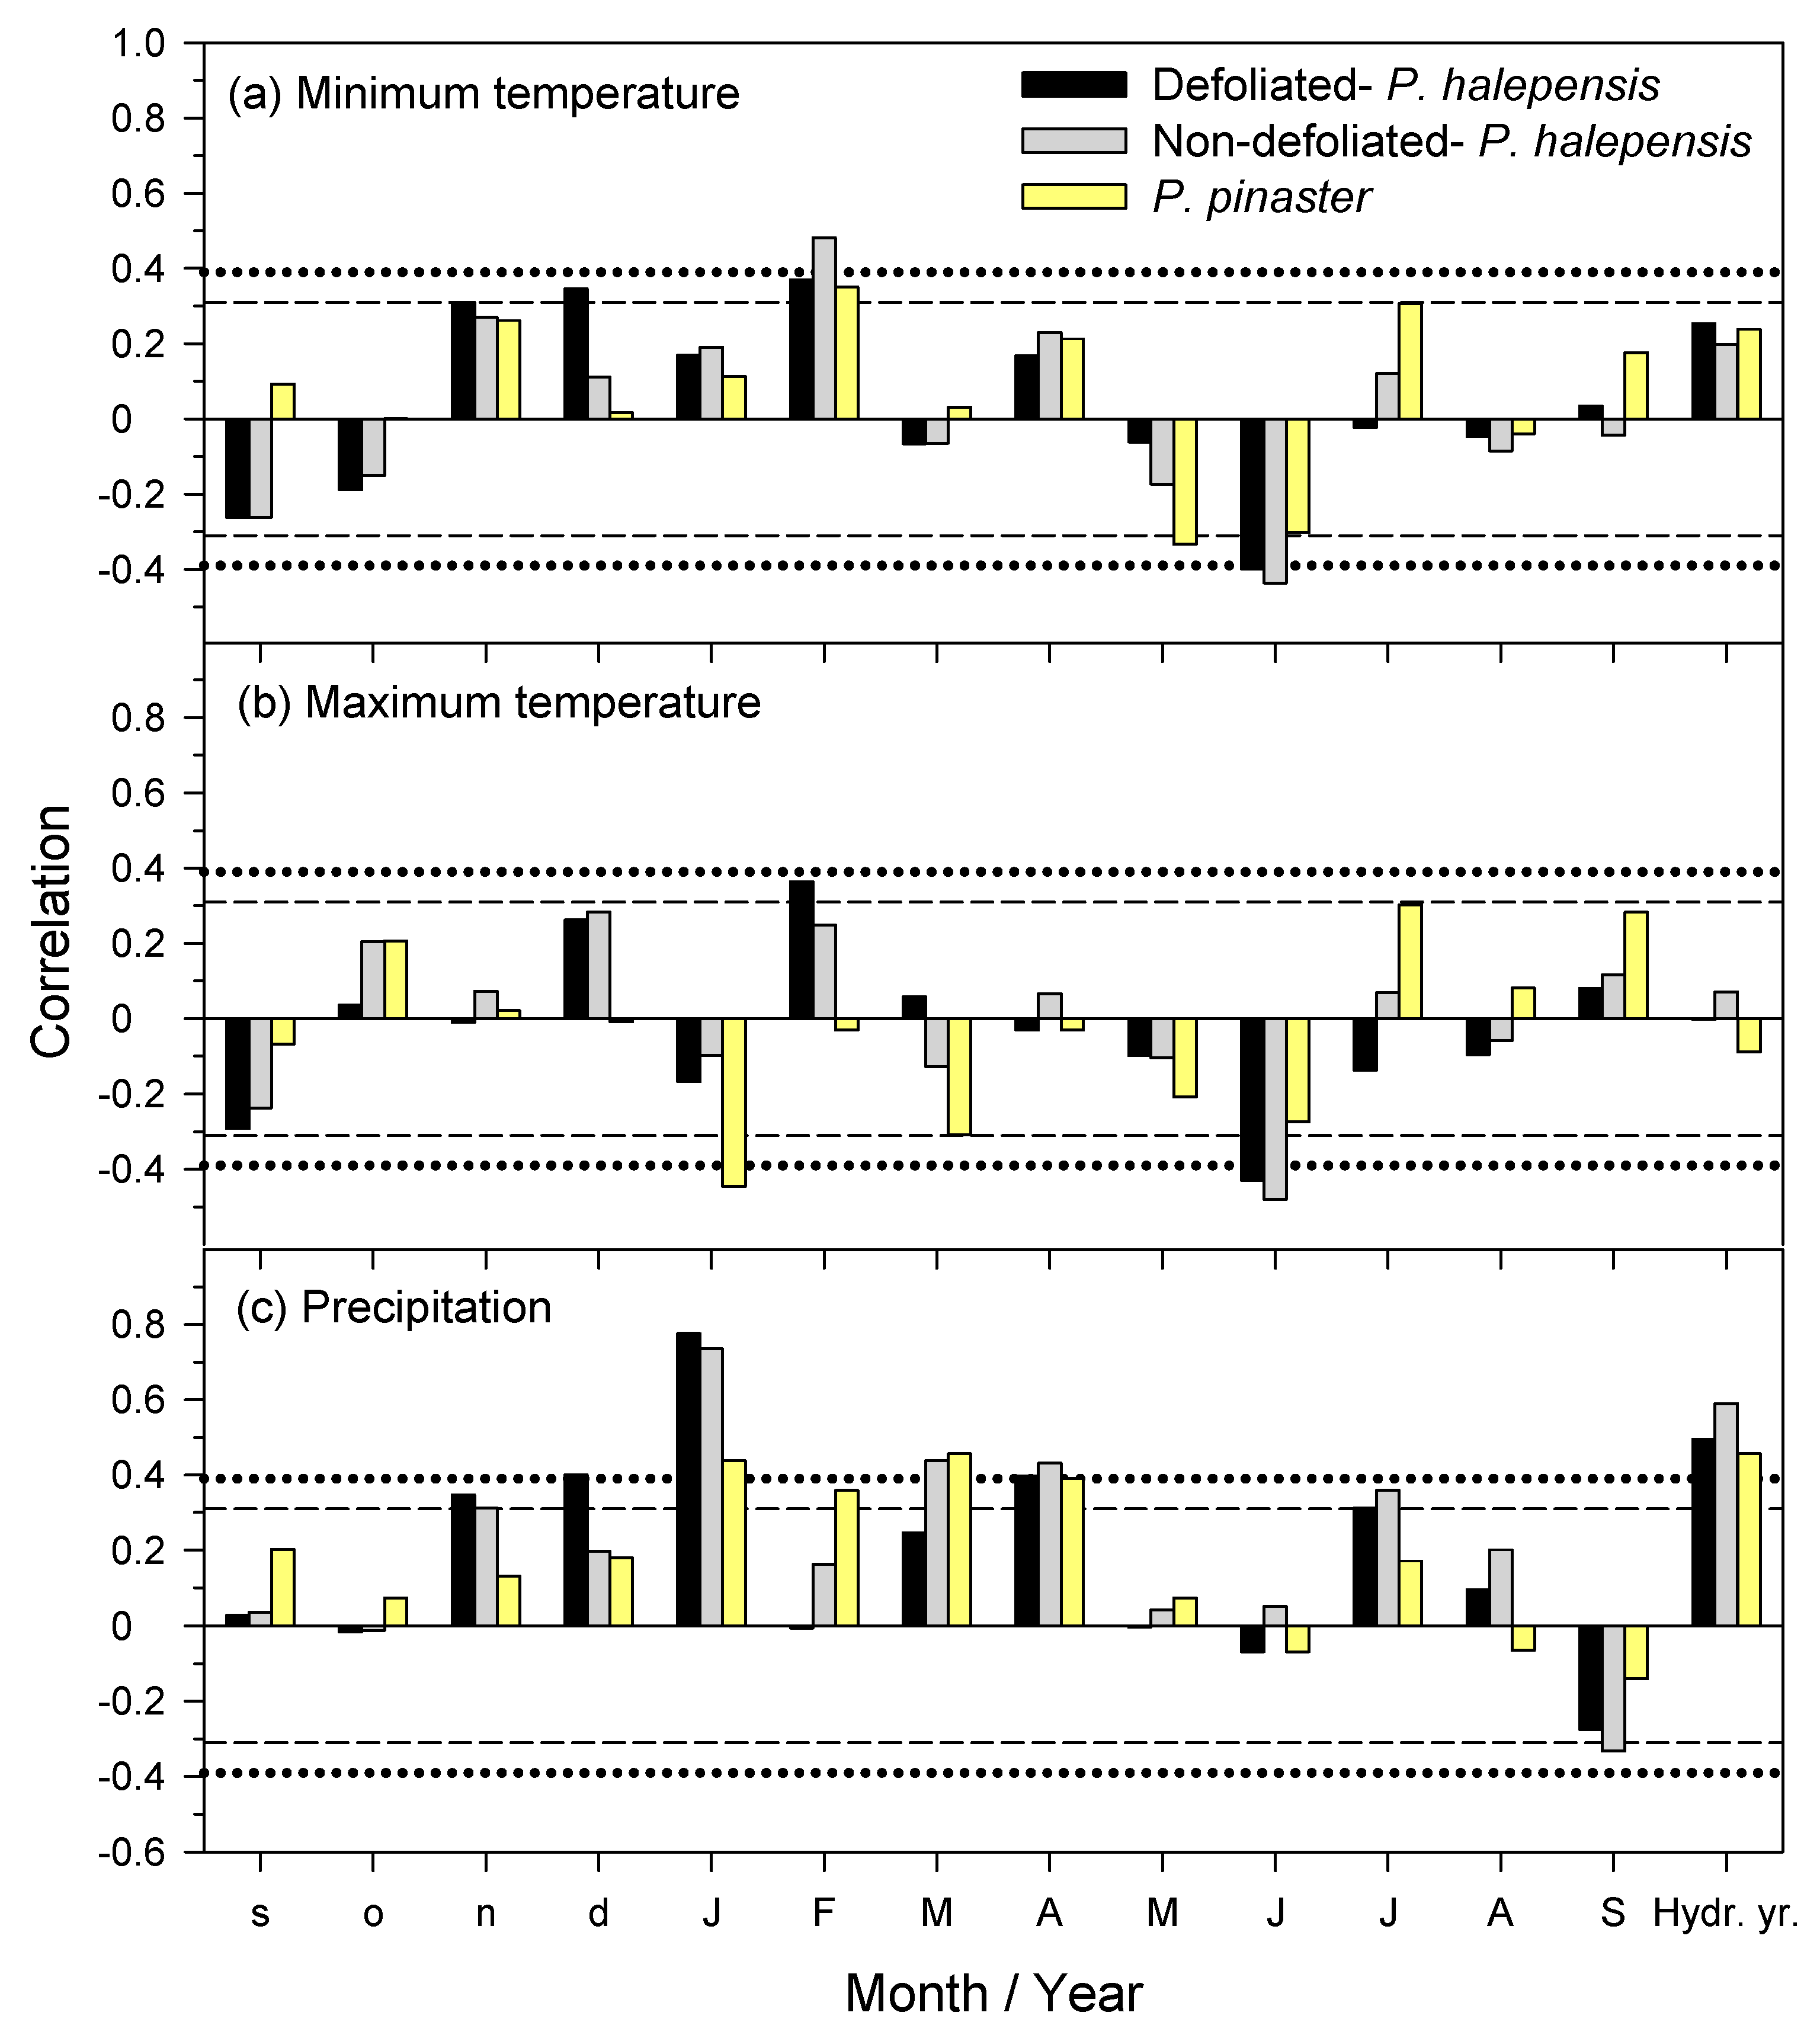
Regarding growth responses to climate of the three sampled pines, high minimum February temperatures were positively correlated with growth indices, whereas the correlation with June minimum and maximum temperatures was negative (Figure 5). Defoliated P. halepensis trees responded more to February maximum temperatures, whilst non-defoliated P. halepensis trees responded more to February minimum and June temperatures. The growth indices of P. pinaster negatively responded to high minimum temperatures from May to June and high maximum temperatures in January and March. Wet conditions from the prior November-to-April period and during the hydrological year improved growth. January precipitation was the main climate driver of growth, particularly in the case of P. halepensis. Wet July conditions also enhanced growth, but high precipitation in September negatively correlated with growth of non-defoliated P. halepensis trees. Growth indices of defoliated P. halepensis trees responded more to December–January precipitation (r = 0.69) than those of non-defoliated P. halepensis (r = 0.54) and P. pinaster trees (r = 0.36).

3.5. NSC Concentrations in Leaves and Stem Sapwood

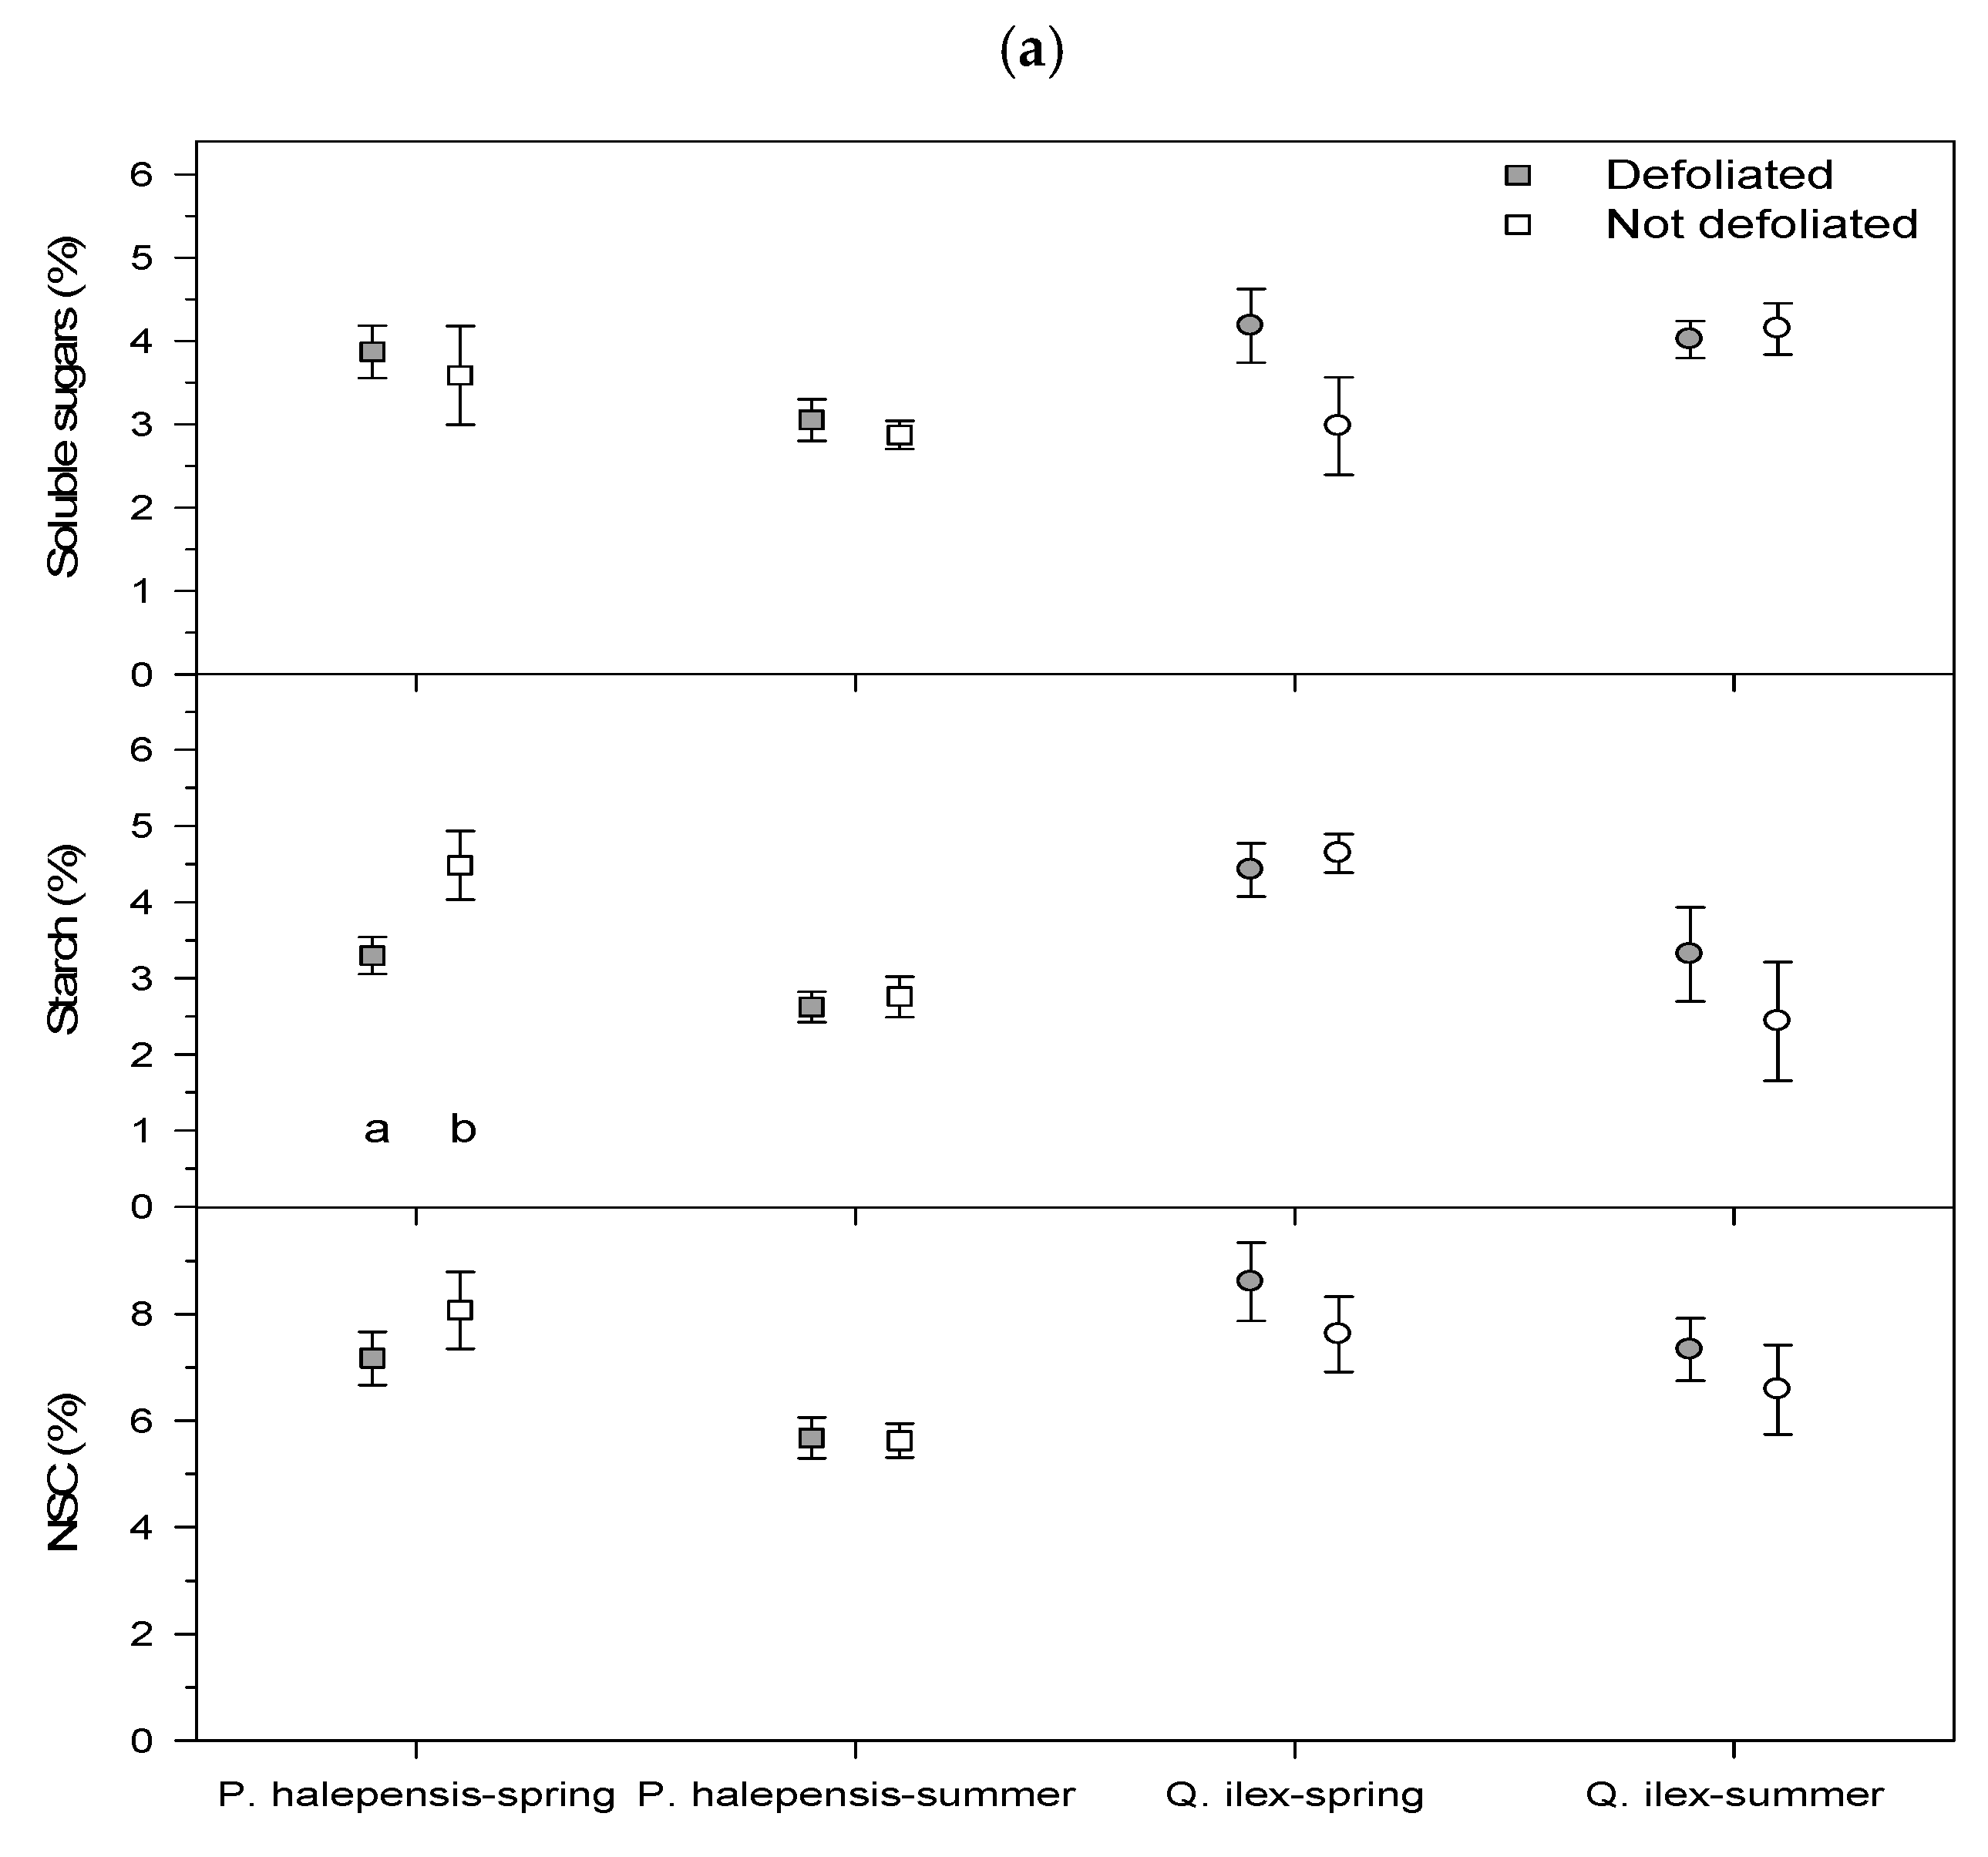
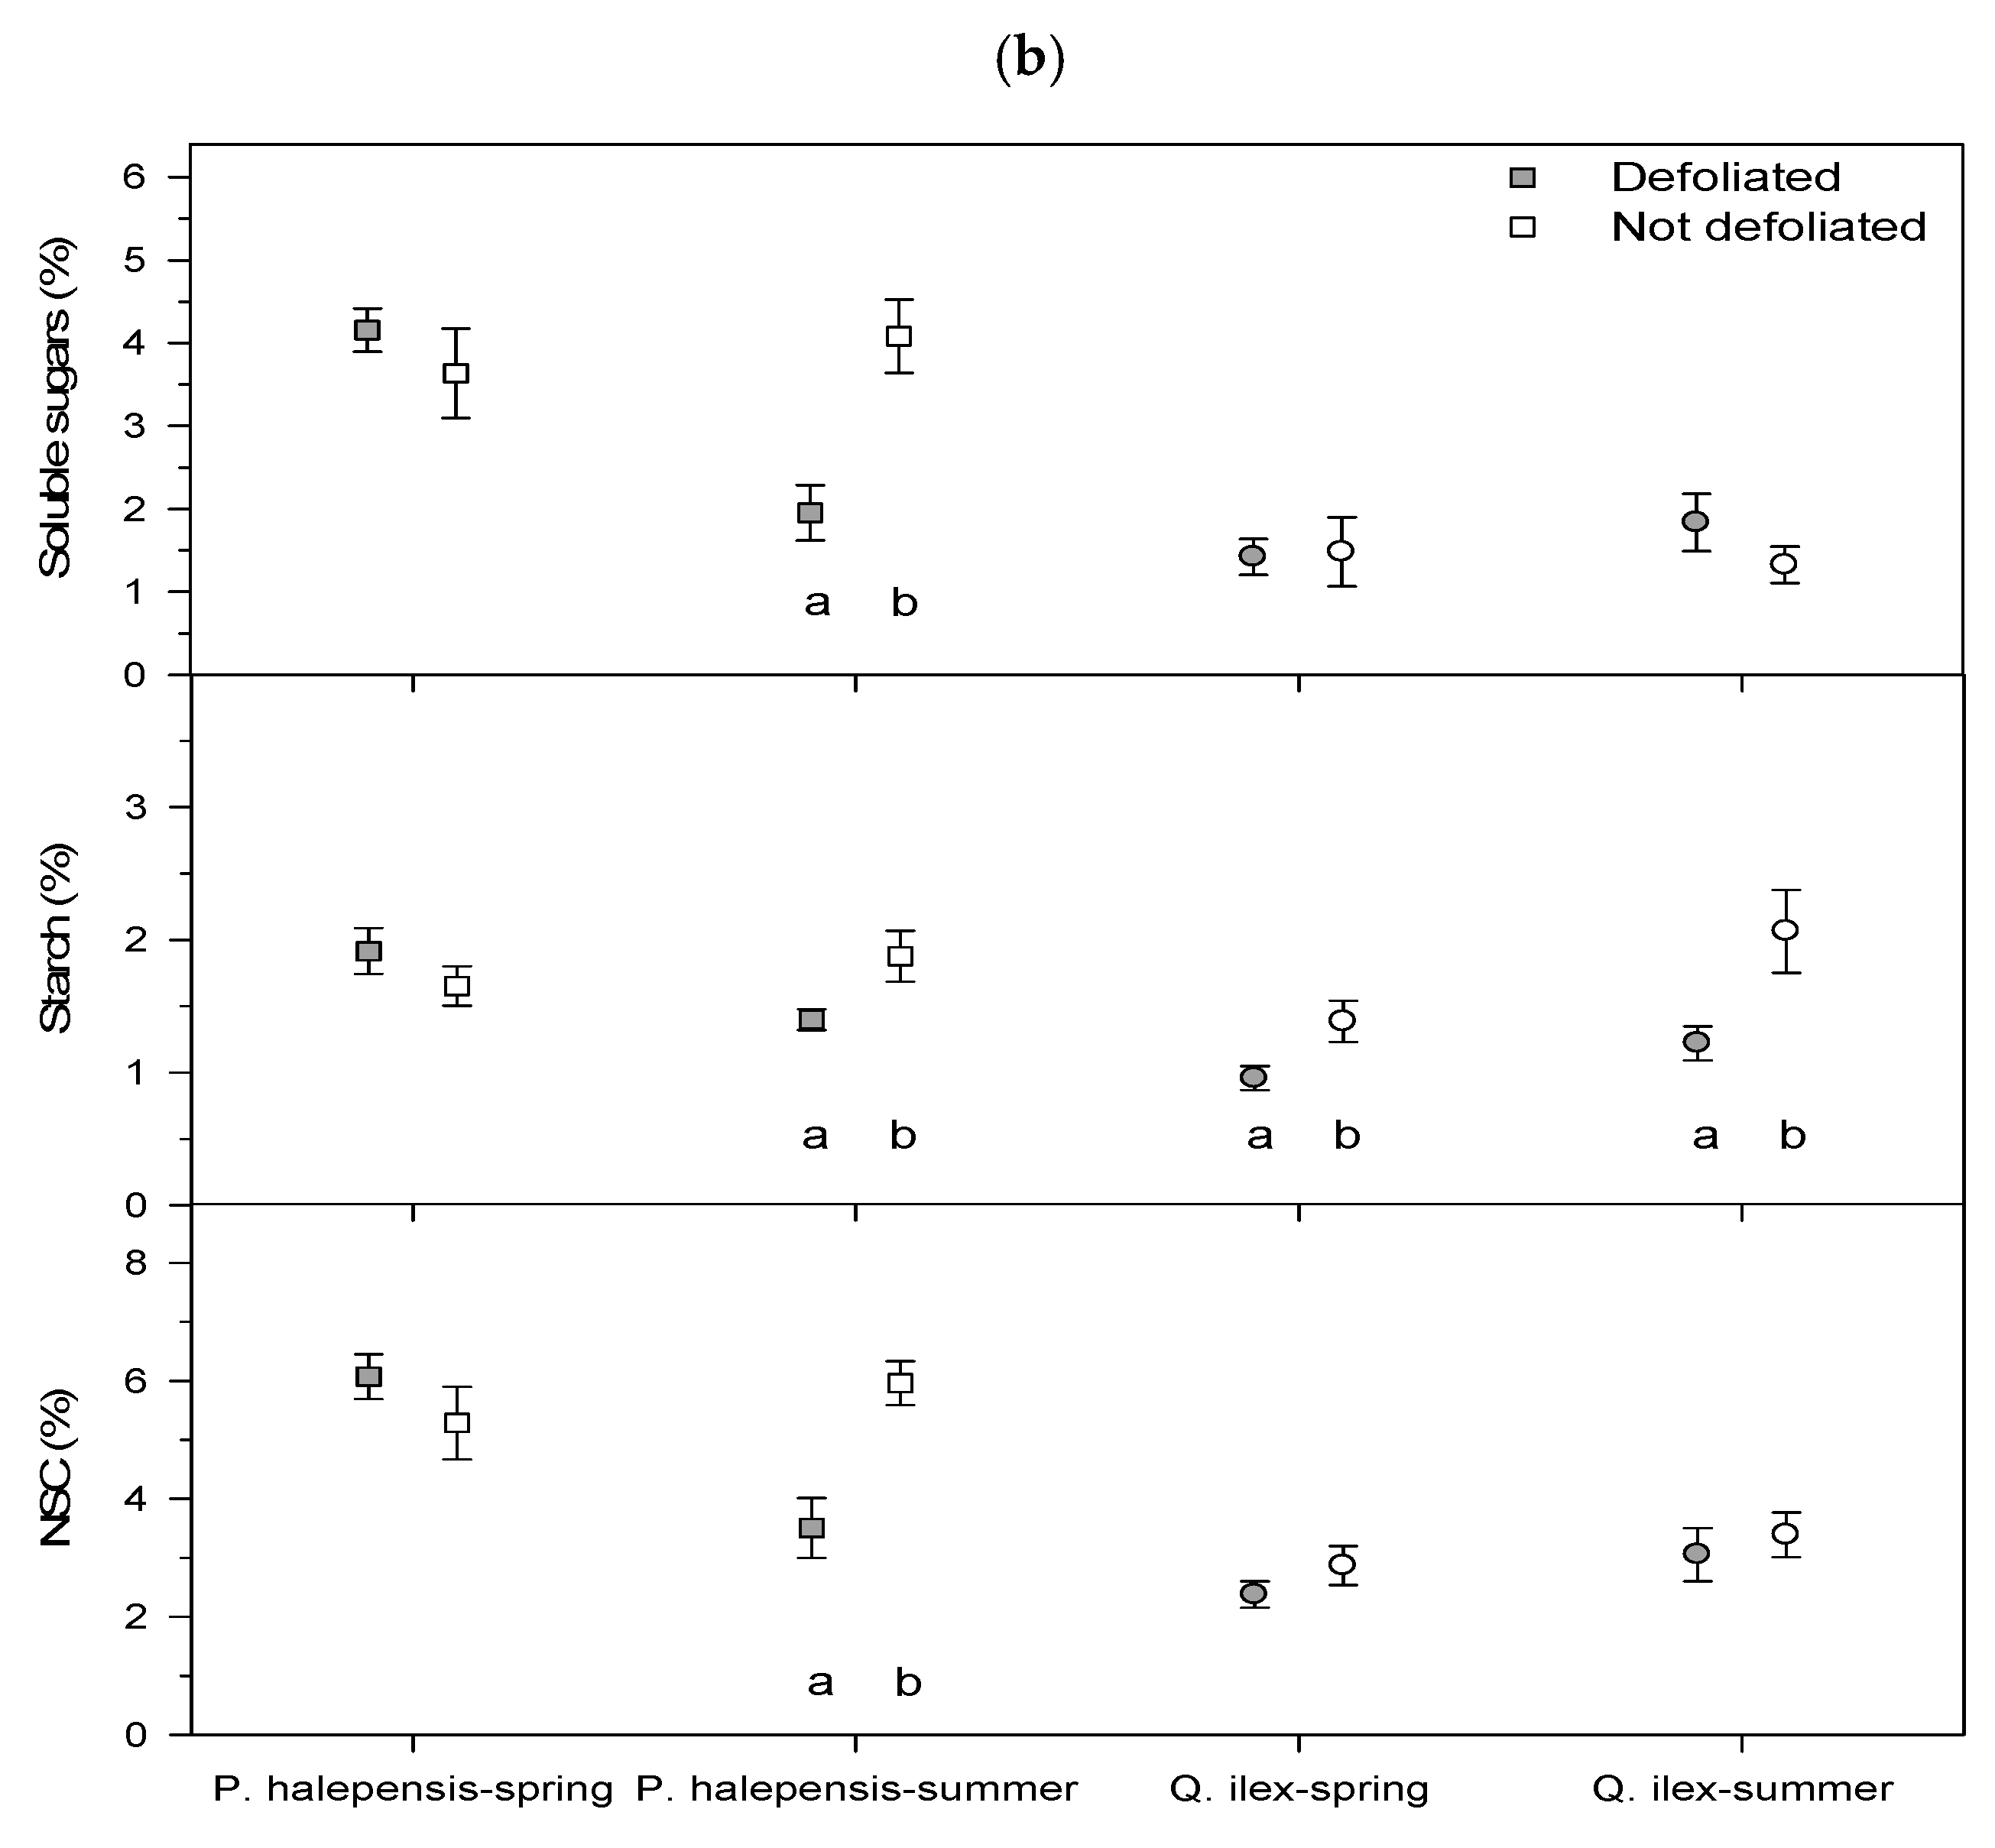
In spring 2021, defoliated P. halepensis showed lower leaf starch concentrations than non-defoliated P. halepensis trees, whilst this was observed in the Q. ilex sapwood (Figure 6). In summer, there were lower concentrations of soluble sugars, starch and NSCs in the sapwood of defoliated P. halepensis trees, and also in the sapwood starch of Q. ilex.

4. Discussion

As hypothesized, tree species of subtropical origin dominant in Mediterranean forests, such as P. halepensis and Q. ilex, showed stronger losses in growth than P. pinaster, which can be found in colder sites. We found that the January 2021 cold spell led to a decrease in forest cover in the most defoliated pine (P. halepensis) and oak (Q. ilex) stands, reduced radial growth of defoliated P. halepensis and diminished sapwood NSC concentrations in P. halepensis and Q. ilex. As expected, the defoliated P. halepensis showed the strongest growth reduction in 2021 and lower NSC concentrations (leaf starch in spring, sapwood soluble sugars and starch in summer) than non-defoliated P. halepensis trees. However, they showed a high growth recovery capacity, comparable to that of non-defoliated conspecifics. In the case of Q. ilex, defoliated individuals presented lower starch sapwood concentrations than conspecifics in spring and summer. Some possible explanations for these findings are discussed below.
The extreme low air temperatures, which lasted several days, probably caused cold-induced xylem embolism, contributing to a loss of hydraulic conductivity and growth as has been observed in the alpine treeline [29]. The cold spell was not preceded by a very warm autumn, which could have contributed to tissue dehardening, or by dry conditions or anticyclonic conditions leading to high radiation levels and pronounced leaf-to-air temperature differences enhancing water loss by transpiration [30]. In addition, snow cover was deep in many sites, probably insulating shallow soils and avoiding rapid drops of soil temperatures which can also damage forests by constraining soil water uptake [6]. Overall, the studied damages, basically crown defoliation, seem to be directly caused by the January 2021 cold spell, with 4–9 days having minimum temperatures lower than the long-term means. In addition, these damages were more frequent in concave microsites or in sites with W-SW exposure. If damage was higher in S exposure sites, freeze–thaw cycles would be the most plausible cause of hydraulic dysfunction [29].
The fact that planted P. halepensis individuals were more affected than co-occurring P. pinaster trees agrees with their geographical distribution and ecological requirements. Mediterranean pines of subtropical origin inhabiting mild or cool winter locations, such as P. halepensis, are vulnerable to frost damage, as several studies on seedlings have illustrated [31,32]. For instance, P. halepensis seedlings had the lowest frost survival rate and the highest vulnerability to needle damage among several Iberian pine species [31]. According to these experiments, seedling survival would be nil below −20 °C. However, in our study, temperatures below that threshold were measured in the Calamocha station and adult pines still survived. This discrepancy could be explained by a higher tolerance to cold damage of adults as compared to seedlings or to warmer microclimate conditions in the forest compared with the meteorological stations located in towns. More precise in situ measurements of microclimate conditions are required to test this idea.
At the individual scale, it is noteworthy that the defoliated P. halepensis individuals grew more and showed a higher responsiveness to December–January precipitation than non-defoliated P. halepensis and P. pinaster prior to the cold spell. In a nearby site where Pinus sylvestris L. stands experienced winter-drought dieback, the most affected trees also showed higher growth rates and lower water-use efficiency prior to the dieback [33]. These patterns suggest that the most affected P. halepensis trees were predisposed to the cold-spell damages because of their high growth rates and probably more of a “water-spender” strategy as compared with non-defoliated conspecifics, i.e., fast-growing trees were less likely to endure harsh winter cold spells. To test this hypothesis, tree-ring wood C and O isotopes and wood anatomical variables (e.g., lumen area) could be measured in those two types of trees. Furthermore, defoliated P. halepensis trees started to grow less than non-defoliated conspecifics from 2008 onwards, which we interpreted as a differential response to the 2005 drought, which could have impaired the ability of the defoliated individuals to access deep soil water sources or to fully recover after a severe water shortage.
Despite the outer stem sapwood and leaves representing a large biomass amount in conifers and accounting for a high proportion of total NSC pools [12], few differences in leaf NSC concentrations were found when comparing defoliated and non-defoliated trees, excepting P. halepensis starch in spring, whereas more differences were found considering sapwood NSCs (soluble sugars and starch of P. halepensis in summer, starch of Q. ilex in spring and summer). The cold spell reduced the sapwood NSCs of P. halepensis in summer, diminishing the resilience capacity of trees to withstand summer drought since soluble sugars can be used as osmolytes and provide freezing tolerance [34]. The decrease of sapwood starch concentrations could also negatively impact growth (or sprouting capacity of Q. ilex) since starch is a storage compound and it is particularly abundant in sprouts and roots [34]. Nevertheless, carbon starvation is rare in defoliated trees showing severe growth reduction [28]. To reach a critical survival threshold due to strong NSC drawdown (carbon starvation), crown defoliation should be higher than 75% and root NSC concentrations lower than 1.5% [35]. This was not so in our case, since all sampled trees survived the 2021 cold spell and did not show such high defoliation levels. Therefore, differences were found in sink organs such as sapwood, where NSCs are stored in parenchyma cells, but not in C sources such as leaves, suggesting a rapid NSC replenishment of the main photosynthetic tissues. There could also be additional links between growth responses to climate and shifts in NSC concentrations. For instance, the positive effect on radial growth of high minimum February temperatures but the negative effect of high maximum January temperatures, at least for P. pinaster, could be due to enhanced carbohydrate consumption triggered by a wide thermal range in winter as has been observed in other evergreen conifers [36]. Nevertheless, the patterns of accumulation and loss of NSCs, especially starch, may or may not be correlated with cambial activity and radial growth [37].

5. Conclusions

Mediterranean tree species of subtropical origin such as P. halepensis and Q. ilex, which are adapted to withstand droughts, showed stronger growth reductions due to the cold spell, whereas P. pinaster was less affected. Overall, cold spells are less a concern than droughts or heat waves in the study regions, since the former are less frequent and we documented a high recovery capacity of the most defoliated P. halepensis and Q. ilex stands. Forest and canopy cover, radial growth and leaf and, mainly, sapwood NSCs were impacted by the cold spell. However, we observed that forest cover and radial growth recovered the following year, showing a high resilience capacity of both planted conifers (P. halepensis) and native hardwoods (Q. ilex). Prior to the cold spell, defoliated P. halepensis trees grew more in response to wetter December–January conditions, which opened the question of whether they are predisposed to cold-induced xylem embolism. Future research should investigate the impacts of climate extremes on forest productivity and resilience considering situations with compound climatic factors such as low winter temperatures followed by severe summer drought.

Supplementary Materials

The following supporting information can be downloaded at https://www.mdpi.com/article/10.3390/f14040678/s1: Figure S1: Climate diagrams of Daroca and Calamocha meteorological stations; Figure S2: Daily means and values of minimum air temperatures recorded during the cold 2001–2002 and 2020–2021 winters in the Daroca meteorological station; Figure S3: Intra-period extreme temperature range (difference between daily maximum and minimum temperatures) calculated for January 2021 in European meteorological stations.

Author Contributions

Conceptualization, J.J.C.; methodology, J.J.C., M.C., C.V. and M.P.; software, J.J.C., M.C., C.V. and M.P.; validation, C.V., M.C. and M.P.; formal analysis, J.J.C.; investigation, J.J.C., M.C., C.V. and M.P.; resources, J.J.C.; data curation, J.J.C., M.C., C.V. and M.P.; writing—original draft preparation, J.J.C.; writing—review and editing, J.J.C., M.C., C.V. and M.P.; visualization, J.J.C.; supervision, J.J.C.; project administration, J.J.C.; funding acquisition, J.J.C. All authors have read and agreed to the published version of the manuscript.

Funding

This research was funded by the Spanish Ministry of Science and Innovation (grant number TED2021-129770B-C21 project).

Data Availability Statement

The data presented in this study are available on request from the corresponding author.

Acknowledgments

We thank Pedro Sánchez for his help in the field and Government of Aragón forest guards and technicians, particularly Felipe Rosado and Calamocha guards, for showing us the damaged stands and providing sampling permissions. We also thank the reviewers for carefully reading and improving previous versions of the manuscript.

Conflicts of Interest

The authors declare no conflict of interest.

References

  1. Easterling, D.R.; Meehl, G.A.; Parmesan, C.; Changnon, S.A.; Karl, T.R.; Mearns, L.O. Climate extremes: Observations, modeling, and impacts. Science 2000, 289, 2068–2074. [Google Scholar] [CrossRef] [PubMed] [Green Version]
  2. Gutschick, V.P.; BassiriRad, H. Extreme events as shaping physiology, ecology, and evolution of plants: Toward a unified definition and evaluation of their consequences. New Phytol. 2003, 160, 21–42. [Google Scholar] [CrossRef] [PubMed]
  3. Smith, M.D. An ecological perspective on extreme climatic events: A synthetic definition and framework to guide future research. J. Ecol. 2011, 99, 656–663. [Google Scholar] [CrossRef]
  4. Camarero, J.J.; Gazol, A.; Sancho-Benages, S.; Sanguesa-Barreda, G. Know your limits? Climate extremes impact the range of Scots pine in unexpected places. Ann. Bot. 2015, 116, 917–927. [Google Scholar] [CrossRef] [PubMed] [Green Version]
  5. Fang, W.; Yi, C.; Chen, D.; Xu, P.; Hendrey, G.; Krakauer, N.; Jensen, K.; Gao, S.; Lin, Z.; Lam, G.; et al. Hotter and drier climate made the Mediterranean Europe and Northern Africa region a shrubbier landscape. Oecologia 2021, 197, 1111–1126. [Google Scholar] [CrossRef]
  6. Kullman, L. Cataclysmic response to recent cooling of a natural boreal pine (Pinus sylvestris L.) forest in Northern Sweden. New Phytol. 1991, 117, 351–360. [Google Scholar] [CrossRef]
  7. Soulé, P.T.; Knapp, P.A. Topoedaphic and morphological complexity of foliar damage and mortality within western juniper (Juniperus occidentalis var. occidentalis) woodlands following an extreme meteorological event. J. Biogeogr. 2007, 34, 1927–1937. [Google Scholar] [CrossRef]
  8. Marchand, P.J. Life in the Cold; University Press of New England: Hanover, NH, USA, 1996. [Google Scholar]
  9. Pérez-González, M.E.; García-Alvarado, J.M.; García-Rodríguez, M.P.; Jiménez-Ballesta, R. Evaluation of the Impact Caused by the Snowfall after Storm Filomena on the Arboreal Masses of Madrid. Land 2022, 11, 667. [Google Scholar] [CrossRef]
  10. Camarero, J.J.; Colangelo, M.; Gazol, A.; Pizarro, M.; Valeriano, C.; Igual, J.M. Effects of windthrows on forest cover, tree growth and soils in drought-prone pine plantations. Forests 2021, 12, 817. [Google Scholar] [CrossRef]
  11. Rouse, J.; Haas, R.; Schell, J.; Deering, D. Monitoring Vegetation Systems in the Great Plains with ERTS. Third ERTS Symposium. NASA 1973, 1, 309–317. [Google Scholar]
  12. Jacquet, J.-S.; Bosc, A.; O’Grady, A.; Jactel, H. Combined effects of defoliation and water stress on pine growth and non-structural carbohydrates. Tree Physiol. 2014, 34, 367–376. [Google Scholar] [CrossRef] [PubMed]
  13. Gorelick, N.; Hancher, M.; Dixon, M.; Ilyushchenko, S.; Thau, D.; Moore, R. Google Earth Engine: Planetary-scale geospatial analysis for everyone. Rem. Sens. Environ. 2017, 202, 18–27. [Google Scholar] [CrossRef]
  14. Didan, K. MOD13A1 MODIS/Terra Vegetation Indices 16-Day L3 Global 500m SIN Grid V006 [Data set]. NASA EOSDIS Land Processes DAAC. 2015. Available online: https://doi.org/10.5067/MODIS/MOD13A1.006 (accessed on 17 February 2023).
  15. Camps-Valls, G.; Campos-Taberner, M.; Moreno-Martínez, A.; Walther, S.; Duveiller, G.; Cescatti, A.; Mahecha, M.D.; Muñoz-Marí, M.; García-Haro, F.J.; Guanter, L.; et al. A unified vegetation index for quantifying the terrestrial biosphere. Sci. Adv. 2021, 7, eabc7447. [Google Scholar] [CrossRef] [PubMed]
  16. Fritts, H.C. Tree-Rings and Climate; Academic Press: London, UK, 1976. [Google Scholar]
  17. Larsson, L.-A.; Larsson, P.O. CDendro and CooRecorder (v. 9.3.1) [Software]; Cybis Elektronik: Saltsjöbaden, Sweden, 2018. [Google Scholar]
  18. Holmes, R.L. Computer assisted quality control in tree ring dating and measurement. Tree-Ring Bull. 1983, 43, 69–78. [Google Scholar]
  19. Briffa, K.R.; Jones, P.D. Basic chronology statistics and assessment. In Methods of Dendrochronology: Applications in the Environmental Sciences; Kluwer Academic Publisher: Dordrecht, The Netherlands, 1990; pp. 137–152. [Google Scholar]
  20. R Core Team. R: A Language and Environment for Statistical Computing; R Foundation for Statistical Computing: Vienna, Austria, 2022; Available online: https://www.R-project.org/ (accessed on 15 March 2023).
  21. Bunn, A.; Korpela, M.; Biondi, F.; Campelo, F.; Mérian, P.; Qeadan, F.; Zang, C. dplR: Dendrochronology Program Library in R; Version 1.7.1; R Package: Vienna, Austria, 2020. [Google Scholar]
  22. Van der Maaten-Theunissen, M.; van der Maaten, E.; Bouriaud, O. pointRes: An R package to analyze pointer years and components of resilience. Dendrochronologia 2015, 35, 34–38. [Google Scholar] [CrossRef]
  23. Zang, C.; Biondi, F. treeclim: An R package for the numerical calibration of proxy-climate relationships. Ecography 2015, 38, 431–436. [Google Scholar] [CrossRef]
  24. Li, M.H.; Hoch, G.; Körner, C. Source/sink removal affects mobile carbohydrates in Pinus cembra at the Swiss treeline. Trees Struct. Funct. 2002, 16, 331–337. [Google Scholar] [CrossRef] [Green Version]
  25. Dubois, M.; Gilles, K.A.; Hamilton, J.K.; Rebers, P.A.; Smith, F. Colorimetric method for determination of sugars and related substances. Anal. Chem. 1956, 28, 350–356. [Google Scholar] [CrossRef]
  26. Buysse, J.; Merckx, R. An improved colorimetric method to quantify sugar content of plant tissue. J. Exp. Bot. 1993, 44, 1627–1629. [Google Scholar] [CrossRef]
  27. Palacio, S.; Maestro, M.; Montserrat-Martí, G. Seasonal dynamics of non-structural carbohydrates in two species of Mediterranean sub-shrubs with different leaf phenology. Env. Exp. Bot. 2007, 59, 34–42. [Google Scholar] [CrossRef]
  28. Palacio, S.; Hernández, R.; Maestro-Martínez, M.; Camarero, J.J. Fast replenishment of initial carbon stores after defoliation by the pine processionary moth and its relationship to the regrowth ability of trees. Trees Struct. Funct. 2012, 26, 1627–1640. [Google Scholar] [CrossRef] [Green Version]
  29. Mayr, S.; Schwienbacher, F.; Bauer, H. Winter at the alpine timberline. Why does embolism occur in Norway spruce but not in Stone pine? Plant Physiol. 2003, 131, 780–792. [Google Scholar] [CrossRef] [PubMed] [Green Version]
  30. Mellander, P.E.; Bishop, K.; Lundmark, T. The influence of soil temperature on transpiration: A plot scale manipulation in a young Scots pine stand. For. Ecol. Manag. 2004, 195, 15–28. [Google Scholar] [CrossRef]
  31. Fernández-Pérez, L.; Villar-Salvador, P.; Martínez-Vilalta, J.; Toca, A.; Zavala, M.A. Distribution of pines in the Iberian Pen-insula agrees with species differences in foliage frost tolerance, not with vulnerability to freezing-induced xylem embo-lism. Tree Physiol. 2018, 38, 507–516. [Google Scholar] [CrossRef] [Green Version]
  32. Climent, J.; Costa e Silva, F.; Chambel, M.; Pardos, M.; Almeida, M. Freezing injury in primary and secondary needles of Mediterranean pine species of contrasting ecological niches. Ann. For. Sci. 2009, 66, 407. [Google Scholar] [CrossRef] [Green Version]
  33. Voltas, J.; Camarero, J.J.; Carulla, D.; Aguilera, M.; Ortiz, A.; Ferrio, J.P. A retrospective, dual-isotope approach reveals individual predispositions to winter-drought induced tree dieback in the southernmost distribution limit of Scots pine. Plant Cell Environ. 2013, 36, 1435–1448. [Google Scholar] [CrossRef]
  34. Hoch, G. Carbon reserves as indicators for carbon limitation in trees. In Progress in Botany; Lüttge, U., Beyschlag, W., Eds.; Springer International Publishing: Cham, Switzerland, 2015; pp. 321–346. [Google Scholar]
  35. Plotkin, A.B.; Blumstein, M.; Laflower, D.; Pasquarella, V.J.; Chandler, J.L.; Elkinton, J.S.; Thompson, J.R. Defoliated trees die below a critical threshold of stored carbon. Funct. Ecol. 2021, 25, 2156–2167. [Google Scholar] [CrossRef]
  36. Gimeno, T.E.; Camarero, J.J.; Granda, E.; Pías, B.; Valladares, F. Enhanced growth of Juniperus thurifera under a warmer climate is explained by a positive carbon gain under cold and drought. Tree Physiol. 2012, 32, 326–336. [Google Scholar] [CrossRef] [Green Version]
  37. Muller, B.; Pantin, F.; Génard, M.; Turc, O.; Freixes, S.; Piques, M.; Gibon, Y. Water deficits uncouple growth from photosynthesis, increase C content, and modify the relationships between C and growth in sink organs. J. Exp. Bot. 2011, 62, 1715–1729. [Google Scholar] [CrossRef] [Green Version]
Figure 1. Daily means and values of minimum air temperatures recorded in the winter of 2020–2021 in (a) Calamocha and (b) Daroca meteorological stations. Black lines with solid dots are daily minimum air temperatures during 1 December 2020–28 February 2021. Error bars are means ± standard deviation (a) during 1993–2019 for Calamocha and (b) during 1920–2019 for Daroca.
Forests 14 00678 g001
Figure 2. Images showing the damages on forests located in the study area caused by the severe drop in temperatures during January 2021: (a) leaf browning and shedding and shoot death in P. halepensis, and (b) leaf shedding and shoot death in Q. ilex.
Forests 14 00678 g002
Figure 3. kNDVI annual values (period 2000–2022) estimated for areas with damage after the 2021 cold spell and dominated by P. halepensis and Q. ilex.
Forests 14 00678 g003
Figure 4. Growth patterns of defoliated and non-defoliated P. halepensis trees and coexisting P. pinaster trees. Note the logarithmic scale of tree-ring width data. The red-upward and blue-downward triangles indicate recent droughts (2005, 2012) and the 2021 cold spell, respectively. Values are means ± SE.
Forests 14 00678 g004
Figure 5. Correlations calculated by relating monthly or annual climate variables ((a) mean minimum temperatures, (b) mean maximum temperatures and (c) total precipitation) and series of ring-width indices of the three stand types (defoliated and non-defoliated P. halepensis; P. pinaster). Months abbreviated by lower- and uppercase letters correspond to the prior and current years, respectively. The dashed and dotted horizontal lines show the 0.05 and 0.01 significance levels, respectively.
Forests 14 00678 g005
Figure 6. NSC concentrations in (a) leaves and (b) sapwood of P. halepensis and Q. ilex sampled in spring and summer 2021. Values are means ± SE. Different letters indicate significant (p < 0.05) differences between defoliated and non-defoliated trees within each date (Mann–Whitney tests).
Forests 14 00678 g006aForests 14 00678 g006b
Table 1. Defoliation, diameter and tree-ring width statistics of sampled trees. Values are means ± SD. The tree-ring statistics were calculated for the period 1980–2020, prior to the cold spell. Different letters indicate significant (p < 0.05) differences between stands of the same species according to Mann–Whitney tests. Statistics’ abbreviations: AR1, first-order autocorrelation; MSx, mean sensitivity; Rbar, mean inter-series correlation.
Stand Type—SpeciesDefoliation (%)Diameter at 1.3 m (cm)Tree-Ring Width (mm)AR1MSxRbar
Defoliated—P. halepensis58.3 ± 10.236.1 ± 3.72.73 ± 1.70 b0.37 ± 0.200.44 ± 0.07 b0.68
Non-defoliated—P. halepensis0.8 ± 0.5 39.3 ± 6.12.29 ± 1.08 a0.47 ± 0.160.36 ± 0.03 a0.76
Non-defoliated—P. pinaster4.4 ± 2.130.0 ± 5.11.39 ± 1.170.75 ± 0.110.48 ±0.07 0.70
Defoliated—Q. ilex61.7 ± 8.212.8 ± 1.4––––––––––––
Non-defoliated—Q. ilex2.0 ± 1.714.1 ± 2.7––––––––––––
Disclaimer/Publisher’s Note: The statements, opinions and data contained in all publications are solely those of the individual author(s) and contributor(s) and not of MDPI and/or the editor(s). MDPI and/or the editor(s) disclaim responsibility for any injury to people or property resulting from any ideas, methods, instructions or products referred to in the content.