Article

Validation by SSRs of Morphometric Markers for Genetic Variability in Araucaria araucana (Molina) K. Koch

1
CREA Research Centre for Vegetable and Ornamental Crops, Via dei Fiori 8, 51017 Pescia, PT, Italy
2
Department of Agriculture, Food, Environment, and Forestry (DAGRI), University of Florence, Viale delle Idee 30, 50019 Sesto Fiorentino, FI, Italy
3
Interdepartmental Service Centre for Agricultural Chemical and Industrial Biotechnologies (CIBIACI), University of Florence, Via Romana 21, 50125 Florence, FI, Italy
*
Author to whom correspondence should be addressed.
Forests 2023, 14(3), 466; https://doi.org/10.3390/f14030466
Submission received: 19 January 2023 / Revised: 16 February 2023 / Accepted: 21 February 2023 / Published: 24 February 2023
(This article belongs to the Section Genetics and Molecular Biology)

Abstract

:
Araucaria araucana is an important seed and timber-yielding tree that grows naturally in the tropical and subtropical regions of the Andes in Argentina and Chile, and has also been introduced as an ornamental species in Europe. Genetic diversity has been observed in A. araucana native populations, but there have been no prior studies on the genetic diversity estimates of this species introduced in Europe. On the other hand, assessment of the genetic variation in Araucaria populations occurring in Europe might be an important tool in the selection of appropriate germplasms for ornamental nursery production and breeding strategies. In this study, morphological and genetic diversity was analysed using a previously defined descriptor list and SSR molecular markers in four putative populations of A. araucana, individuated in the Pistoia Nursery District (Tuscany, Italy). In total, 26 morphological descriptors and 28 SSR primer pairs were used for a diversity assessment of specimens. Results provide evidence for genetic and morphological correspondence among the four putative Araucaria populations. PCA and cluster analyses based on morphological traits clearly revealed three distinct clusters of specimens. SSR primers yielded 68% polymorphic loci among the considered populations, and 18 of them displayed informativeness for population genetics, according to a Polymorphic Information Content value larger than 0.25. This marker set revealed significant genetic differentiation, and UPGMA analysis enabled separation of these populations on the basis of their genetic distances into three main groups, which largely overlapped with clusters in the dendrogram obtained from the morphological data. In particular, in both cluster diagrams, all accessions belonging to a specific population were well separated from all the others due to matrix distances and differences in the canopy density that are more similar to conifers such as spruce, pine, or fir. ANOVA analysis and the FST value indicated a large between-population genetic variation. The Mantel test suggested that genetic differentiation between the four studied populations was positively correlated with morphological distance (r = 0.141, p < 0.05). Thus, both morphological and genetic markers showed applicability across populations of different seed origins and proved suitable for the identification and characterization of A. araucana accessions.

1. Introduction

The genus Araucaria has a limited distribution in the southern hemisphere where it represents one of the most distinctive components of the forest ecosystem. Fossil records have provided evidence that Araucaria members formerly occurred also in the northern hemisphere until the late Cenozoic era. Continental separation and climatic drying are considered the main causes of the very restricted present-day distribution of these conifers, confined to moist mesothermal climates [1]. Of the 19 Araucaria species left, only two native conifers (A. araucana and A. angustifolia) live in South America, while the other 17 are limited to Australia, New Guinea and to some other islands of the South Pacific. Most of the current populations are relics and considered at risk of becoming extinct in the near future.
During the past two centuries, A. araucana populations have suffered a drastic reduction in size as a result of unsustainable human exploitation for agricultural or forestry use [2,3,4,5]. Since the beginning of the 20th century, its distribution has practically halved [6]. Nowadays, the geographical allocation of A. araucana covers a total area of approximately 5000 km2, including the strip on both sides of the Andean Mountain range in Argentina and Chile, between 37° S and 42° S of latitude [7].
In Chile A. araucana, also known as the ‘monkey puzzle tree’, exhibits a disjointed geographical distribution, with 97% of stands being found in the Andes and two small sub-populations in the Nahuelbuta Cordillera, close to the coast. Almost 50% of the species’ distribution is protected in various conservation units, and in 1976, it was declared a natural monument. In Argentina, small, scattered populations are found in the province of Neuquén, at the northern end of Patagonia; a great part of these remnant populations are degraded, located outside protected areas and are the most prone to extinction [3,4,7,8,9]. In consideration of this serious situation, A. araucana has been listed on CITES Appendix II in 2003, and Appendix I from 2017 (Convention on International Trade in Endangered Species of Flora and Fauna, IUCN Red List of Threatened Species; https://cites.org/eng/disc/text.php; accessed on 16 September 2022).
This species arrived in Italy in 1822 and, starting from the second post world war period, it gained wide interest and economic importance in the nursery industry of the central peninsula (mainly concentrated in the ornamental district of Pistoia, Tuscany), thanks to its unique shape adaptability to the Mediterranean soil and climate conditions [10,11,12]. Monkey puzzle trees spread rapidly in parks and gardens, both public and private, but after the transfer of the species to Appendix I of CITES, the severe restrictions and requirements imposed by the CITES regulation progressively led to a gradual reduction of Araucaria propagation Italy. In view of 200 years of selection and adoption of nursery techniques by small-scale nursery owners, some degree of genetic differentiation may be expected within European and Italian germplasms.
Some aspects of the historical demography and geographical distribution together with the genetic structure were already studied in natural populations of this species [7]. The diversity of geographical and environmental regions where this species grows has led scientists to speculate on the possibility of genetic variation between A. araucana populations. In this respect, Delmastro and Donoso [13] observed some differences in plant form and vegetative reproduction between coastal and Andean populations, but without assessing the genetic basis of these traits. Almost twenty years later, Rafii and Dodd [14] found greater differentiation between west-side Andean populations than between coastal and Andean populations by using a proportional composition of foliar epicuticular wax alkanes, which was suggested to reflect genetic adaptation to the more arid conditions on the eastern side of the Andes. Nevertheless, the results revealed a relatively high intrapopulation variation. In the early 2000s, various DNA marker systems were used in Araucaria population genetic studies. High levels of genetic diversity were detected within A. araucana when using nuclear markers such as SSRs, RAPDs and isozymes [15,16,17,18], however, such studies displayed contradictory results on the genetic divergence within the species. Most of the genetic variation was found within populations, according to Bekessey et al. [15], although a significant genetic distance was evidenced among populations with an increasing latitude [17]. A significant genetic variation was reported by Gallo et al. [16], being more abundant within the eastern more fragmented populations. A clear genetic distinction between the Andean and coastal populations was evidenced by Martìn et al. [18] by using microsatellites, suggesting a local adaptation of the species due to environmental differences, and the geographical separation of the two regions. On the other hand, Marchelli et al. [19] evidenced a low level of genetic diversity within eastern populations in Argentina by organelle DNA markers, which could be related to a lower mutation rate of the chloroplast genome compared to the nuclear one [20]. A very recent study showed the existence of loci under selection in the Chilean monkey puzzle tree that are correlated with climatic variables of temperature and precipitation, while some localities were revealed to be in genetic demographic disequilibrium [21]. On the other hand, to the best of our knowledge, there are no published reports describing any morphological variations within this species in its native habitat.
Based on this background information, this research was aimed to assess the morphogenetic diversity within Italian A. araucana genetic resources. In this context, it was hypothesized that the identification of a new Tuscan variety could offer the opportunity to disengage from the procedural obligation established by the CITES Convention. The morphological characterization of A. araucana accessions was performed according to the descriptor list reported by Antonetti et al. [12], and the genetic diversity was estimated using SSR marker variability. The objectives of this study were the following: (i) to evaluate the efficacy and informativeness of the developed morphological and genetic markers, identified through genetic diversity studies on A. araucana accessions from the leading nursery companies in Italy, (ii) to validate the morphometric descriptor list through a comparison with SSR molecular markers, and (iii) to determine the possibility of their application in choosing parental lines for breeding programs and varietal characterization.

2. Materials and Methods

2.1. Plant Sampling and Spatial Distribution

The plant material used in this study for morphological and genetic characterization was sampled from an area of approximately 965 km2 in the northern part of Tuscany, enclosing the Pistoia nursery industry, ranging from 50 m to 550 m above sea level. Thanks to its unique microclimate, the Nursery District of Pistoia produces, all year long, a huge assortment of ornamental plants, being acknowledged as one of the most important production zones in Europe for outdoor ornamentals. Among these are evergreen and deciduous shrubs, big trees and many conifer species, including A. araucana.
A germplasm for morphological characterization was selected with the objective of forming uniform core subsets based on plant age and agronomic growth conditions. Thus, four putative populations derived from seeds of different origins were carefully chosen: unknown origin = UNK; Dutch fair = NLU; Spanish fair = ESU; local selected progeny = ITV. These populations were grown in two private nurseries, located very close to each other in a plain area, under the same organic regime. A total of 24 adult trees aged between 20–25 years (6 per each putative population) were randomly chosen for morphometry purposes. The local selected progeny (ITV) refers to seeds collected from a couple of old ancestor trees planted in Villa Lodolo (S. Marcello Pistoiese, 44°03′ N; 10°47′ E; 623 m a.s.l.). These trees (ARG1 = male ancestor; ARG2 = female ancestor) were introduced from Argentina in 1920 and represent the main genetic source of A. araucana Tuscan local germplasm.
The simple sequence repeats (SSRs) DNA analysis method was extended to 32 samples of local available germplasm, including older trees among them, which were the ancestral progenitors introduced from Argentina (ARG1 and ARG2), and plants of the F2 generation of the ancestors (ITM).
Plant material origins and acronyms are detailed in Table 1.

2.2. Morphological Characterization

From a subset of 24 adult trees belonging to UNK, NLU, ESU and ITV putative populations, data regarding 26 plant morphological traits were directly observed or measured according to Antonetti et al. [12]. In total 7 qualitative and 19 quantitative traits (7 for the trunk, 5 regarding the primary branch and 7 concerning the secondary branch) were detected as being representative of the phenotypic variability of the A. araucana specimens. Traits strongly influenced by the age of the plant (such as height) were not included in the evaluation. Likewise, traits concerning male inflorescences (catkins at the mature stage), female strobiles (pinecones at harvest), seeds and productivity were discarded, since not all the plants had reached sexual maturity. The considered traits used for the Mantel test correlation analysis are reported below.
Tree: trunk diameter, 1 m from collar (Truø = mm); canopy shape (CaSh = globose, elliptic, pyramidal, columnar); canopy density (CaDe = sparse, medium, dense); distance among scaffold branches (DiSB = mm); bark colour (BaCo = light grey, greyish-green, greyish-brown); density of trunk scales (DTrS = sparse, medium, dense); insertion angle of trunk scales (IATS = uniform, variable); maximum length of trunk scales (LTrS = mm); maximum width of trunk scales (WTrS = mm); trunk scale area (TrSA = mm2).
Branches: length of the first internode on primary branch (LFIn = mm); length of the median internode on the primary branch (LMIn = mm); ratio between trunk diameter and number of secondary branches (ø/SB = n); wide section of primary branch, including scales (øWPB = mm); narrow section of primary branch, including scales (øNPB = mm); (apparent) diameter uniformity on primary branch (øUPB = uniform, difform, very difform); insertion angle of primary branch scales (IABS = angle ≤ 45°, angle > 45°); scale density on secondary branch (SDSB = sparse, medium, dense); wide section of secondary branch, including scales (øWSB = mm); narrow section of secondary branch, including scales (øNSB = mm); (apparent) diameter uniformity on secondary branch (øUSB = uniform, difform, very difform).
Leaves (scales): maximum length of secondary branch scale (LSBS = mm); maximum width of secondary branch scale (WSBS = mm); secondary branch scale area (SBSA = mm); uniformity of scale size on primary branch (USPB); uniformity of scale size on secondary branch (USSB).
For each quantitative trait, five replicated measurements were taken. Regarding qualitative traits, a single direct observation was performed by three expert researchers at the same time.

2.3. Genetic Characterization

2.3.1. DNA Extraction and Quantification

DNA extraction was achieved using a 30–40 mg fresh leaf, which was cooled in liquid nitrogen and finely pulverized using a tissue homogenizer (Tissue Lyser, Qiagen, Hilden, Germany), along with three tungsten carbide beads. DNA extraction was carried out with the DNeasy Plant Mini Kit (Qiagen, Hilden, Germany) following the manufacturer’s instructions. DNA was electrophoresed on an agarose gel to validate the quality, whereas the quantity was measured with a Qubit 1.0 fluorometer (Invitrogen, Waltham, MA, USA).

2.3.2. SSR Markers, PCR Amplification and Sizing

To perform the genotyping of the entire A. araucana population, twenty-eight SSR primer pairs were used [22,23,24,25], as shown in Table 2. PCR amplifications were implemented in a final volume of 25 µL, containing 20 ng of genomic DNA, 2 mM MgCl2, 200 µM dNTPs, 200 nM each of forward and reverse primers, 1X GoTaq® colorless Reaction Buffer (Promega Madison, WI, USA), and 1 U of GoTaq® DNA Polymerase (Promega, Madison, WI, USA). Then, PCR reactions were carried out on a Primus 96 advanced (PEQLAB Biotechnologie Gmbh, Erlanger, Germany) according to the subsequent program: 95 °C denaturation for 3 min; 35 cycles of 95 °C denaturation for 40 s; primer annealing at the specific temperature (depending on the primer pair) for 40 s; 72 °C extension for 40 s; 72 °C final extension for 7 min. The forward primers were labeled with a fluorescent tag (6-FAM, VIC, NED, PET) (Applied Biosystems, Inc., Waltham, MA, USA) to visualize the fragment size on an ABI-3130 xl Genetic Analyzer (Applied Biosystems, Inc., Waltham, MA, USA) using performance-optimized polymer (POP7). Fragments were studied and detected with GeneMapper 4.0 (Applied Biosystems, Inc., Waltham, MA, USA).

2.4. Data Analysis

Concerning the morphological analyses, the average, standard deviation and coefficient of variability (%) values of each morphometric trait were calculated by a One-way Analysis of Variance (ANOVA) for the whole set of specimens and for each putative population in order to analyze the diversity of the subset of 24 Araucaria trees. Where significant effects were determined, Tukey’s multiple comparisons test was performed using SPSS 20 (Chicago, IL, USA). Average values were standardized before being used for Principal Component Analysis (PCA). Correlations between morphometric variables was obtained using R-package corrplot 0.92 [26] and a Principal Component Analysis (PCA) was carried out on quantitative variables with FactorMineR 2.7 [27] and factoextra packages 1.0.7 [28] in R-project. Finally, an Unweighted Pair-Group Method (UPGMA) dendrogram based on Gower distances was created using the R-package Morphotools2 [29]. The dendrogram editing was carried out with the Interactive Tree of Life 5.5 [30].
Regarding genetic data analyses, a first investigation was accomplished in all the considered populations (i.e., NLU, UNK, ESU, ITV, ARG and ITM). In this context, a genetic overview of the A. araucana populations was implemented by the calculation, for each SSR locus, on the number of alleles (Na), the effective number of alleles (Ne), the frequency of the predominant allele (Fa), the observed (Ho) the expected heterozygosity (He), and the fixation index (F), using Genalex 6.5 [31], while the software PowerMarker 3.25 [32] was used to compute the Polymorphic Information Content (PIC). The distribution of genetic diversity among and within populations was obtained through the Analysis of Molecular Variance (AMOVA), the calculation of FST and gene flow (Nm) with Genalex 6.5 software [31]. Furthermore, a Principal Coordinates Analysis (PCoA), based on Euclidean distances, was generated using the packages adegenet 2.1.3 [33] and ade4 1.7 [34], and was graphically edited with adegraphic [35].
Subsequently, a more accurate analysis was achieved in the subset of the 24 adult trees belonging to UNK, NLU, ESU and ITV putative populations to compare and validate the morphometric traits described in chapter 2.2. Specifically, Bruvo’s genetic distances [36] were computed to accomplish an Unweighted Pair-Group Method (UPGMA) dendrogram through the packages adegenet 2.1.3 [33] and poppr 2.9.3 [37] in R-project. Moreover, 1000 bootstrap analyses were performed to establish the reliability of the dendrogram. The predicted tree was visualized using Interactive Tree of Life 5.5 [30].
Finally, a Mantel test, based on the Spearman’s rank correlation, was developed to verify the interrelationship between morphological and genetic distances, which were calculated with Gower and Manhattan distances, respectively, using the R packages vegan 2.5.7 [38] and geosphere 1.5 [39] with 1000 permutations.

3. Results

3.1. Morphometry

The morphological diversity from trunk, branches, and scales of the subset of 24 plants is summarized in Table 3. Significant ANOVA results (p < 0.01) showed differences in all the quantitative morphological characteristics of specimens among the considerate putative populations.
Only in a few cases were CV values found to be greater within populations than those observed for the set of all the specimens. For instance, UNK showed the highest value for various trunk parameters (DTrS, LTrS, TrSA, DiSB, ø/SB) and for the first internode length (LFIn), while NLU showed larger values of trunk diameter (Truø) variation than those found for the other populations.
ESU and ITV plants showed the greatest trunk diameter (Truø), trunk scale sizes (WTrS, LTrS, TrSA) and distance among scaffold branches (DiSB), while UNK and NLU had higher scale density (DTrS). Significant differences between the populations were observed also for primary branch parameters. First internode length (LFIn), median internode length (LMIn), wide section (øWPB) and narrow section (øNPB) were greatest on UNK and smallest on NLU primary branches. Similarly, reduced values of wide and narrow section (øWSB and øNSB), and scale sizes (WSBS, LSBS, SBSA) of secondary branches were found in the Dutch population. On the other hand, the Spanish population displayed the highest values for these parameters.
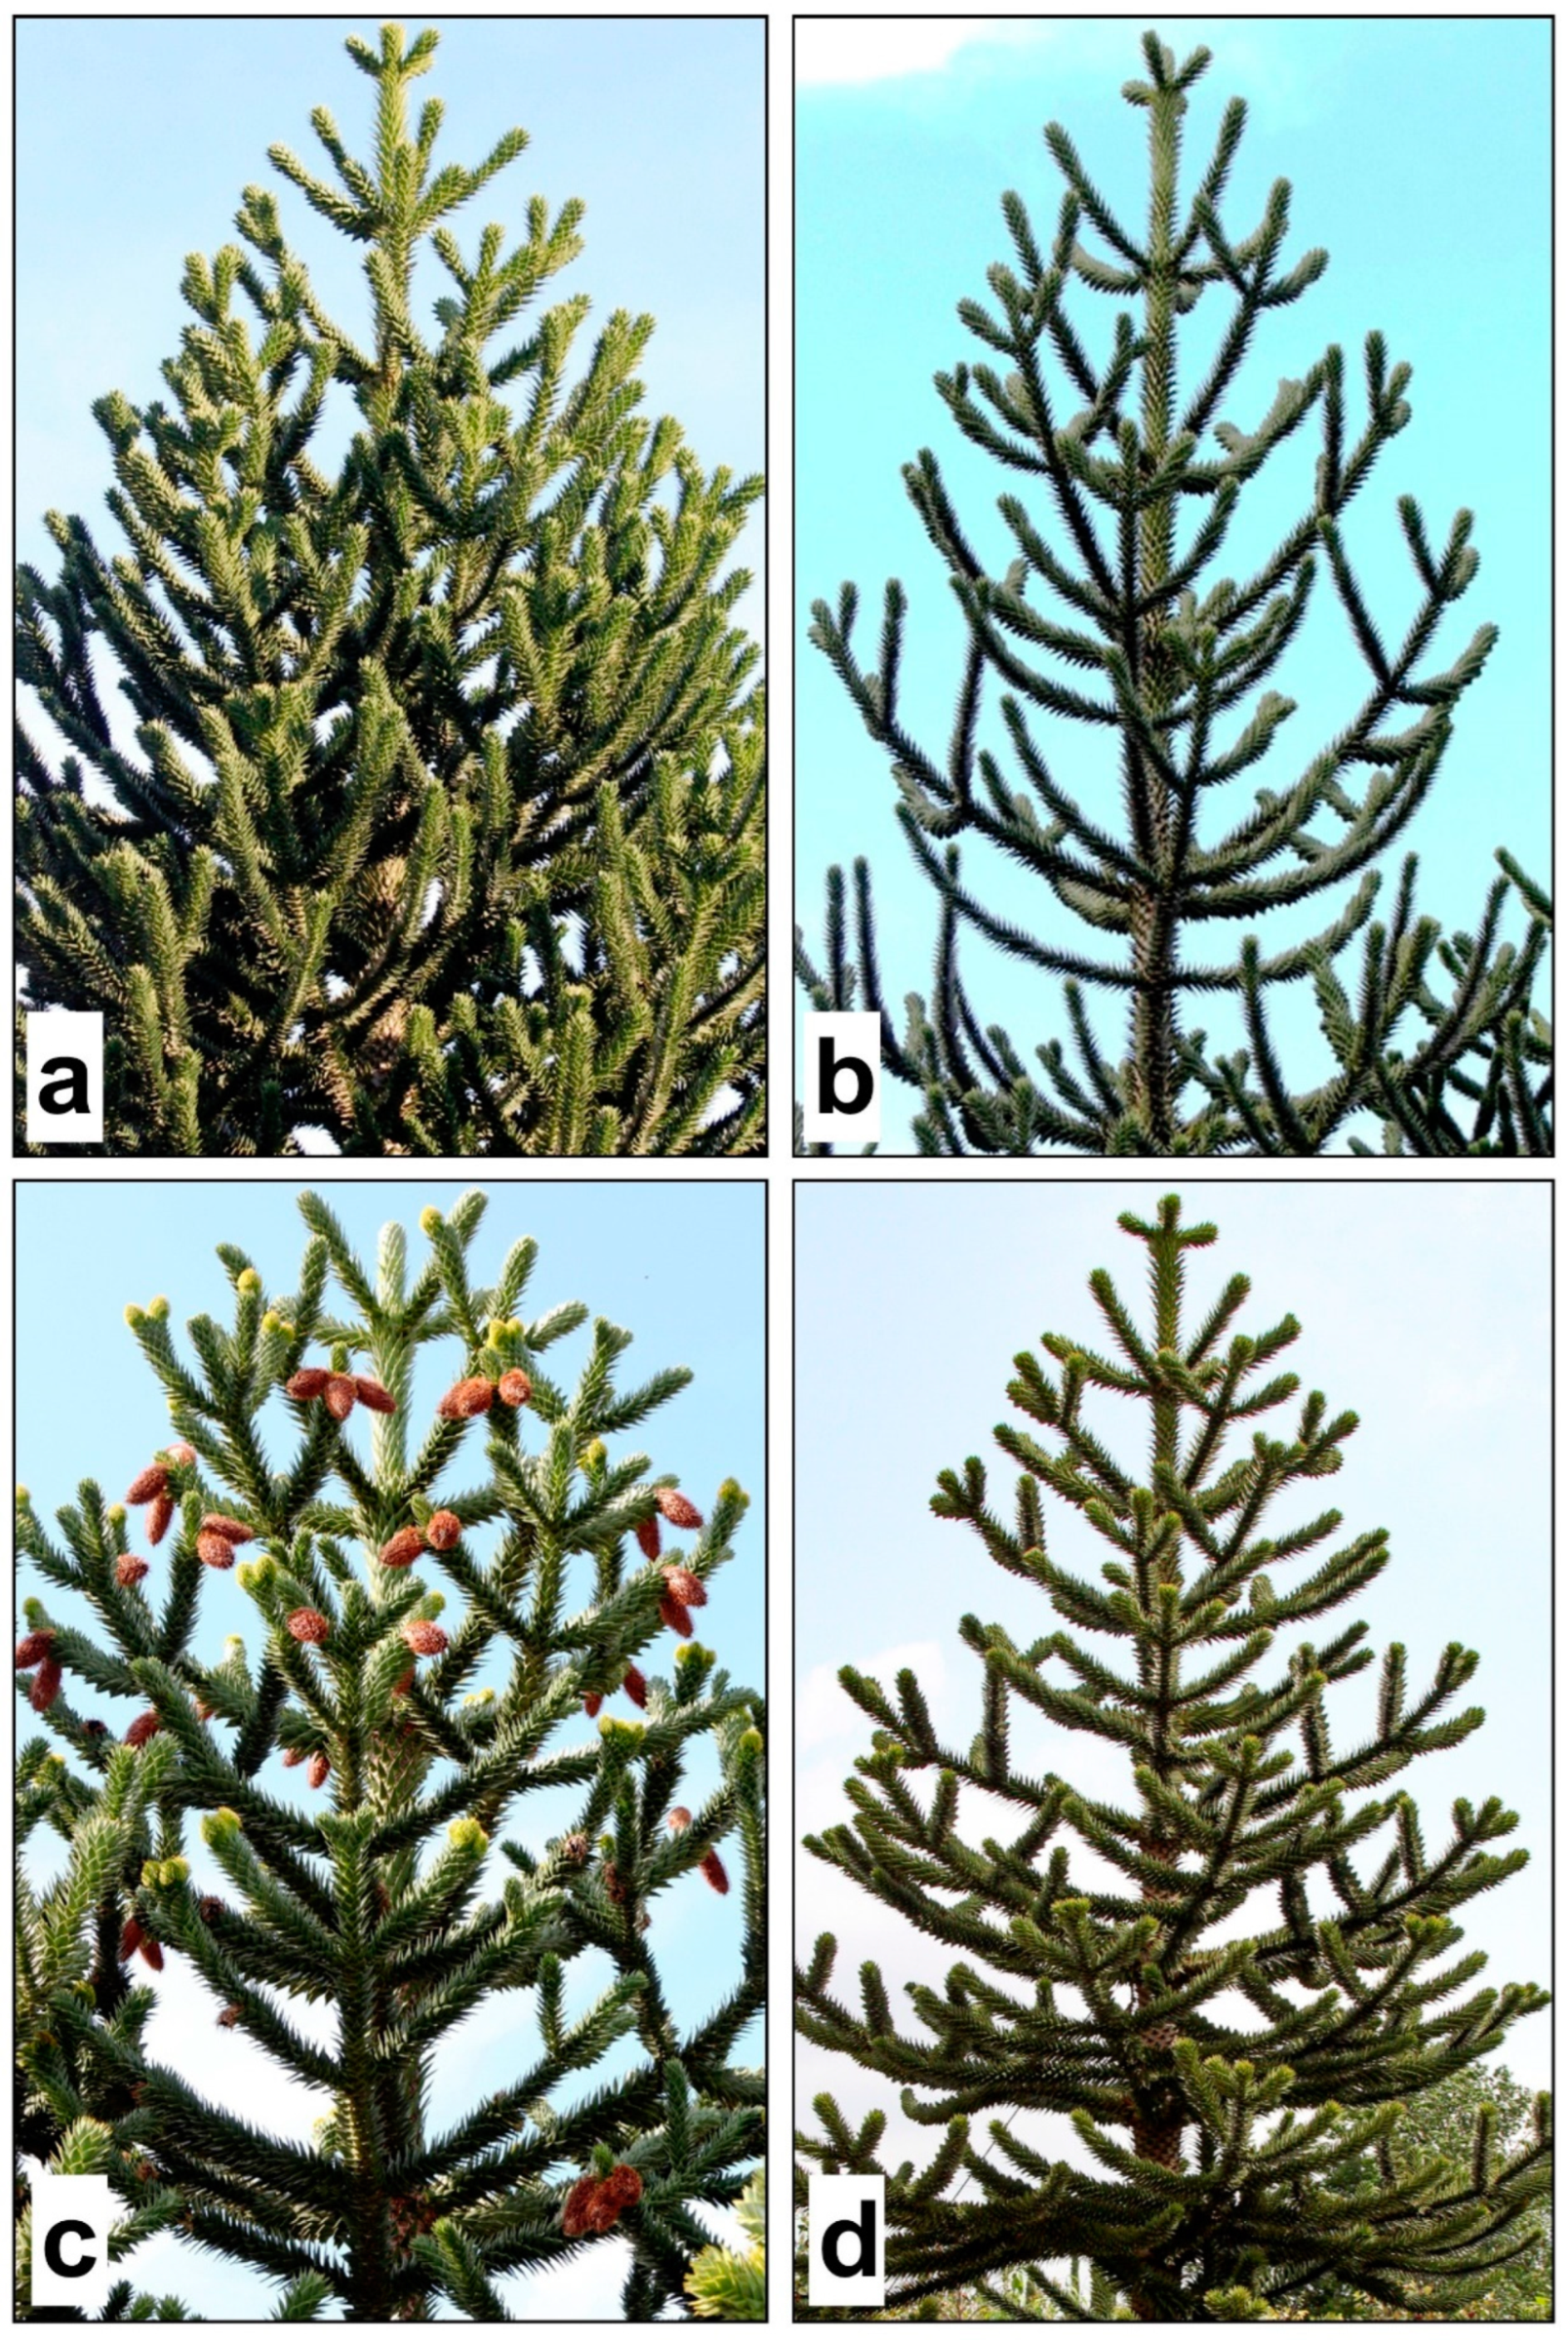
From a global evaluation of the putative populations based on morphological traits (both quantitative and qualitative; Table 3 and Figure 1) it is evident that the Dutch population is characterized by a pyramidal habit, very dense foliage, an extremely irregular apparent diameter of the primary branch, reduced distance between scaffold branches, and small scaly leaves. All these patterns give the plants of NLU a very impenetrable canopy (Figure 2a). Conversely, plants belonging to the UNK population have primarily a columnar (or seldom an elliptical) habit, with sparse canopy density, large scales that are inserted at a very narrow acute angle (<30°) on the trunk, and very elongated internodes of the primary branch. These features confer this population a spindly and rarefied canopy appearance. Specimens belonging to the Spanish population are characterized by a prevailing elliptical shape and average density of the canopy. The trunk is usually large, and its bark is light grey with loose, large, and uniformly inserted scales. The branches have medium–large sections, a very uniform apparent diameter and bear large scale-like leaves, having an open angle of insertion (Figure 2b). ESU trees, therefore, assume an intermediate canopy shape between the dense, pyramidal-like habit (NLU) and the sparse, columnar-like habit (UNK) described above (Figure 2c). Finally, the canopy of ITV trees is sparse but very variable in shape. These trees share some trunk parameters (larger diameter, lower scale density, greater scale size) with the Spanish population, and share the greater distance among scaffold branches with both the ESU and UNK populations. The ratio between the trunk diameter and number of secondary branches is the highest ranking in these plants, denoting a more scattered canopy. Moreover, primary branches have long median internodes, their apparent diameter is uniform, and sections are medium–large; scales are inserted with an open angle (>30°) and their density is highest. These features denote a very rarefied overall habit appearance of the tree, although it can be distinguished by a dense and uniformly distributed foliage on the branches (Figure 2d).
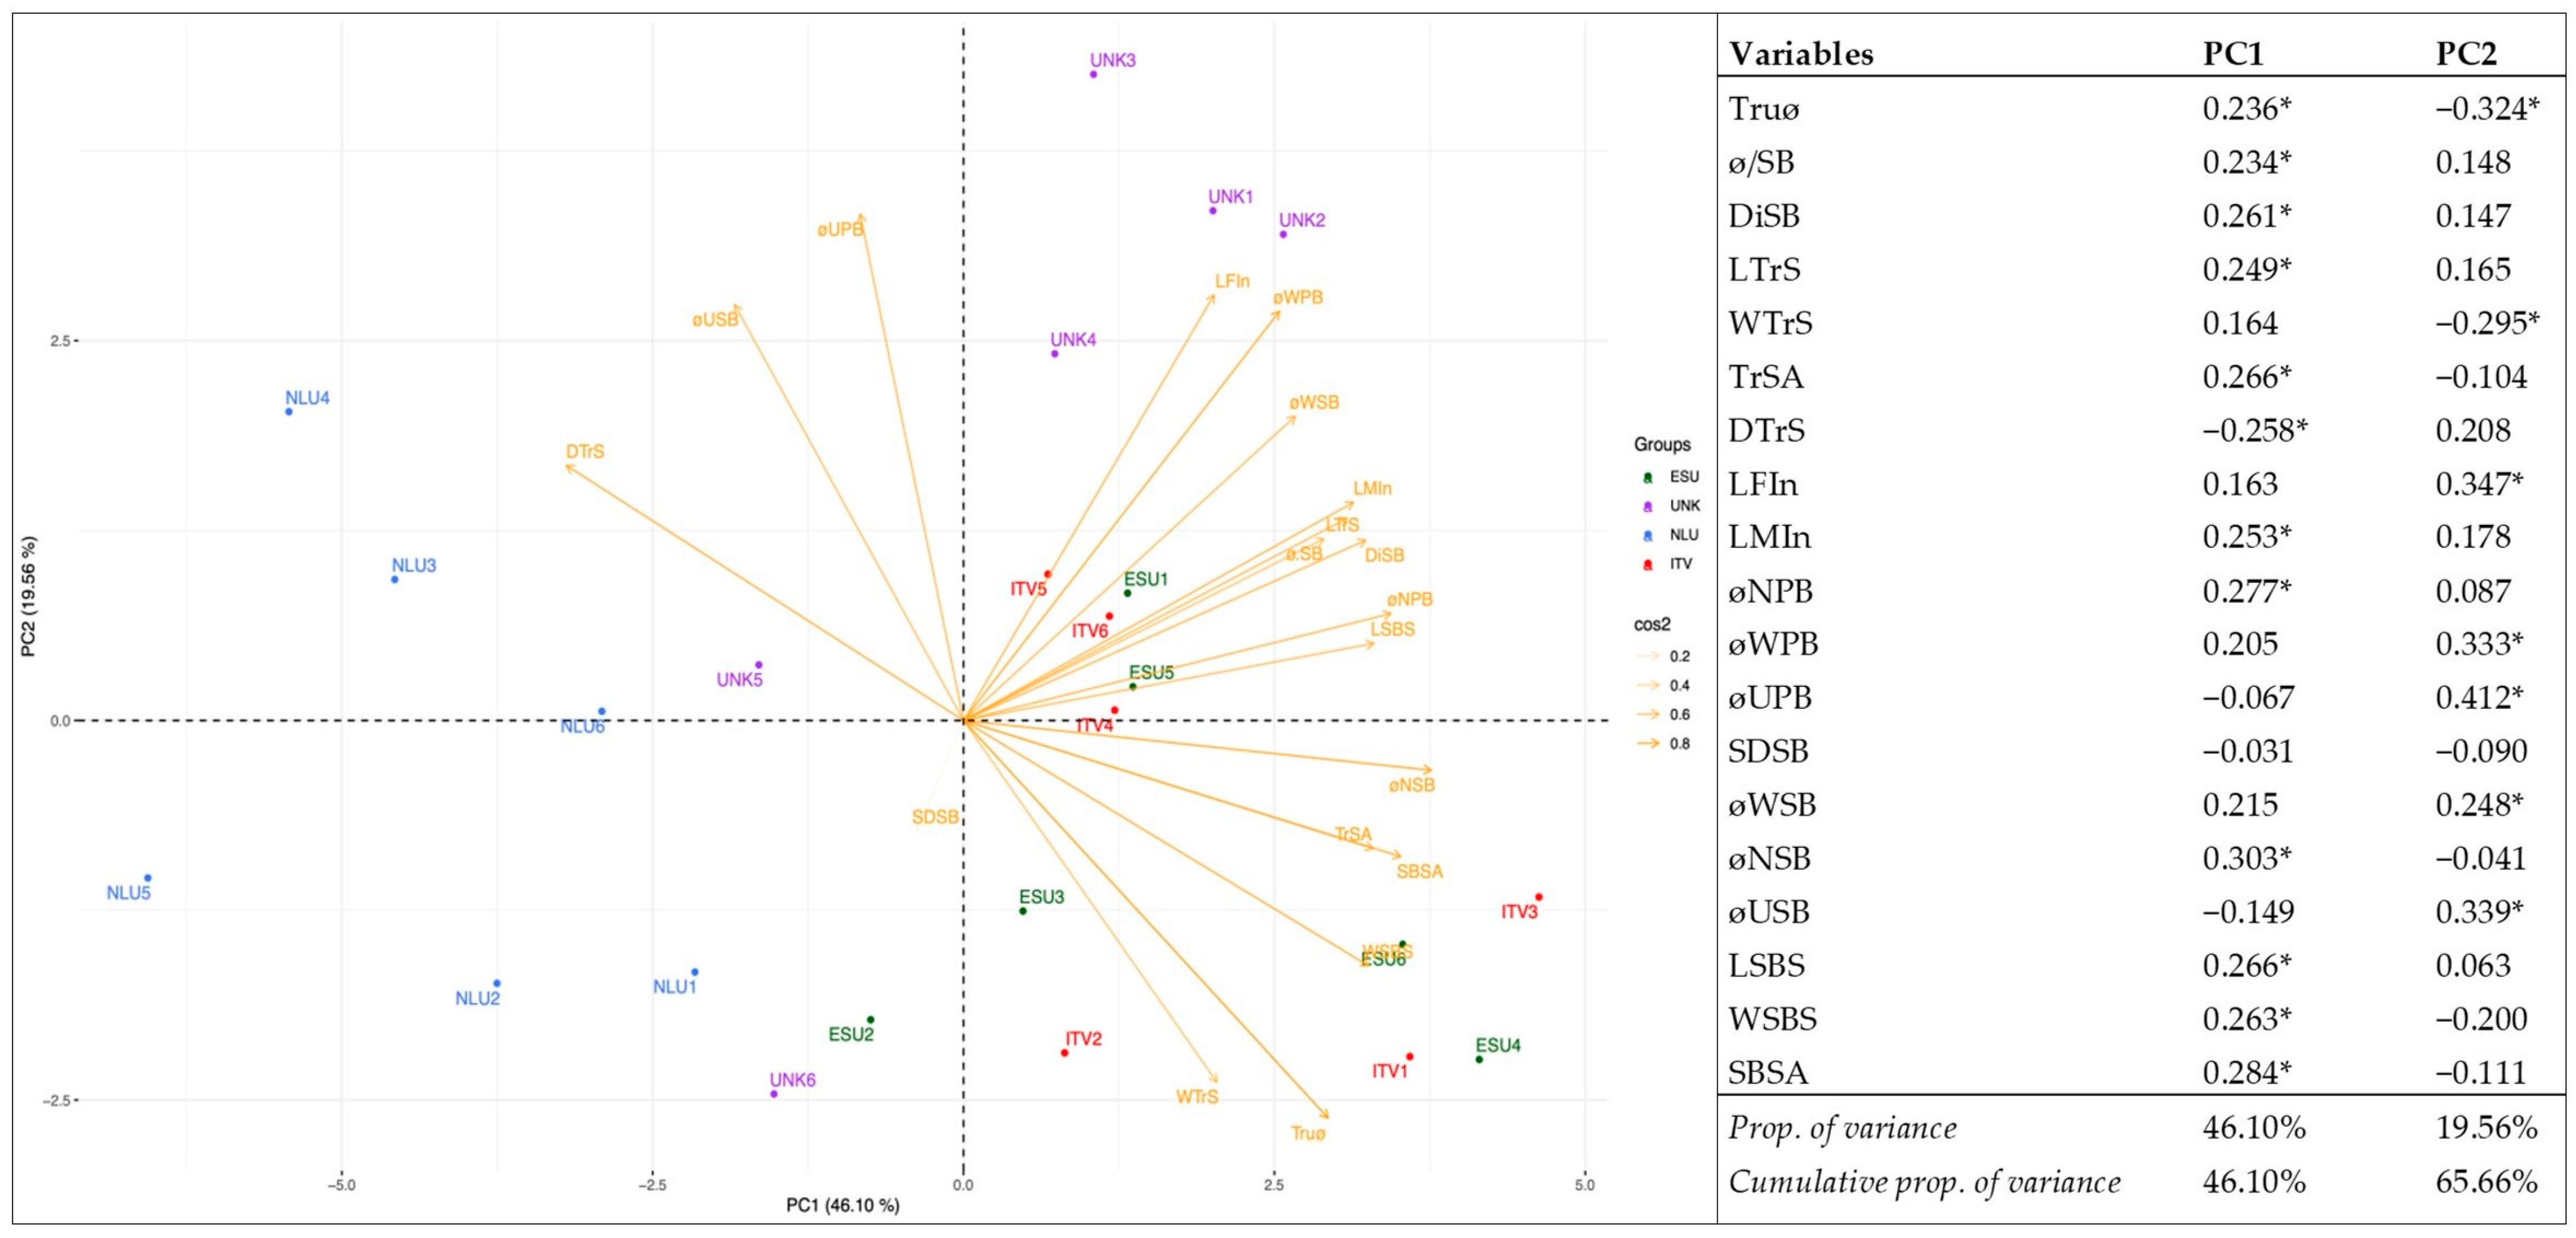
The PCA was performed with only the standardized quantitative morphological dataset obtained from trunks, branches, and leaves. Preliminarily, a correlation matrix was carried out among all considered variables (Figure S1); however, no parameters showed a coefficient correlation greater than 0.90 and, thus, none of them were removed from the PCA analysis. The first three components (PC1, PC2 and PC3) expressed 46.10%, 19.56%, and 8.42% of total variance, respectively, accumulating 74.09% of total observed variability. The first PCA axis, with 46.1% of total variation, was positively correlated with most trunk (Truø, ø/SB, DiSB, LTrS, TrSA, DTrS), and some branch, traits (LMIn, øNPB, øNSB, LSBS, WSBS, SBSA). In fact, a high and significant correlation (r ≥ 0.7) was noted between many trunk parameters (Figure S1), while branch parameters, except for øUPB, SDSB and øUSB, were more or less positively correlated (0.36 ≥ r ≤ 0.77) with ø/SB, DiSB, LTrS, and negatively correlated with DTrS. The second PC included significant parameters, such as the length of the first internode (LFIn), the wide section of primary and secondary branches (øWPB and øWSB), and diameter uniformity of branches (øUPB and øUSB).
Figure 3 provides the biplot of the PCA obtained using the first two PCs. This biplot gives a faithful two-dimensional representation of the relationship between putative populations having similar quantitative morphological traits. The UNK trees, except UNK5 and UNK6, were in the top-right on the plot, while NLU plants were in the middle–bottom-left of the plot; all ITV and ESU plants were in the middle–bottom-right of the quadrant, with the only exception of ESU2, which was slightly shifted to the left along the PC1 axis. Thus, plant specimens belonging to NLU and most of those allied to UNK putative populations were well separated from ITV and ESU populations due to differences in morphology.
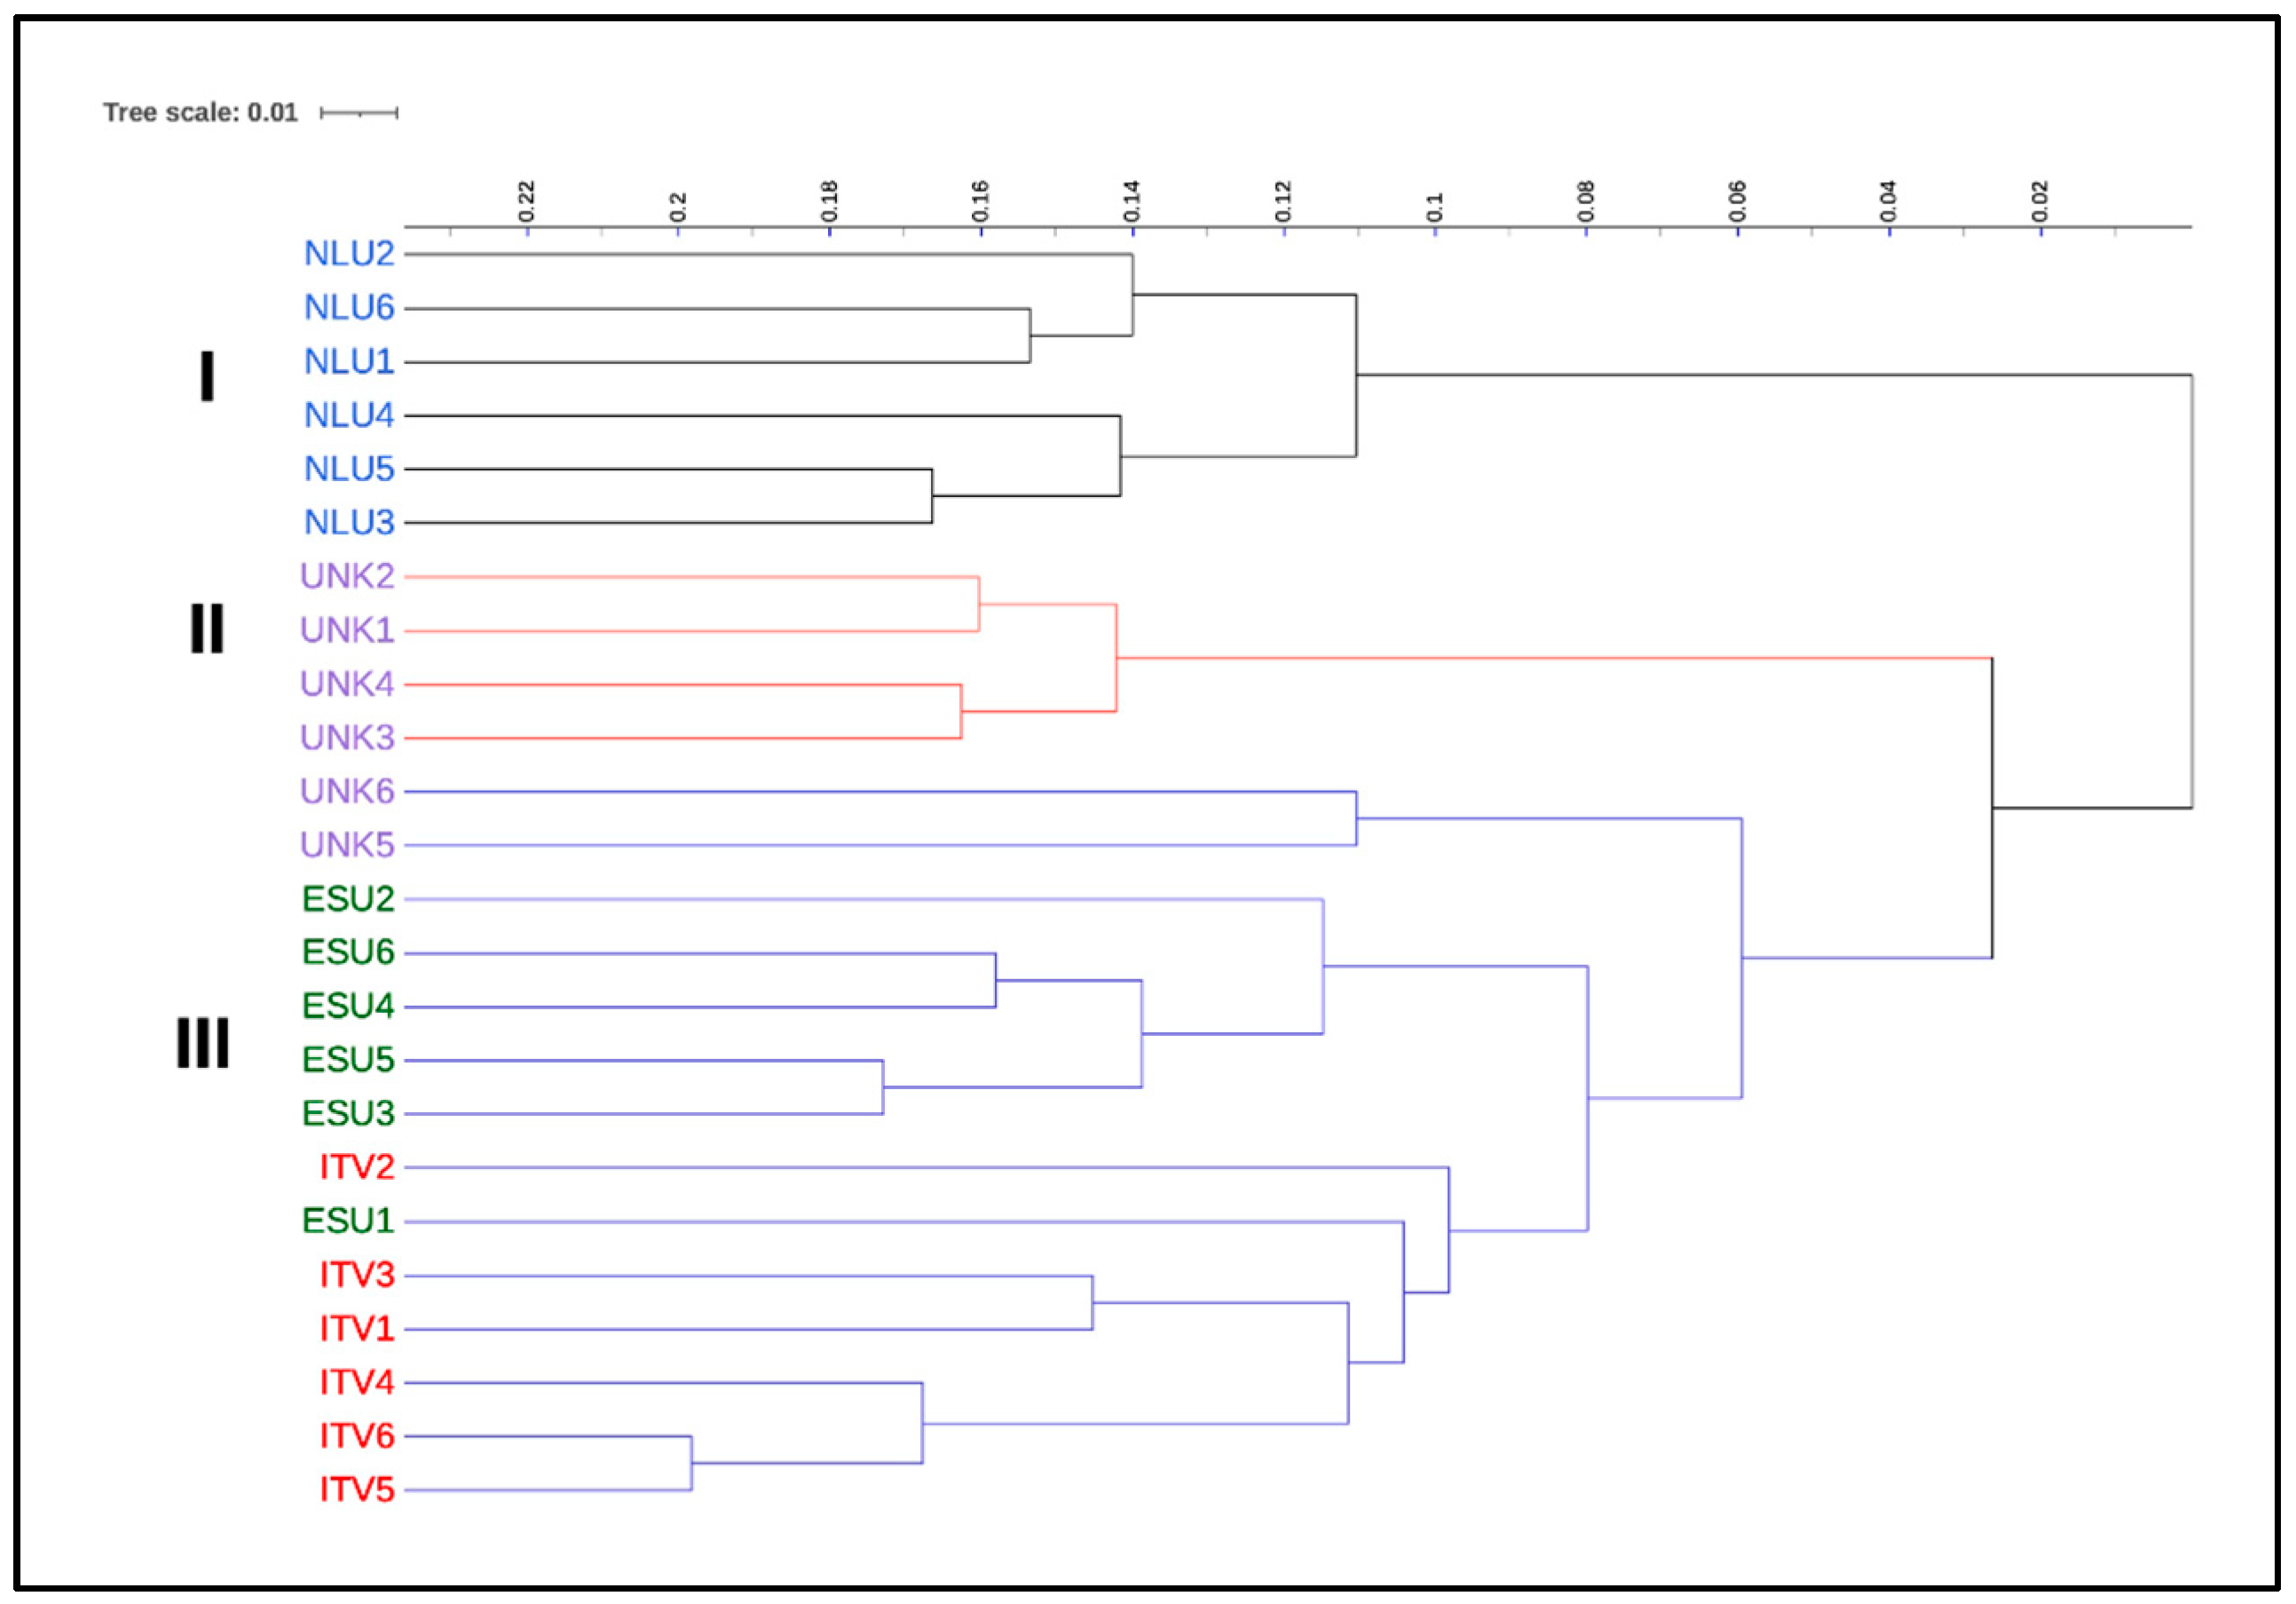
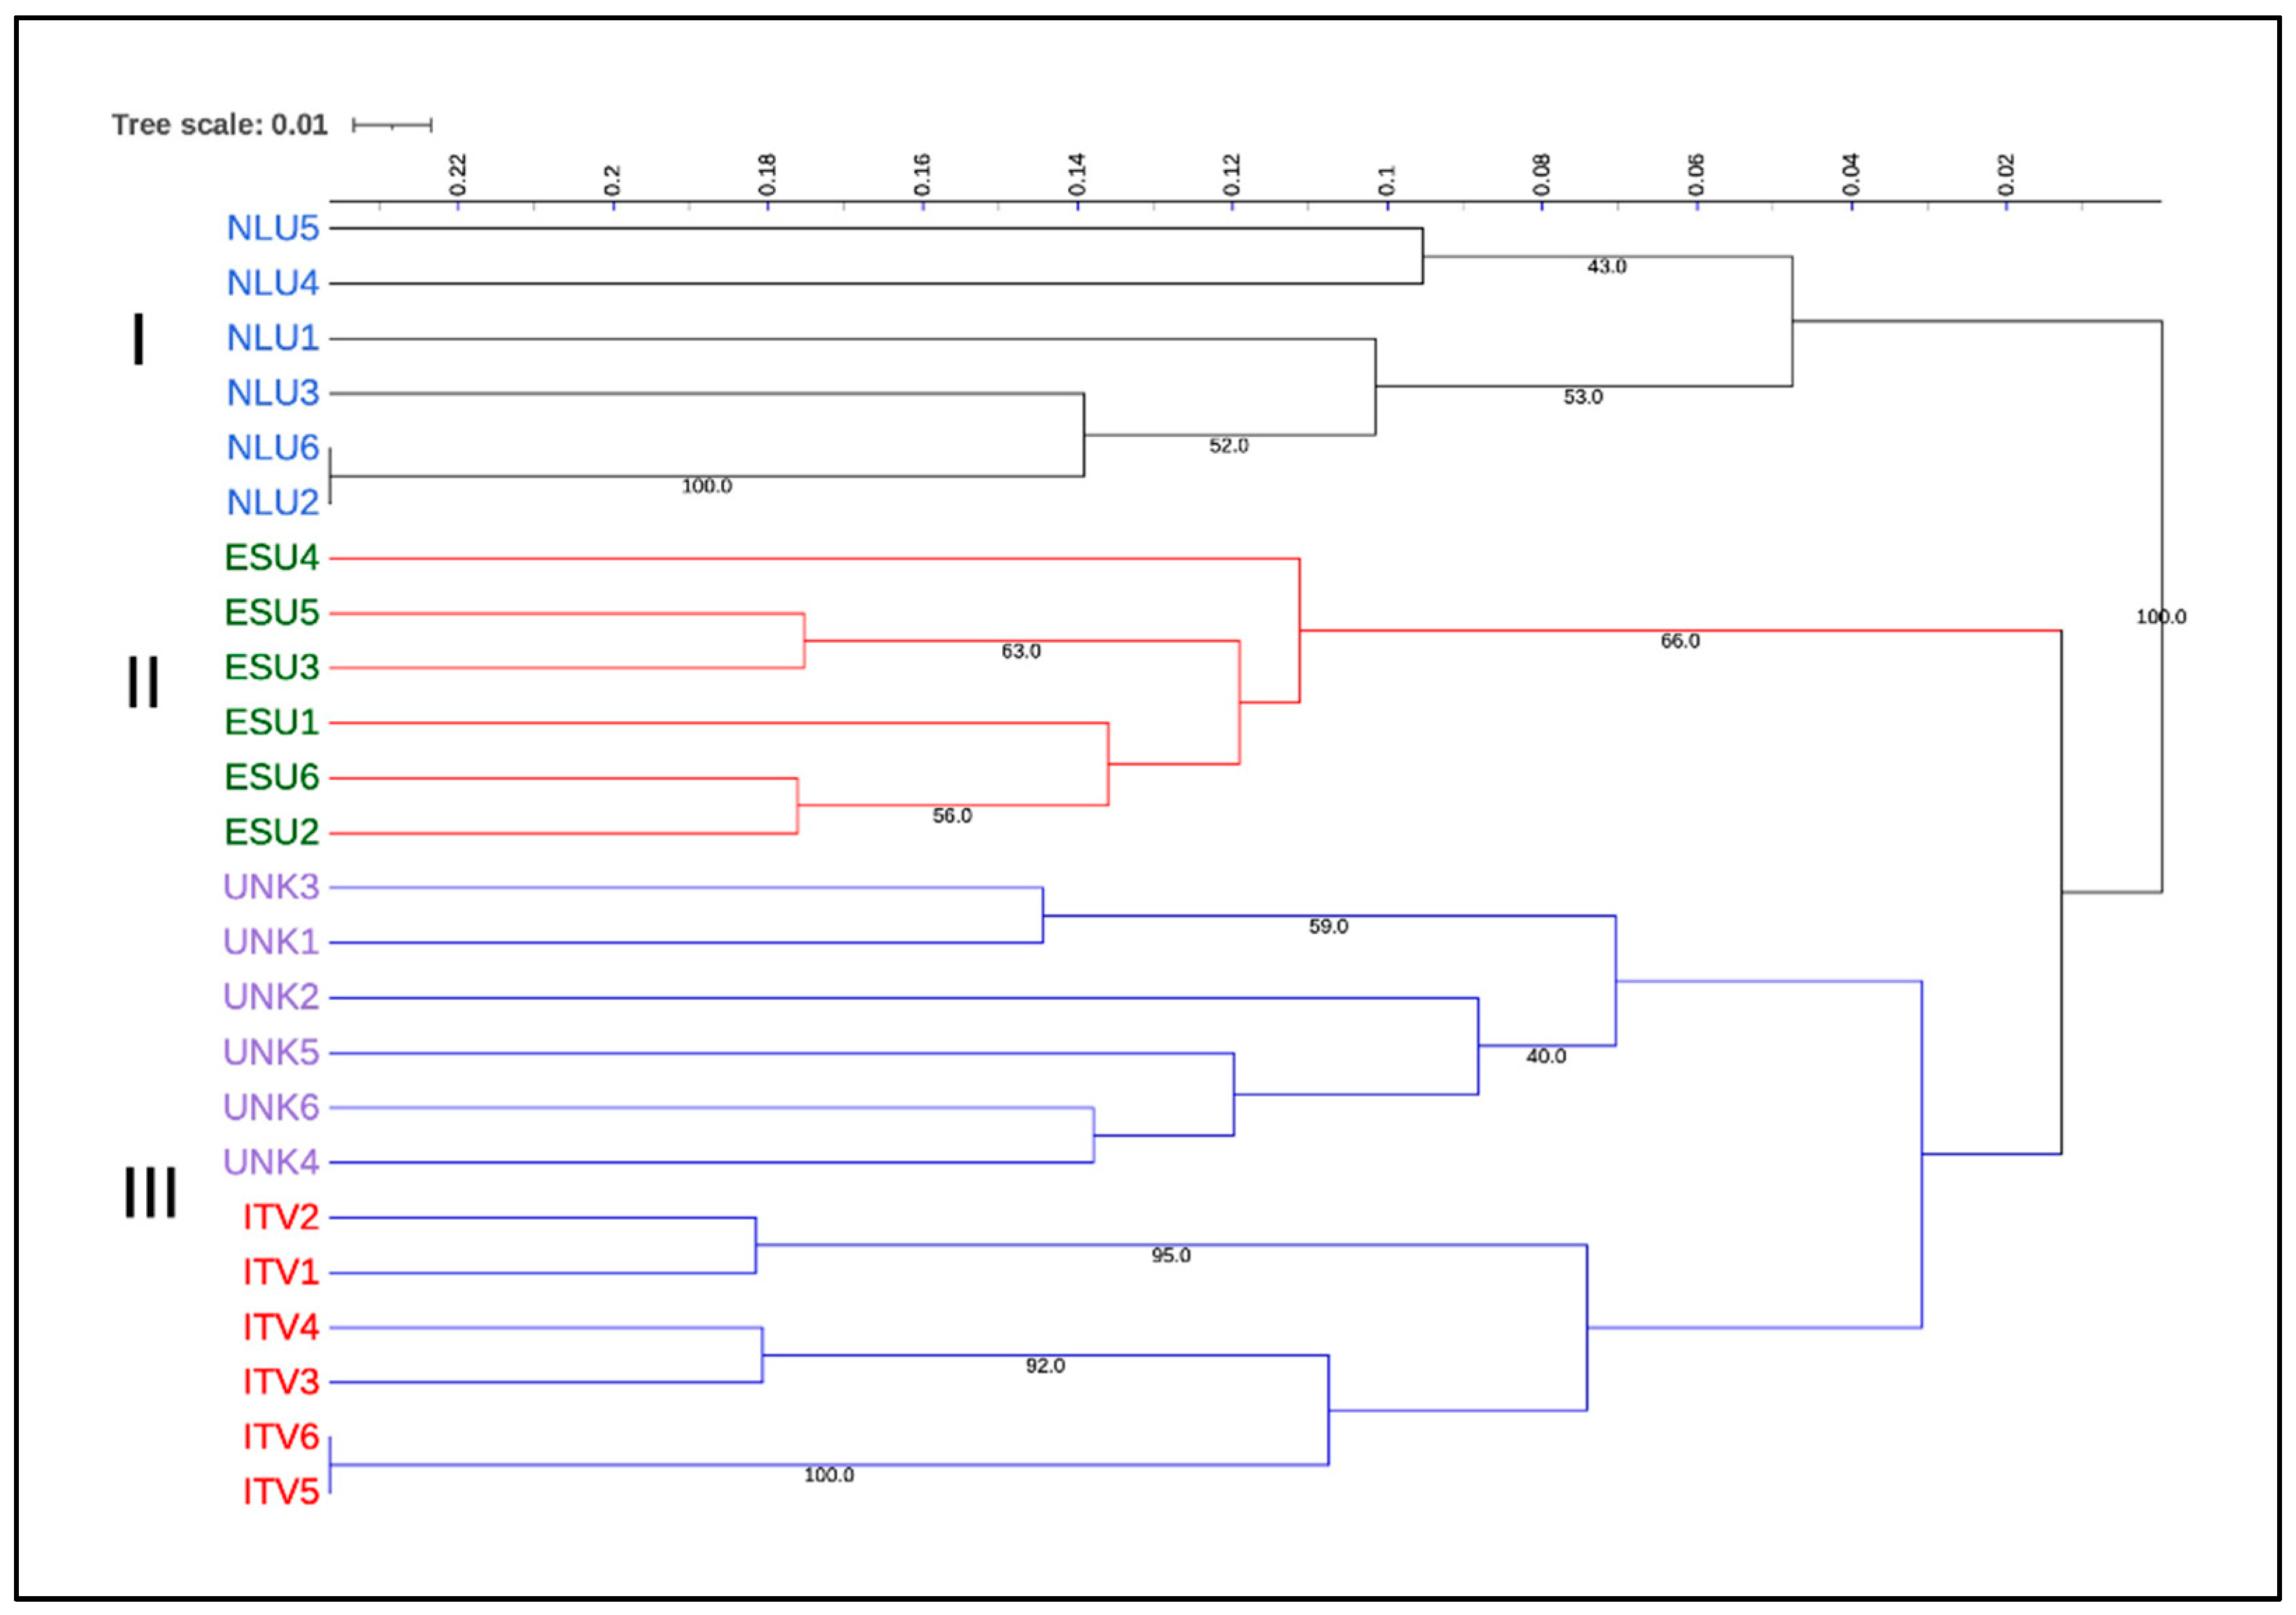
The average Gower distance between the 24 analysed A. araucana trees based on morphological traits resulted in being equal to 0.22, with the lowest value (0.04) observed for the couple ITV5 and ITV6, belonging to Italian population, and the highest value (0.25) observed in the pair NLU2–ITV6. The morphological dissimilarity dendrogram (Figure 4) showed three main aggregations. Cluster (I) held six specimens, and in particular, all those belonged to the NLU population, while the smallest cluster (II) held four out of six UNK specimens. Finally, cluster (III) agglomerated all specimens belonging to ESU and ITV, with accessions UNK5 and UNK6.

3.2. Genetic Diversity

Nine of the twenty-eight SSR primers were monomorphic and were discarded from the subsequent statistical analysis, resulting in nineteen polymorphic loci (Table S1). To enhance the potential of SSR markers, the genetic analysis was performed in 32 samples, considering not only the 24 samples used in the morphometric evaluation, but also the two ancestors of the ITV population and the second generation (ITM).
The 19 polymorphic SSR markers amplified a total of 58 alleles. The number of alleles (Na) ranged from a minimum of two, observed in many markers (i.e., aang03, aang24, aang38, aang45, aang47, ag62, ara11382, ara5185, ara5595 and cacrc2), to a maximum of seven (aang01 and ara2027) with an average of 3.053 (Table 4). Moreover, the effective number of alleles (Ne) showed a mean of 2.205, ranging from 1.358 (ara5595) to 4.188 (aang01). The frequency of the predominant allele (Fa) ranged from 0.281 (ag20) to 0.844 (ara5595), with an average of 0.618. The expected heterozygosity (He) varied between 0.264 (ara5595) and 0.761 (aaang01), with a mean of 0.495, while the observed heterozygosity (Ho) showed a marked reduction, ranging from 0.000 (aang03, aang24, aang45, aang47, ag20 and ara5595) to 0.719 (aang35), and leading to an average value of 0.188. In addition, the fixation index (F) presented a large variation, ranging from −0.377 (aang35) to 1.000 (aang03, aang24, aang45, aang47, ag20 and ara5595), with a mean of 0.620. Finally, the Polymorphic Information Content (PIC) displayed an average of 0.423, ranging between 0.229 (ara5595) and 0.727 (aang001).
An Analysis of Molecular Variance (AMOVA) was conducted to investigate the genetic variation of the six populations (Table 5). Particularly, it unveiled that the total genetic variation among populations accounted for 37%, while the variation within populations accounted for 63%. In addition, the differentiation among populations was also determined with the FST, showing a large overall value of 0.374 at a significant level (p-value < 0.001), and with the gene flow (Nm), displaying a small overall value of 0.418. Specifically, the pairwise FST ranged from 0.003 to 0.497 (Table S2). Although, among all populations, the FST was higher than 0.25, the value between ITV and ITM (F1 and F2 generations respectively) was very low. Moreover, ITM showed a major distance from the ancestors when compared to the one observed in ITV.
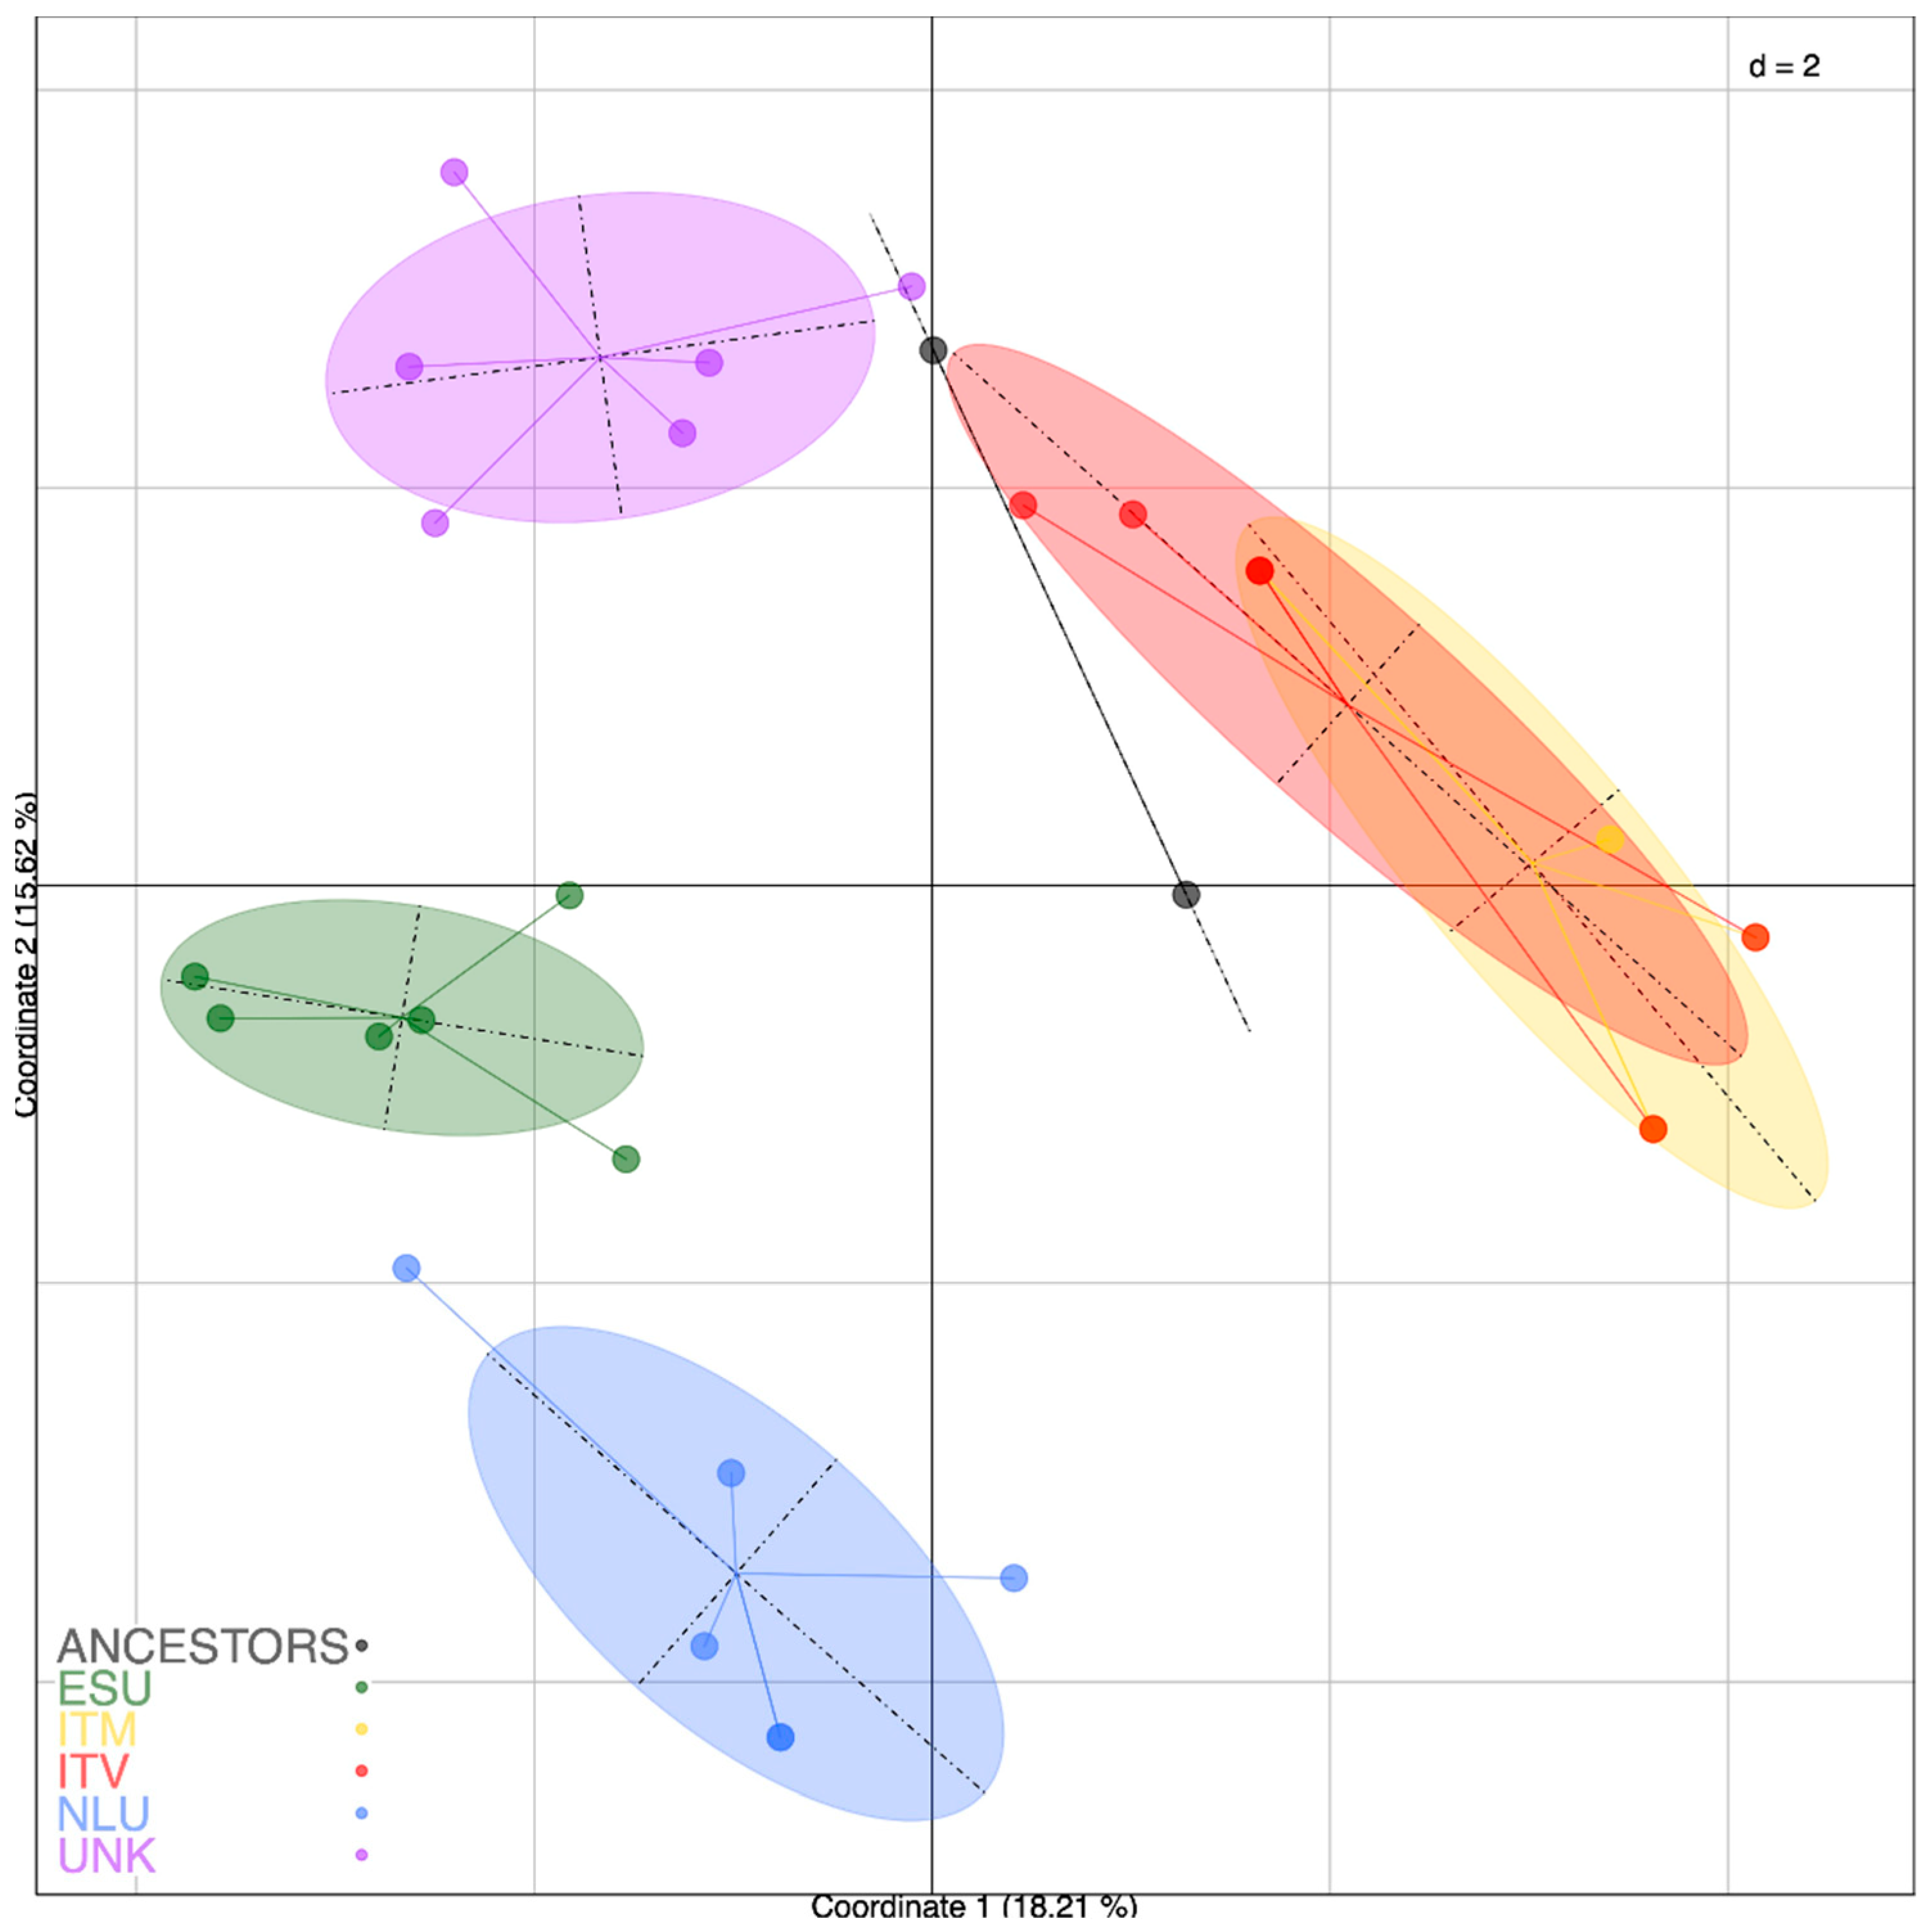
Since AMOVA and FST confirmed the genetic differentiation of the six populations, a Principal Coordinates Analysis (PCoA) was carried out in accordance with Euclidean distances, and it was plotted based on the first two coordinates (Figure 5). The first component accounted for 18.21% of the total genetic variation, while the second one accounted for 15.62%. PCoA confirmed the variation among the considered groups, separating the samples from the Dutch and Spanish fairs and the Tuscan local progeny. In addition, UNK was grouped with Italian and ancestor samples, suggesting its putative Italian origin. Furthermore, the two F1 and F2 generations (i.e., ITV and ITM) were clustered together at the right of the two ancestors, revealing the same genetic identity. As observed in FST, ITV F1 generation was closer from the ancestors than ITM F2 generation.
A further analysis was performed on the four populations used in morphometric analyses to validate these descriptors by the means of an UPGMA dendrogram (Figure 6). The average genetic Bruvo’s distance among the 24 selected samples was 0.23, with the lowest value (0.00) detected in the pairs NLU6-NLU2 and ITV6-ITV5 and the highest (0.47) between NLU5 and ITV5. The population was clustered into two main groups by a strong bootstrap analysis (1000 bootstraps). The first group (I) was composed of the Netherlands specimens (NLU), while the second one contained the remaining three populations. In more detail, cluster II showed two subsets of agglomeration, separating the ESU (II) from the ITV and UNK samples (III); these latter showed the highest genetic similarity, as observed in the PCoA.

3.3. Relationship and Concordance among Morphological and Molecular Markers

The cophenetic correlation coefficient value between the dendrogram and the original distance matrix, estimated from the morphological and SSR markers, was rmorph = 0.80 and rSSR = 0.82, respectively, indicating a fairly good fit for both sets of data.
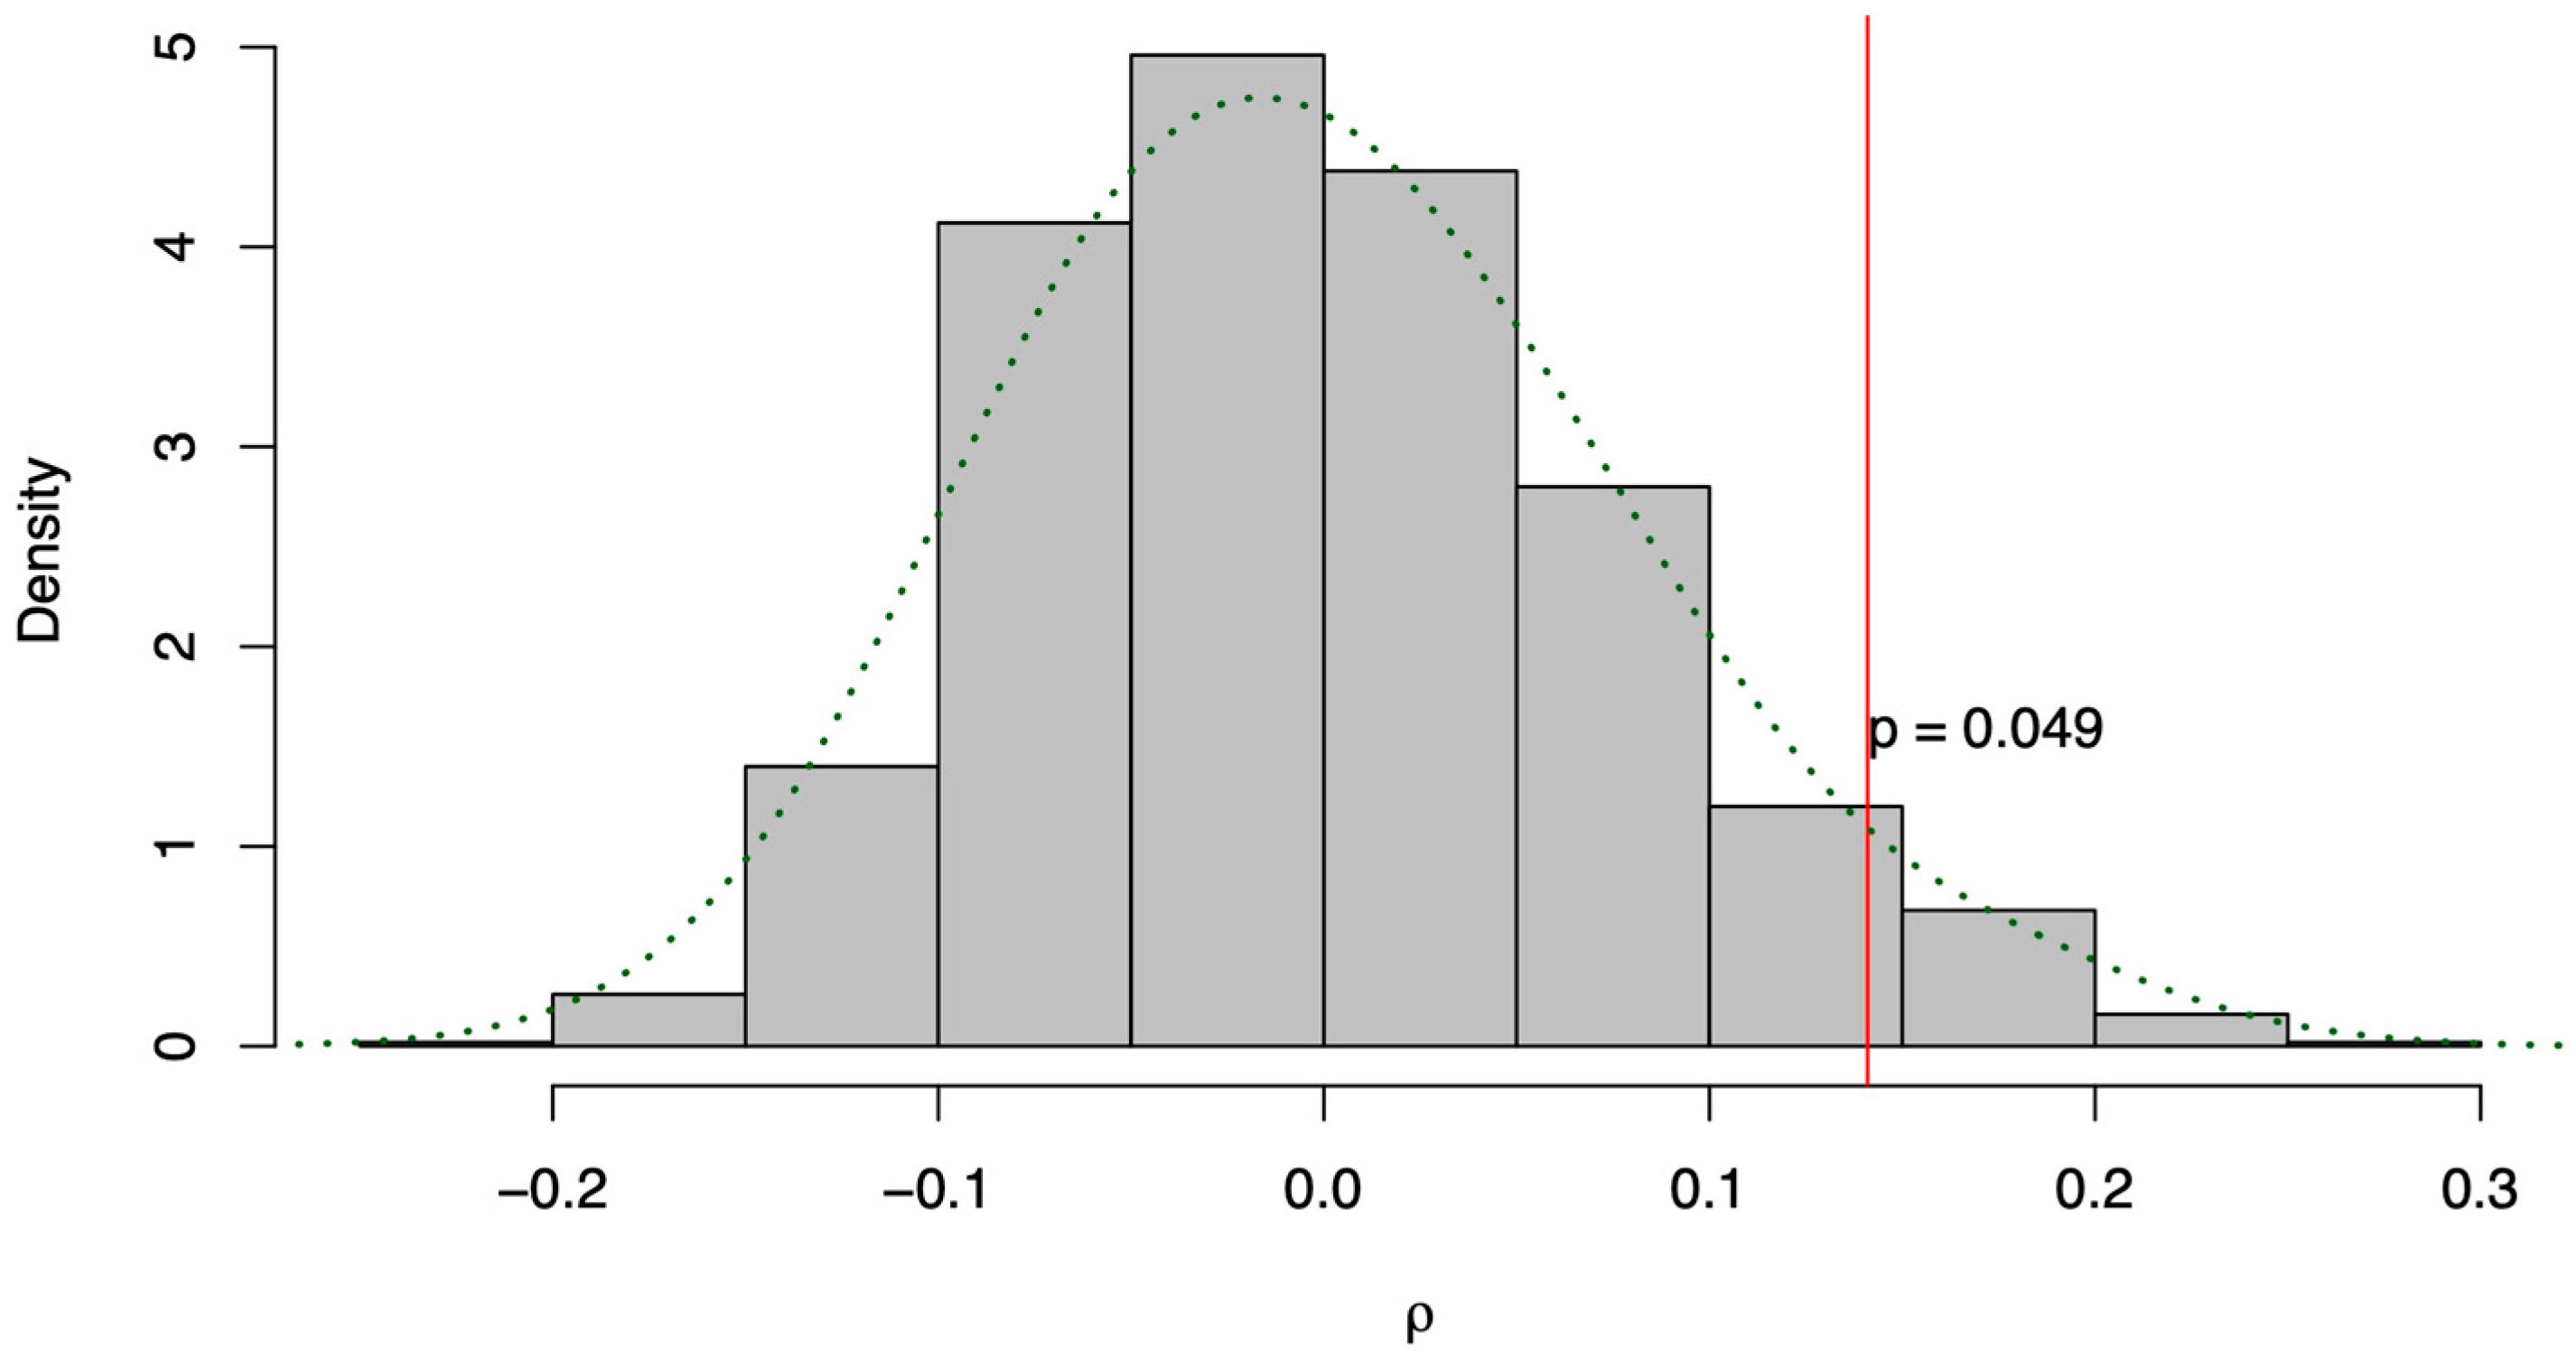
In order to define the reliability of the 26 developed morphometric parameters, a Mantel test between the genetic and morphological distance matrices was carried out. The test showed a significant correlation (p < 0.05) among genotypes and morphological traits, with a correlation value (ρ) of 0.141, after a computational analysis based on 1000 permutations (Figure 7).

4. Discussion

A wide range of variation was found for most morphological descriptors (Table 3) denoting their utility in describing the diversity of Araucaria plant materials and their relationships.
The PCA performed for quantitative traits was useful for identifying the most important traits associated with the variation among the studied putative populations (Figure 3). The most discriminating features were the uniformity of the branches’ diameter (øUPB and øUSB), length of the first internode (LFIn), wide section of primary branch (øWPB), narrow section of primary and secondary branches (øNPB and øNSB), and trunk diameter (Truø), followed by the width of trunk scales (WTrS), branch scale area (SBSA), and finally by the scale sizes (LSBS and WSBS), trunk scale area (TrSA), distance between scaffold branches (DiSB), density of trunk scales (DTrS) and length of the median internode (LMln). Narrow sections of primary and secondary branches (øNPB and øNSB), and branch scale area (SBSA) showed the highest correlation on PC1, while the uniformity of branches’ diameter (øUPB and øUSB), and length of the first internode (LFIn) were characteristics influencing PCA axis 2.
Figure 3 shows a projection of the A. araucana accessions, as determined by the first two principal components. The NLU from a Dutch fair (located on the left-hand side of the plan) seemed to diverge significantly from the other ones. This result was expected since these trees had the lowest average value for many of the examined traits. Among these, in addition to Truø, were those factors associated with canopy density (such as DiSB, ø/SB, LFIn, LMIn), with branched sections (such as øWPB, øNPB, øWSB øNSB), and scales’ size (such as TRSA, WSBS, LSBS, SBSA). On the other hand, NLU plants displayed the highest DTrS (38.5 mm) and øUSB (2.8 mm) values. Furthermore, this population presented a pyramidal-dense canopy, somewhat resembling other evergreen conifers, such as a spruce, pine, or fir, used as Christmas trees. For these characteristics, this group of accessions visually differed from the more classic and typical aspect of the monkey puzzle tree.
Accessions belonging to ITV, ESU, and UNK were generally characterized by a more striking, top-heavy appearance. In these plants, the jutting limbs branch out in decisive, well-separated, and safe lines to form a candelabrum silhouette, having stems and arms scaled with sharp, spade-shaped, green leaves. These individuals were found on the opposite side, in the right quadrant of the plane, with the exception of ESU2, UNK5 and UNK6. Going into more detail, the ITV and ESU populations were plotted together and mixed with each other in the middle–lower area of the PCA graph, sharing several highly discriminating characteristics, including both having greater Truø, WTRS, LTrS, TrSA, DiSB, øWSB, øNSB values, and lower DTrS, øUPB and øUSB values. Canopy shape was variable, but trees were characterized by a very uniform insertion angle of trunk scales (IATS) and scale size (USPB and USSB). UNK accessions found in the upper-right quadrant had trunk scale sizes and sections of secondary branches that were similar to those of ITV and ESU trees but were distinguished by the highest values of trunk scale density (DTrS), distance among scaffold branches (DiSB), length of first internode (LFIn) and sections of primary branch (øWPB, øNPB). Moreover, these columnar–elliptical shaped trees displayed the highest øUPB values, denoting a noticeable variability in the diameter sections of the primary branch.
Our morphological dissimilarity dendrogram also confirmed the application of morphological traits in separating and clustering the A. araucana putative populations into separate groups (Figure 4). In fact, all the plants of the ITV and ESU populations were grouped in the same cluster III, while NLU trees were matched to the cluster I. The fact that all the plants of the aforementioned populations were grouped into the same morphological cluster could indicate that the similar plant morphology of ITV and ESU groups might have been influenced by a low geographic distance from one another, along with similar site characteristics. Unfortunately, it was not possible to track the origin of the plant material cultivated in the Pistoia nursery industry, except for the ITV population, which arose from the ancestor trees of Villa Lodolo.
To our knowledge, the only research paper available regarding the morphological characterization of this species in worldwide literature is the one by Antonetti et al. [12], and this is the first time that previously developed descriptors have been used for the evaluation of germplasm diversity. Such a method has its own limitations, as many morphological traits are heavily influenced by the environmental conditions, with climate being the main factor affecting the growth and development of the species [40]. Moreover, the number of morphological characters that can be reasonably measured in field trials is relatively small, especially for very long-lived conifer species, such as A. araucana [41], which reaches large dimensions and varies considerably with age. Nevertheless, in this study, plants that were uniform in age and with similar environmental growth conditions were chosen, and SSR markers were used to assess their genetic diversity and corroborate the discriminating ability of the considered morphological descriptors.
Many genetic studies, using different molecular markers, were conducted in South American regions to assess the population diversity, in order to develop conservation strategies [15,16,17,18,21,42]. Although this species arrived in Europe in the XIX century, research studies on the genetic diversity of A. araucana in the old continent have not been performed, except for that accomplished by Antonetti et al. [12], which focused on the development of morphometric descriptors. Thus, data on genetic diversity of A. araucana trees found in the European continent are reported for the first time in this work. Moreover, this is the first research paper where the majority of SSR loci (i.e., 28) identified in the genus Araucaria were studied together [22,23,24,25]. Nine markers resulted in being monomorphic and not informative for genetic diversity analysis of the selected population, while the others showed a considerable level of polymorphism. As a matter of fact, the revealed monomorphism was related to the limited number of collected samples (as well as the restricted distribution of this species in the Mediterranean area). Even though the population size was reduced, the 19 polymorphic SSRs displayed substantial information, as unveiled by the PIC (Polymorphic Information Content). Botstein et al. [43] confirmed that molecular markers with PIC values lower than 0.25 are not informative, while values between 0.25 and 0.5 are moderately informative, and values higher than 0.5 are considered highly descriptive. Indeed, only one of the nineteen SSR loci (i.e., ara5595) showed a value below 0.25, while the other eighteen markers exhibited values above 0.25, highlighting the strong quality of the selected loci. In this work, the most informative were aang01, ag20, ara11382, and ara2027.
Regarding the heterozygosity level, the observed heterozygosity was very reduced in comparison to the expected value (Table 4). Moreover, the average observed heterozygosity (i.e., 0.188) was lower than that detected by Moreno et al. [42] and Martín et al. [18], which had values of 0.501 and 0.633 respectively. This marked divergence was certainly determined by the different derivation of populations. In fact, Moreno et al. [42] and Martín et al. [18] studied natural populations in the center of origin of this species, where biodiversity is obviously the highest. Nonetheless, in this study, the populations were restricted and presumably derived from a limited number of ancestors, leading to a decreased genetic diversity within populations. In addition, even if A. araucana is a dioicous species, reproduction occurred inside a restricted number of individuals due to the isolation of the studied groups, causing a reduction in the heterozygosity level. Indeed, 6 of the 19 SSRs (aang03, aang24, aang45, aang47, ag20 and ara5595) resulted in being homozygous, underlying this evidence.
According to our results, SSR molecular markers were able to distinguish the examined populations, as revealed by the AMOVA and the PCoA. Particularly, a high variation among populations, as certified by the substantial percentage of the total variation obtained in the AMOVA (i.e., 37%) and by the FST value (0.374), was detected. In fact, a genetic differentiation factor above 0.25 determines a significant genetic divergence among populations, in accordance with Wright [44]. FST revealed a genetic variation among populations similar to the one observed by Fuentes et al. [21], which was 0.252 (25% of the variation among the sites analyzed) through the AFLP molecular markers. Conversely, Martín et al. [18] observed an average FST value of 0.092, which ranged between 0.005 and 0.219, considering eleven populations collected from the Coast Cordillera and Andes Cordillera (Chile). This is the area where A. araucana is predominantly and naturally distributed, and where there is the highest variability and biodiversity, being presumably one of the sites of its origin. In fact, the increase in differentiation within groups is evident in natural, non-selected populations, because the genetic divergence and the gene flow are highly consistent. Otherwise, in our study, the groups were isolated and putatively originated from a limited number of ancestors, therefore resulting in a significant differentiation among populations and a restrained gene flow (i.e., 0.418).
PCoA confirmed this result, displaying a considerable separation among groups, and also distinguishing the provenience of UNK samples, which were clustered with the Italian samples (Figure 5). In addition, PCoA unveiled the genetic distances among the ancestors, including the F1 (ITV) and F2 (ITM) generations. As noticed also in the pairwise FST analysis (Table S2), ITV and ITM showed no genetic differences; however, ITM exhibited a major distance from its ancestors than ITV. Segregation variance refers to the increase in variance due to the segregation of alleles in a second filial generation (F2) relative to variance observed in a first filial generation (F1) from different genetic lines or divergent populations [45]. Hence, the apparent low segregation variance found in ITM F2 generation may have resulted rates of genetic differentiation between the sampled groups of parents and/or from the additive polygenic mode of inheritance.
Furthermore, morphometric and genetic analyses were compared to validate the 26 developed morphological descriptors. The first approach was based on the attainment of an UPGMA dendrogram, which was estimated from the SSR markers, and compared to that obtained from the morphological markers of the 24 considered accessions. Similarly to what was observed in the dendrogram calculated based on morphological traits, populations were divided into three different clusters based on genetic analyses (Figure 4 and Figure 6). Particularly, all NLU plants were matched to cluster I, while the remaining samples belonging to ITV, UNK and ESU were grouped in a different cluster. These results were in line with agglomerations found for morphological traits (Figure 4), although some differences were observed in the sub-clustering of putative populations ITV, UNK and ESU. In fact, ITV was grouped with UNK trees in the genetic analysis, while it was matched with ESU in the morphometric dendrogram. The small divergence among distances estimated from morphological and SSR markers of ITV, UNK and ESU specimens might be assumed to be associated with an environment-related morphological variation.
Additionally, the Mantel matrix correspondence test, widely used to evaluate the interrelation among morphological and genetic distances [46], was used to compare the two distance matrices. Our results showed a considerable correlation (ρ = 0.141), with a significant statistical probability (p = 0.049). Consequently, the 26 morphological descriptors were able to substantially discriminate between the populations. Obviously, SSRs offer a better resolution due to the absence of environmental influences, which play a fundamental role in phenotypic characterization, offering a valid tool for breeding selection. Nonetheless, the remaining difference, not identified by the two distance matrices, could be explained by the limited number of characteristics that were selected and measured along with the restricted and isolated population that was analyzed. Moreover, the very scarce genomic information that is available for this species makes it very difficult to predict how many genes are involved in the morphological analyzed characters. Qualitative traits are expected to be under monogenic or oligogenic control. Conversely, quantitative traits have a more complex genetic base, as they are governed by multiple genes and their interactions [47]. Both marker systems should be considered as complementary tools for providing a more complete understanding of the diversity available in Araucaria genotypes, since each marker system measures different aspects of germplasm variability.

5. Conclusions

In our study, morphological and genetic distances in four putative populations of A. araucana individuated in the Pistoia Nursery District (Tuscany, Italy) are given in detail for the first time. Both morphometry analysis and SSR markers proved to be useful tools for the identification of trees of a different origin. In particular, our results confirmed the importance of many trunk and branch morphological parameters in the characterization of A. araucana trees. Interestingly, a positive correlation between genetic and morphological distances was observed.
In order to develop improved selection programs based on morphometric characters, specimens have to be cultivated in the same areas, avoiding environmental influences, and subjected to a comparison of morphological traits, according to age and plant growth. Conversely, molecular marker analyses do not require these demands. Our results suggest that both morphological and genetic analyses can be used for discerning A. araucana individuals among populations and for exploring their variability. Specifically, the 26 selected morphometric descriptors might be adopted to distinguish specimens cultivated in the same environment due to their low cost and easy-to-use approach. On the other hand, SSR markers might be considered a powerful technique for the differentiation of natural populations, whose accessions have different ages and locations. The morphometric key traits which differentiated the populations were both quantitative and qualitative. Desirable variations were observed for several canopy traits (scale density, length of internodes, distance among scaffold branches, etc.), which contribute significantly to the diversity of the studied accessions, and might have potential uses in breeding programs.

Supplementary Materials

The following supporting information can be downloaded at: https://www.mdpi.com/article/10.3390/f14030466/s1, Figure S1: Pearson correlation coefficient (r) matrix and heatmap for the 19 considered quantitative morphological traits; Table S1: Number of alleles detected for each SSR locus; Table S2: Pairwise FST among each population (p-value < 0.001).

Author Contributions

Conceptualization, G.B. and M.A.; methodology, S.N., M.A. and G.B.; software, L.B.; Formal Analysis, S.N. and L.B.; Investigation, S.N., M.A. and M.G.; resources, G.B., S.N. and M.A.; data curation, S.N., M.A., L.B. and M.G.; writing—original draft preparation, S.N., L.B. and M.G.; writing—review and editing, S.N., M.A., G.B., M.G. and L.B.; Funding acquisition, G.B. All authors have read and agreed to the published version of the manuscript.

Funding

This research was supported by the Italian Ministry of Agriculture, Food and Forestry Policies (Mi.P.A.A.F.), Project O.I.G.A.-CARAVIV “Characterization of Araucaria araucana germplasm selected by the nursery industries of the Pistoia’s district for commercial development”.

Data Availability Statement

Data is contained within the article or Supplementary Material.

Conflicts of Interest

The authors declare no conflict of interest.

References

  1. Rau, M.F. Land Use Change and Natural Araucaria Forest Degradation, Northeastern Misiones-Argentina. Ph.D. Thesis, Faculty of Forestry, University of Freiburg—Albert-Ludwigs-University, Breisgau, Germany, 2005. [Google Scholar]
  2. Guerra, M.P.; Silveira, V.; Reis, M.D.; Schneider, L. Exploração, Manejo e Conservação Da Araucária (Araucaria angustifolia). In Sustentável Mata Atlântica—A Exploração de Seus Recursos Florestais; Editora Senac: São Paulo, Brazil, 2002; pp. 85–101. [Google Scholar]
  3. González, M.; Cortés, M.; Izquierdo, G.; Gallo, L.; Echeverría, C.; Bekkesy, S.; Montaldo, P. Araucaria araucana (Molina) K. Koch. Las Especies Arbóreas de los Bosques Templados de Chile y Argentina: Autoecología; Marisa Cuneo Ediciones: Valdivia, Chile, 2006; pp. 36–53. [Google Scholar]
  4. Zamorano, C.; Cortés, M.; Echeverria, C.; Hechenleitner, P.; Lara, A. Experiencias de Restauración Con Especies Forestales Amenazadas En Chile. In Restauración de Bosques en America Latina; FIRE/Mundi-Prensa: Mexico City, Mexico, 2008; pp. 18–36. [Google Scholar]
  5. Ribeiro, M.C.; Metzger, J.P.; Martensen, A.C.; Ponzoni, F.J.; Hirota, M.M. The Brazilian Atlantic Forest: How Much Is Left, and How Is the Remaining Forest Distributed? Implications for Conservation. Biol. Conserv. 2009, 142, 1141–1153. [Google Scholar] [CrossRef]
  6. Lara, A.; Solari, M.; Rutherford, P.; Thiers, O.; Trecaman, R.; Molina, R.; Prieto, R.; Montory, C. Cobertura de La Vegetación Original de La Ecoregión de Los Bosques Valdivianos En Chile Hacia 1550. In Informe Técnico; Proyecto FB49 WWF-UACH: Valdivia, Chile, 1999. [Google Scholar]
  7. Dos Reis, M.S.; Ladio, A.; Peroni, N. Landscapes with Araucaria in South America: Evidence for a Cultural Dimension. Ecol. Soc. 2014, 19, 43. [Google Scholar] [CrossRef] [Green Version]
  8. Aagesen, D.L. The Natural and Social Geography of Araucaria araucana. Master’s Thesis, University of Minnesota, Minneapolis, MN, USA, 1993. [Google Scholar]
  9. Sanguinetti, J.; Kitzberger, T. Patterns and Mechanisms of Masting in the Large-seeded Southern Hemisphere Conifer Araucaria araucana. Austral Ecol. 2008, 33, 78–87. [Google Scholar] [CrossRef]
  10. Gedye, D. The Introduction of Araucaria araucana into the British Isles. In Yearbook 2017; International Dendrology Society: Las Cruces, NM, USA, 2017. [Google Scholar]
  11. Gedye, D. Araucaria The Monkey Puzzle; Orakaria Press: Huntingdon, UK, 2019; 216p. [Google Scholar]
  12. Antonetti, M.; Nin, S.; Burchi, G. First Insight into Araucaria araucana (Molina) K. Koch under Its Southernmost European Growing Condition: A Proposed Descriptor List for Morphological Characterization. Adv. Hortic. Sci. 2019, 33, 283–294. [Google Scholar]
  13. Delmastro, R.; Donoso, C. Review of Distribution, Variation and Utilization of Gene Resources of Araucaria araucana (Mol.) Koch in Chile. In Proceedings of the IUFRO Symposio em Melboramiento Genetico e Productividade de Especias Florestais de Rapido Crescimento, Sociedade Brasiliera de Silvicoltura, Águas de São Pedro, Brazil, 25–30 August 1980; pp. 133–135. [Google Scholar]
  14. Rafii, Z.A.; Dodd, R.S. Genetic Diversity among Coastal and Andean Natural Populations of Araucaria araucana (Molina) K. Koch. Biochem. Syst. Ecol. 1998, 26, 441–451. [Google Scholar] [CrossRef]
  15. Bekessy, S.; Allnutt, T.; Premoli, A.; Lara, A.; Ennos, R.; Burgman, M.; Cortes, M.; Newton, A. Genetic Variation in the Monkey Puzzle Tree (Araucaria araucana (Molina) K. Koch), Detected Using RAPD. Heredity 2002, 88, 243–249. [Google Scholar] [CrossRef] [Green Version]
  16. Gallo, L.; Izquierdo, F.; Sanguinetti, L.; Pinna, A.; Siffredi, G.; Ayesa, J.; Lopez, C.; Pelliza, A.; Strizler, N.; Peñalba, M.G. Araucaria araucana Forest Genetic Resources in Argentina. In Challenges in Managing Forest Genetic Resource for Livelihoods: Examples from Argentina and Brazil; International Plant Genetic Resources Institute: Rome, Italy, 2004; pp. 105–131. [Google Scholar]
  17. Ruiz, E.; González, F.; Torres-Díaz, C.; Fuentes, G.; Mardones, M.; Stuessy, T.; Samuel, R.; Becerra, J.; Silva, M. Genetic Diversity and Differentiation within and among Chilean Populations of Araucaria araucana (Araucariaceae) Based on Allozyme Variability. Taxon 2007, 56, 1221–1228. [Google Scholar] [CrossRef]
  18. Martín, M.; Mattioni, C.; Lusini, I.; Molina, J.; Cherubini, M.; Drake, F.; Herrera, M.; Villani, F.; Martín, L. New Insights into the Genetic Structure of Araucaria araucana Forests Based on Molecular and Historic Evidences. Tree Genet. Genomes 2014, 10, 839–851. [Google Scholar] [CrossRef]
  19. Marchelli, P.; Baier, C.; Mengel, C.; Ziegenhagen, B.; Gallo, L. Biogeographic History of the Threatened Species Araucaria araucana (Molina) K. Koch and Implications for Conservation: A Case Study with Organelle DNA Markers. Conserv. Genet. 2010, 11, 951–963. [Google Scholar] [CrossRef]
  20. Marchelli, P.; Sanguinetti, J.; Izquierdo, F.; Ziegenhagen, B.; Martín, A.; Mattioni, C.; Gallo, L.A.; Amico, I.; Bozzi, J.; Gazo, M.C. Araucaria araucana and Salix humboldtiana: Two Species Highly Appreciated by the Society with Domestication Potential. In Low Intensity Breeding of Native Forest Trees in Argentina; Springer: Berlin/Heidelberg, Germany, 2021; pp. 175–214. [Google Scholar]
  21. Fuentes, G.; González, F.; Saavedra, J.; López-Sepúlveda, P.; Victoriano, P.F.; Stuessy, T.F.; Ruiz-Ponce, E. Assessing Signals of Selection and Historical Demography to Develop Conservation Strategies in the Chilean Emblematic Araucaria araucana. Sci. Rep. 2021, 11, 20504. [Google Scholar] [CrossRef]
  22. Scott, L.J.; Shepherd, M.; Henry, R.J. Characterization of Highly Conserved Microsatellite Loci in Araucaria cunninghamii and Related Species. Plant Syst. Evol. 2003, 236, 115–123. [Google Scholar] [CrossRef]
  23. Salgueiro, F.; Caron, H.; De Souza, M.; Kremer, A.; Margis, R. Characterization of Nuclear Microsatellite Loci in South American Araucariaceae Species. Mol. Ecol. Notes 2005, 5, 256–258. [Google Scholar] [CrossRef]
  24. Schmidt, A.; Ciampi, A.; Guerra, M.; Nodari, R. Isolation and Characterization of Microsatellite Markers for Araucaria angustifolia (Araucariaceae). Mol. Ecol. Notes 2007, 7, 340–342. [Google Scholar] [CrossRef]
  25. Martín, M.A.; Mattioni, C.; Lusini, I.; Drake, F.; Cherubini, M.; Herrera, M.A.; Villani, F.; Martín, L.M. Microsatellite Development for the Relictual Conifer Araucaria araucana (Araucariaceae) Using Next-generation Sequencing. Am. J. Bot. 2012, 99, e213–e215. [Google Scholar] [CrossRef] [Green Version]
  26. Wei, T.; Simko, V. R Package ‘Corrplot’: Visualization of a Correlation Matrix. (Version 0.90). Statistician 56. 2021. Available online: https://github.com/tayun/corrplot (accessed on 22 May 2022).
  27. Lê, S.; Josse, J.; Husson, F. FactoMineR: An R Package for Multivariate Analysis. J. Stat. Softw. 2008, 25, 1–18. [Google Scholar] [CrossRef] [Green Version]
  28. Kassambara, A.; Mundt, F. Package ‘Factoextra.’ Extract and visualize the results of multivariate data analyses. RCRAN 2017, 76, 1–74. [Google Scholar]
  29. Šlenker, M.; Koutecký, P.; Marhold, K. MorphoTools2: An R Package for Multivariate Morphometric Analysis. Bioinformatics 2022, 38, 2954–2955. [Google Scholar] [CrossRef]
  30. Letunic, I.; Bork, P. Interactive Tree Of Life (ITOL) v5: An Online Tool for Phylogenetic Tree Display and Annotation. Nucleic Acids Res. 2021, 49, W293–W296. [Google Scholar] [CrossRef]
  31. Peakall, R.; Smouse, P.E. GENALEX 6: Genetic Analysis in Excel. Population Genetic Software for Teaching and Research. Mol. Ecol. Notes 2006, 6, 288–295. [Google Scholar] [CrossRef]
  32. Liu, K.; Muse, S.V. PowerMarker: An Integrated Analysis Environment for Genetic Marker Analysis. Bioinformatics 2005, 21, 2128–2129. [Google Scholar] [CrossRef] [Green Version]
  33. Jombart, T. Adegenet: A R Package for the Multivariate Analysis of Genetic Markers. Bioinformatics 2008, 24, 1403–1405. [Google Scholar] [CrossRef] [Green Version]
  34. Chessel, D.; Dufour, A.B.; Thioulouse, J. The Ade4 Package-I-One-Table Methods. R News 2004, 4, 5–10. [Google Scholar]
  35. Siberchicot, A.; Julien-Laferrière, A.; Dufour, A.-B.; Thioulouse, J.; Dray, S. Adegraphics: An S4 Lattice-Based Package for the Representation of Multivariate Data. R J. 2017, 9, 198–212. [Google Scholar] [CrossRef]
  36. Bruvo, R.; Michiels, N.K.; D’SOUZA, T.G.; Schulenburg, H. A Simple Method for the Calculation of Microsatellite Genotype Distances Irrespective of Ploidy Level. Mol. Ecol. 2004, 13, 2101–2106. [Google Scholar] [CrossRef] [PubMed]
  37. Kamvar, Z.N.; Tabima, J.F.; Grünwald, N.J. Poppr: An R Package for Genetic Analysis of Populations with Clonal, Partially Clonal, and/or Sexual Reproduction. PeerJ 2014, 2, e281. [Google Scholar] [CrossRef] [Green Version]
  38. Oksanen, J.; Blanchet, F.G.; Kindt, R.; Legendre, P.; Minchin, P.R.; O’hara, R.; Simpson, G.L.; Solymos, P.; Stevens, M.H.H.; Wagner, H. Package ‘Vegan.’ Community Ecology Package, Version 2; R Core Team: Vienna, Austria, 2013; Volume 2, pp. 1–295. [Google Scholar]
  39. Hijmans, R.J. Introduction to the” Geosphere” Package (Version 1.5-14). 2021. Available online: https://CRAN.R-project.org/package=geosphere (accessed on 18 March 2022).
  40. Balduzzi, M.; Binder, B.M.; Bucksch, A.; Chang, C.; Hong, L.; Iyer-Pascuzzi, A.S.; Pradal, C.; Sparks, E.E. Reshaping Plant Biology: Qualitative and Quantitative Descriptors for Plant Morphology. Front. Plant Sci. 2017, 8, 117. [Google Scholar] [CrossRef] [Green Version]
  41. Vidaković, M. Conifers: Morphology and Variation; Grafičko Zavod Hrvatske: Zagreb, Croatia, 1991; ISBN 86-399-0279-8. [Google Scholar]
  42. Moreno, A.C.; Marchelli, P.; Vendramin, G.G.; Gallo, L.A. Cross Transferability of SSRs to Five Species of Araucariaceae: A Useful Tool for Population Genetc Studis in “Araucaria araucana”. For. Syst. 2011, 20, 303–314. [Google Scholar] [CrossRef] [Green Version]
  43. Botstein, D.; White, R.L.; Skolnick, M.; Davis, R.W. Construction of a Genetic Linkage Map in Man Using Restriction Fragment Length Polymorphisms. Am. J. Hum. Genet. 1980, 32, 314. [Google Scholar]
  44. Wright, S. The Interpretation of Population Structure by F-Statistics with Special Regard to Systems of Mating. Evolution 1965, 19, 395–420. [Google Scholar] [CrossRef]
  45. Benowicz, A.; Stoehr, M.; Hamann, A.; Yanchuk, A.D. Estimation of the F2 Generation Segregation Variance and Relationships among Growth, Frost Damage, and Bud Break in Coastal Douglas-Fir (Pseudotsuga menziesii (Mirb.) Franco) Wide-Crosses. Ann. For. Sci. 2020, 77, 28. [Google Scholar] [CrossRef]
  46. Al-Ashkar, I.; Alderfasi, A.; Ben Romdhane, W.; Seleiman, M.F.; El-Said, R.A.; Al-Doss, A. Morphological and Genetic Diversity within Salt Tolerance Detection in Eighteen Wheat Genotypes. Plants 2020, 9, 287. [Google Scholar] [CrossRef] [PubMed] [Green Version]
  47. Lynch, M.; Walsh, B. Genetics and Analysis of Quantitative Traits; Sinauer Associates Inc.: Sunderland, MA, USA, 1998; 980p. [Google Scholar]
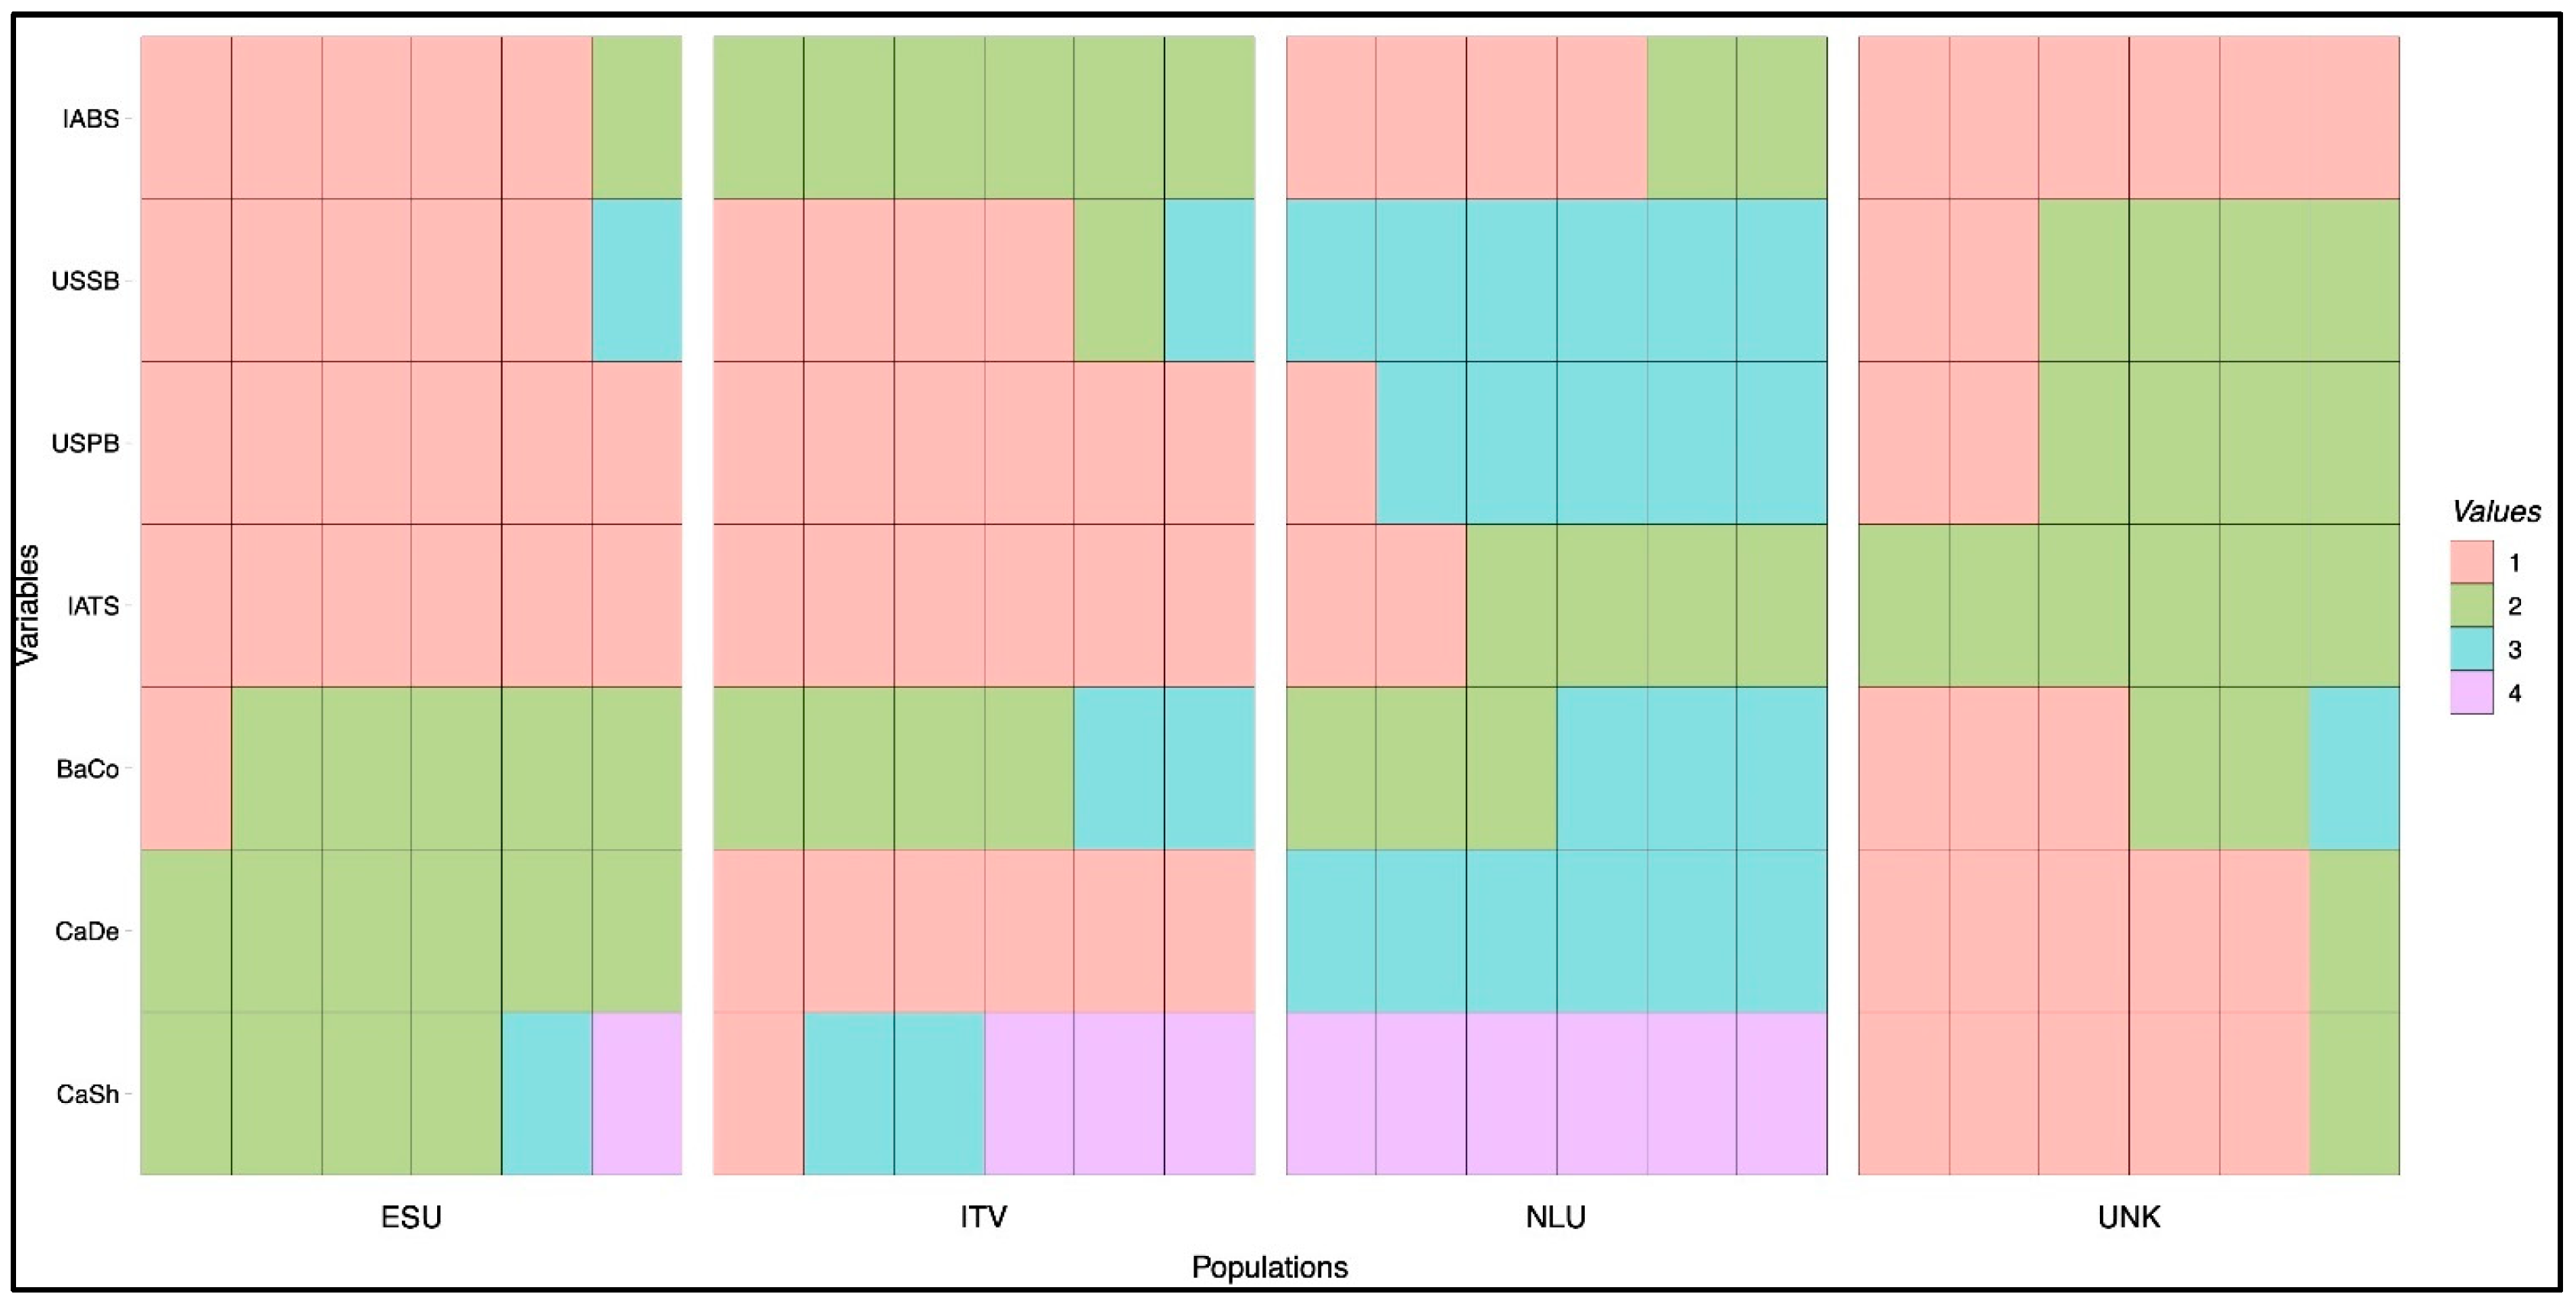
Figure 1. Distribution of qualitative morphological parameters of A. araucana within the four studied putative populations (ESU, UNK, NLU, ITV). CaSh = canopy shape (1—columnar, 2—elliptic, 3—globose, 4—pyramidal,). CaDe = canopy density (1—sparse, 2—medium, 3—dense). BaCo = bark colour (1—light grey, 2—greyish-green, 3—greyish brown). IATS = insertion angle of trunk scales (1—uniform, 2—variable). IABS = insertion angle of primary branch scales (1—angle ≤ 45°, 2—angle > 45°). USPB = uniformity of scale size on primary branch (high, medium, low). USSB = uniformity of scale size on secondary branch (high, medium, low).
Forests 14 00466 g001
Figure 2. Canopy appearance of the four putative A. araucana populations: (a) NLU; (b) UNK; (c) ESU; (d) ITV.
Forests 14 00466 g002
Figure 3. PCA biplot (left) and principal components (PCs) loadings (right). * Variables with component loading used to interpret the PCs: threshold level 0.23.
Forests 14 00466 g003
Figure 4. Dendrogram (UPGMA method) obtained from the Gower distance matrix calculated based on the morphological traits of the trunk, branches, and leaves of 24 A. araucana accessions individuated in the Pistoia nursery industry. Cophenetic correlation 0.80. Main clusters are indicated as I, II and III.
Forests 14 00466 g004
Figure 5. PCoA of the 32 A. araucana samples based on Euclidean distances.
Forests 14 00466 g005
Figure 6. UPGMA dendrogram obtained from the SSR markers, based on Bruvo’s distances of the 24 A. araucana accessions individuated in the Pistoia nursery industry. Bootstrap values are also reported. Cophenetic correlation 0.82. Main clusters are indicated as I, II and III.
Forests 14 00466 g006
Figure 7. Mantel test histogram showing the correlation ρ between morphometric and SSR genetic distance matrices of 26 A. araucana accessions from the Pistoia nursery industry. The correlation value (ρ = 0.141) is plotted on the x-axis with p < 0.05 (p = 0.049) shown by the vertical red line. The green dotted line represents the trend of the curve.
Forests 14 00466 g007
Table 1. Putative populations of A. araucana found in northern Tuscany (Italy): seed source, seed origin, population code, cultivation area and coordinates, tree age and codes of the tree samples.
Seed SourceSeed OriginPopulation CodeCultivation AreaCoordinatesTree AgeTree Samples
Spain—fair in ValenciaUnknownESUVivai Bartolini, Pistoia43°53′ N; 10°55′ E; 60 m a.s.l.20–25ESU1, ESU2, ESU3, ESU4, ESU5, ESU6
UnknownUnknownUNKVivai Bartolini, Pistoia43°53′ N; 10°55′ E; 60 m a.s.l.20–25UNK1, UNK2, UNK3, UNK4, UNK5, UNK6
The Netherlands—Dutch fair standUnknownNLUVivai Bartolini, Pistoia43°53′ N; 10°55′ E; 60 m a.s.l.20–25NLU1, NLU2, NLU3, NLU4, NLU5, NLU6
Italy—Villa Lodolo (S. Marcello Pistoiese, Pistoia)Ancestor treesITVAzienda Capecchi, Pistoia43°88′ N; 10°97′ E; 60 m a.s.l.20–25ITV1, ITV2, ITV3, ITV4, ITV 5, ITV6 (F1)
Italy—Azienda Macchia Tommaso (La Grazie, Pistoia)F1 of the ancestor treesITMAzienda Macchia Tommaso, Pistoia44°0′ N; 10°52′ E; 550 m a.s.l.6ITM1, ITM2, ITM3, ITM4, ITM5, ITM6 (F2)
Argentina (1920)Indigenous trees of the Argentine AndesARGVilla Lodolo, S. Marcello Pistoiese, Pistoia44°03′ N; 10°47′ E; 623 m a.s.l.~100ARG1 = female ancestor,
ARG2 = male ancestor
Table 2. List of the 28 SSR loci used for the A. araucana genetic analysis: SSR name, GenBank accession, forward and reverse primer sequences, repeat motifs, observed size, and references.
SSR NameGenBank AccessionForward Primer (5′-3′)Reverse primer (5′-3′)Repeat MotifSize (bp)References
Ara2027JN896693AGGAAGGCATTTTGGCTTGGTGGTCATCTTAATGGTACTTTGATTG(AC)22128–156[25]
Ara5179JN896694GCTTATAGACTCGACTTGCCACCGGATCCACCATTTGTAACTTTG(CA)15144[25]
Ara5182JN896695TGATGTGAGCCAAAATCAAAATCAGGAGAGAGTCATGAAGCCG(TG)15172–206[25]
Ara5595JN896696AGTCCAAAATAGACATAGGCATCCTGGGAAAATCAAACCCTCGC(CA)12123–125[25]
Ara11382JN896697GGAAAGTAGCAAGGCCTCAACTGCCTAAAACATCCCTTGGAC(AC)14200–208[25]
Ara11384JN896698TGATTGATGTGATTGGCTACAAATTCTGTTTGCATGCTTGGAGTGG(CA)16120–130[25]
Ara20681JN896699AACTAAAAACCTTAAATGCTCATCGCAATCCTCAAATTAGCCCATGC(GT)12187–191[25]
Ag20AJ749964ACTAGGAATGGATGTTGGTGAAGGTATGGCATCATGTCTC(GA)12180–200[23]
Ag45AJ749966CCATCCTCCATCATTCATCCTCCCTCCCTATGTCCCAAAG(GT)4AT(GT)7170–182[23]
Ag56AJ749967CCACACTCAAAACAATAGCAGTTCTGAAGTTGGCCAATCAGATAC(TC)11165–171[23]
Ag62AJ749968ATATGGTGGGGTGCCTACAGTCCAATCGTTCCTCCAACAG(TC)13126–130[23]
CRCAc2AF522867ATGCATGACTAGGATGAACAATAGTTCTGCTTATCACATCT(GA)23190–196[22]
Aang01AY865575TGACGGGTTCACTCCTACCTTAGGAACCCCCATTCATTTG(CT)22224–234[24]
Aang03AY865577CGCCTACCTCAATCACTGGTTGGGACAATGTGCTTATCCA(CT)13254–260[24]
Aang07AY865579ACCTCACAGGGACACCTCACTTTTCATGCATGTTGCTTGC(GA)24195[24]
Aang12AY865581AAGGGTTCACAATGCTGAGGTGGATTTTATTATGATGGTTGTTCC(GA)23192[24]
Aang14AY865583GAGCACGTGCAGATGTTGATCCATCCTCTCCATGACCACT(GA)27160[24]
Aang18AY865586ACACGTTTAATCAGACGAAGAAGATGCCACCTTTTTCAGCAAC(TC)9207[24]
Aang21AY865587GGAGACACCTCACCCCCTATGATGAGGGAGGATTACAAGC(CT)12188[24]
Aang22AY865588TCAACTTGCAAGGTCACCTCTAATGGGAGCCCCTTCTAGTGT(GA)10220[24]
Aang24AY865590CTCTCCTTCCCCTTGCTCTTAGGTGGATCACCCACTGAAG(CT)19198–204[24]
Aang27AY865591CATGGTGGCTATTGCTCCTTAGAAGCCATCAAAGGAGTGG(CT)12193[24]
Aang28AY865592TCCATTGCATTAGTTTGGGATATTTCCAATCATACATTCACCACA(CT)11136–142[24]
Aang35AY865594GGTGAAGCTTCGTTTCAAGGCCACTTGTCTTCACCAACCA(GA)10169–173[24]
Aang37AY865596GGGGAGTTTCCATGAGATGATCCACTCACCACTCTGAGGA(GA)18266–268[24]
Aang45AY865601AGGCTCACATCAGGCTCACTTGGTTTTGGTGGTCAAATCA(CT)15199–216[24]
Aang46AY865602TCCACCTACCTCAATCACTGGTGGGACAATGTGCTTATCCA(CT)12259–267[24]
Aang47AY865603GATATGAAAAGAAGGGTTCTATGCTTTTCTTCCATTCCTCCAAGC(GA)15180–188[24]
Table 3. Descriptive statistics of morphological parameters of A. araucana related to the total amount of studied specimens (TS) and the four putative populations (ESU, UNK, NLU, ITV).
Morfological ParameterStatisticsTSESUUNKNLUITV
n246666
TRUNKTrunk diameter (mm) TruøAverage *115.0143.3 a97.5 b88.3 b140.0 a
SD32.413.616.629.923.3
CV%18.89.517.133.917.1
Density of trunk scales (mm) DTrSAverage *28.520.8 b33.2 a38.5 a19.2 b
SD8.54.310.29.75.0
CV%27.420.930.825.226.7
Maximum width of trunk scale (mm) WTrSAverage *15.616.4 ab14.9 bc14.6 c17.5 a
SD2.71.91.02.44.3
CV%27.311.76.717.025.9
Maximum lenght of trunk scale (mm) LTrSAverage *39.641.5 a39.5 a33.9 b43.6 a
SD6.83.49.83.65.2
CV%17.28.425.010.812.1
Trunk scale area (mm) TrSAAverage *624.4680.1 a588.4 b505.1 c749.1 a
SD159.690.1162.3130.1177.9
CV%25.713.228.025.724.4
Distance among scaffold branches (mm) DiSBAverage *335.8338.3 a377.1 a258.4 b365.0 a
SD74.265.578.446.332.7
CV%18.019.421.418.09.0
Diameter/number of secondary branches (mm) ø/SBAverage *13.113.1 b14.8 ab8.1 c16.4 a
SD3.82.13.10.72.6
CV%18.716.721.39.016.0
PRIMARY BRANCHLenght of first internode on primary branch (cm) LFInAverage *34.531.5 c45.8 a25.0 d38.5 b
SD13.05.319.63.85.8
CV%29.216.942.915.415.3
Lenght of median internode on primary branch (cm) LMInAverage *20.921.5 b22.7 ab15 c24.4 a
SD4.72.75.02.52.0
CV%22.812.822.417.08.5
Wide section of primary branch including scales (mm) øWPBAverage *9.49.0 b11.0 a7.9 c9.6 b
SD1.51.01.51.00.8
CV%16.311.713.712.58.8
Narrow section of primary branch including scales (mm) øNPBAverage *7.07.2 b7.9 a5.3 c7.8 a
SD1.31.40.80.60.5
CV%19.319.811.112.36.8
Apparent diameter uniformity on primary branch (mm) øUPBAverage *2.31.8 b3.0 a2.6 a1.8 b
SD1.00.81.20.60.6
CV%43.844.543.331.735.3
SECONDARY BRANCHWide section of secondary branch including scales (mm) øWSBAverage *7.37.8 a7.5 a6.6 b7.3 a
SD0.81.00.70.70.3
CV%11.814.110.611.75.3
Narrow section of secondary branch including scales (mm) øNSBAverage *5.05.7 a5.0 b3.8 c5.6 a
SD0.91.00.40.50.5
CV%19.618.08.314.210.1
Apparent diameter uniformity on secondary branch (mm) øUSBAverage *2.32.2 b2.5 ab2.8 a1.7 c
SD0.70.70.70.70.3
CV%32.932.730.726.921.0
Scale density on secondary branch SDSBAverage *16.616.0 b13.6 c17.0 b19.9 a
SD2.91.31.31.23.0
CV%17.58.710.37.115.5
Maximum width of secondary branch scale WSBSAverage *12.714.7 a12.6 b9.7 c13.6 c
SD2.52.31.41.71.5
CV%19.915.511.317.911.2
Maximum lenght of secondary branch scale LSBSAverage *34.338.6 a35.2 b28.6 c34.6 b
SD4.54.11.21.73.2
CV%13.210.83.66.19.3
Secondary branch scale area SBSAAverage *444.0570.3 a451.7 b284.1 c469.8 b
SD128.6110.353.255.684.8
CV%29.019.311.719.918.1
* Different letters for the average of each parameter indicate significant differences by Tukey’s test for p ≤ 0.01
Table 4. Genetic parameters of the 19 polymorphic loci in 32 A. araucana accessions. For each locus, the number of alleles (Na), the effective number of alleles (Ne), the frequency of the predominant allele (Fa), the observed (Ho) and expected heterozygosity (He), the fixation index (F) and the polymorphic information content (PIC) are reported.
LocusNaNeFaHoHeFPIC
aang017.0004.1880.3750.1880.7610.7540.727
aang032.0001.6000.7500.0000.3751.0000.305
aang242.0001.8220.6560.0000.4511.0000.349
aang282.0001.6790.7190.0630.4040.8450.323
aang353.0002.0920.5470.7190.522−0.3770.415
aang452.0001.8220.6560.0000.4511.0000.349
aang465.0001.9230.7030.3750.4800.2190.454
aang472.0001.6000.7500.0000.3751.0000.305
ag204.0003.9690.2810.0000.7481.0000.701
ag453.0002.1360.6090.3130.5320.4120.458
ag563.0001.6970.7340.4690.411−0.1410.357
ag622.0001.6400.7340.2190.3900.4390.314
ara113822.0001.8220.6560.0630.4510.8610.349
ara113843.0002.6530.5000.5000.6230.1970.552
ara20277.0004.1710.3280.0310.7600.9590.724
ara206813.0002.1690.5630.1880.5390.6520.447
ara51822.0001.6790.7190.3130.4040.2270.323
ara55952.0001.3580.8440.0000.2641.0000.229
CRCAc22.0001.8820.6250.1250.4690.7330.359
Mean3.0532.2050.6180.1880.4950.6200.423
Table 5. Analysis of Molecular Variance (AMOVA) for the 6 A. araucana populations (32 specimens).
SourcedfSSMSEst. Var.%FSTNm
Among Pops5115.97423.1951.90537%
Within Pops58185.1673.1933.19363%
Total63301.141 5.098100%0.374 ***0.418
*** p-value < 0.001.
Disclaimer/Publisher’s Note: The statements, opinions and data contained in all publications are solely those of the individual author(s) and contributor(s) and not of MDPI and/or the editor(s). MDPI and/or the editor(s) disclaim responsibility for any injury to people or property resulting from any ideas, methods, instructions or products referred to in the content.