1. Introduction
Timber harvesting is one of the essential components in forest management because it enables the delivery of wood to industries and direct consumers [
1,
2] and brings many benefits, such as the capitalization of forest products [
2], diversification in employment [
3], and added value in the forestry-related value chains [
4,
5]. There are a number of systems and a wide variety of options used in timber harvesting [
6,
7], of which the Nordic cut-to-length system, which is composed of a harvester and a forwarder, is believed to be the most technologically advanced [
8]. Typically, the harvester-forwarder system is used for regular harvesting operations developed in the forests, with the purpose of delivering the wood at the landing in the form of logs, which may then be directly used in wood processing industries. An important component of this system is the harvester, which is designed as a multifunctional machine able to fell, delimb and buck the trees into final assortments; these operational functions are supported by the highest degree of automation currently available on the market of forest operations machines [
8].
There is a well-developed body of knowledge on the performance of harvesters, consistently showing that their productivity is related to several factors, such as the tree size, stand type and productivity class, species, removal intensity and type, ground conditions, machine class, and operators’ skills. A detailed discussion of such factors can be found in the work of [
9], which is based on an extensive review of productivity studies. The relevance of most such factors in explaining the variation in productivity was backed up by other studies [
10,
11,
12,
13,
14] as well as by the availability of long-term computer data [
15,
16].
Owning and operating forest machines is generally expensive, which comes mostly from the fact that purchasing costs of new equipment are very high. This is common for harvesters, which are currently sold at prices that may exceed EUR 500,000. Among the mechanisms to lower these costs is increasing the machine utilization rate [
17]. However, this largely depends on the success of companies in getting sufficient contracts around the year, their operational planning strategy, logistics incurred by machine relocation, and the supply of fuels and spare parts, as well as on other factors such as dynamics in weather, legal restrictions, practices in forestry related to the time allocated for harvesting, the technical reliability of the machines, and the availability of skilled workers. In Austrian conditions, for instance, it was estimated that harvesters worked for an average of 2042 productive hours per year out of 3300 scheduled hours, which means a mean utilization rate of approximately 62%, which was further described by high variability in productive hours (938 to 3120) [
18]. In addition, this applies to a company that holds and implements a well-established, efficient work-shifting protocol [
19], whereas in many other regions in which either the implementation of fully mechanized systems is in an infantile stage or restricted as share, the companies are too small to afford payments for big harvesting contracts, or the contracts are available for low and dispersed wood removals, the utilization rates of harvesters may be much less. Coupled with other factors, this implies higher ownership costs and less profitability in business.
Practice has shown many examples of flexibility in using the equipment designed for a specific task or operation by adaptation to other functions or operations. While single-grip harvesters were purposely designed for tree felling and processing in the forest, they may also support tree processing (delimbing and bucking) in any other place, working, therefore, as processors. In Romania, for instance, forced by the weather conditions, topography, availability of wood to be harvested, removal type and intensity, and legal restrictions, some contractors have started to rethink their operational strategy by using the available harvesters for wood processing tasks at the landing. Their thinking was probably driven by principles of increasing the share of operational time, reducing the harvesting costs, as well as increasing the efficiency of bucking operations at the roadside, which has been commonly carried out by motor-manual means. In addition, such an option would be more flexible to changing weather conditions, given that a sufficient amount of wood would be stored at the roadside and a harvester could use the time unavailable for forest work in processing tasks at the roadside. As an outcome, some contractors have started to couple motor-manual felling and delimbing in the forests with skidding-based extractions and harvesters working at the landing. Undoubtedly, this operational rethinking has the potential to significantly improve the productivity of landing operations, which is intuitive given the degree of mechanization commonly used in these operations. In addition, other support functions, such as the capability to handle the stems and to help in sorting and piling the logs by the use of the harvester’s crane, may bring benefits by excluding the necessity to use another machine for such tasks. However, other issues, such as the fuel consumption, cost and recovery rate, need to be considered so as to check the usefulness of this kind of work setup.
This study was motivated by the above-mentioned concerns and mainly by the attempt to check if it would be reasonable to increase the machine utilization rate by a potential (re)allocation to new tasks during the time it cannot be used in regular harvesting tasks. The goal of this study was to evaluate the operational performance of bucking operations carried out by a single-grip harvester at the landing by (i) accounting for time consumption, (ii) estimating and modelling the efficiency and productivity, (iii) estimating the unit fuel consumption and (iv) estimating the operational costs. Based on the collected data, an estimation of the log recovery rate was done as well.
2. Materials and Methods
2.1. Study Location
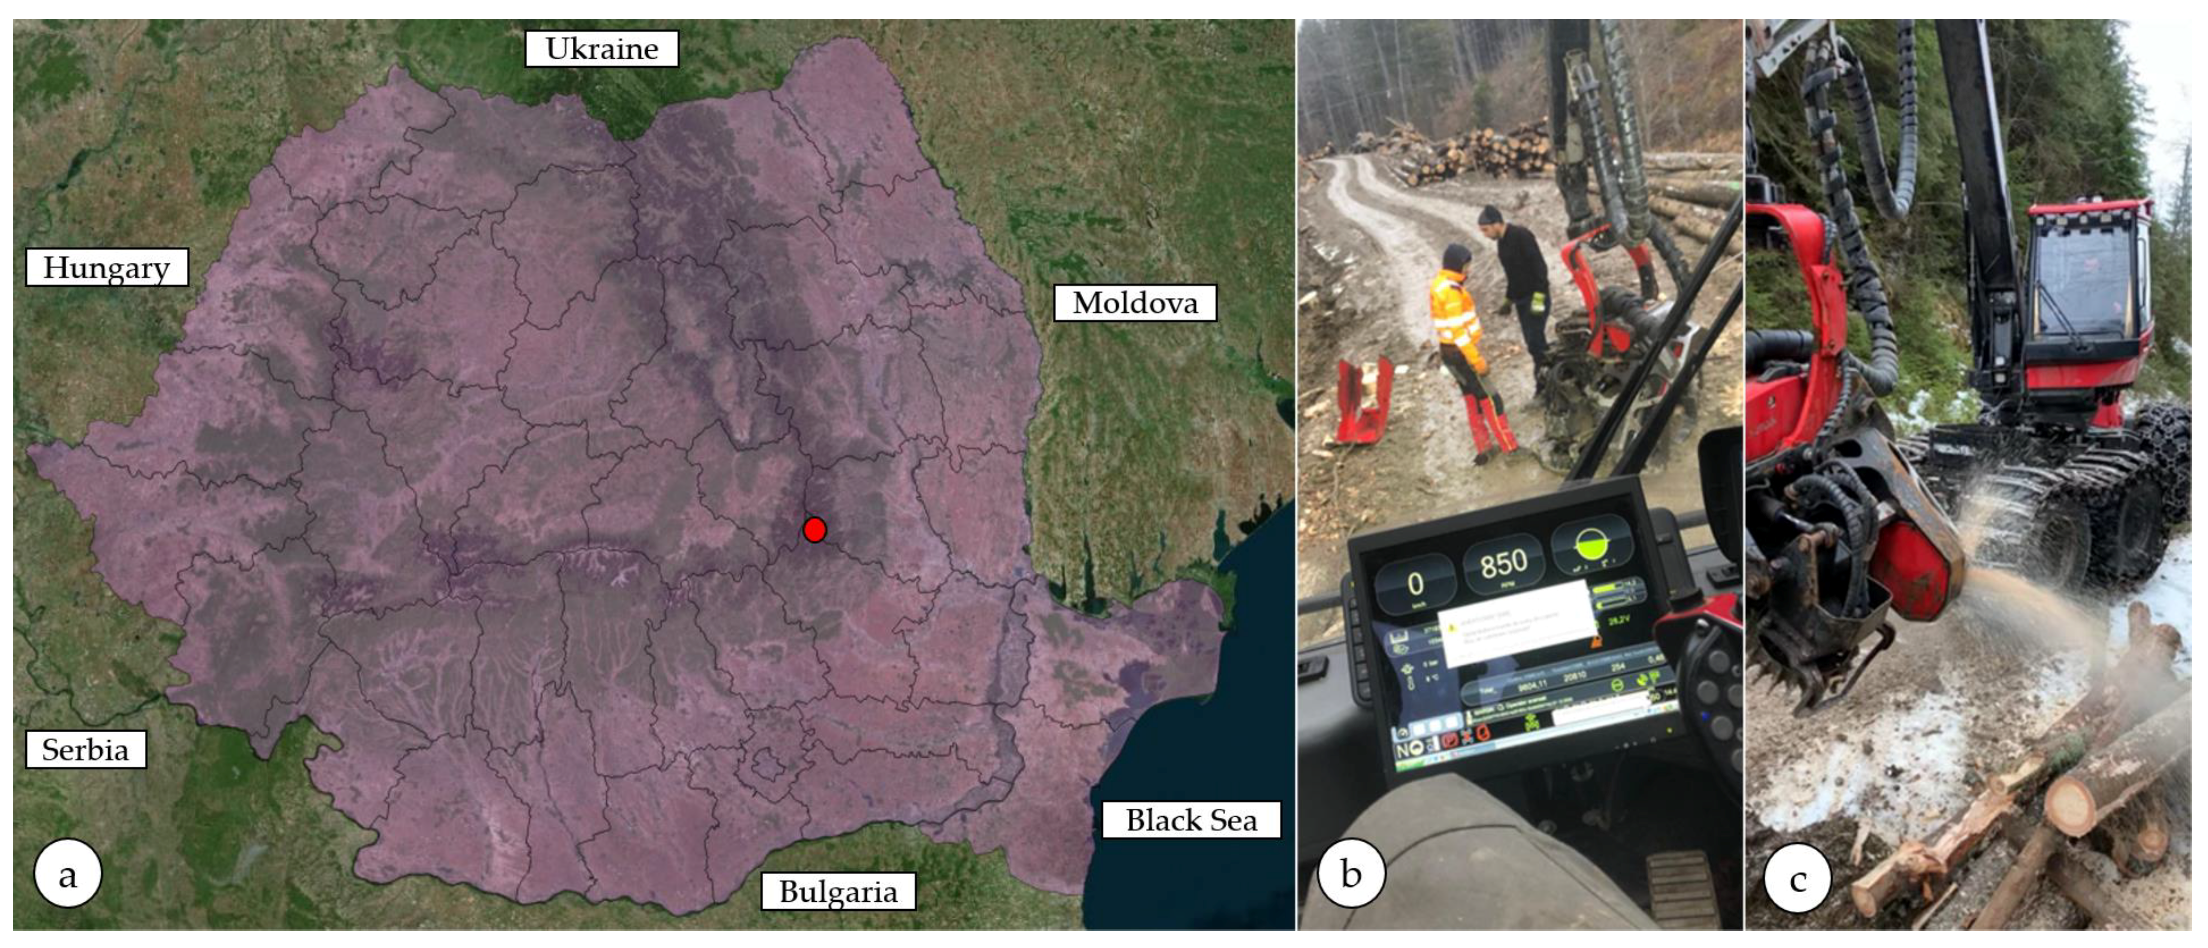
An area located between 45°42′38.64″ N–26°25′59.52″ E and 45°41′91.92″ N–26°27′26.04″ E was selected as the study location. In this area, the data were collected at the landings located near two forest roads, along which delimbed stems and stem parts (hereafter stems) were bunched following their extraction by cable skidders (
Figure 1). The forests in the area span over several altitudinal ranges, which include those of pure Norway spruce and mixed forests.
In total, 27 large bunches were considered in this study; they contained approximately 19% beech and ca. 81% coniferous stems, with the latter dominated by Norway spruce. The study covered three operational days, namely the 2, 3 and 9th of December 2021.
2.2. Machine Description and Work Organization
A Komatsu 931.1 harvester was used to process the stems at the landing (
Figure 1). The machine was equipped with a 74 AWF engine featuring six cylinders and a nominal power of 185 kW; the length of the crane was 10 m, and it was equipped with a C144 processor head weighing 1410 kg and featuring a maximum aperture of 75 cm. The feeding speed was 0.5 m/s, and the sawing blade had a length of 90 cm. The machine had a fuel tank of 300 L.
The experimental design of this study was guided by the concepts and procedural implementations of forest productivity studies as described in [
19,
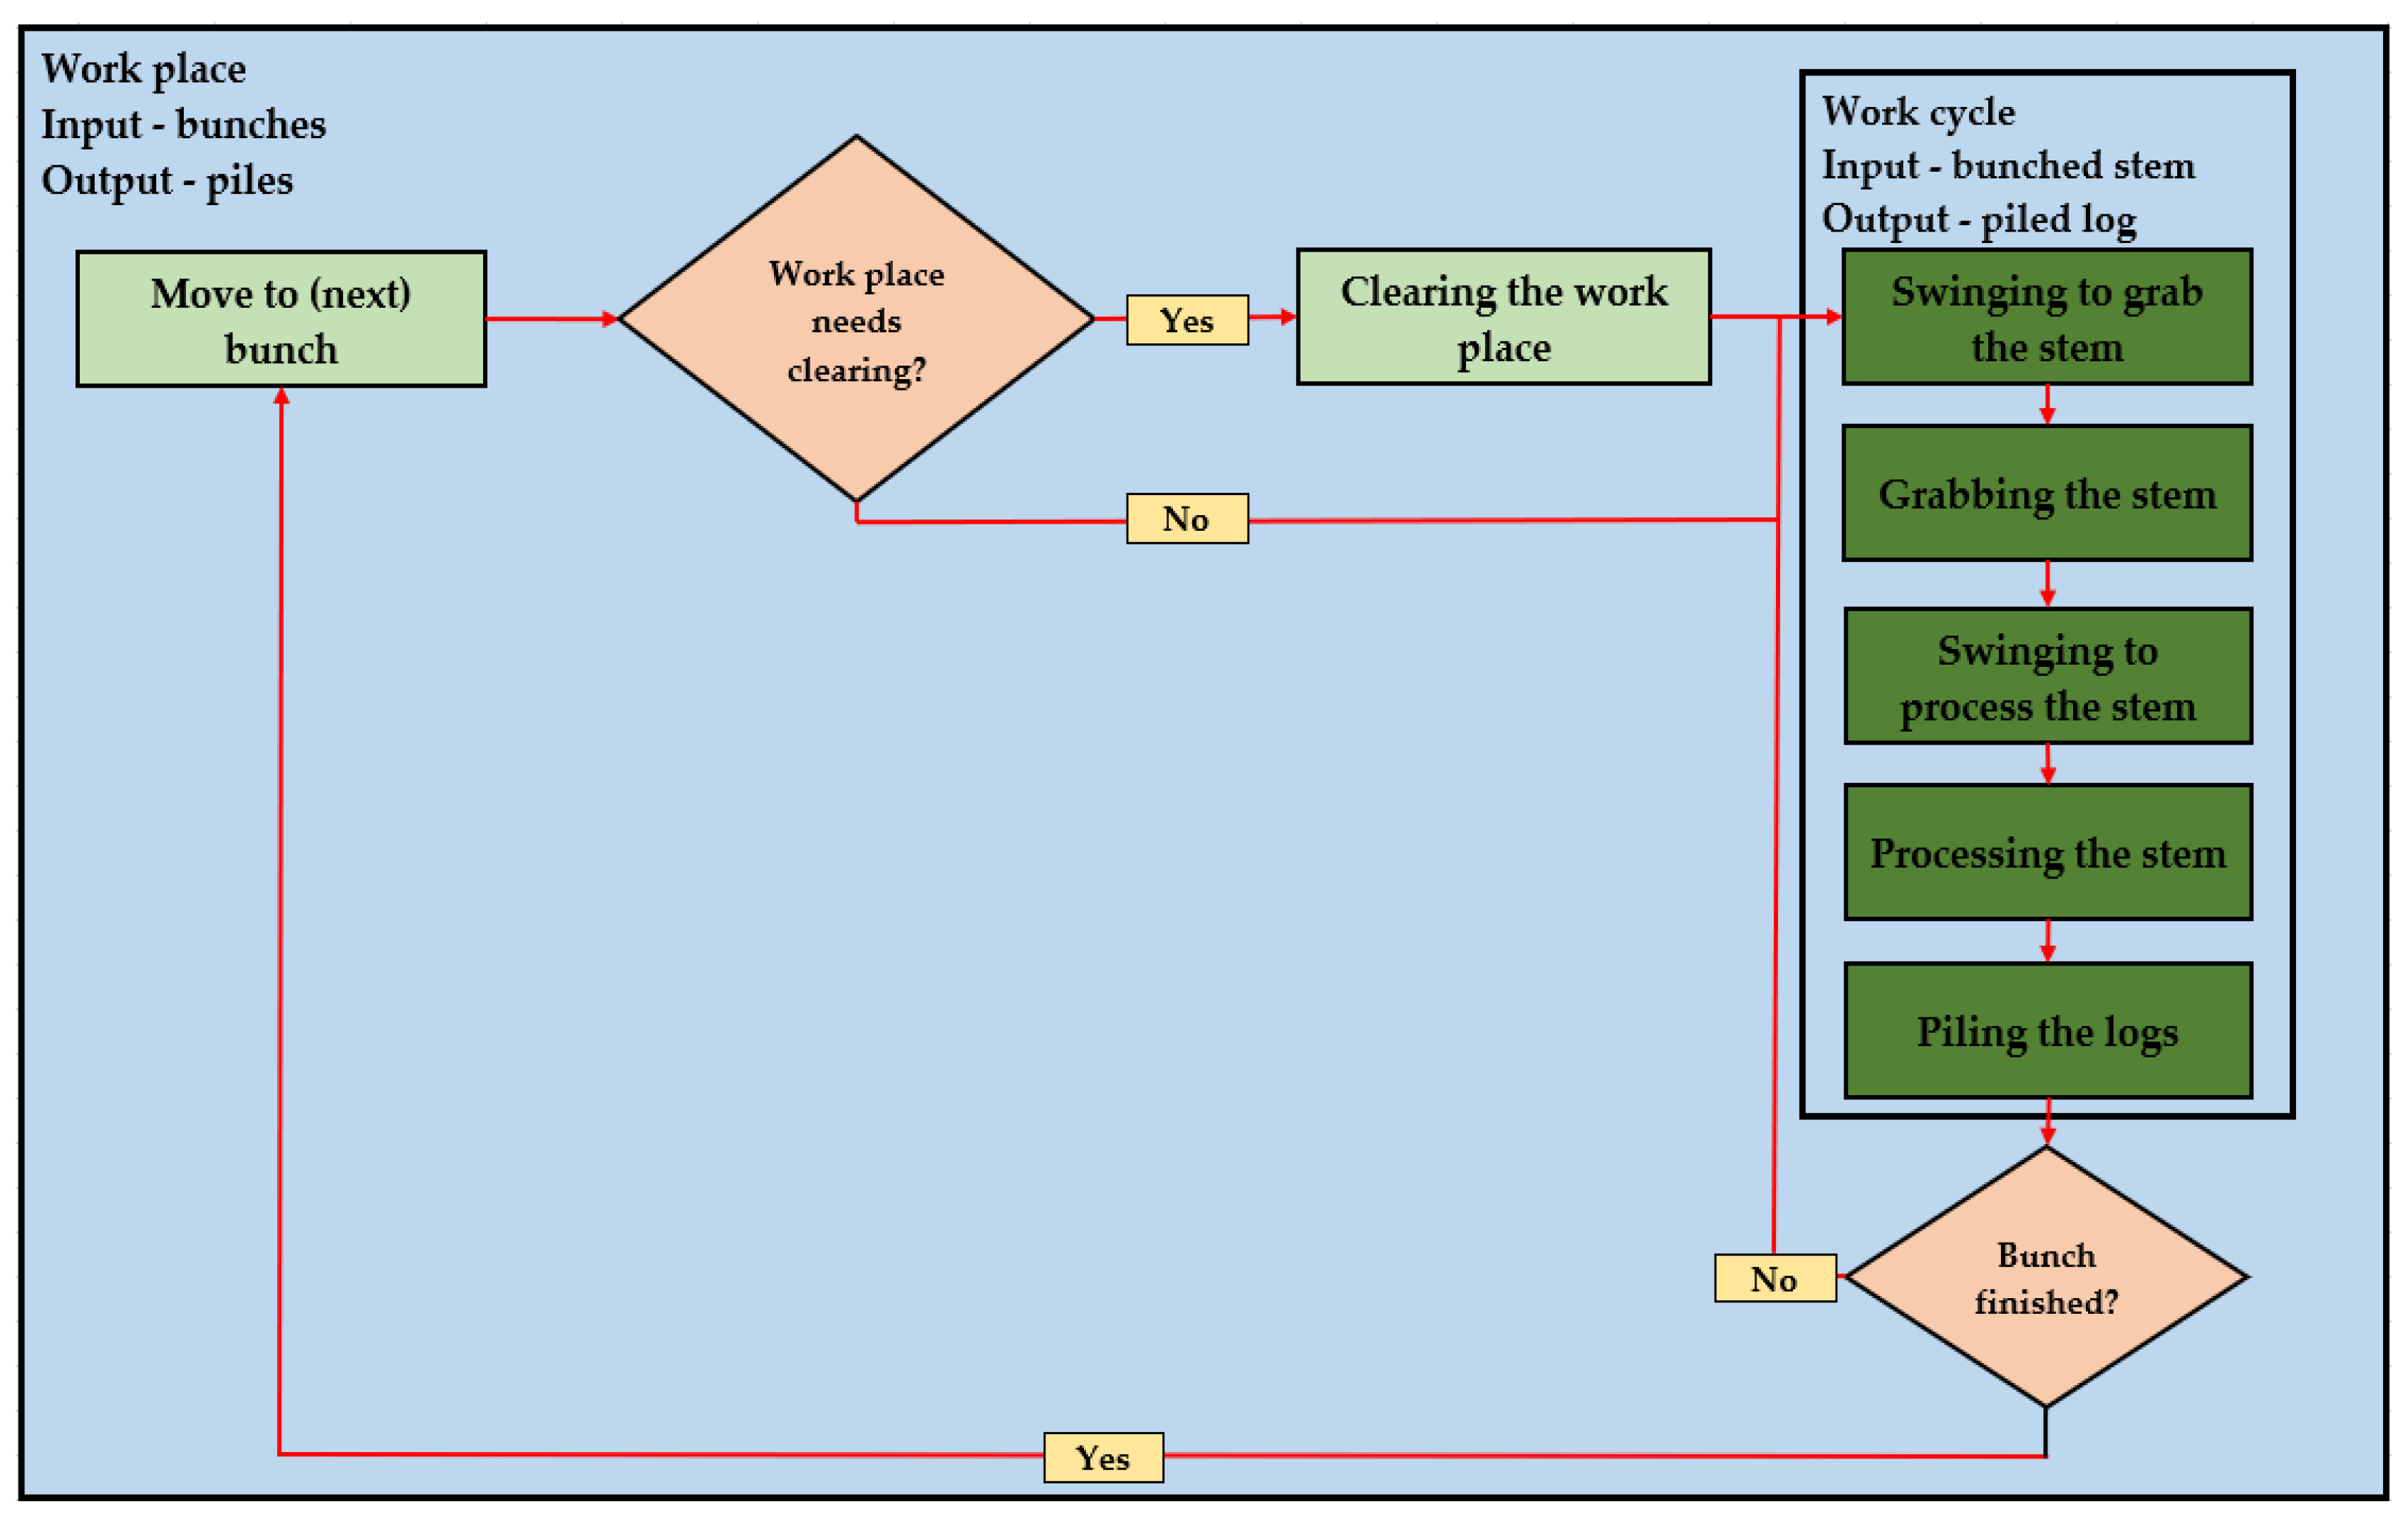
20]. The observed work was divided into productive and supportive events, as shown in
Figure 2. Acknowledging other concepts and terminology used to describe the work elements as specific to harvesters [
21], the process steps observed in this study were named as follows: swinging to grab the stem, grabbing the stem, swinging to process the stem, processing the stems, and piling the processed logs. These steps were considered the typical elements of a work cycle, and the time consumed during these events was considered the productive time. The inputs to a work cycle were the delimbed stems from a given bunch. Moving to and between bunches of stems, as well as clearing the workplace when needed, were considered supportive events. Accordingly, the time consumed during these events was external to a work cycle, and it was described as supportive time.
Moving to or between bunches of stems consisted of driving the machine to reach the processing place. Based on GPS data collected in the field (see
Section 2.3), such events were found to run at speeds of up to 5 km/h. In some cases, it was required to remove obstacles from the road or to make space for stem processing and log piling, events that were accounted for separately at the workplace level. At the work cycle level, swinging to grab the stem accounted for the machine’s crane movement from a current position to that required to grab the stem from a bunch. Grabbing the stem covered all the movements required to take it from a bunch, swinging to process the stem included the crane’s movement with the stem to a place at which processing was carried out, and processing the stem included the events carried by the processor’s head mainly to buck the stem into logs. Piling the logs included the arm’s movements over the piles of logs to place the processed logs into the right pile, as well as some work to arrange the piles. A work cycle was configured around each of the processed stems. Once a bunch was completed, the machine moved to the next one, and the steps described above were repeated.
The bunches taken into study were formed from stems placed so that their length was parallel to the road centerline and grouped in 2 to 6 rows.
Table A1 (
Appendix A Section) gives an overview of the dimensional characteristics of the stems and bunches. The division of time consumption on events was carried out in the office phase of the study (see
Section 2.4), and it was used to describe the work organization, as shown in
Figure 2. In addition to the events described in
Figure 2, there were other events that were observed to be related to the implementation of the study and the work carried out. These included the measurements required by the study (see
Section 2.3) and delays related to the work, which were accounted for separately and excluded from the detailed statistical analysis.
2.3. Data Collection
The machine movements to or between the bunches were documented by a Global Positioning System (GPS) handheld unit, which was placed on its cab. For each bunch, the stems were manually measured with a caliper and tape to obtain their lengths and diameters. The diameters were sampled starting from one end at an interval of 0.5 m until reaching the second end of a stem. When there was a remaining length of less than exactly 0.5 m at the second end, this length was measured and noted on a filed book. For each stem, a set of diameters, lengths, and species were noted in the field, and following their processing, the resulting logs were measured by a similar procedure. Then, the data describing the logs were linked in the field book to the corresponding stem. Data on diameters were collected to the nearest centimeter, and data on lengths were collected to the nearest decimeter.
Time consumption was evaluated by video recording as a measure of being able to track back eventual issues and clean the data [
22]. A GoPro Hero 10 (GoPro Inc., San Mateo, CA, US) video camera was used to continuously collect media files during the observation. It was placed near the first bunch, then successively moved from one bunch to another to capture the events which occurred during the operations in its field of view. To extend the battery’s life, the camera was continuously fed by an external power source, and the collected data were initially stored in the internal memory; at the end of each day of observation, the data were downloaded and stored in a computer by considering the chronological order of the observed events.
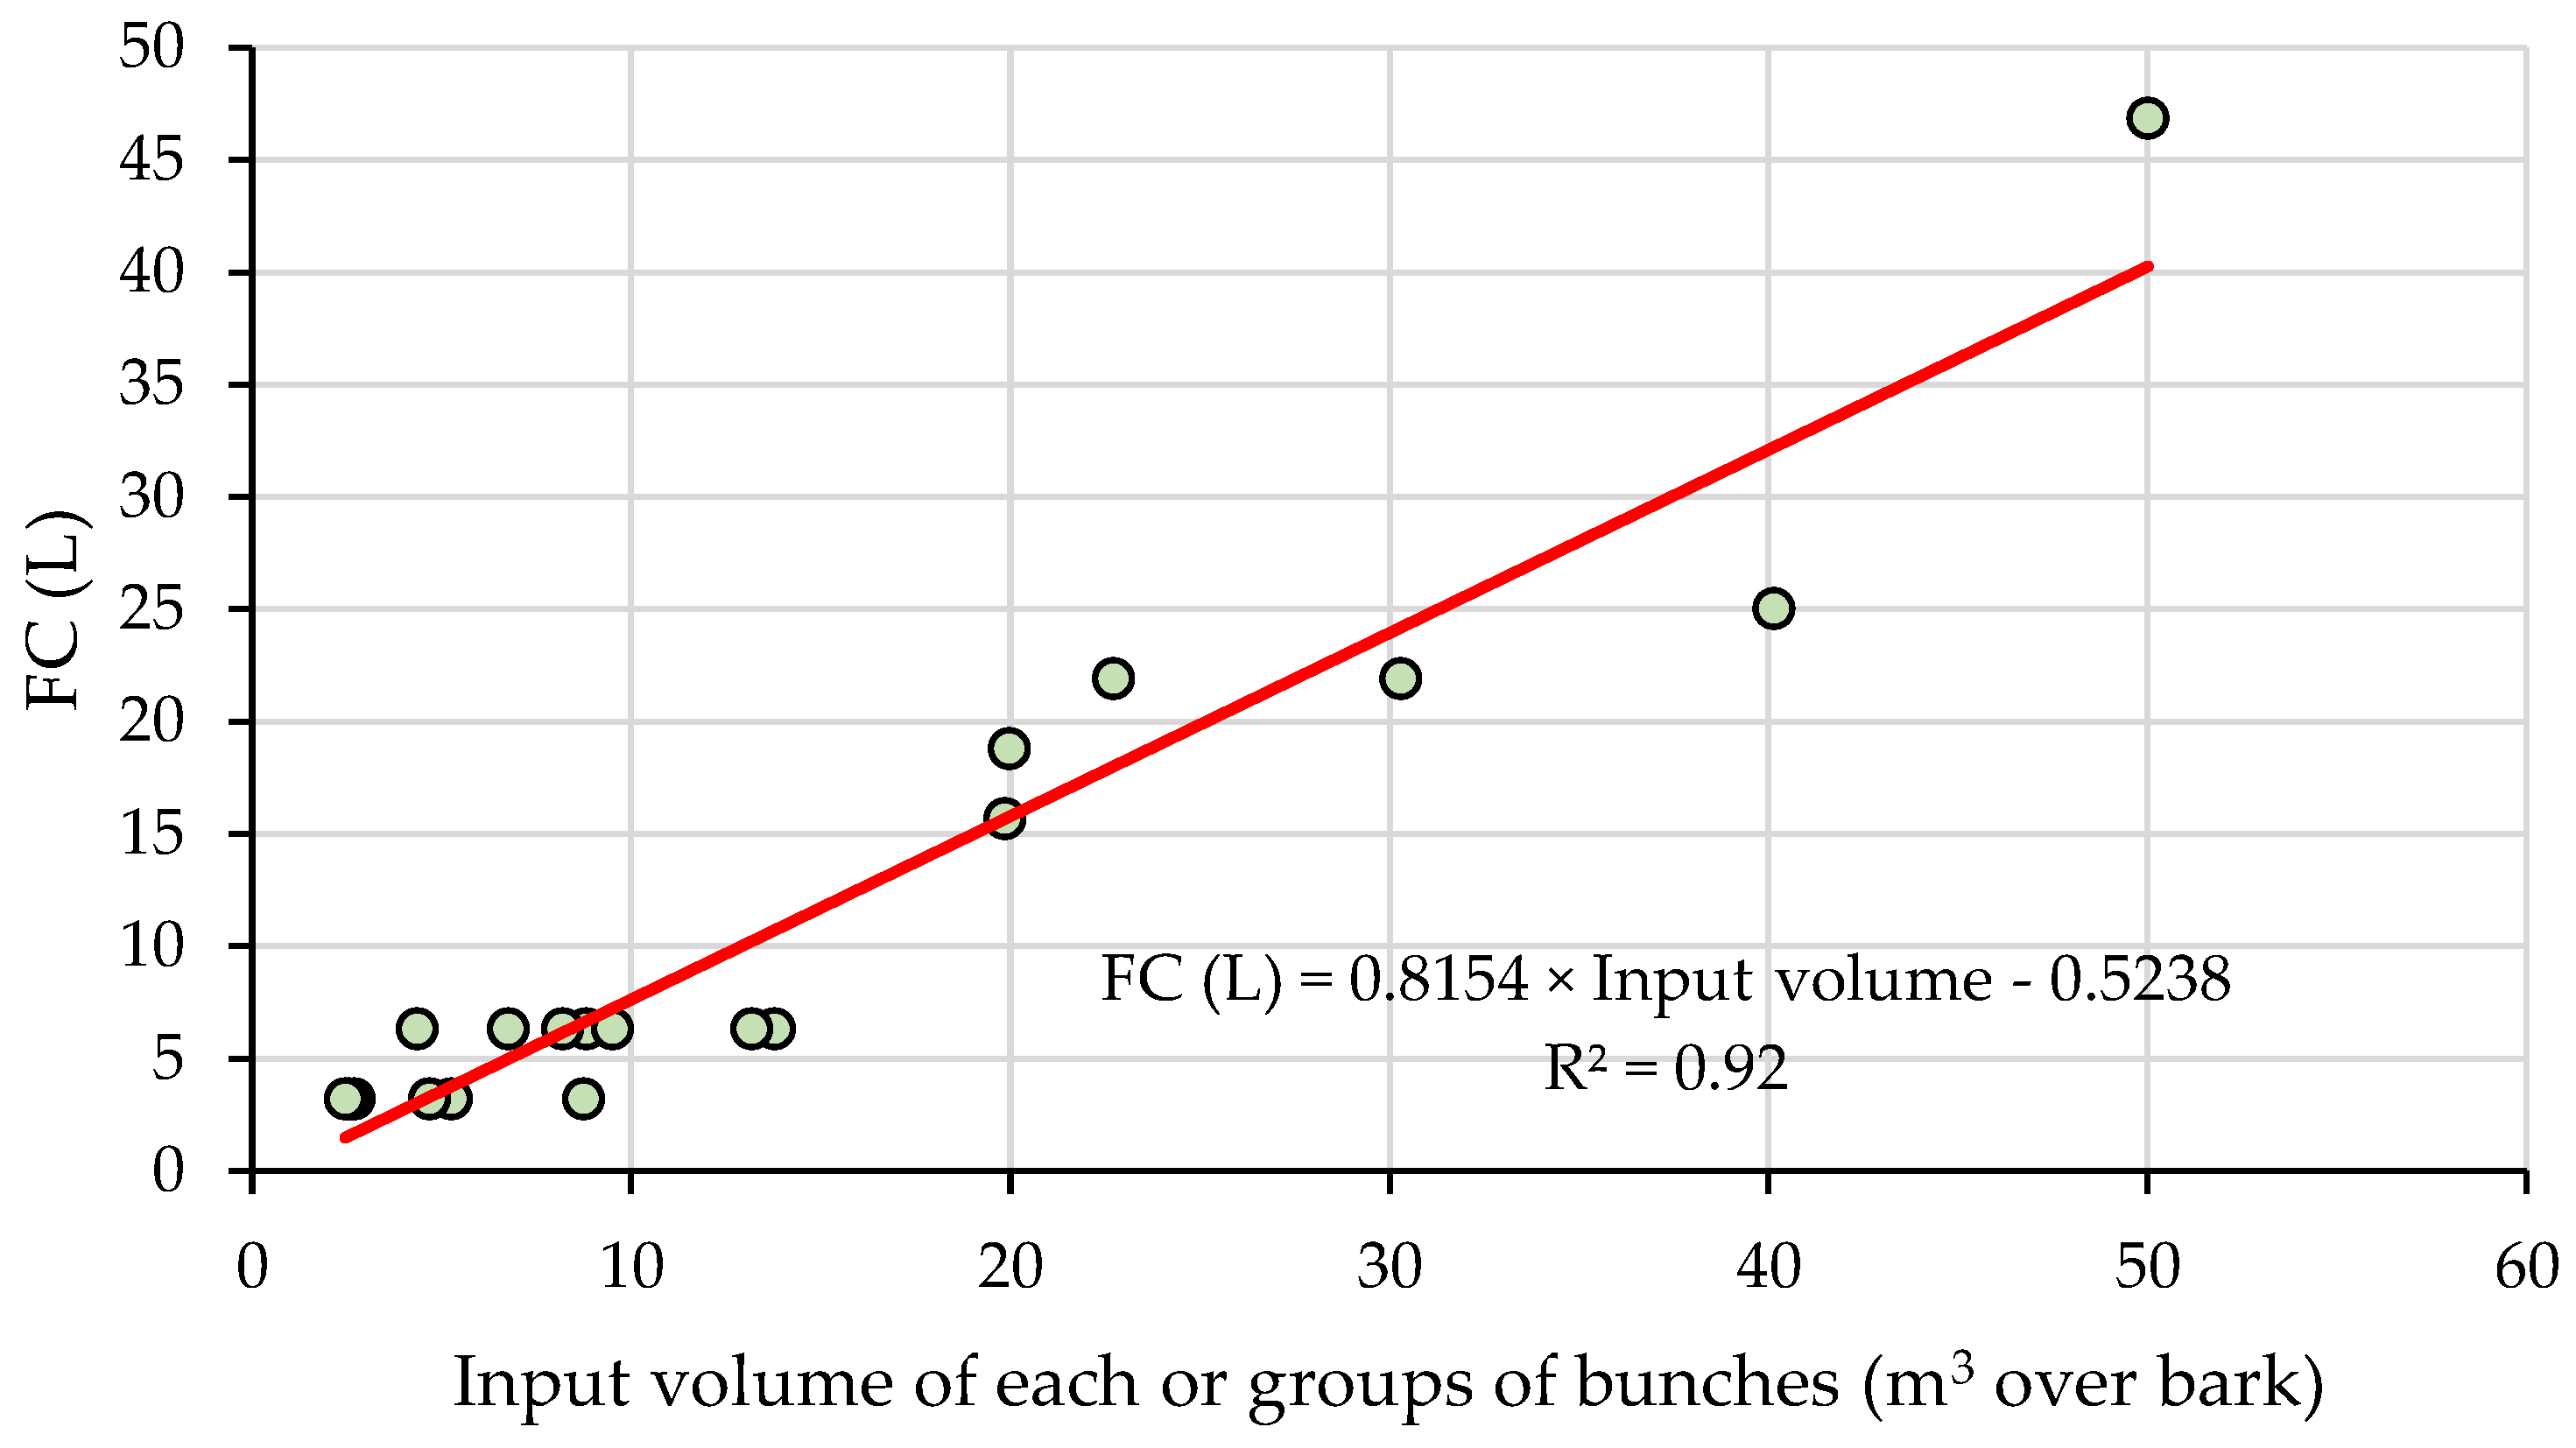
Fuel consumption was evaluated based on the readings taken from the machine’s computer. The fuel level was read in percent of the full tank after completing the processing work on each or groups of the 27 bunches, and the readings were added so as to compute the fuel consumption at the study level. However, to balance the accuracy of readings against the real fuel consumption, the refilling to full method, e.g., [
23,
24,
25], was used to collect fuel consumption data for a number of 15 processed bunches or bunch groups. Graded polymer recipients were used to refill the tank, and the fuel consumption was measured to the nearest 100 milliliters, following procedures that were similar to [
24,
25].
2.4. Data Processing and Statistical Analysis
The volume of each stem (hereafter input volume, m
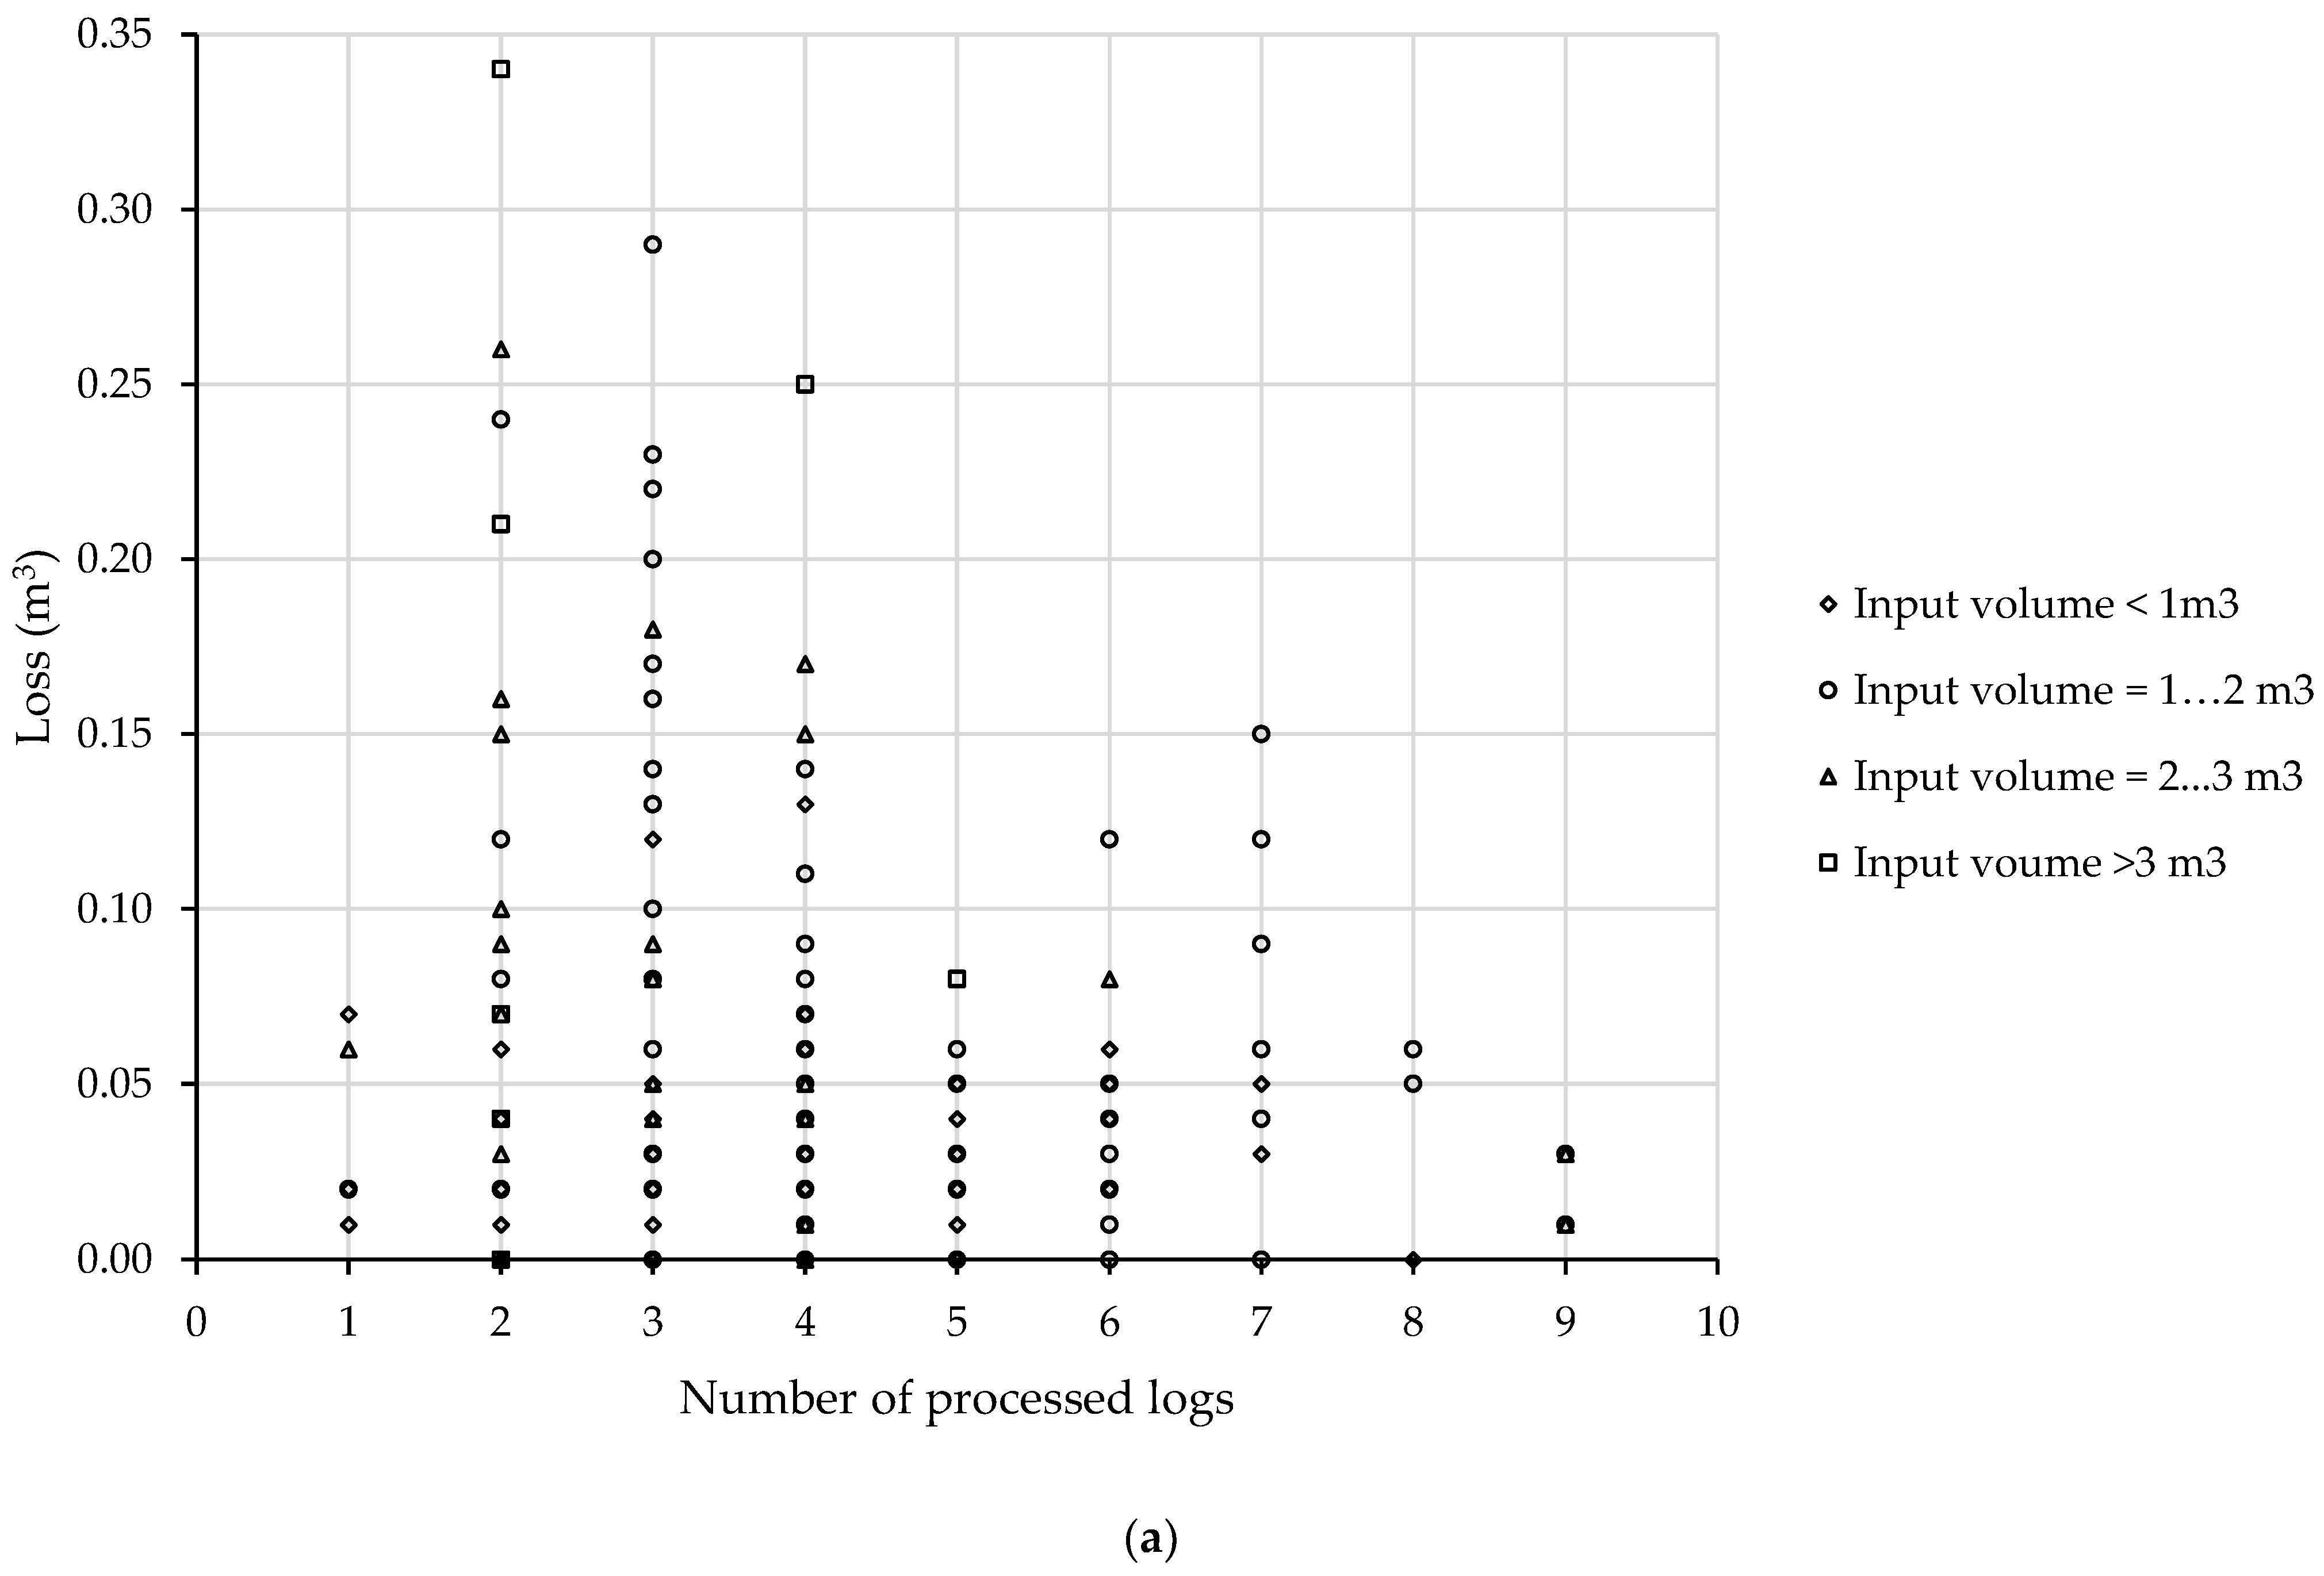
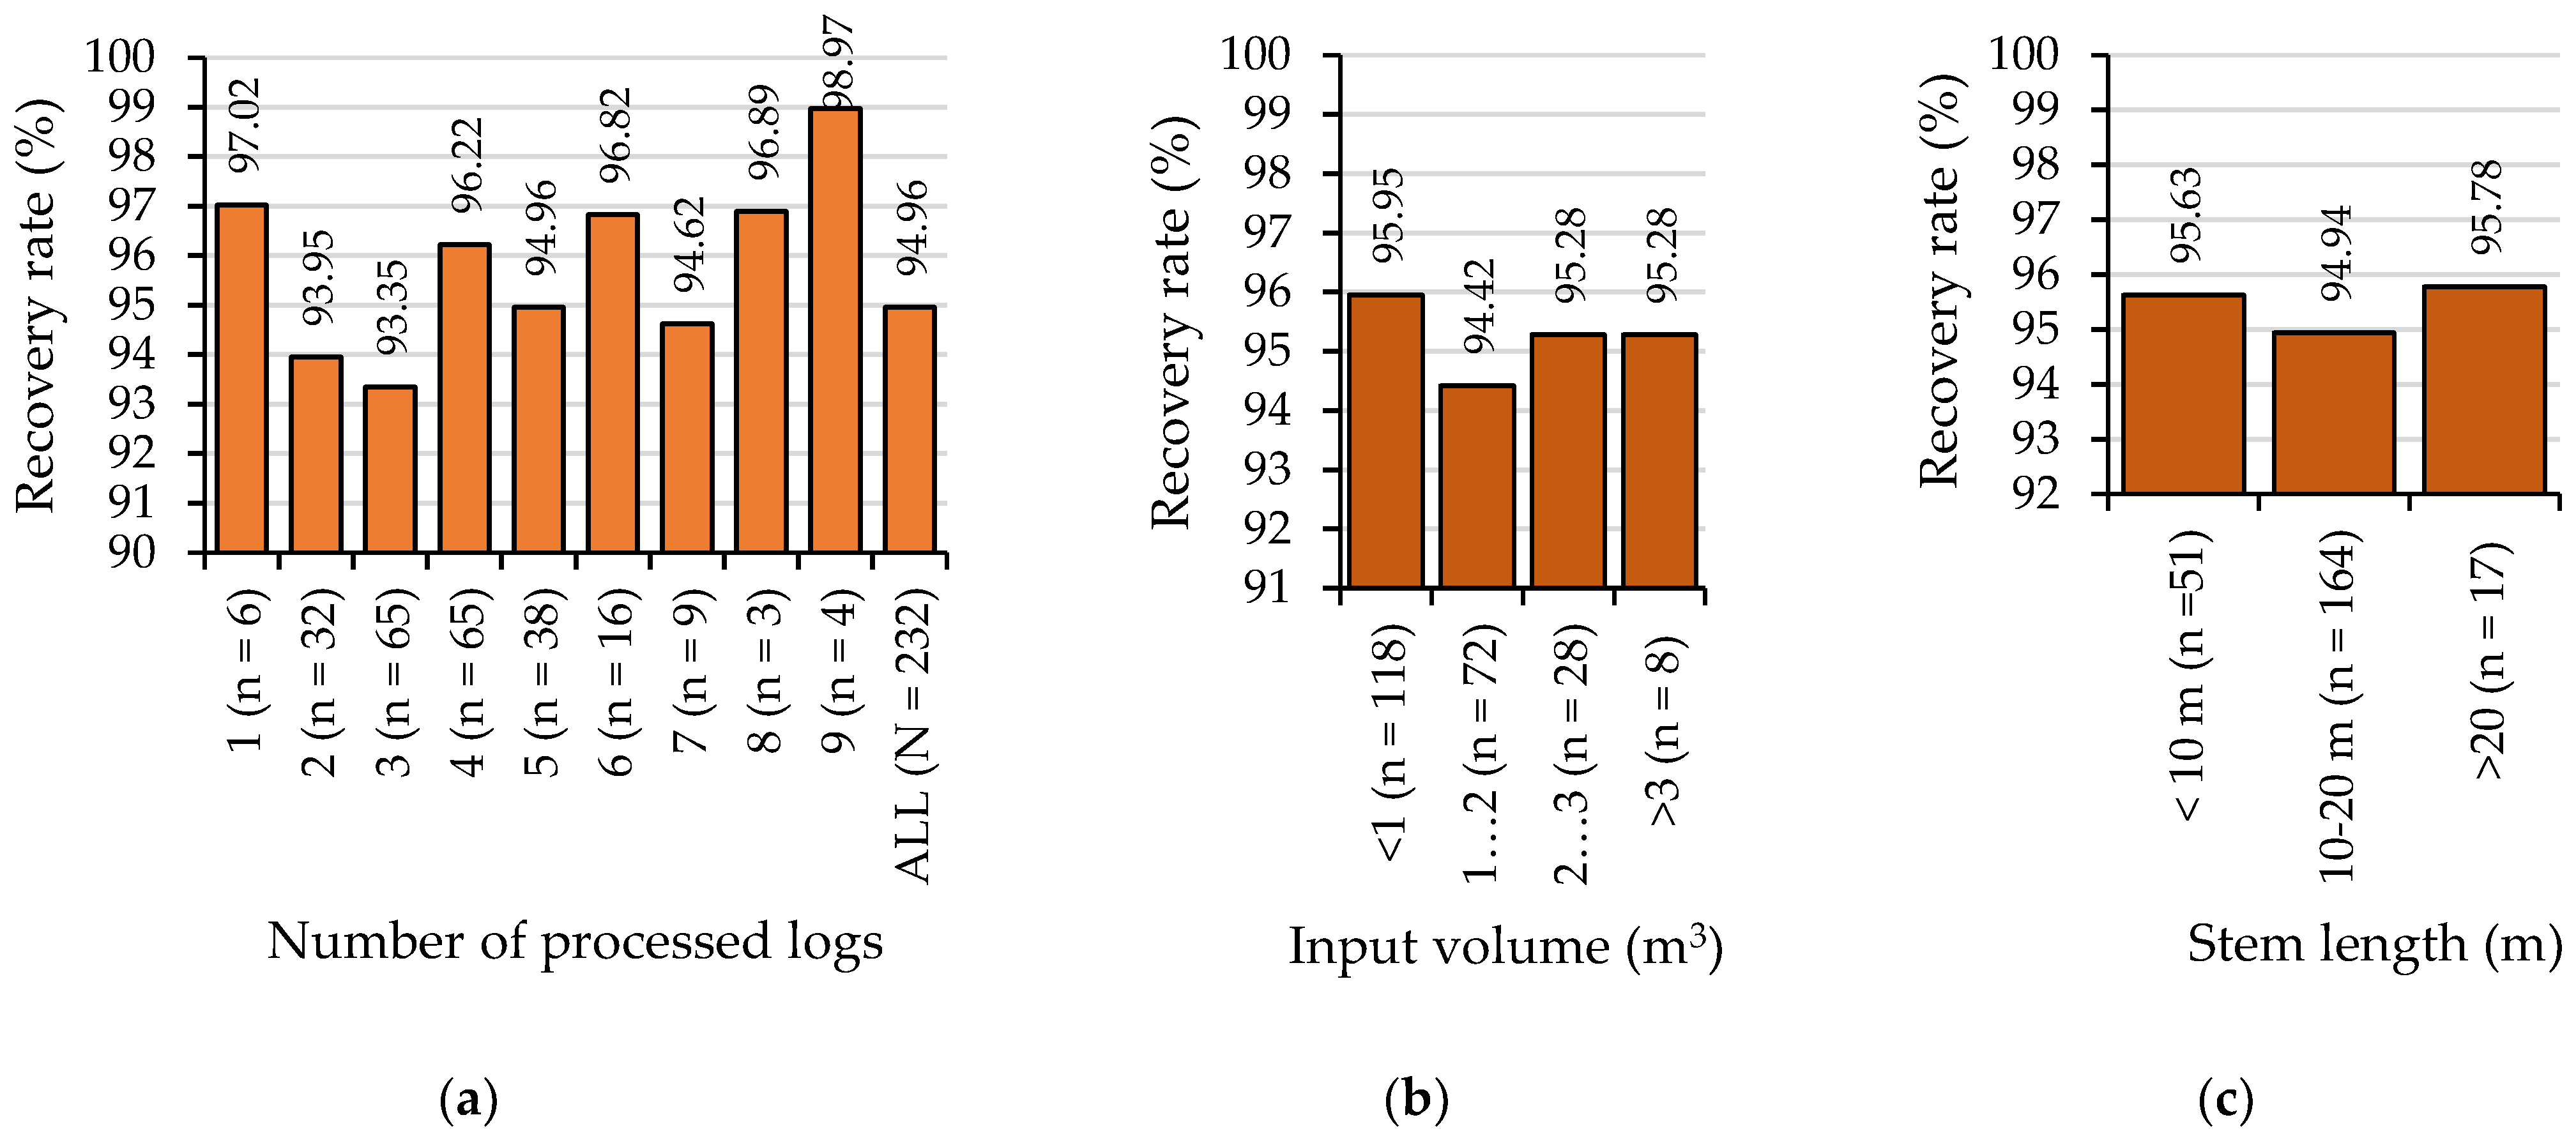
3 over bark) was estimated by using Smalian’s formula, which was applied to each half-meter segment, as well as to those end segments that were less than 0.5 m in length. As such, the input volume was the sum of the volumes of segments making a stem. A similar procedure was used to estimate the volume of each processed log. For each work cycle, the ratio of output to input volume was used to characterize the recovery rate (hereafter recovery rate, %). Given the measurement methods used, there were cases in which the output volume was slightly larger than the input volume. In such cases (20% of the data), the output volume was assumed to be equal to the input volume. The recovery rate was estimated following the stratification of data into categories that considered the stem length, input volume and the number of recovered logs, for which the average values were reported. The overall recovery rate was estimated as the mean value computed over the sample data, and attempts were taken to model it as a function of the input volume, stem length, and number of processed logs. Least squares ordinary multiple linear regression techniques were used for this step, assuming a confidence threshold set at 95% (α = 0.05,
p < 0.05) and having as inputs the results of normality (Shapiro–Wilk and D’Agostino–Pearson) tests [
26,
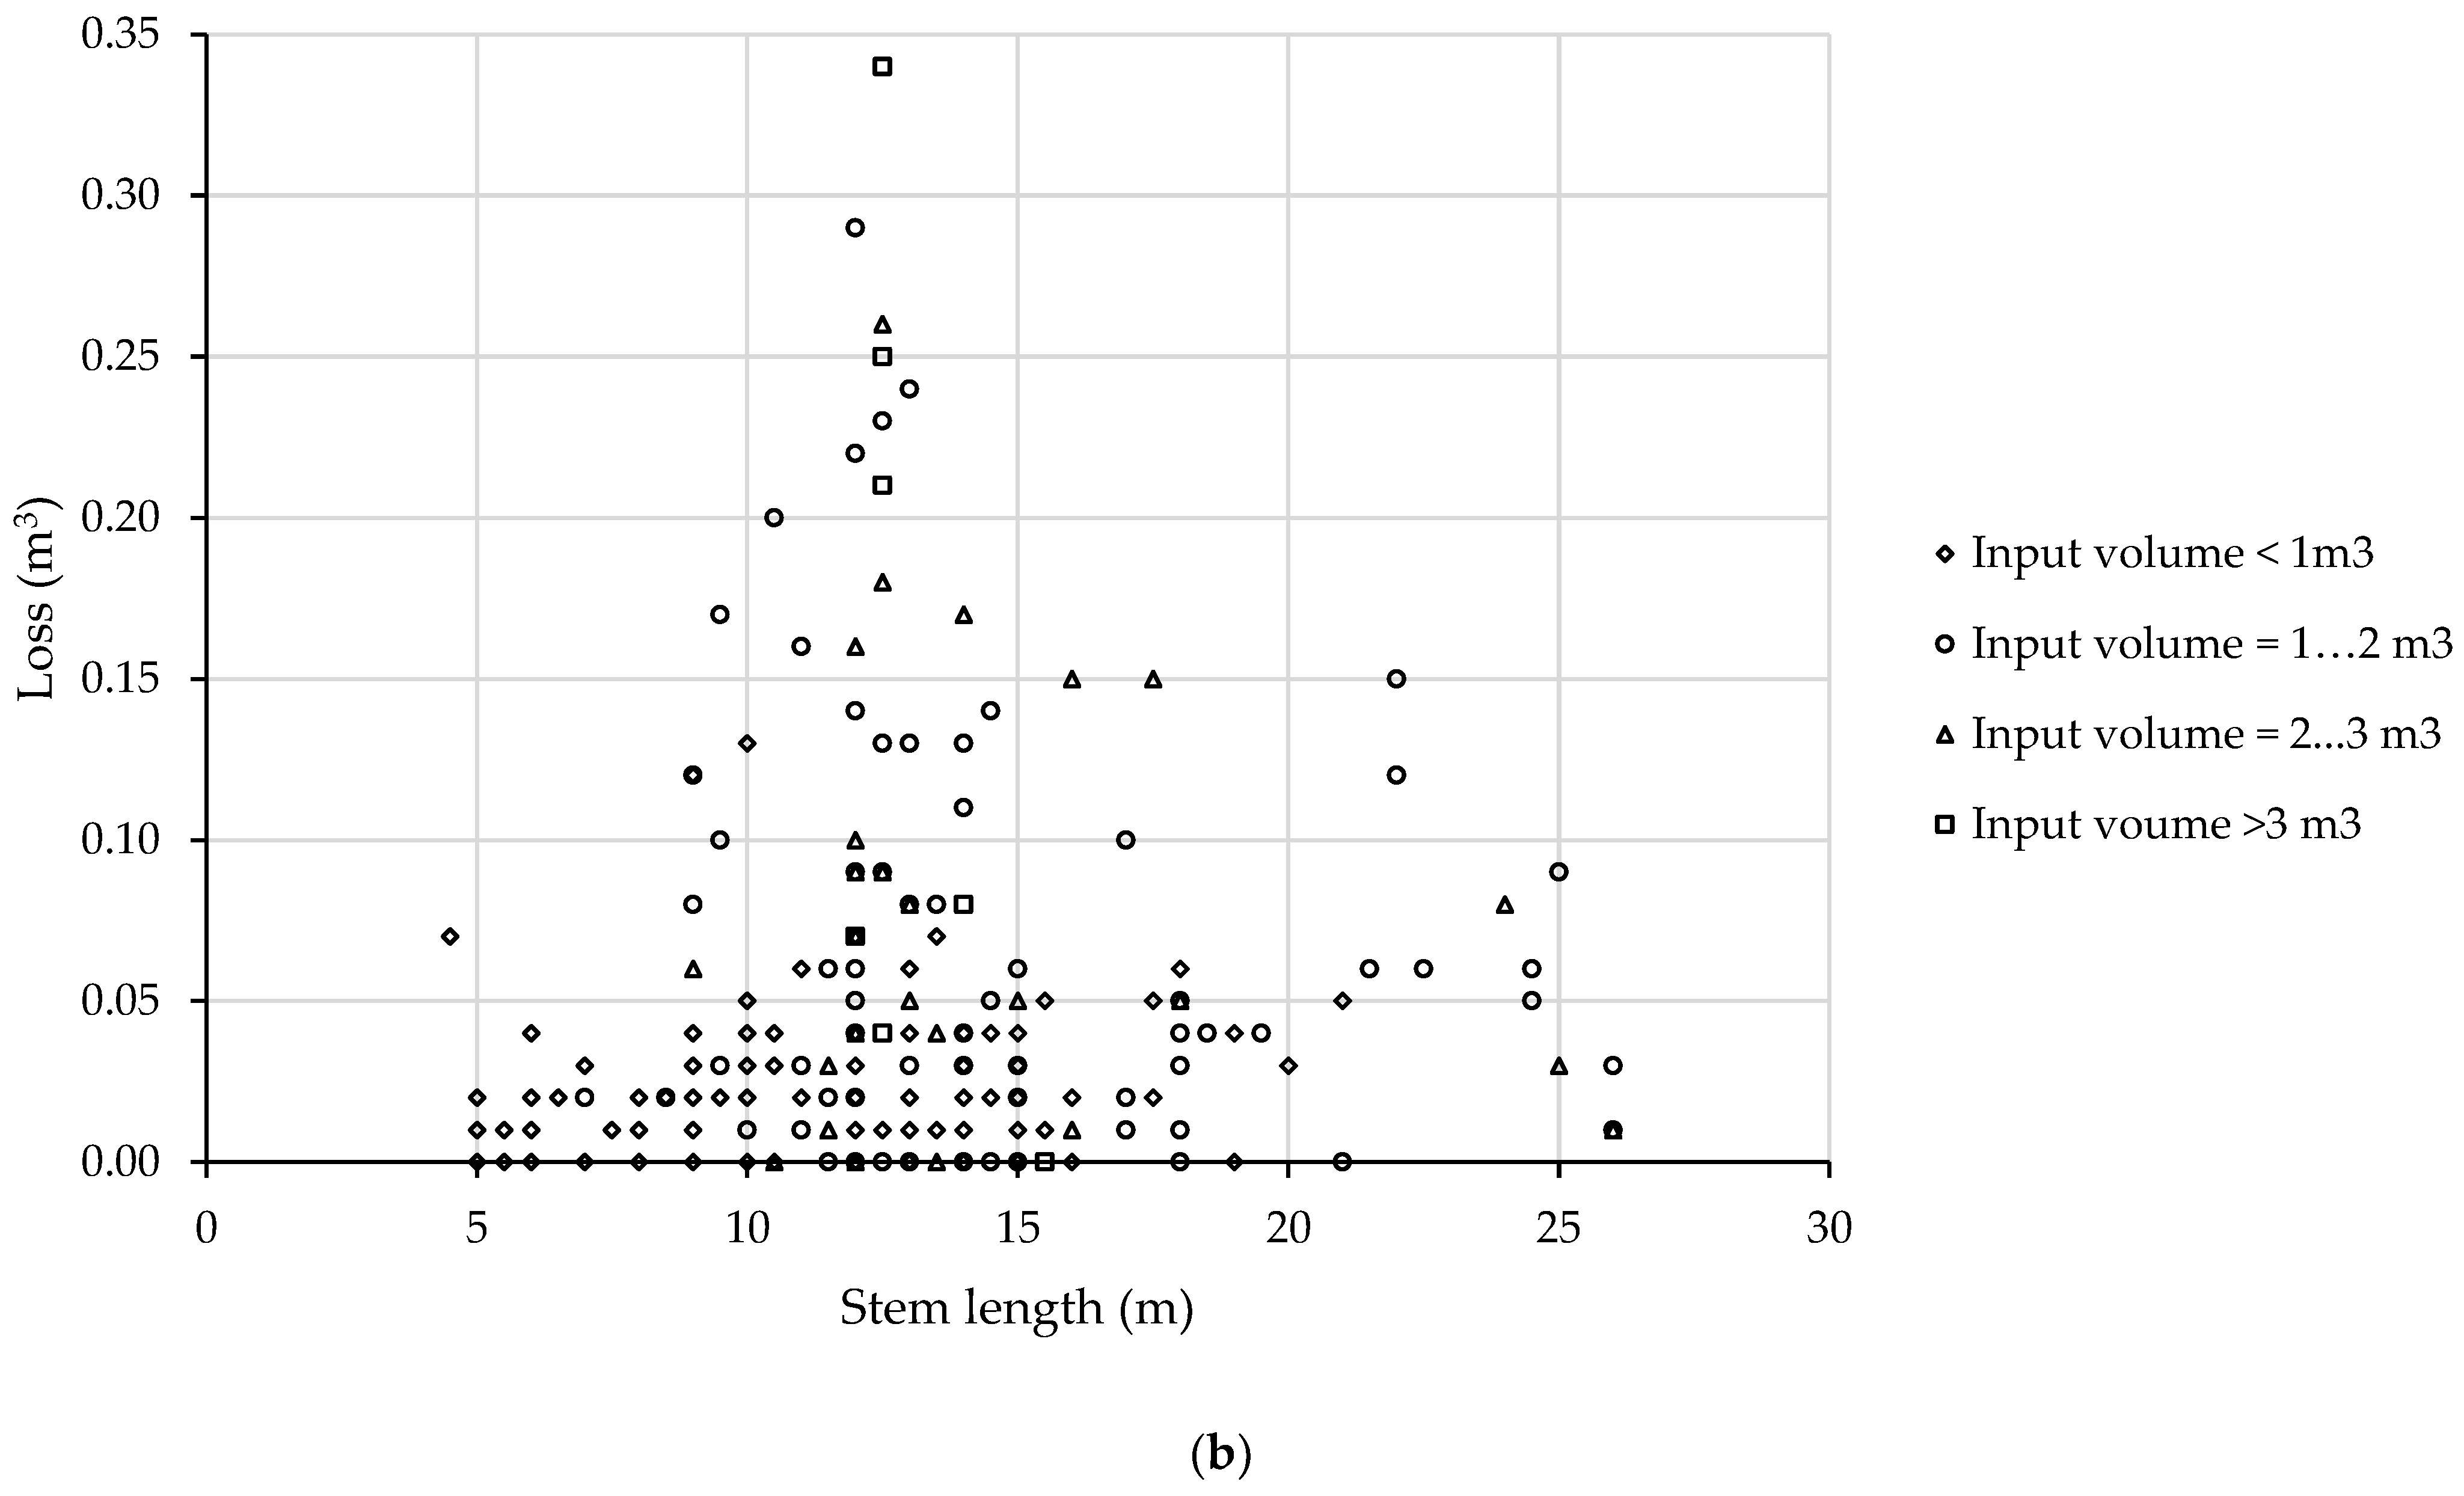
27], which were complemented by graphically fitting the experimental data against the expected normal data, and multicollinearity checking (correlation analysis, where a threshold of R = ±0.5 was assumed as a criterion of excluding a given variable from a pair, also based on logical reasons). Bar plots were used to show the effect of the input volume, stem length, and number of processed logs on the recovery rate, and the losses (hereafter loss, m
3 over bark) were described against the same variables as scatter plots.
Elemental time consumption was extracted for each event, and it was accounted for in seconds. In addition to the elements shown in
Figure 2, time consumption categories such as the delays caused by the study (measurement of stems and logs, placement of the camera, and measurement of fuel) and delays related to the work (meal time, breakdown, personal time) were identified and separated from the productive time. Following this step, the time structure included the following categories:
- -
Total observed time (hereafter TOT, seconds), as the total time observed in the field, which included:
- ∘
Delays caused by study (hereafter SCD, seconds), which mainly included the time spent for measurement;
- ∘
Total study time (hereafter TST, seconds), which included the following categories:
- ■
Delays related to work (hereafter WCD, seconds);
- ■
Supportive time (hereafter ST, seconds), which included machine movements and clearing the workplace;
- ■
Productive time (hereafter PT, seconds) or the work cycle time (hereafter WCT, seconds), which included the time consumed during the repetitive elements:
Swinging to grab the stem (hereafter sgt, seconds);
Grabbing the stem (hereafter grt, seconds);
Swinging to process the stem (hereafter spt, seconds);
Processing the stem (hereafter prt, seconds);
Pilling time (hereafter pit, seconds).
At an aggregate, descriptive level, the quantities of the time categories mentioned above were converted into hours and shares within their main categories. Statistical descriptors were also used to characterize the sample at the work cycle level. Minimum, maximum, mean, median and standard deviation values were used as descriptive statistics based on the recommendations of relevant guidelines [
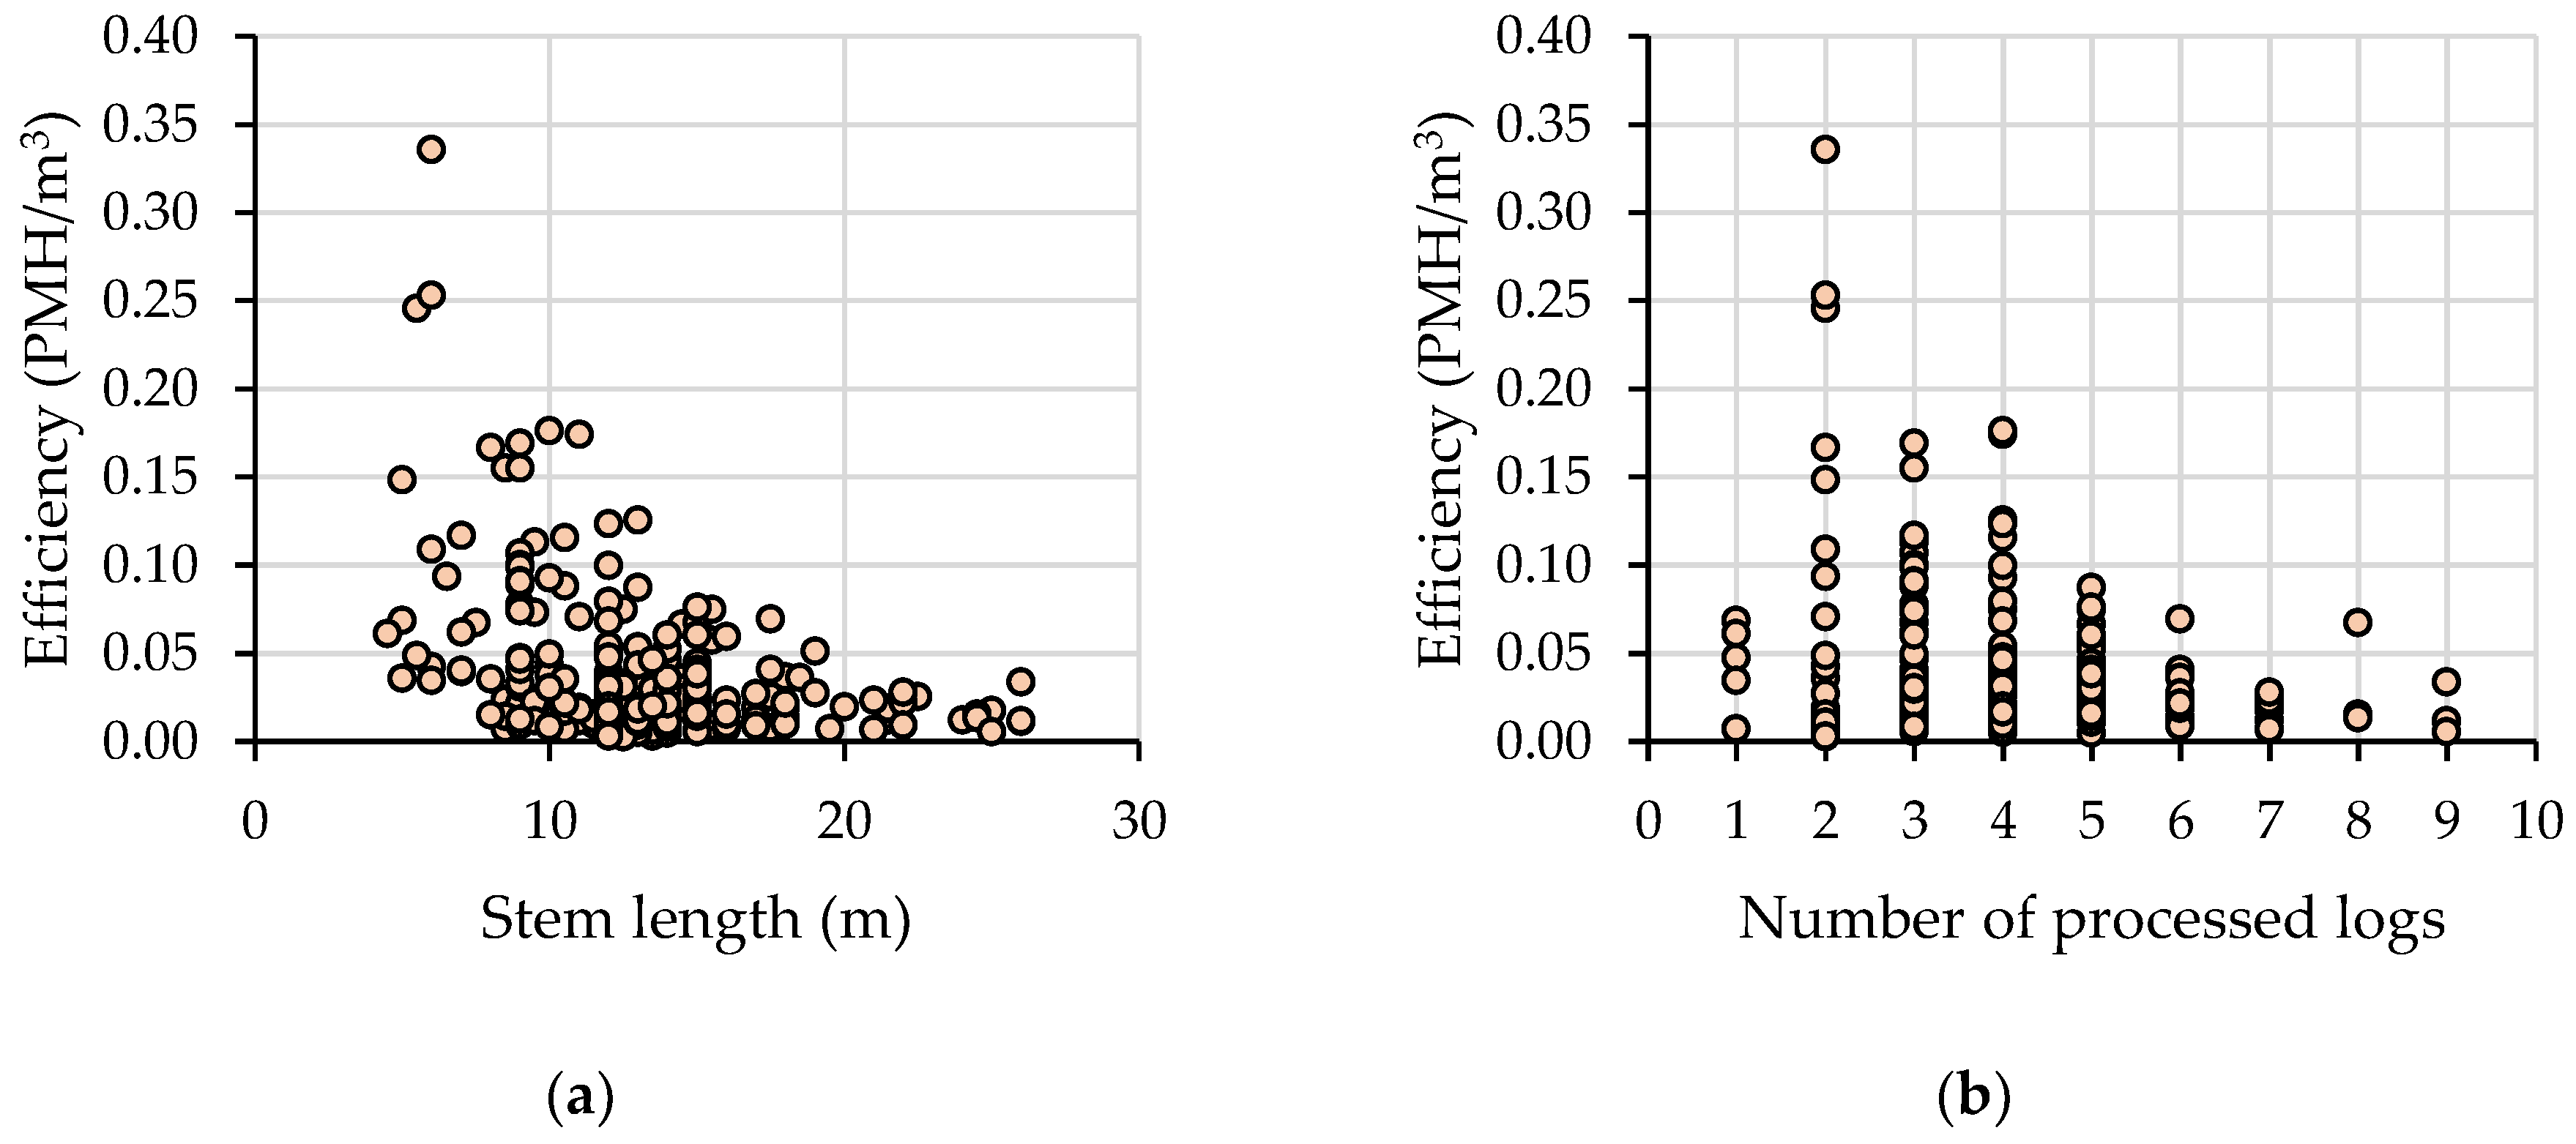
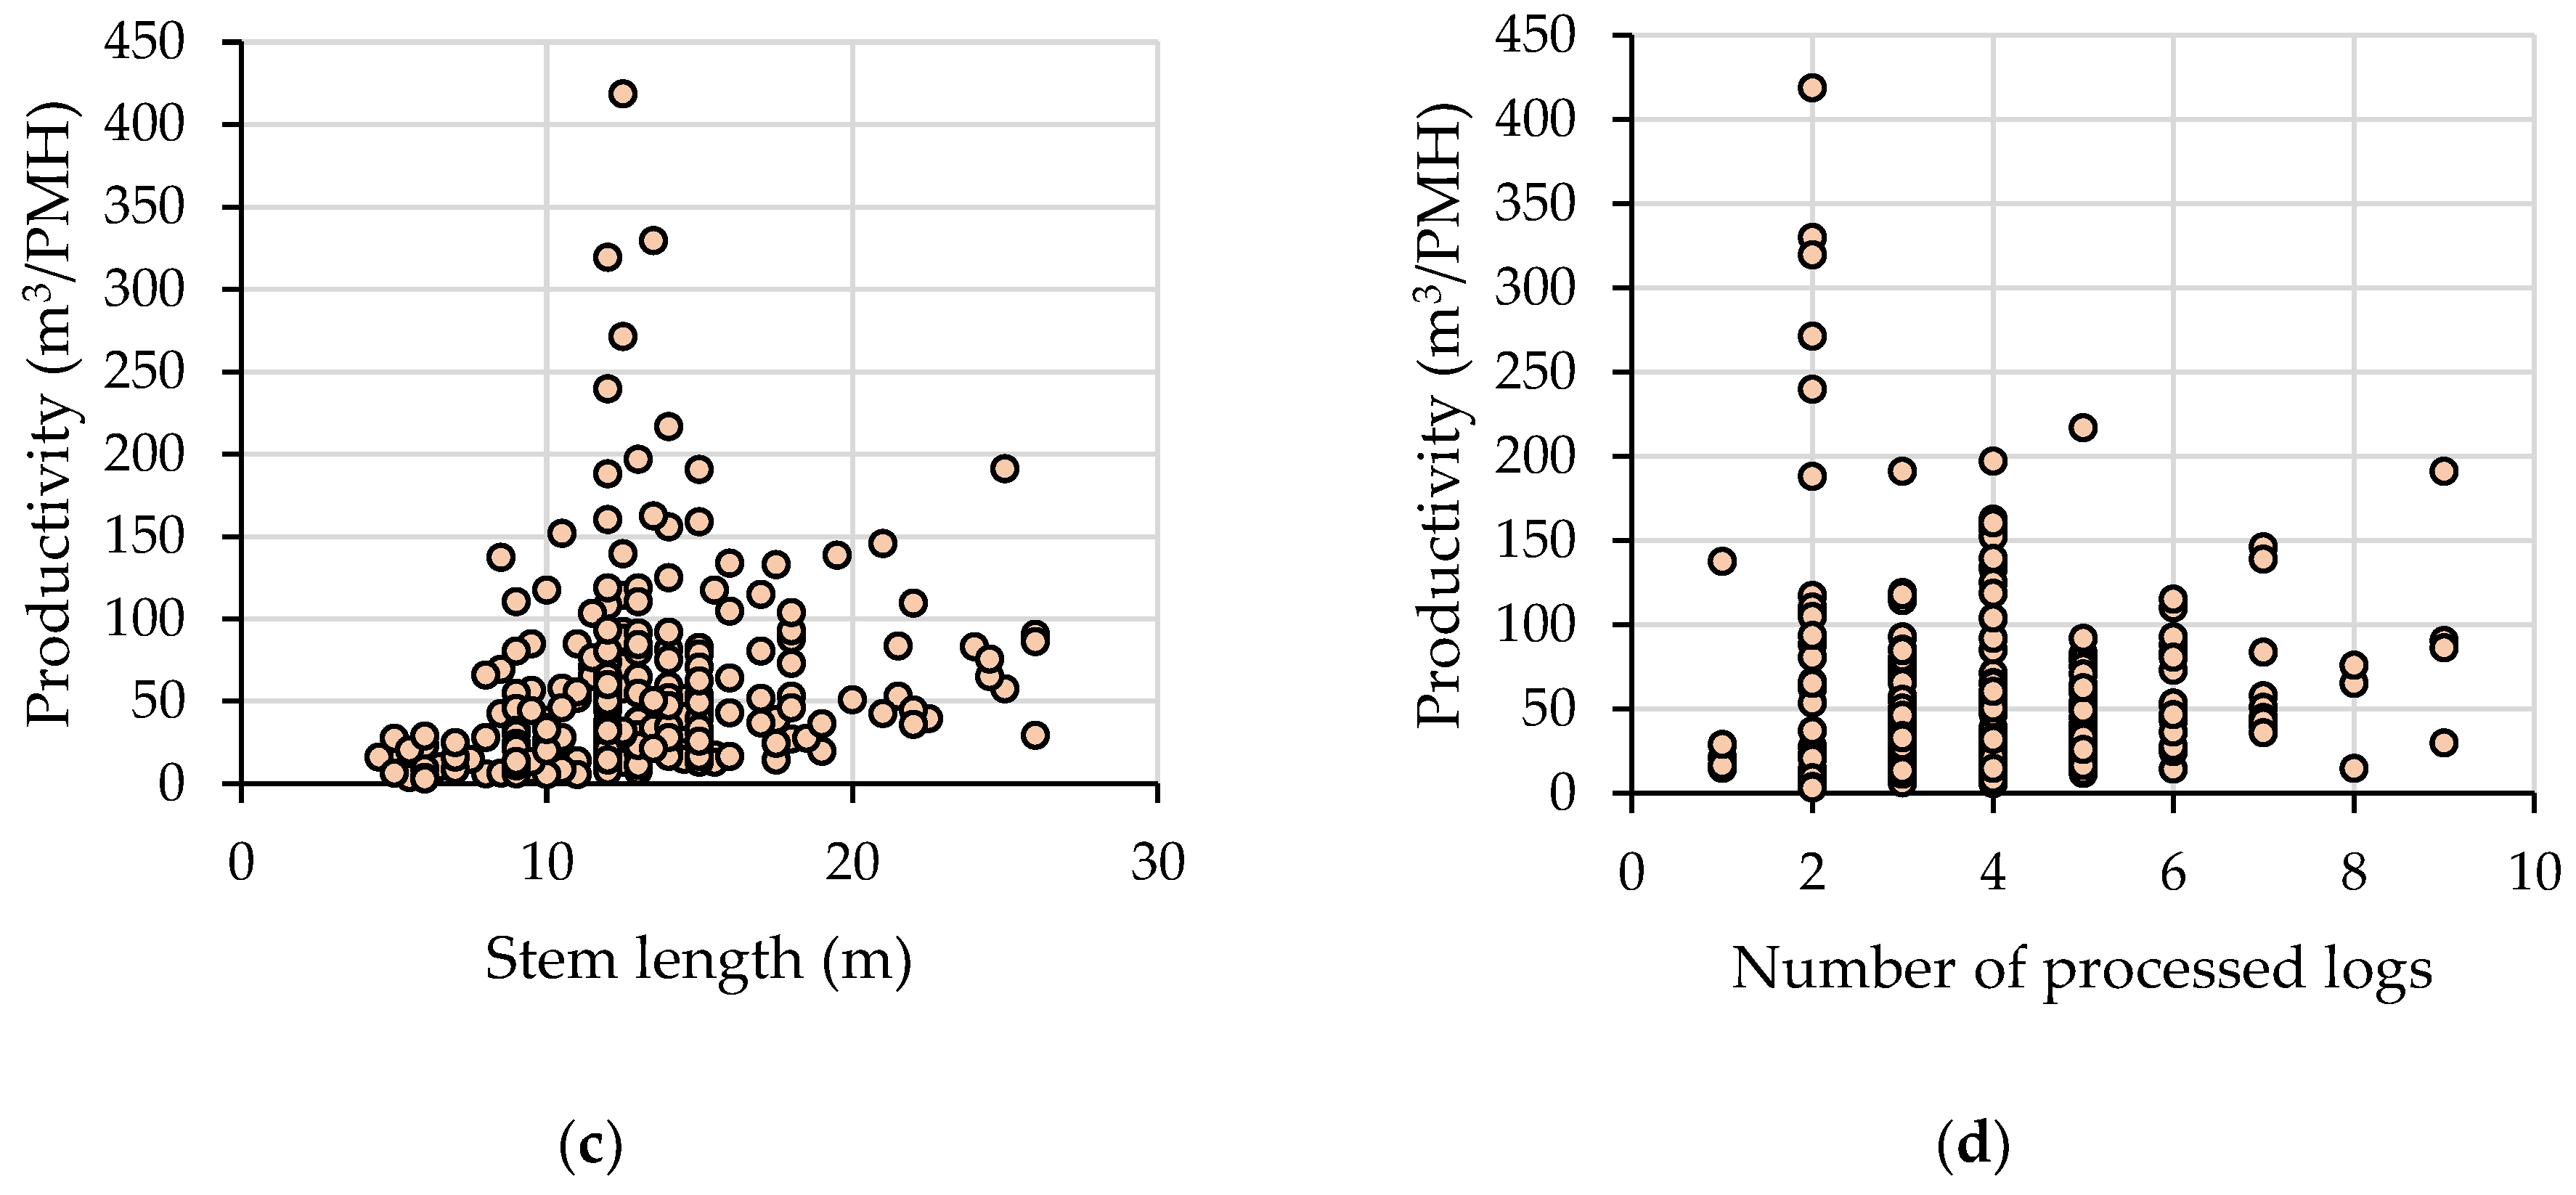
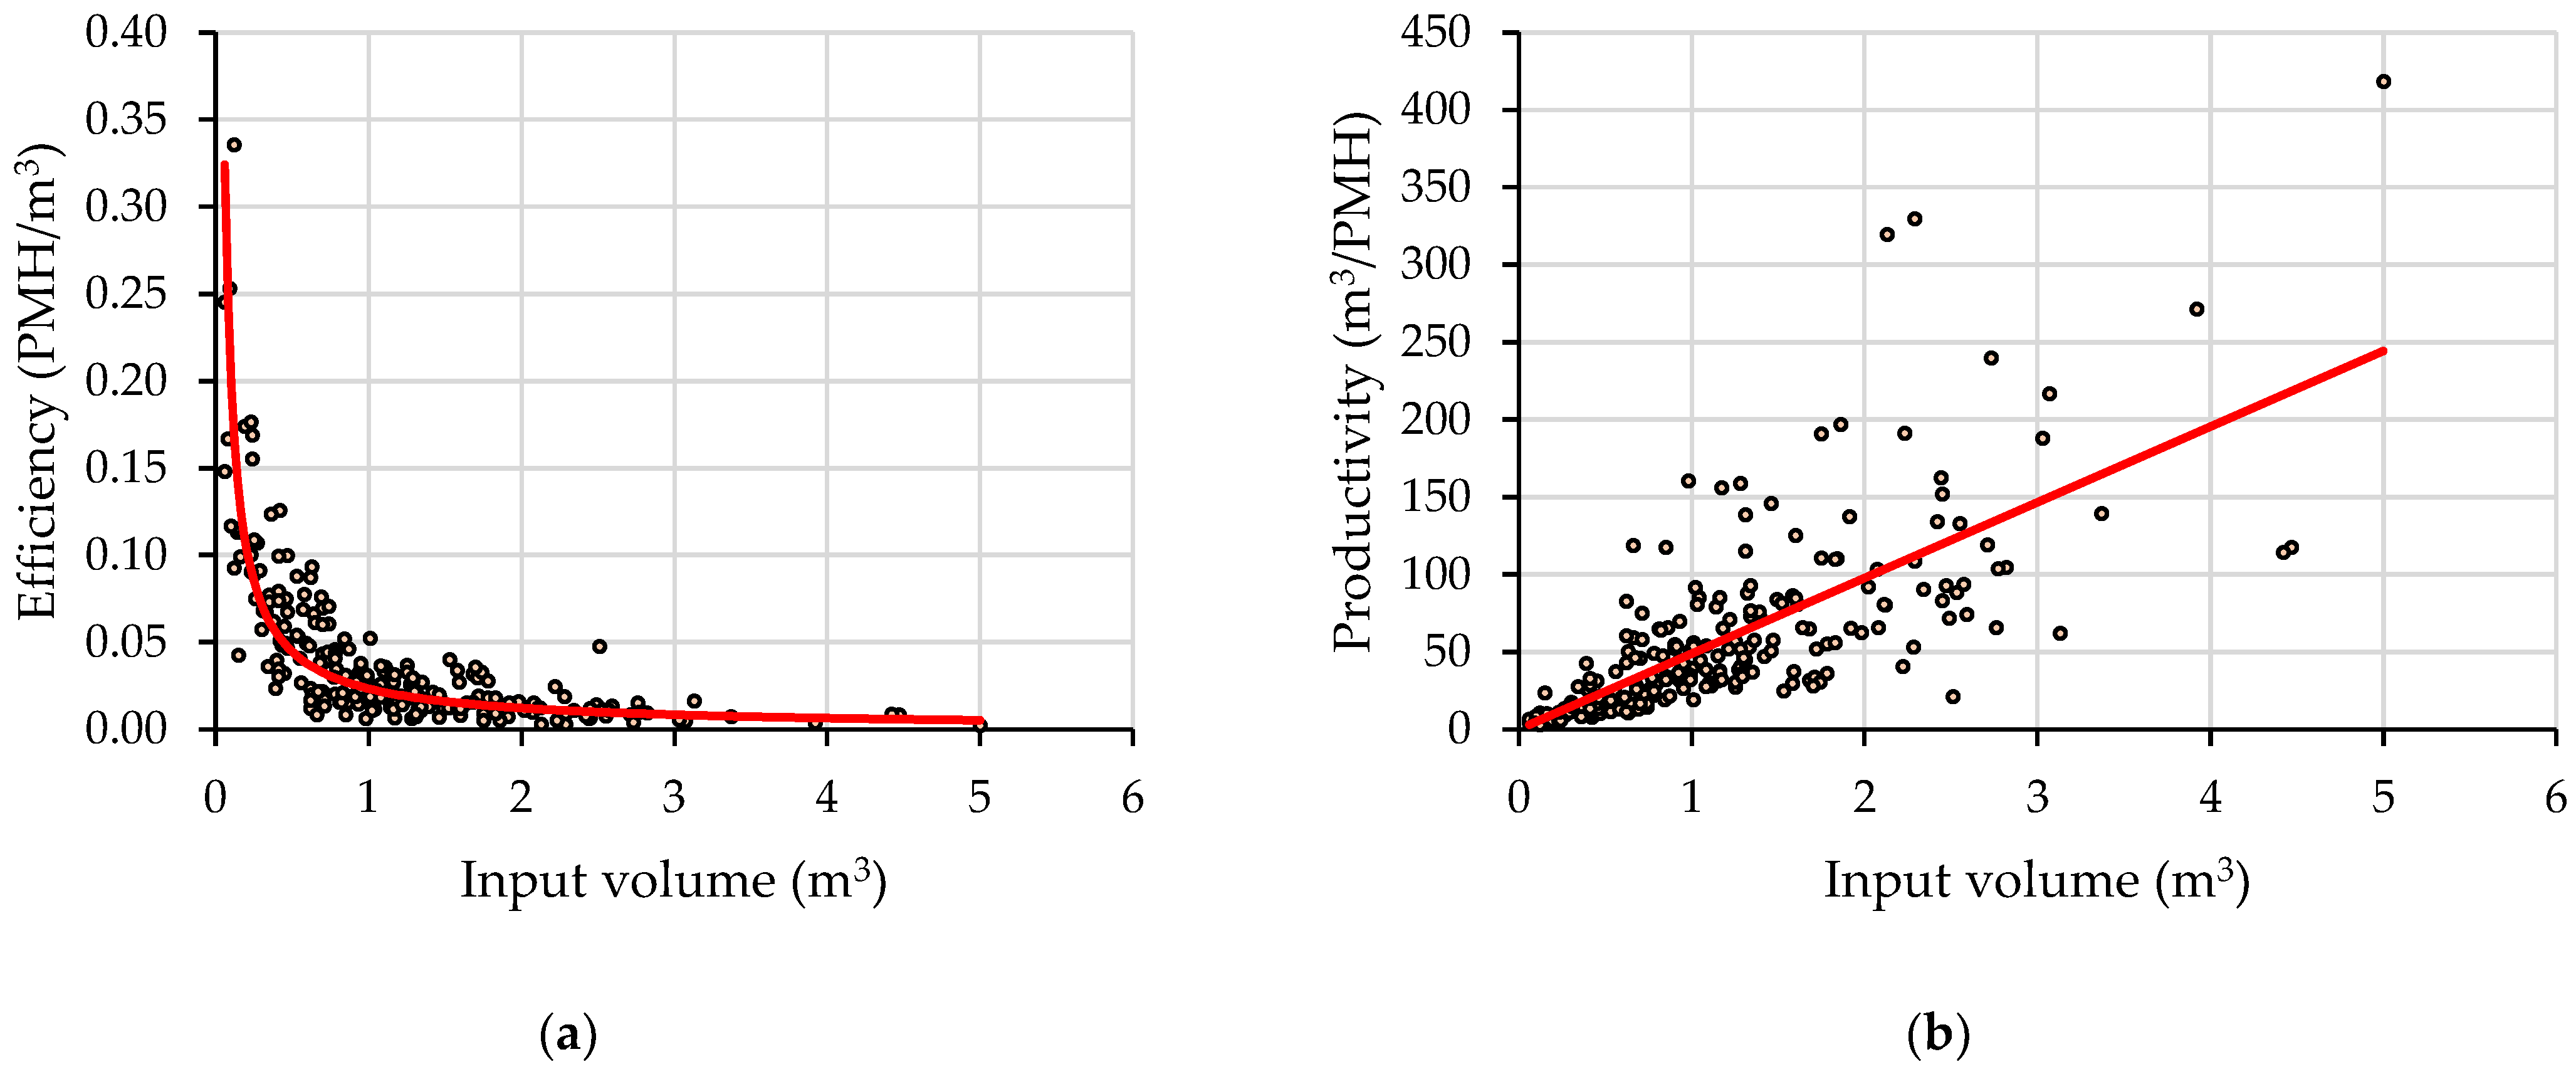
19]. Based on the input (input volume, stem length) and output (number of processed logs) variables, attempts were taken to model the work cycle-based time consumption, efficiency and productivity under similar statistical assumptions and methodological steps as described for the recovery rate. A stepwise regression procedure was used in all cases to evaluate the significance of the predictors and of the models based on the values of the
p statistics and variance inflation factors (VIF) [
28]. Along with the developed multiple linear models, scatter plots were developed to describe the relationship between the work cycle time, elemental time consumption, and the relevant independent variables. Following the multiple linear regression analysis, scatter plots were used to describe the variation in efficiency and productivity as functions of the input volume, stem length, and number of processed logs, and the most significant predictors were used to fit the data in bivariate scatter plots. For these models, the presence of heteroskedasticity in data was checked by the Breusch–Pagan and White tests [
29,
30].
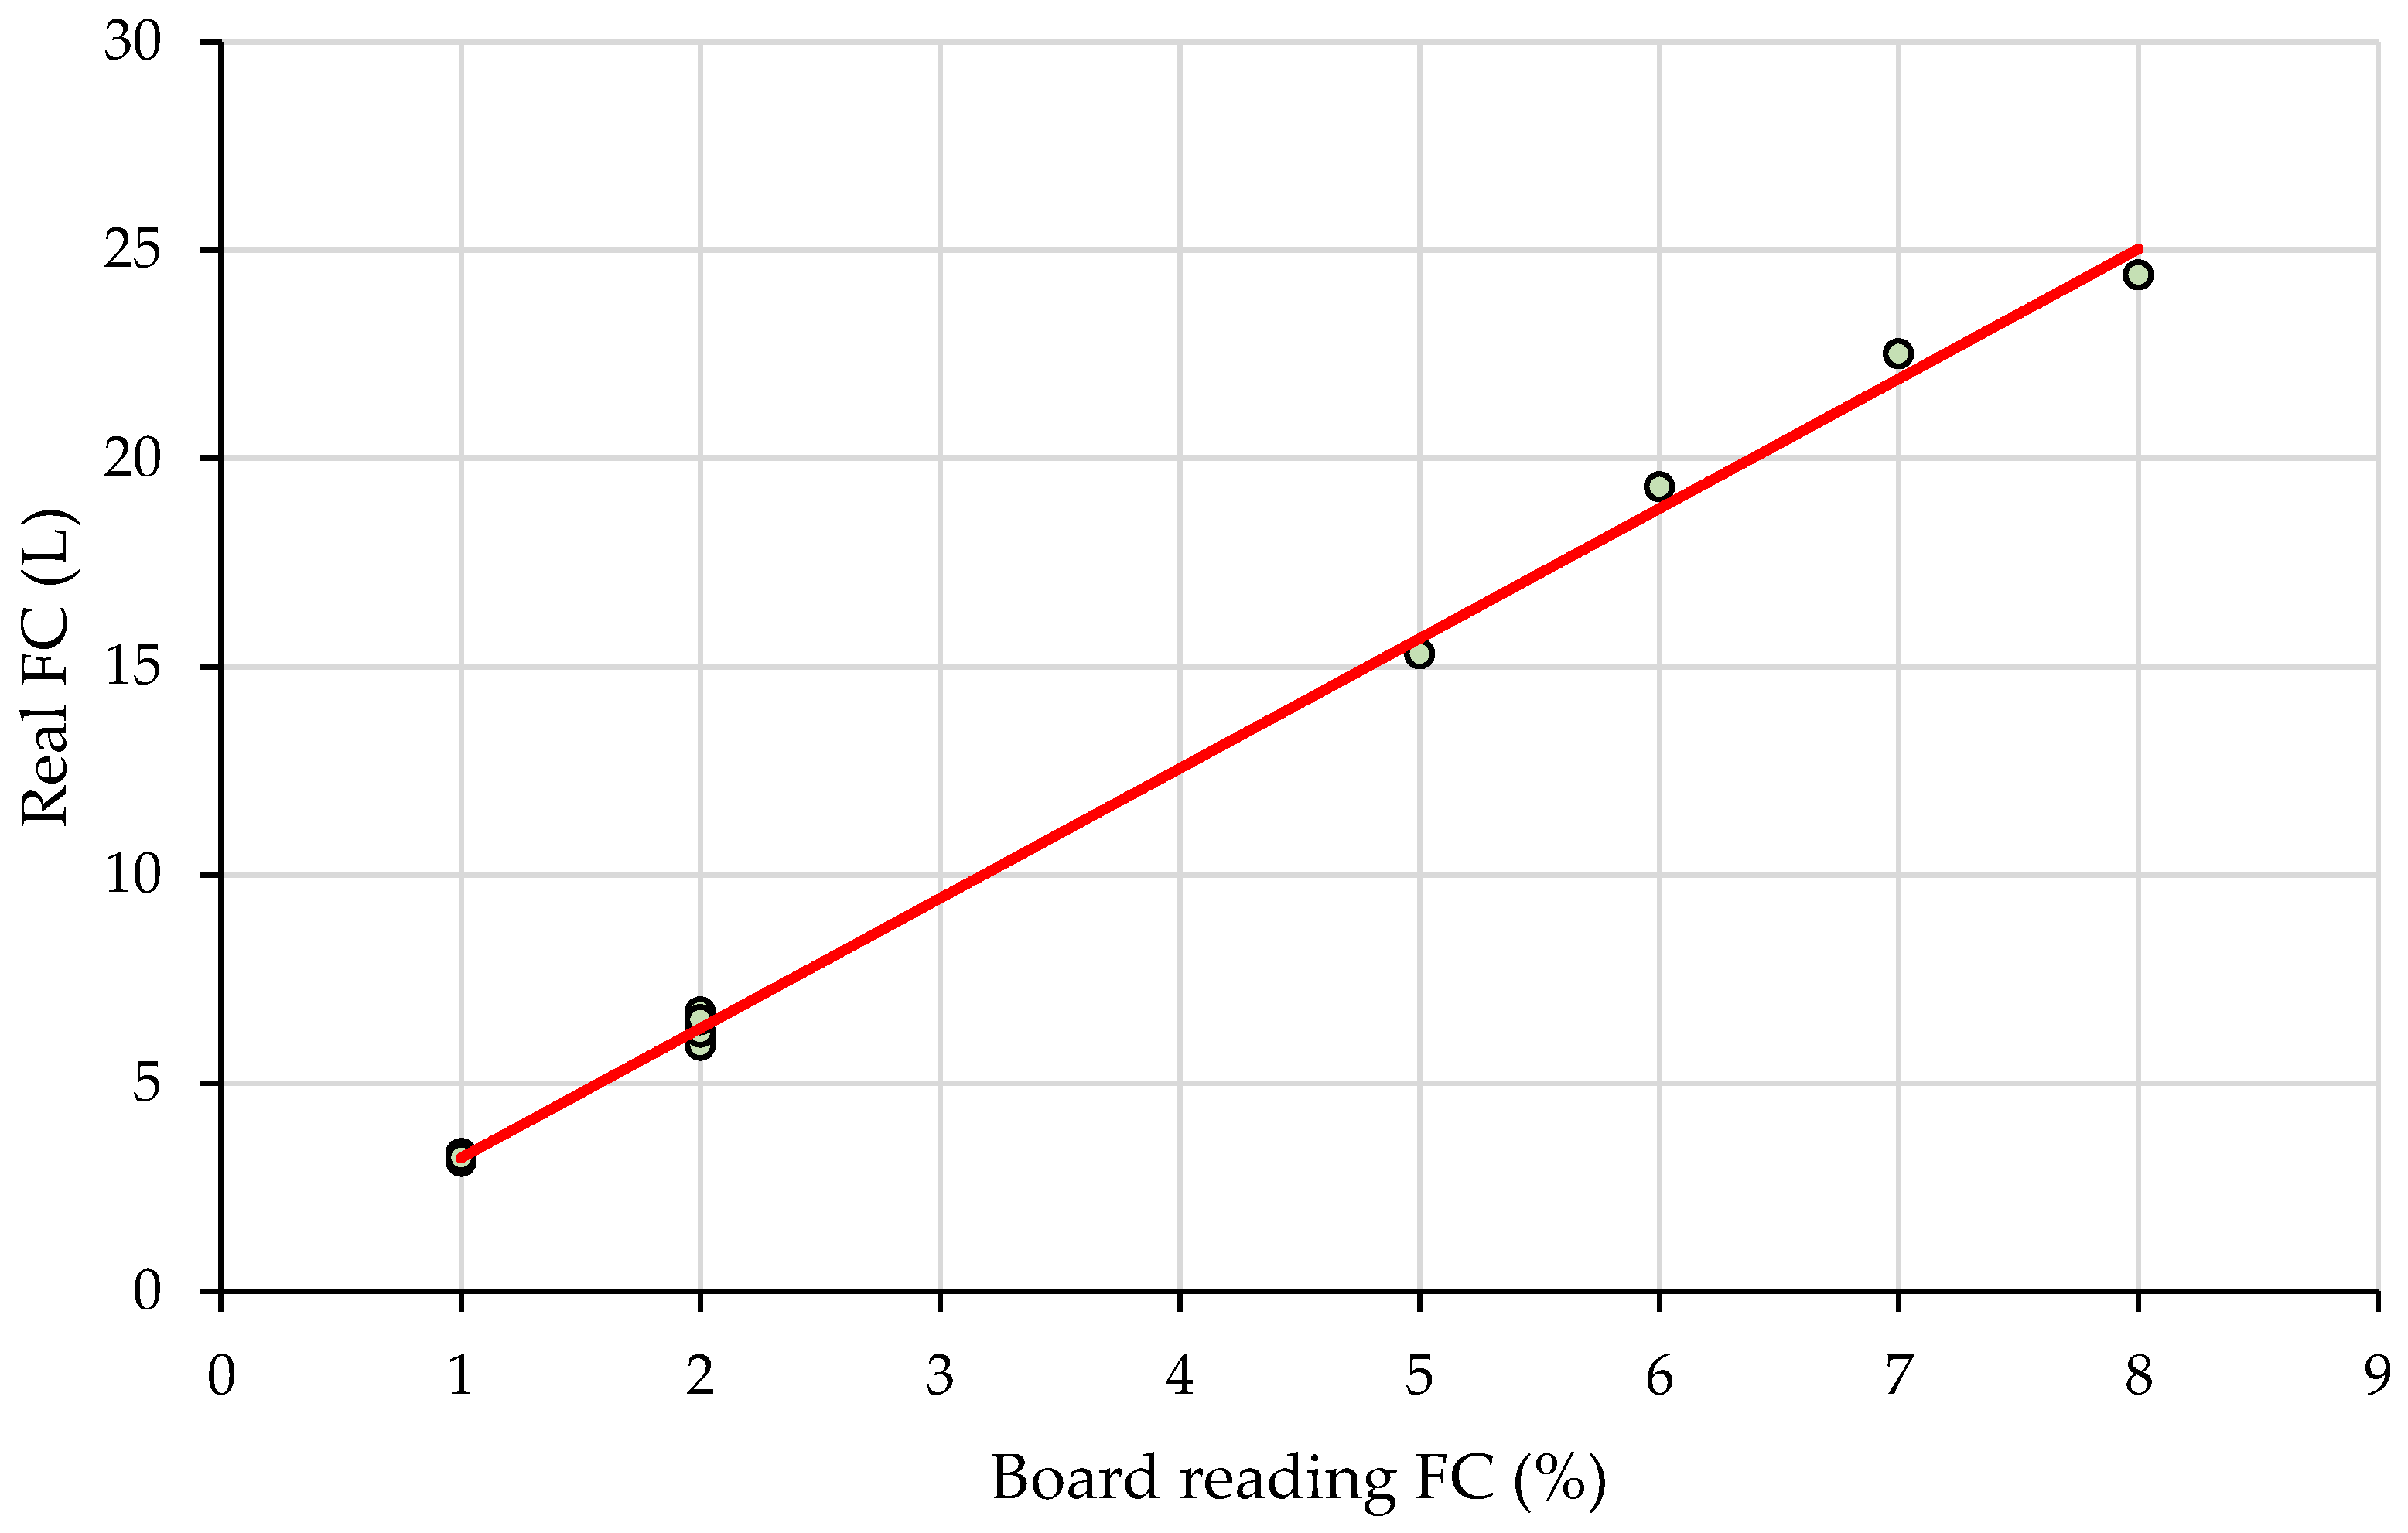
Based on the read and measured fuel consumption data, a linear model was fitted to describe the statistical dependence between them, with the aim of correcting the fuel consumption data, which were read on the onboard computer. Prerequisites of the model were the same as in the above-described steps, and they included a test for outliers which was carried out based on the box-plotting functionality of Microsoft Excel (Microsoft, Redmond, WA, USA). Once the model was fitted, it was used to convert the readings from percents into liters and to estimate the fuel consumed for all the production.
At an aggregated level, the input volume and the productive time given in productive machine hours (hereafter PMH) were used to estimate the efficiency (hereafter NE, PMH/m3 over bark) and productivity (NP, m3 over bark/PMH). The same metrics (GE and GP) were estimated by taking as reference the scheduled machine time (hereafter SMH), which excluded the delays caused by the study. At the same level, the recovery rate was reported as the average value over the sample. Fuel consumption was reported by two metrics, namely the hourly fuel consumption (hereafter HFC, L/h) and unit fuel consumption (hereafter UFC, L/m3 over bark).
Statistical analysis of this study was implemented in Microsoft Excel (Microsoft, Redmond, WA, USA), on which a copy of the Real Statistics add-in was installed. Real Statistics is a freeware statistical functionality extension program [
31] that was used to run the stepwise regression analysis, normality and heteroskedasticity tests and to plot the experimental data against the expected normal distribution by matching the areas of the two distributions. Statistical steps and the development of artwork, such as fitting bivariate plots, developing bar charts and scatter plots, running correlation analyses, as well as organizing and processing the data, including the computations of volumes and performance metrics, were carried out using the regular functionalities of Microsoft Excel.
2.5. Cost Simulation
The cost simulation was based on the results of productivity assessment, and several assumptions were made, including those in terms of days worked per year. The productivity model was used to estimate the productivity rates for stem sizes from 0.05 to 5.05 m3 and to extract the stem size for the average productivity as found by the study. The maximum number of days assumed for work during a year was 230, a number which excluded the weekends, legal holidays and a number of days that were supposed to be used for maintenance and relocation. However, this figure, which may affect the costs to a great extent, is only indicative since there were no background data on the average number of days worked per year in this kind of operation. As such, this figure was used as a reference scenario, assuming that the machine would work that amount of time in the same type of operation. To better reflect what would happen if the machine would work only part of these days in the type of operations taken into study, the number of working days was downsized to 200, 150, 100, and 50, respectively.
The cost assessment tool developed by [
32] was then used for cost simulations under the assumptions described above. The purchase price of the machine was assumed to be EUR 630,700; it included the value-added tax, and it was based on information provided by a local machine reseller. The salvage value of the machine was set at 10% of the investment, and the expected economic life was set at 15,000 h; these assumptions were based on educated guesses since there were no background data on such figures under the Romanian conditions. Machine insurance costs were acquired from the same reseller, and they amounted to EUR 7000 year. Assuming several relocations per year, relocation costs were estimated at EUR 3000 year. A full set of tires was considered in the cost calculation, which accounted for six units at a cost of EUR 750 each. Hourly fuel consumption data were taken as the average value from this study, and the fuel cost was that of February 2023 in Romania. Other consumables included the blades and the chains used for processing. In terms of work, a single shift of eight hours was assumed, although the practice observed in the field was different. Then, the number of working hours per day was rather difficult to estimate since there was no experience on how much wood would be available for processing at the same location. The net wage was set at EUR 25 per hour based on data obtained from similar operations. Personal protective equipment and training costs were set at EUR 200 per year, overhead costs were set at EUR 5000 per year, and the machine utilization rate was taken from the data of this study. Cost calculations were made per cubic meter for a profit margin of 10%. Cost data, as they resulted from the simulation, were plotted against the stem size.
4. Discussion
There are no recent experimental data available to describe the performance of motor-manual bucking operations carried out at the landing, as there are no recent data to describe the performance of piling operations by machines such as skidders, although these options could be the best candidates for comparison in this study by considering the Romanian forest operations conditions. The productivity standards developed and released in the past [
33], however, describe a range of productivity rates of approximately 5 to 25 m
3/h for the tree bucking operations carried out motor-manually. The same source indicates productivity rates of 8 to 12 m
3/h for log piling by skidders. Both figures were set for coniferous species as a function of the average tree size. These would result in efficiencies of 0.14 to 0.04 and of 0.24 to 0.17 h/m
3 for the same operations, respectively, as well as in the necessity to immobilize three workers, a chainsaw and a skidder. As found by this study, all of these operations can be carried out in a single pass by a harvester working in the processing mode, with a productivity of approximately 21 m
3/h and an efficiency of 0.05 h/m
3 for an average stem size of approximately 1 m
3 (0.06 to 5.00 m
3), which, obviously, is better. In the upper ranges of stem sizes, the productivity was found to be much higher by the developed models, reaching up to 250 m
3/hour for a stem size of 5 m
3. In terms of unit fuel use, this study estimated a figure of approximately 0.8 L/m
3, as well as a figure of 21 L/h, which is in the range of harvester fuel consumption, although it was much higher than that specific to tree felling and processing [
18]. Assuming a fuel consumption of 1 L/h for a chainsaw, as well as of 7 L/h for a skidder [
18], and by considering the rates described in [
33], this would result in unit fuel consumptions of 1.24 to 1.82 L/m
3, which is much higher than that found by this study. However, the maintenance costs of a harvester were estimated at 20.2 Euro/productive hour, while those of a skidder were estimated at 11.4 Euro/productive hour [
18]. Chainsaws, on the other hand, were found to be less capital-intensive in terms of maintenance, accounting for less than 1 Euro/productive hour [
34]. Altogether, the maintenance costs of the harvesters seem to be higher as compared to the partly mechanized alternative. However, the unit fuel costs could be significantly lower and the productivity rates much higher, which are to be complemented by an increased utilization rate of the harvester, therefore resulting in a significant reduction in machine-owning costs.
In terms of time consumption, grabbing and processing the stems were the work elements accounting for the least time, which is one of the contrasting characteristics compared to most of the studies describing the performance of harvesters in tree felling and processing operations. However, these results are intuitive since there were no delimbing tasks, and the processing work included only bucking. The effective cutting duration was found to be affected by the diameter at the cutting location; for modern harvesters, however, it takes only milliseconds to perform a cut, which was described for diameters of up to 70 cm [
35]. Even if one accounts for all the motions needed to carry out a cut, the time spent in this particular function may have a magnitude of a couple of seconds, and it may depend on the number of crosscuts performed [
36]. Coupled with the time spent in other movements of the processor head along the stem, this study found no significant relationship between processing time and other process input or output variables. However, the motions taken to move the stems and the logs were dominant in the time consumption, which may explain the failure to develop suitable models to predict the processing cycle time. In regular tree felling and processing operations carried out by harvesters, the expectations are to have a linear dependence between the felling time and tree size, while tree processing is characterized by non-linear dependence relationships [
37]. In addition, for lower ranges in tree size, some have described linear dependence relationships of tree processing at the landing [
38] and for in-forest tree felling and processing [
39]. These studies, however, share a common point, namely the presence of delimbing operations in a work cycle, which was not the case in this study. The machine’s crane moving tasks, which accounted for the most time consumption in this study, are not necessarily related to commonly measured variables, such as the stem size or the number of processed logs. Therefore, the time consumption found in these categories has probably prevented the development of suitable time-dependence models.
The onboard reading of fuel consumption is one of the current strategies used to account for fuel use [
19]. Many may be reluctant about its accuracy, but the results of this study, relating the onboard readings to the actual measurements almost perfectly, are strong arguments for its use in such circumstances in which the machine can be placed on a levelled ground before reading. The results indicate a close to full agreement between these readings (R
2 close to 1, regression coefficient of 312, and an intercept of 0.08 for a tank capacity of 300 L). The strategy of relating the onboard to the manual readings allowed the development of an accurate dependence relationship between the fuel use and the volume taken as an input for processing. However, most of this fuel intake may come from crane-moving tasks, as effective cutting was found to depend on the diameter, and it was in a magnitude of up to 40 mL [
35]. This also indicates the opportunities for improvements in fuel use by a better planning of pile locations and of the overall operations so as to limit the machine’s arm movement in a lower but suitable range.
The productivity of mechanized tree felling and processing operations was described to increase up to a certain point, reach an optimum, and then decrease as a function of the tree size as the machines start struggling when reaching or exceeding their capabilities [
40]. Productivity drops after the optimum may come from handling excessively large trees as well as from operating with well-developed limbs, which require increasingly more time for processing. In addition, the location of optimum productivity as a function of tree size seems to be sensitive to other operating conditions, such as harvesting windthrown trees [
11], while the effective processing time was frequently described as dominant in tree-processing operations [
10,
41]. Based on this, the only productivity model that best fitted the data of this study was in the form of a linear function. This may come largely from the absence of the delimbing time in a work cycle, making the productivity better fitted by a linear function to the input volume. In addition, a linear dependence relationship between productivity and tree size may very well characterize the process in lower ranges of tree size [
40,
42]. However, once the tree size starts to increase, and there will be a significant amount of delimbing work, other types of functions may be more suitable to describe the productivity of regular tree felling and processing. A similar interpretation may apply to the models developed for efficiency. The linear model, on the one hand, is simple to interpret, but it has a lower predictive power. The power function used fitted much better to the data, and it indicated a much sharper change in efficiency as a function of the input volume. Similar efficiency functions could be obtained based on the data reported in other studies [
38,
43], but the presence of delimbing will determine a slower changing rate in efficiency as a function of the tree size. In other words, the power model developed in this study was very sensitive to the absence of delimbing work.
No important dependence relations were found to explain the recovery rate based on the measured variables. It simply accounted for approximately 95% and showed some trends, but they could not be generalized to the data pool. On the other hand, these results should be interpreted with caution due to the methods used to measure the input-output volumes, which, although detailed, could be perfected to obtain better estimates; in this regard, proximal-sensing-based methods may have considerable potential for better estimates [
44,
45]. Although no detailed measurements were made regarding the accuracy of the harvester’s system, some of the losses could be related to it. This was found for harvester use in broadleaved forests [
46], and it would be worth a detailed assessment under the conditions observed in this study.
There are some limitations of this study that need to be addressed. First of all, there was only a limited set of data available to develop the related statistics and predictive models, which probably brought the described statistical limitations in terms of normality and homoskedasticity. In addition, no data normality was detected in the residuals of the productivity model (data not shown herein), complicating the interpretation further and making the prediction intervals less reliable. Nevertheless, the included statistics and models describe the observed process and provide useful information on the potential dependence relations and expectations in terms of time and fuel consumption, as well as efficiency and productivity. Non-homogeneity in variance, on the other hand, is typically present in studies on timber-harvesting productivity, which can be easily seen in the scatterplots of the developed models e.g., [
24,
42], but it does not affect the parameter estimates [
47]. A second limitation is that it was very difficult to attribute very short delays identified during the processing tasks to some specific reasons and to separate them from the work cycle time. For instance, there were cases in which such delays could be attributed to either the decision-making process of the operator or to other external factors, but a correct categorization could not be made without more detailed knowledge of the operator’s interaction with the machine’s controls. Although the use of video cameras placed outside the cab is useful for extracting accurate data [
22], it seems that it cannot solve such problems. Further work should explore the conformity in the length of the processed logs as specific to this operational option. Although there were no complaints on the production conformity, for the sake of validation, this could be checked in the future since the expectations would be to use this operational option irrespective of the species group. Last but not least, cost simulations were carried out in this study under the assumption of various amounts of time scheduled for working at the roadside but with no background data on costs for operating in the forest. There are no background data to estimate how much time would be spent in this kind of operation; therefore, year-based cost calculations would need advanced simulations that should include a detailed work profile around the year. This is because the productivity, machine utilization rate, fuel consumption, as well as other cost assumptions and components, depend on the type of work and may have a high impact on the overall cost estimates. Therefore, the most credible cost figures for processing stems at the landing only would be those calculated on the assumption of working for 200 to 230 days per year, resulting in unit costs of EUR 10 to 11/m
3 for an average productivity of 21.41 m
3/h.


