Article

Phenotypic Variation in Leaf, Fruit and Seed Traits in Natural Populations of Eucommia ulmoides, a Relict Chinese Endemic Tree

1
Key Laboratory of Hunan Forest Products and Chemical Industry Engineering, Jishou University, Zhangjiajie 427000, China
2
College of Biology and Environmental Sciences, Jishou University, Jishou 416000, China
3
National and Local United Engineering Laboratory of Integrative Utilization Technology of Eucommia ulmoides, Jishou University, Jishou 416000, China
*
Author to whom correspondence should be addressed.
Forests 2023, 14(3), 462; https://doi.org/10.3390/f14030462
Submission received: 30 November 2022 / Revised: 18 February 2023 / Accepted: 22 February 2023 / Published: 24 February 2023

Abstract

:
Eucommia ulmoides Oliver is a dioecious, pharmaceutically and economically important, and precious relict tree species endemic to China, and has been listed as a key protected tree species of national level II. Phenotypic variation in ten natural populations in some key traits is still obscure. In order to study the relationship between population variation in phenotypic traits and geoclimatic factors, 15 traits were analyzed in 117 female sampled tree from ten natural populations. The results showed that the coefficients of variation for all of the 15 traits widely ranged from 9.7% (fruit vertical diameter) to 49.0% (leaf thickness), with an average of 19.7%. The nested ANOVA revealed plentiful phenotypic variations within and among populations. The variation within population was the main source, with an average proportion of 42.8%, greater than that among the population (16.6%). The 15 traits were reduced to four principal components, which collectively accounted for 70.1% of phenotypic variation among trees. The ten populations were mainly divided into two groups: Group A included eight populations throughout the Wuling Mountains occurring in relatively close proximity to each other, and Group B which comprises two geographically distant populations in mountains further northern. There were significant level correlations between phenotypic differentiation among population of E. ulmoides and both geographic (r = 0.65, p < 0.05) and climatic (r = 0.73, p < 0.01) distance. Step-wise regression indicates average annual temperature and rainfall accounted for most of the phenotypic variation among populations, and mainly associated with differences in leaf, fruit and seed size. These results can have an important implication for genetic improvement, diversity conservation and resource management of the species in the future.

1. Introduction

Eucommia ulmoides Oliver is a tertiary period tree that is a monotypic species within the Eucommiaceae family; it is a dioecious plant, and has been listed as a key protected tree species of national level II in China [1]. Its leaves, stems, bark, and male flowers have been used as traditional medicines in China, Japan, and Korea, to treat diseases [2]. Theoretical and clinical studies were conducted on the pharmacological effects of E. ulmoides. It was found that E. ulmoides is a non-toxic source of medical health care products with few side effects and a wide range of pharmacological effects, which include hypoglycemic, hypolipidemic, antioxidant, antitumor, antibacterial, anti-inflammatory, etc. [2,3,4]. In addition, E. ulmoides produces a type of rubber called eucommia rubber, which could potentially be used as an industrial raw material [5]. It has been well known that Hevea brasiliensis is the most important source of natural rubber, but limited acreages have hindered the development of rubber tree plantations in China. Xishuangbanna prefecture, in Yunnan province, is the largest distribution region of H. brasiliensis, where most rubber trees are planted on sloping land of up to 24° incline and 900 m elevation, and rubber production is considered unprofitable [5,6]. The fruit and bark of E. ulmoides are rich in rubber, making it an excellent alternative to H. brasiliensis [7]. In published studies of E. ulmoides, the active constituent and rubber were correlated with phenotypic traits, such as a positive correlation between leaf perimeter and geniposide acid of iridoid, and a negative correlation between leaf area and eucommia rubber [8,9,10]. In general, environmental stresses cause plants to accumulate secondary metabolites [11,12], and their phenotypic traits are usually influenced by the environment. Therefore, the study of phenotypic traits could lay the foundation for the selection of species rich in secondary metabolites. There was an urgent need for phenotypic variation in E. ulmoides.
E. ulmoides was widely distributed in Europe, America and Asia before the Neogene, and the fossil of E. ulmoides fruits are found in Japan, China and the western and southeastern United States [13,14,15]. However, after the Quaternary Period, only a few E. ulmoides in central China have survived, protected by the complex topography [16]. Now E. ulmoides is extensively cultivated in China (24°50′–41°50′ N, 76°00′–126°00′ E), mainly distributed in Shaanxi, Sichuan, Guizhou, Hubei, Hunan and other provinces south of the Qinling Mountains [17,18]. Due to its high medicinal and ornamental potential, E. ulmoides was introduced into France, Japan, Russia and America in 1896, 1899, 1906 and 1952, respectively [19]. Currently, E. ulmoides is listed as an endangered species by the IUCN (IUCN. 2022. The IUCN Red List of Threatened Species. Version 2022-1. https://www.iucnredlist.org, accessed on 25 October 2022), but the variation of natural populations of E. ulmoides is unclear and further research is urgently needed. The study of the variation of economically and ecologically important traits is important for genetic improvement and reasonable conservation of germplasm resources of E. ulmoides.
Phenotypic variation reflects the result of genetic variation and phenotypic plasticity in response to environmental variation. It is the expression of plant adaptation to different environmental conditions [20], so phenotypic variation is important in investigating environmental adaptation and evolution of plants [21]. The study of phenotypic variation can help to understand the response mechanisms and variation patterns of plants to the environment, which is important for the collection, conservation, and evaluation of plant germplasm resources. Existing studies on the phenotypic and genetic diversity of E. ulmoides based on morphological markers have mainly focused on traits such as staminate flowers [22], fruits [23,24], leaves [25,26], and branches [27], and the germplasm sampling areas were concentrated in Beijing and Henan. However, a large amount of natural E. ulmoides populations are preserved in three major forests in remote mountainous areas of Jiang Ya in Hunan (P4), Zunyi in Guizhou (P8), and Lueyang in Shaanxi (P9), of which the phenotypic diversity has not been adequately studied (P4, P8, P9 shown in Figure 1). The dynamic evolution of E. ulmoides communities in diverse natural environments was one of the important factors leading to the expression of rich phenotypic variation. Therefore, more comprehensive information on phenotypic variation and their relationships with geoclimatic factors at the population level is needed.
In this study, we sampled 117 female individuals from 10 natural populations, based on a survey of the main distribution regions of E. ulmoides in China, and measured 15 phenotypic traits of leaves, seeds, fruits. Our main objectives were to (1) quantify the phenotypic variation in the traits assessed; (2) determine the proportion of phenotypic variation between and within populations; and (3) examine the pattern of population variation and its association with geoclimatic factors. The results of the study will provide a basis for genetic improvement, diversity conservation, silviculture and resource management of E. ulmoides.

2. Materials and Methods

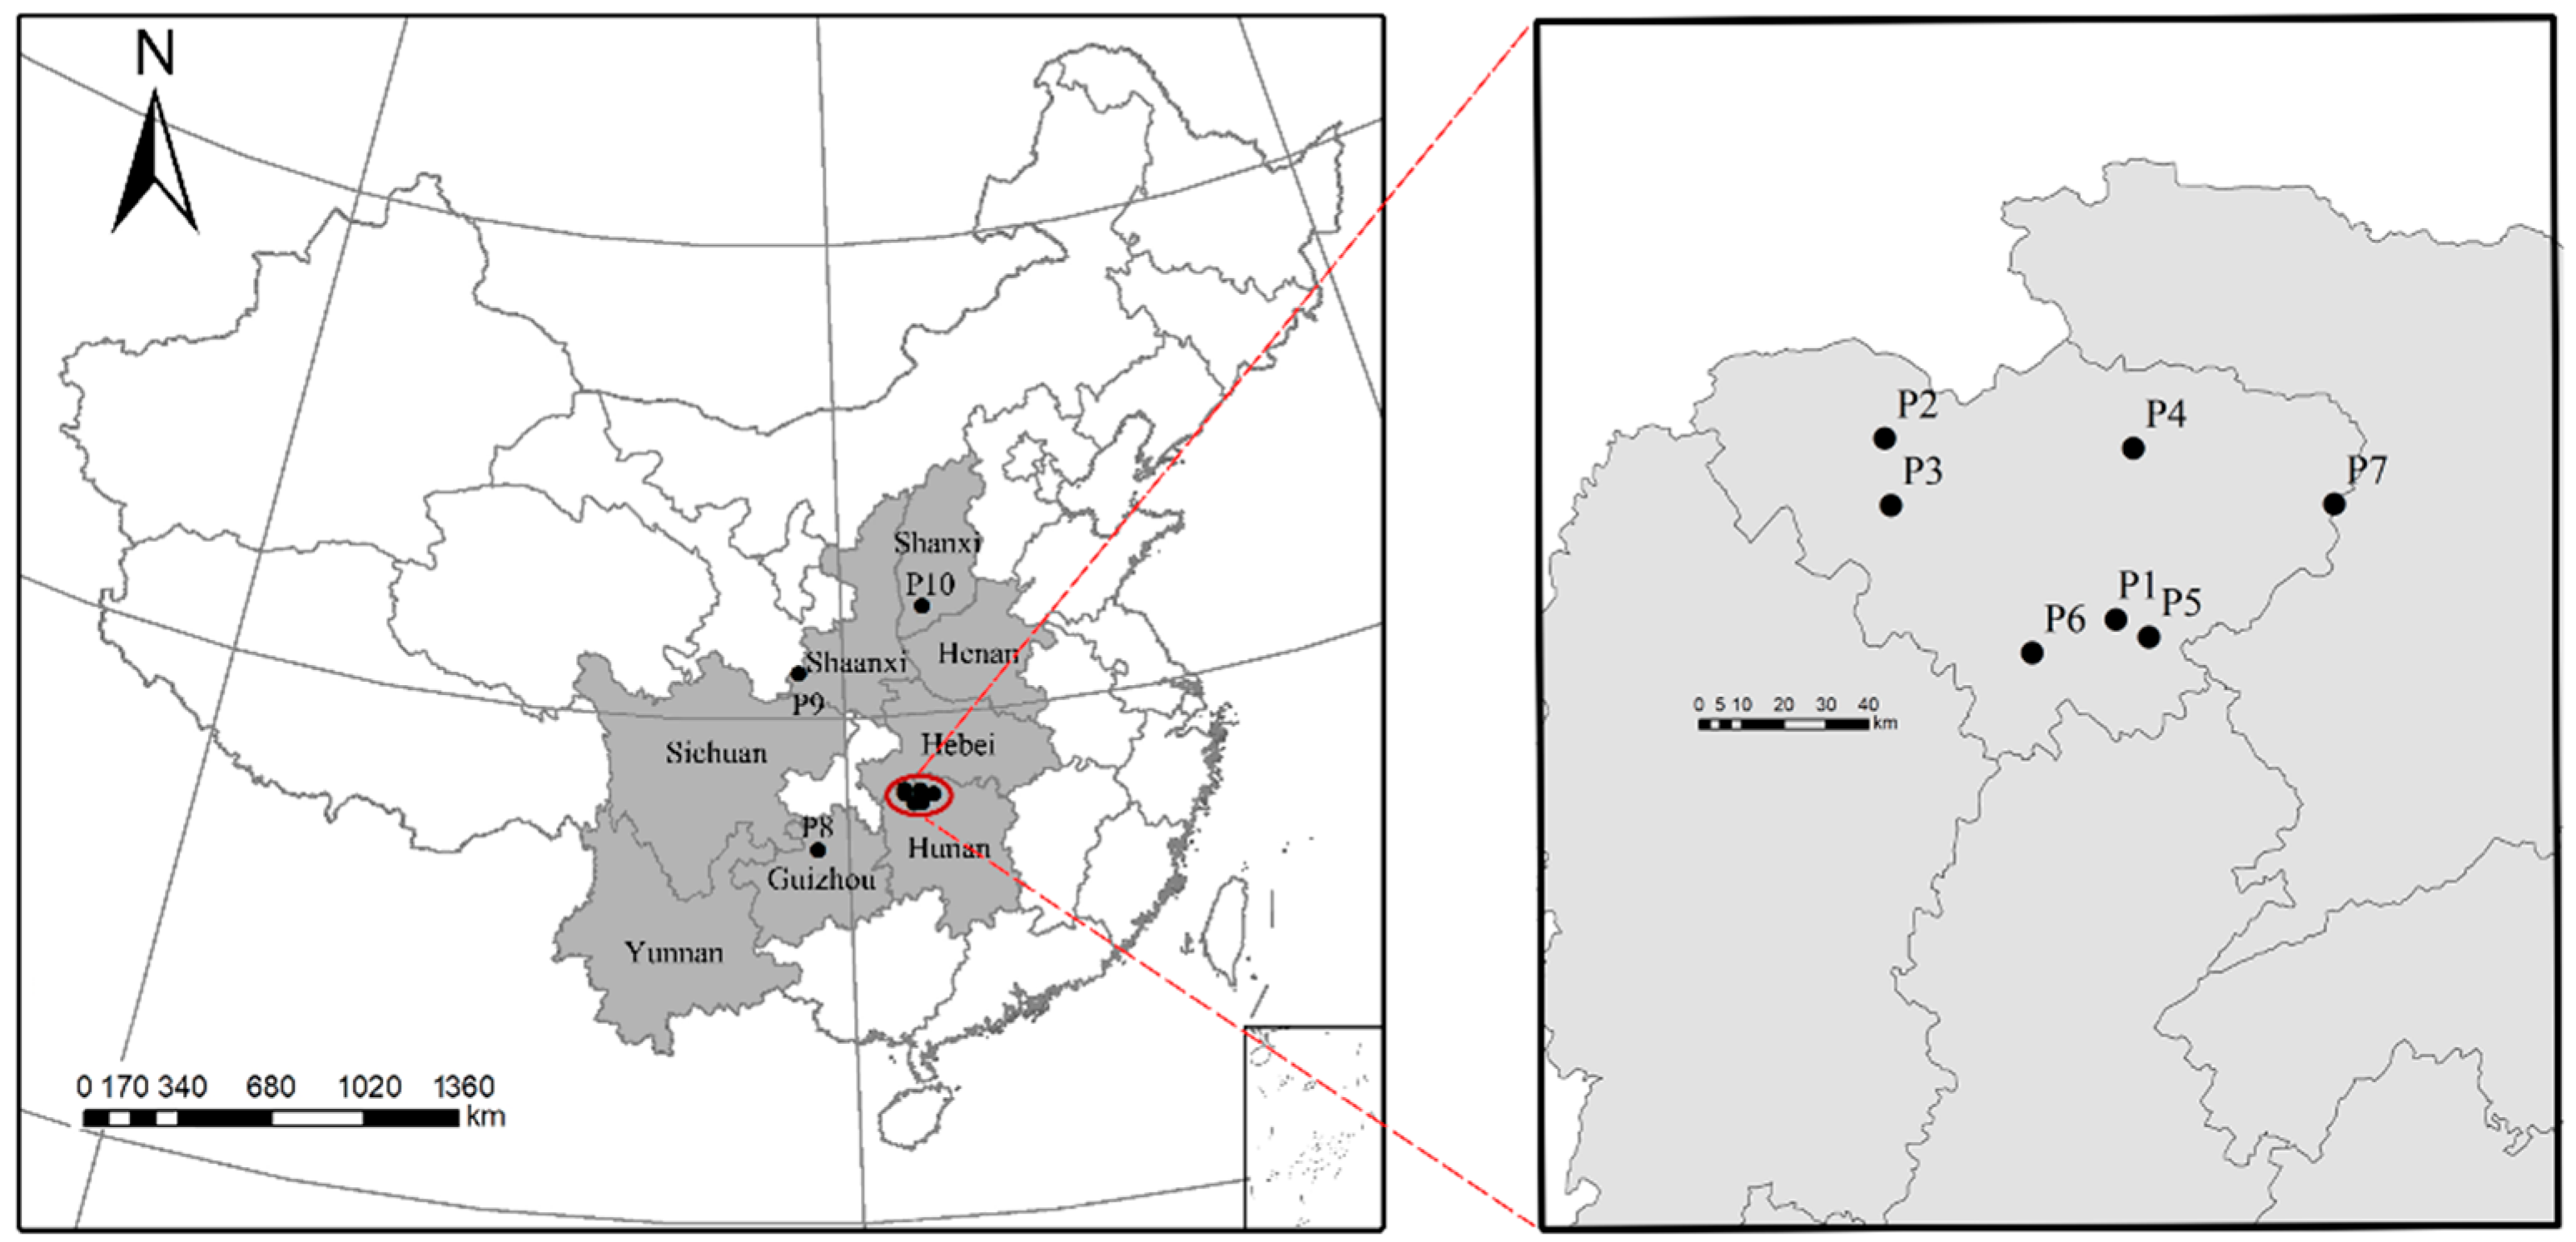
2.1. Plant Materials

The materials were collected from 117 female trees in 10 natural populations (Figure 1) throughout September and October of 2020. Basic information on the populations, such as sampling sites, is shown in Table 1. Within each population, samples were collected from 5 to 36 trees. The distances between the sample trees were greater than 40 m to reduce their relatedness; an exception was P7, which has a modest population size, so the distance between sample trees was set to 10 m. Leaves were collected only from short shoots on the outer, sunlit part of the tree’s crown, as those are generally considered to be the most uniform leaves. This sampling strategy will minimize seasonal and ontogenetic differences among sampled trees. Approximately 1 kg of fruit and leaf was collected from each tree, transported to the laboratory, and then pressed and fully dried for further morphometric analysis. Finally, 30 randomly selected leaf and fruit samples were taken from each tree for subsequent analysis.
The geographic locations of collection sites were determined using GPS, consisting of latitude, longitude and altitude. Annual mean temperature, annual mean rainfall and relative humidity of each population were obtained from the National Meteorological Data of China (http://data.cma.cn/; 1981–2010, accessed on 20 February 2021). All climate factor information is shown in Table 1.

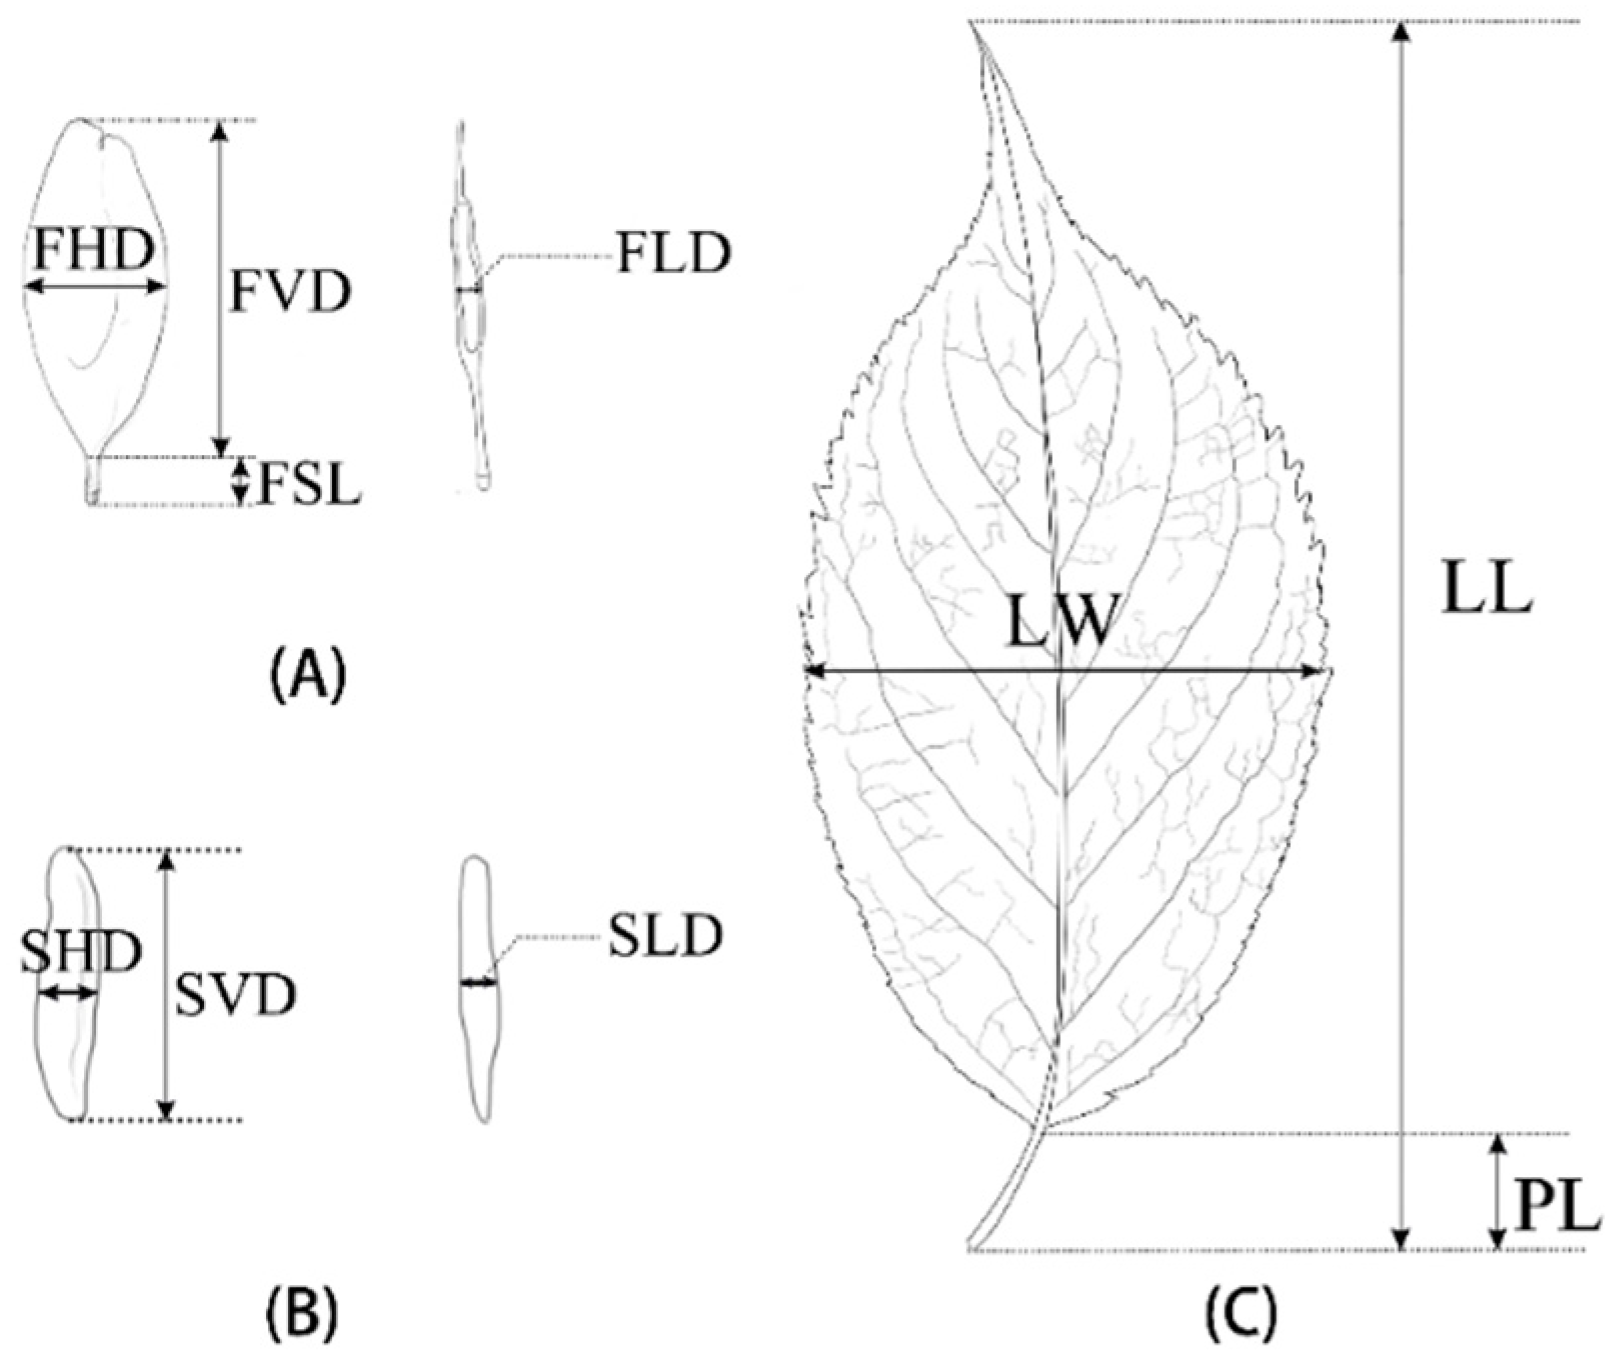
2.2. Morphometric Analysis

Thirty seeds and leaves were randomly selected from each tree and measured using a vernier caliper (in mm). Twelve phenotypic traits were measured on each tree (Figure 2): leaf length (LL), leaf width (LW), leaf thickness (LT), petiole length (PL), leaf perimeter (LP); fruit vertical diameter (FVD), fruit horizontal diameter (FHD), fruit lateral diameter (FLD), fruit stalk length (FSL), seed vertical diameter (SVD), seed horizontal diameter (SHD) and seed lateral diameter (SLD) [28]. Leaf thickness measurements avoided all leaf veins and were repeated three times to obtain the average. The weight of 100 fruits (FrW) was determined using an electronic balance. The following indexes were calculated from the measured characteristics: fruit shape index (FVD/FHD) and seed shape index (SVD/SHD). The complete leaf was placed on a A4 paper, covered with a transparent acrylic plate and photographed using a Sony α6000 perpendicular to the leaf. Leaf perimeter (LP) was calculated by Auto CAD 2020 (Autodesk, San Rafael, CA, USA).

2.3. Statistical Analysis

Descriptive statistics, including maximum, minimum, average value ( X ¯ ), standard deviation (SD) and coefficient of variation ( C V ), using all the data (includes the repeated measurements within a tree). C V was calculated as:
C V = S D X ¯ × 100 %
The population differentiation coefficient V s t was calculated as:
V s t = σ i 2 σ i 2 + σ j i 2 × 100 %
where σ i 2 is the variance between populations and σ j i 2   is the variance within the population. σ i 2 and σ j i 2 were obtained from nested ANOVA method (tree factors nested within population factors), which used the following linear model:
Y i j k = u + α i + β j i + e i j k ,
where Y i j k is the k th observation value of the j th tree in the i th population, u is the overall average, α i is the random effective value of the ith population, β i j is the random effective value of the j th tree in the i th population and e i j k is the experimental error of the i j k th observation value, which is the variation within trees [20,29].
In order to investigate the correlation between phenotypic traits, Pearson correlation coefficients and statistical significance were obtained using the function ‘cor.test’ in R version 4.1.3 [30]. Tree means of 15 traits was carried out and using the Z-score method to standardization the data prior to Correlation analysis. Principal component analysis (PCA) was used to condense phenotypic traits into several principal components and exploring the continuum of trait variation. PCA was carried out using a correlation matrix constructed from standardized (Z-score method) tree means. Using the above descriptive statistics, principal component analysis were conducted using the R package MorphTools2 in R Version 4.1.3 [30] following the manual of Koutecký [31].
The Mantel tests and Partial Mantel tests were performed to evaluate the correlation between multivariate differences among populations [32,33] and implemented with the R package “Vegan” [34,35]. Dissimilarity matrices were calculated to test correlations between geographic (latitude and longitude), climate factors (average annual temperature, average annual precipitation, average annual humidity) and phenotypic variation (all studied leaf, fruit and seed variables). Climate and morphometric distance matrices were assessed as the Euclidian distances between the populations. Geographic distances were calculated as the Euclidian distance between the population sites. The significance level was assessed after 10,000 permutations. Pearson correlation coefficients were obtained between climate factors and PCs the function ‘cor.test’ in R version 4.1.3 at tree-level. A dendrogram of the closest Euclidean distances on the basis of the unweighted pairgroup method using arithmetic means (UPGMA) was constructed to check the structure between the studied populations. The Euclidean distances was produced by the R function ‘dist’ using population means standardized by the Z-score method, and then was subjected to a clustering procedure (UPGMA method) using the ‘clust’ function in the R package MorphTools2.
Stepwise regression was carried out to investigate whether the climate variables could be used as predictors of the population variation in morphological traits (here we use the data in population level) and was conducted using the SPSS Statistic 26.0. In order to investigate the correlation between PCs and climate factors (here we use the data in population level), Pearson correlation coefficients and statistical significance were obtained using the function ‘cor.test’ in R version 4.1.3 [30].

3. Results

3.1. Phenotypic Variation of Traits

The results of the performed statistical analysis are shown in Table 2. For all measured traits, the coefficient of variation (CV) ranged from 9.7% to 49.0%, with an average of 19.7%. The highest CV was in leaf thickness (LT) (49.0%), followed by fruit stalk length (FSL) (24.6%), and petiole length (PL) (24.4%), and the lowest was in fruit vertical diameter (FVD) (9.7%). The average coefficient of variation of traits was greatest in the leaves (28.2%), followed by the fruits (16.1%), and lowest in the seed (14.7%). The results showed that among E. ulmoides traits studied, the leaf traits were more phenotypically variable overall than the fruit and seed traits.

3.2. Phenotypic Variation among and within Populations

The variation for the 15 phenotypic traits could be divided into 2 levels: among populations and within populations. The phenotypic traits of leaves and fruits were significantly (p < 0.05) different within and among populations, except fruit vertical diameter (FVD), fruit shape index (FSI), seed horizontal diameter (SHD) and seed shape index (SSI), which were not significantly different among populations (Table 3). The mean value of the population differentiation coefficient was 28.3%. The population differentiation for specific traits was generally less than 50%, except for leaf perimeter (LP), fruit lateral diameter (FLD) and seed lateral diameter (SLD). Most of the variation among trees in most traits occurs mainly within populations, yet there were still statistically significant differences among populations in 11 of the 15 traits studied (Table 3).

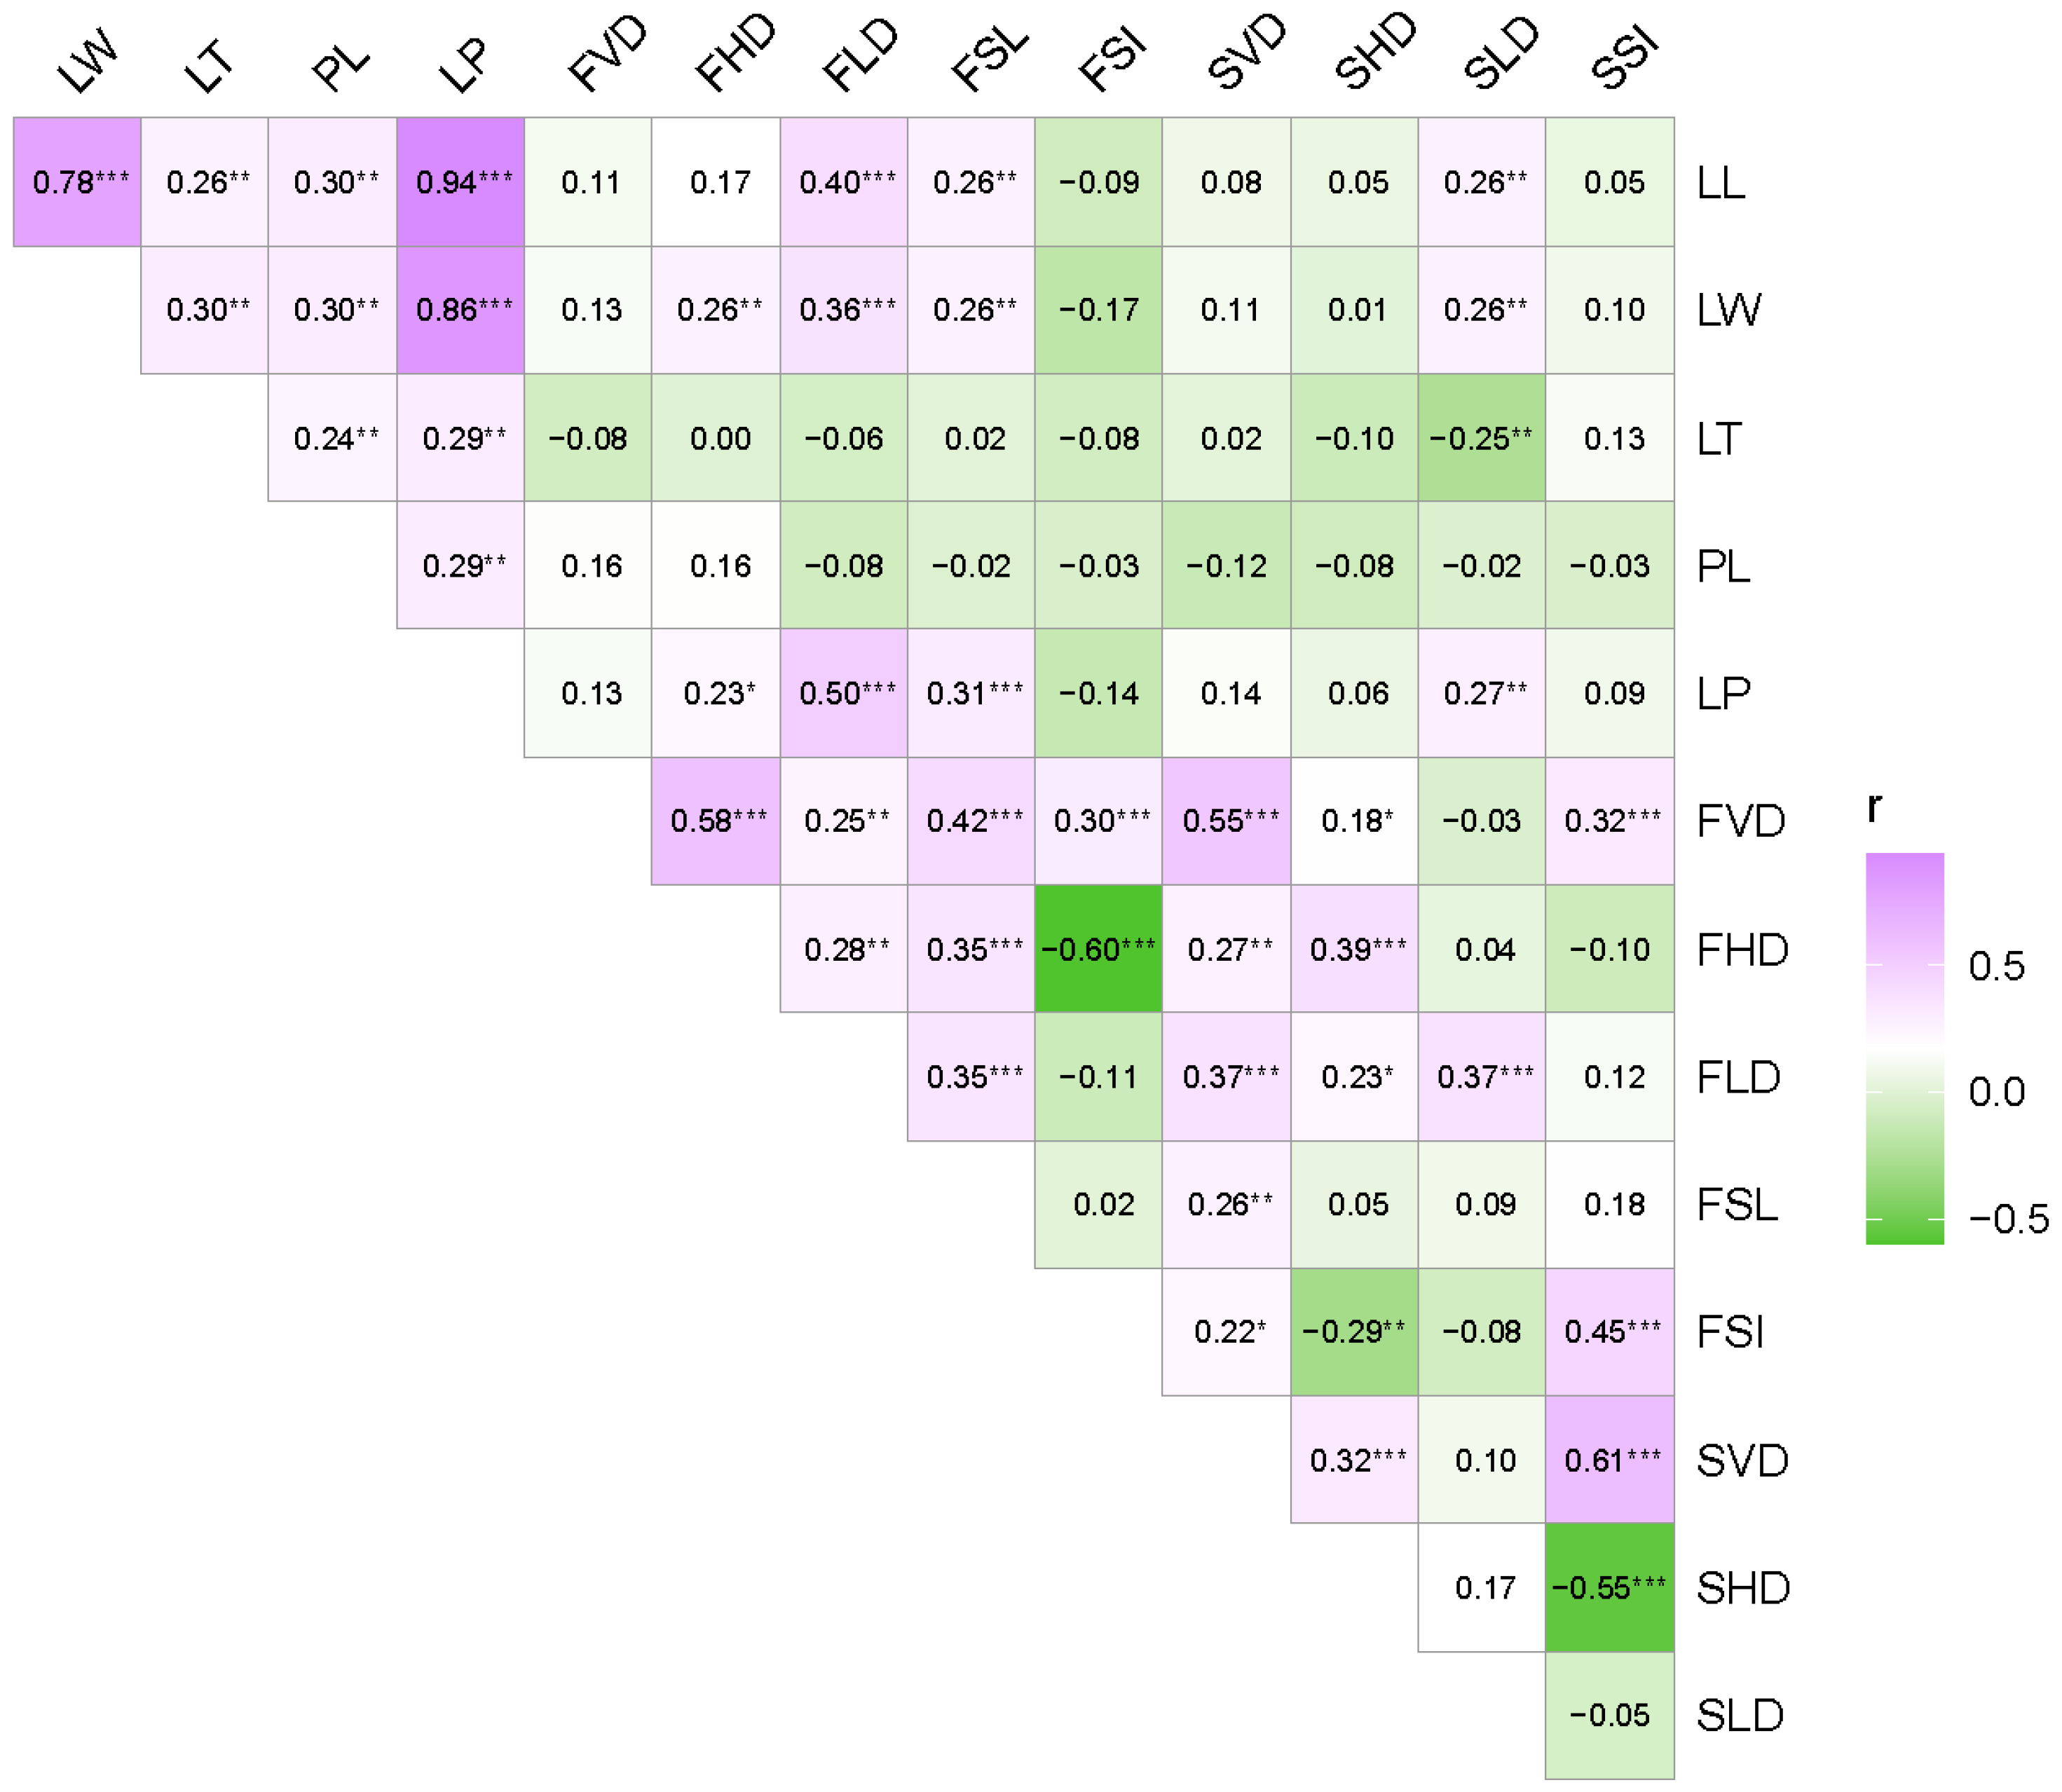
3.3. Correlations among the 15 Traits

The Pearson correlation coefficient was used to examine the correlations among the 15 phenotypic traits at tree means and depicted in Figure 3. All of the five leaf traits, LL, LW, LT, PL and LP, showed highly significant and positive correlations with each other, indicating that these five morphological traits covaried. In particular, leaf size (LL and LW) was most strongly correlated with LP. The larger the leaf, the larger the leaf perimeter. FVD was highly significantly and positively correlated with FHD, FLD, FSL, FSI, SVD and SHD, indicating that fruit size and seed size were correlated. The FSL was positively correlated with SVD but not with FSI and SSI, indicating that the longer the seed, the greater the proportion of seed wing. SVD was positively correlated with SHD and SSI, while SHD was negatively correlated with SSI, with a correlation coefficient of −0.55. Overall, among the significant correlations, most traits were positively correlated, except for the negative correlations between FSI and FHD, SLD and LT, FSI and SHD, SHD and SSI, and FSI and FrW.

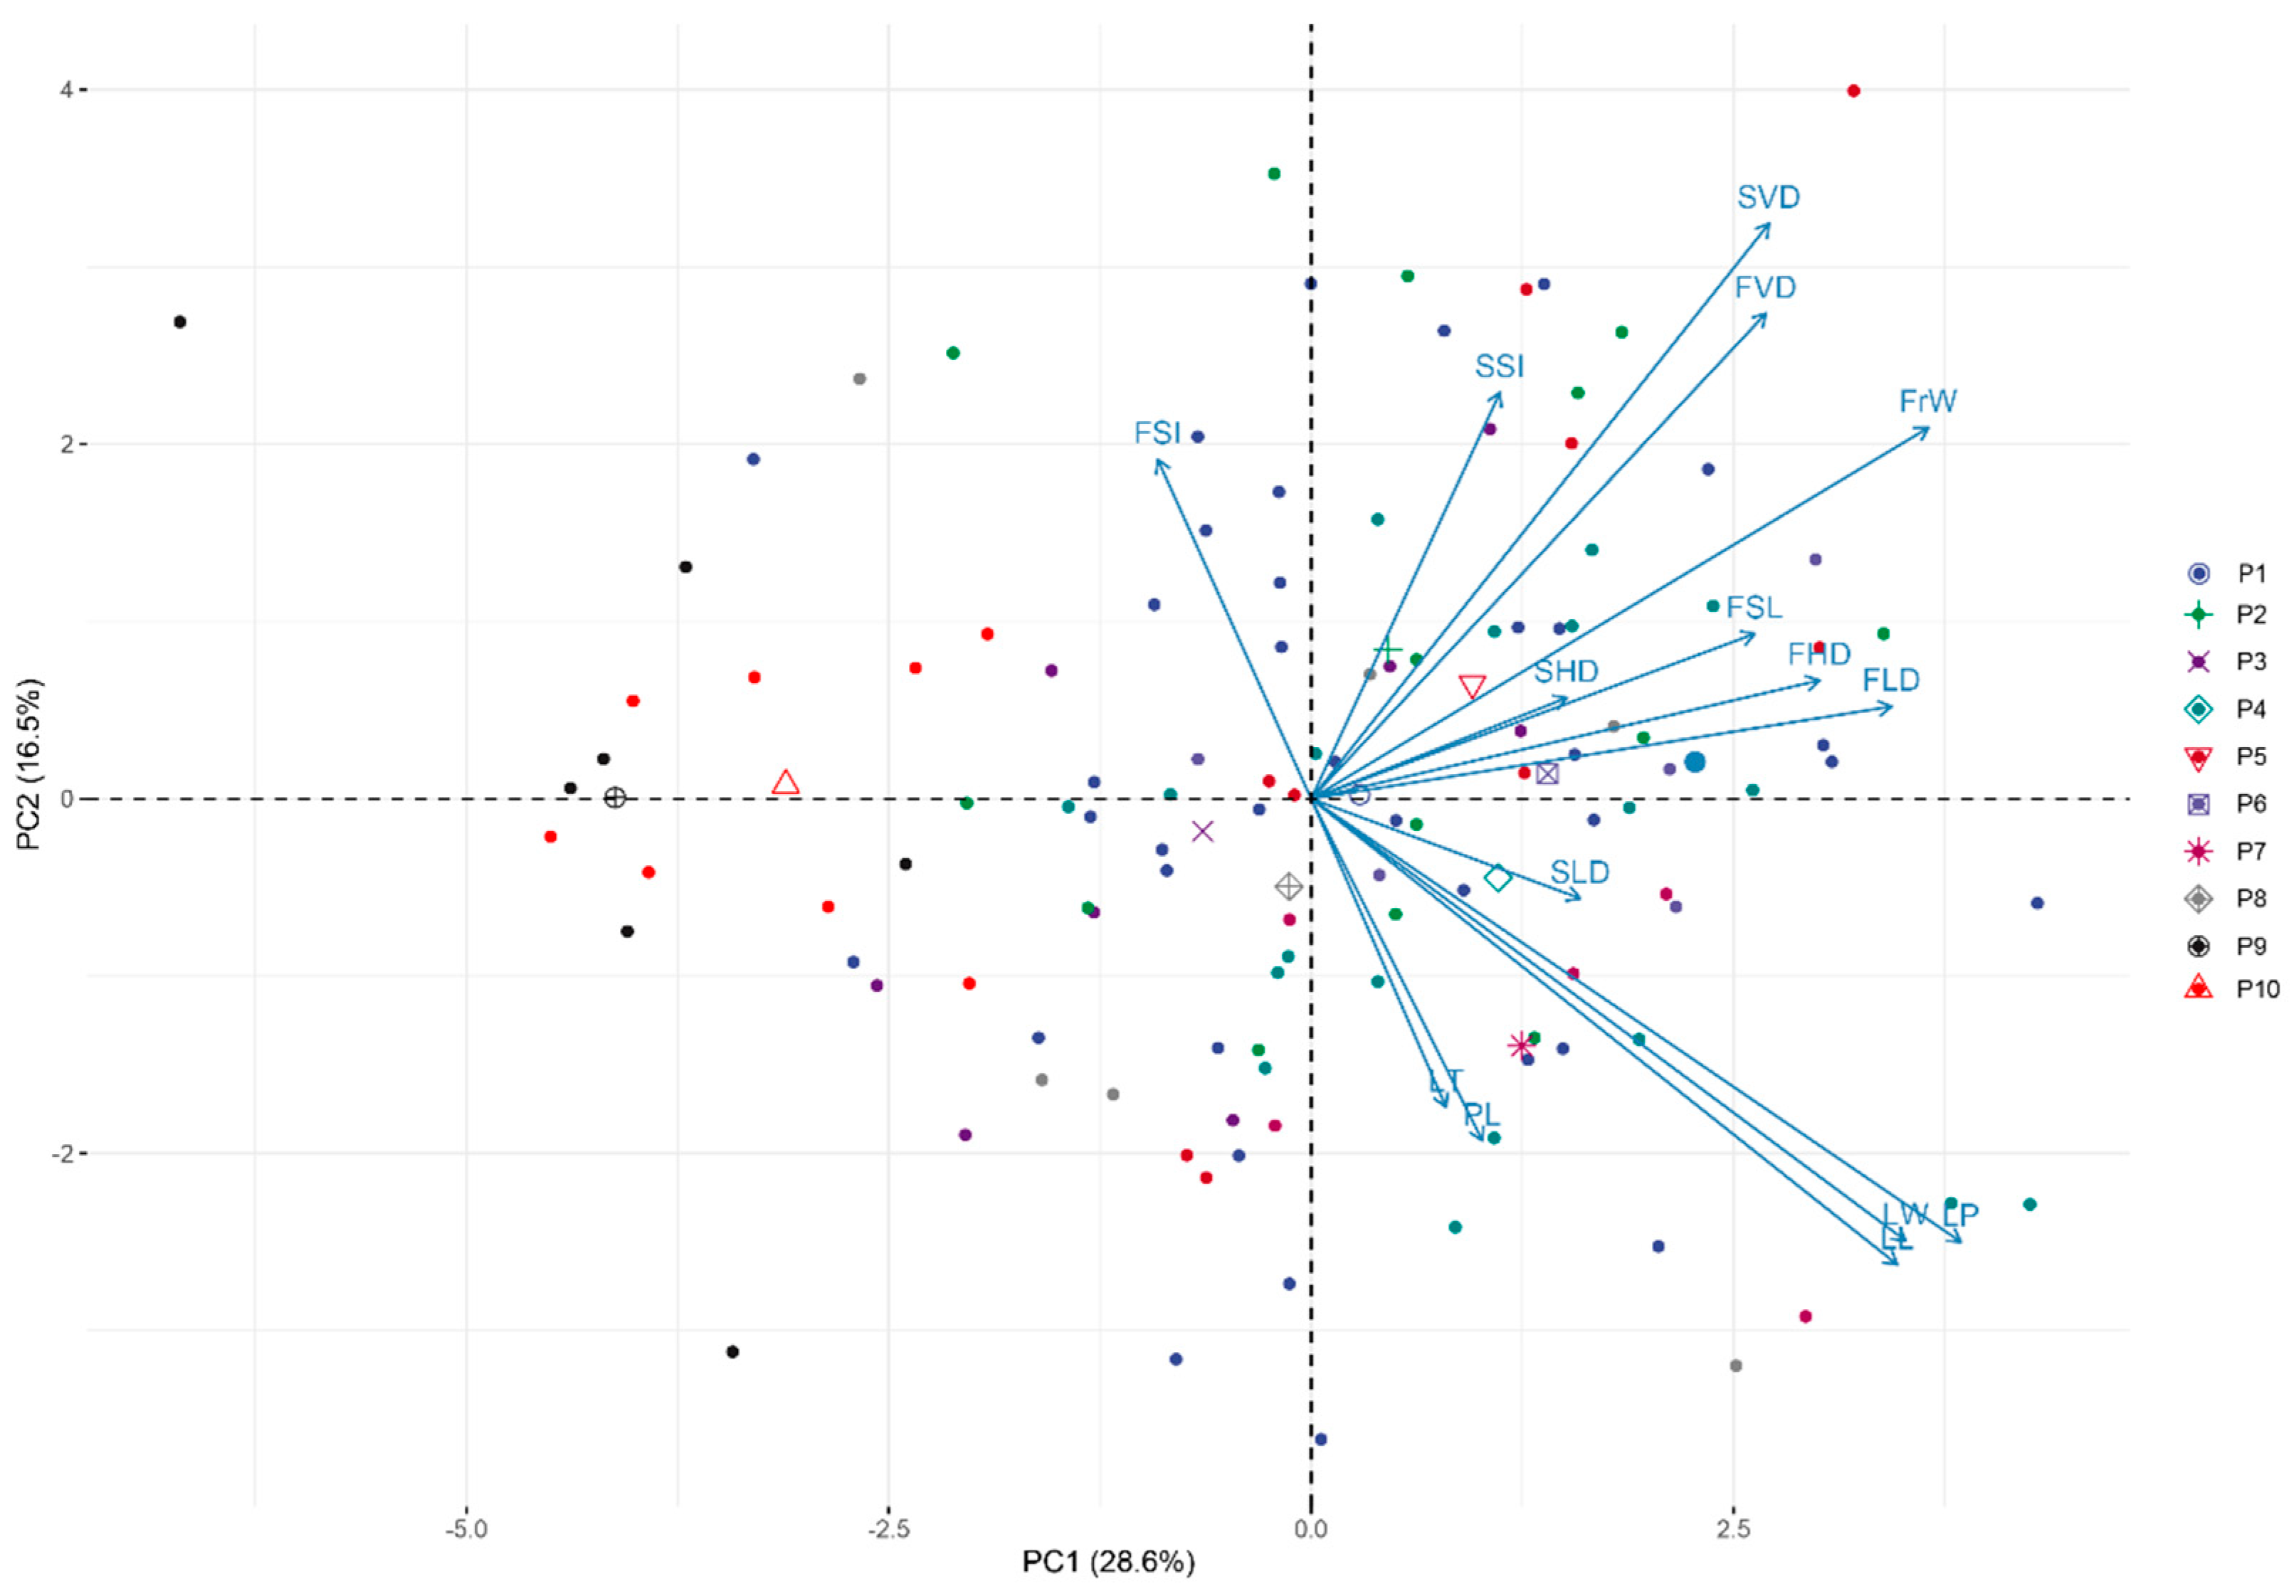
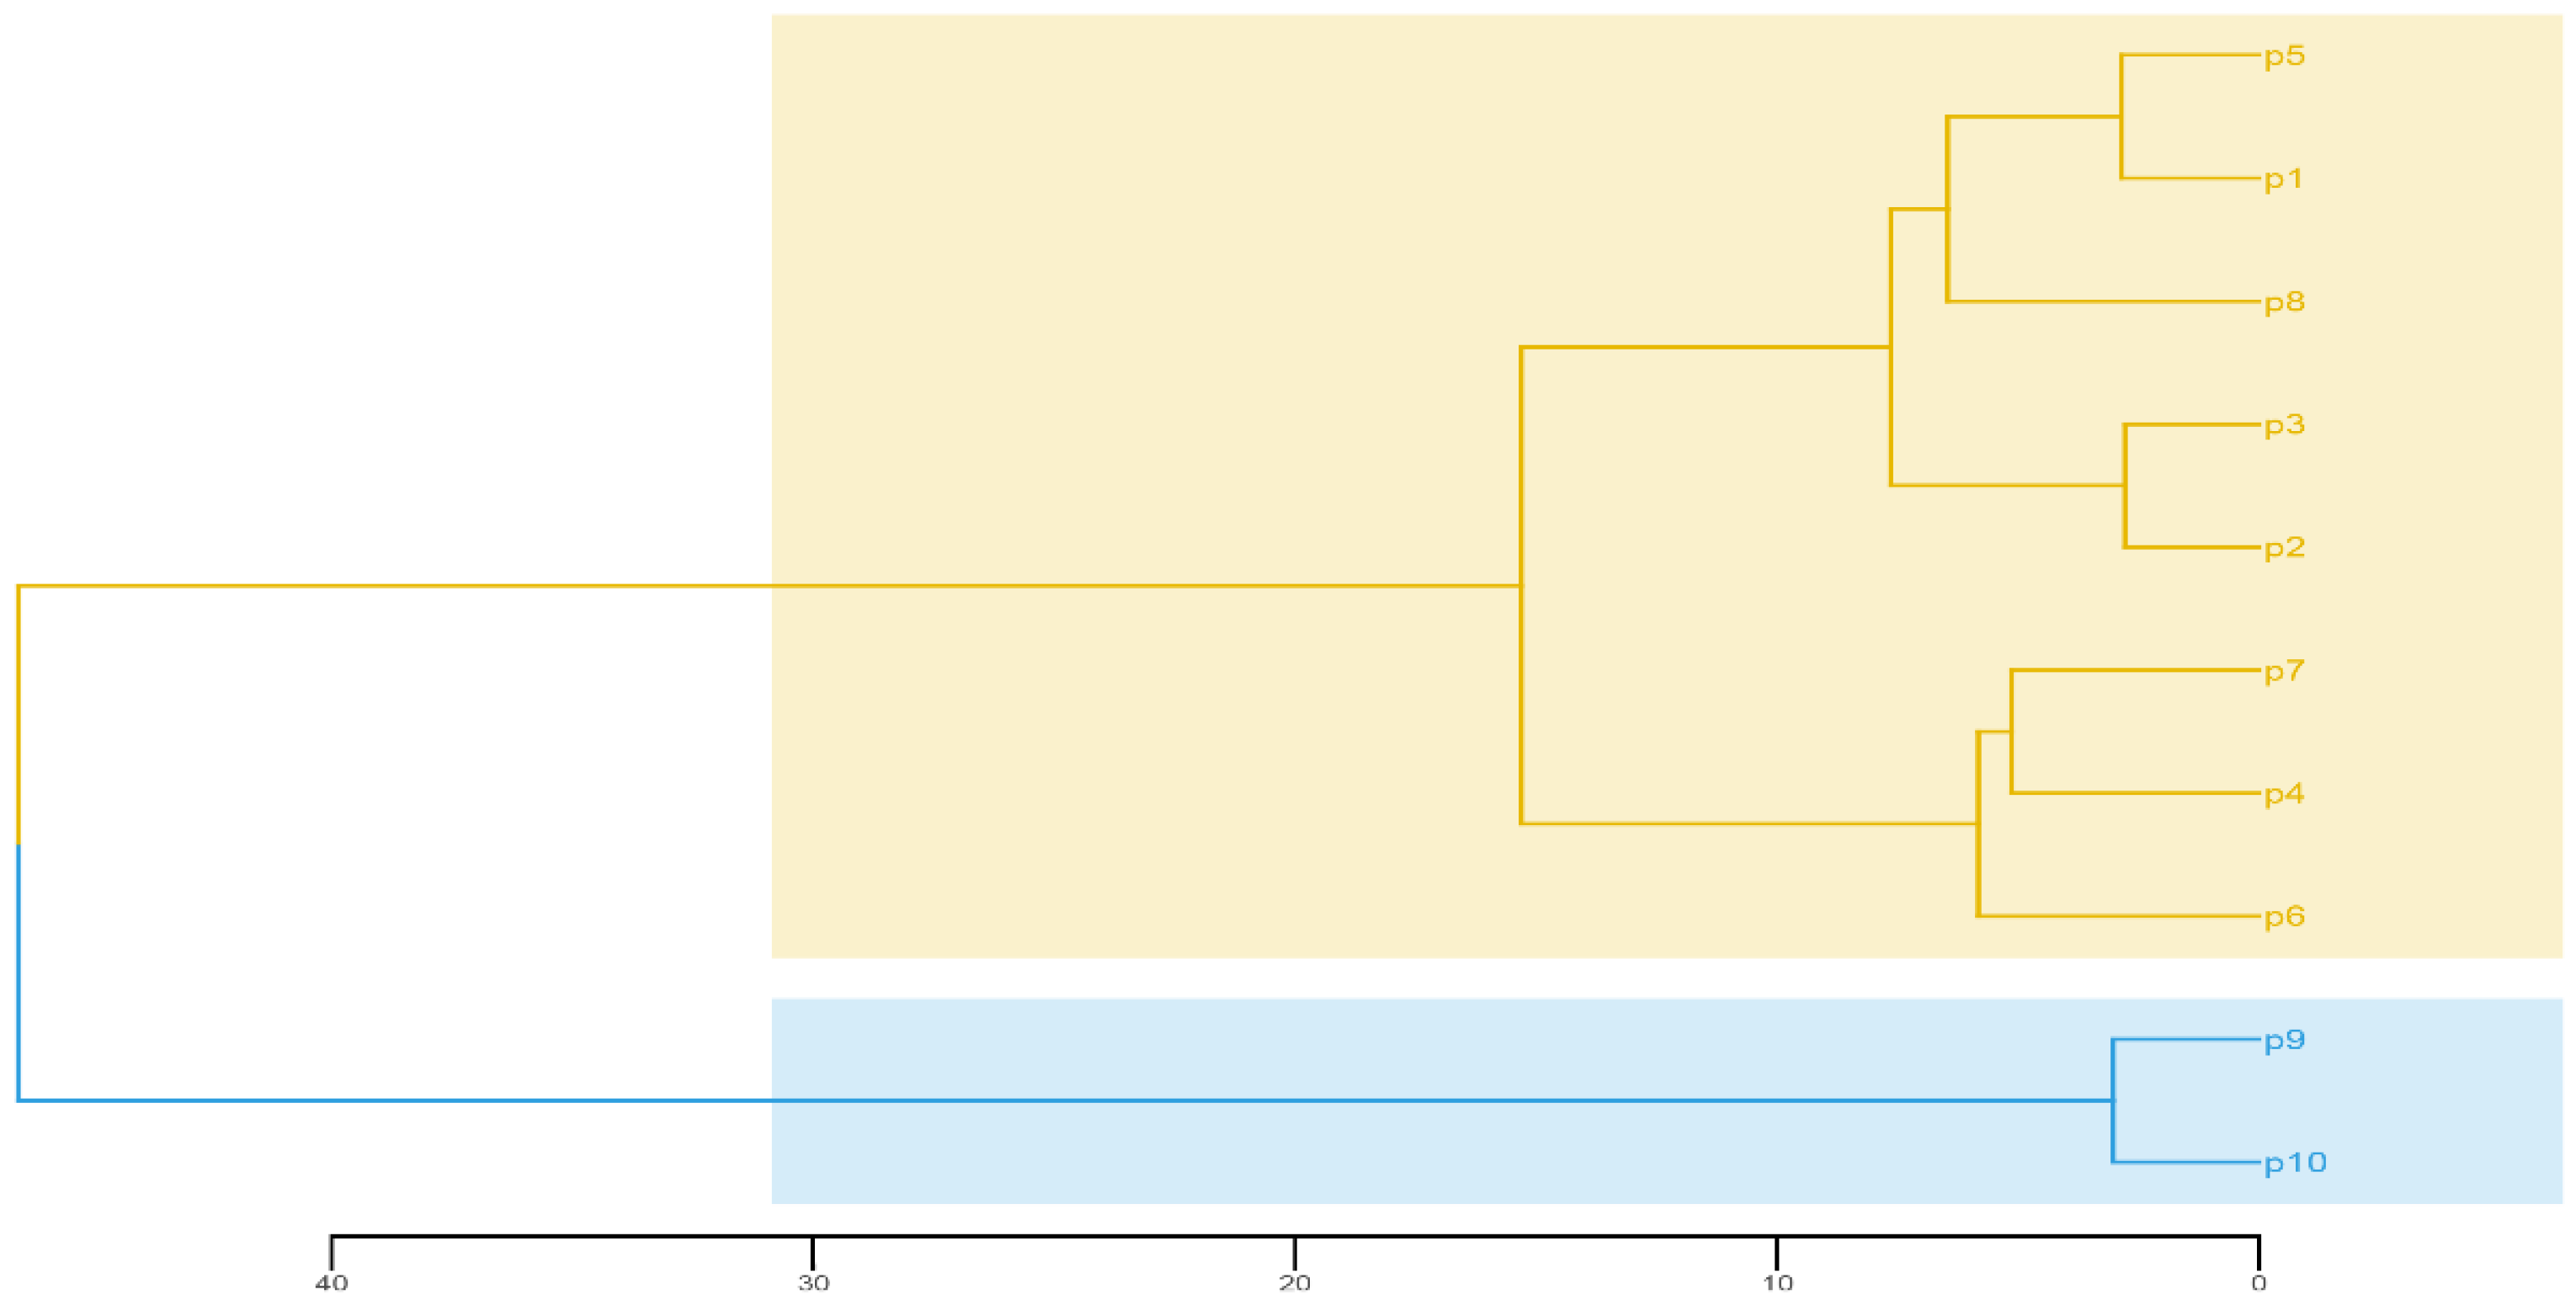
3.4. Principal Components and Cluster Analysis of the 15 Traits

Principal component analysis was used to summarize the among-tree variation in the 15 morphological traits into independent directions of variation (Table 4). The eigen values of the first five principal components were greater than 1, and together these accounted for 76.6% of the variation. The main direction of variation (PC1, 28.6%) was associated with plant organ size, having positive weights for all traits except FSI. The second principal component (PC2, 16.5%) represented a contrast of leaf size traits against fruit and many seed size traits, with positive values arising from smaller leaves and larger reproductive traits. The third principal component (PC3, 14.9%) was dominated mainly by a contrast of seed morphology (SSI, SHD) and fruit morphology (FSI, FHD). The biplot constructed by the first two principal components is presented in Figure 4. The continuous nature of the tree–tree variation is evident and there is overlap between all the studied populations in the two-dimensional space.
The P9 and P10 are located in the north of China and were in colder and drier conditions. As shown in Figure 4, the PC means of P9 and P10 were highly negative in PC1. It means that their leaves, fruits and seeds are significantly smaller than other populations. Based on the standardized population means for the 15 morphological traits, the 10 populations could be divided into two clusters using UPGMA method (Figure 5). The first cluster consisted of P1 to P8, and the second cluster included P9 and P10. Cluster analysis has a tendency to group according to geographical distance, indicating that geographical segregation exists in E. ulmoides.

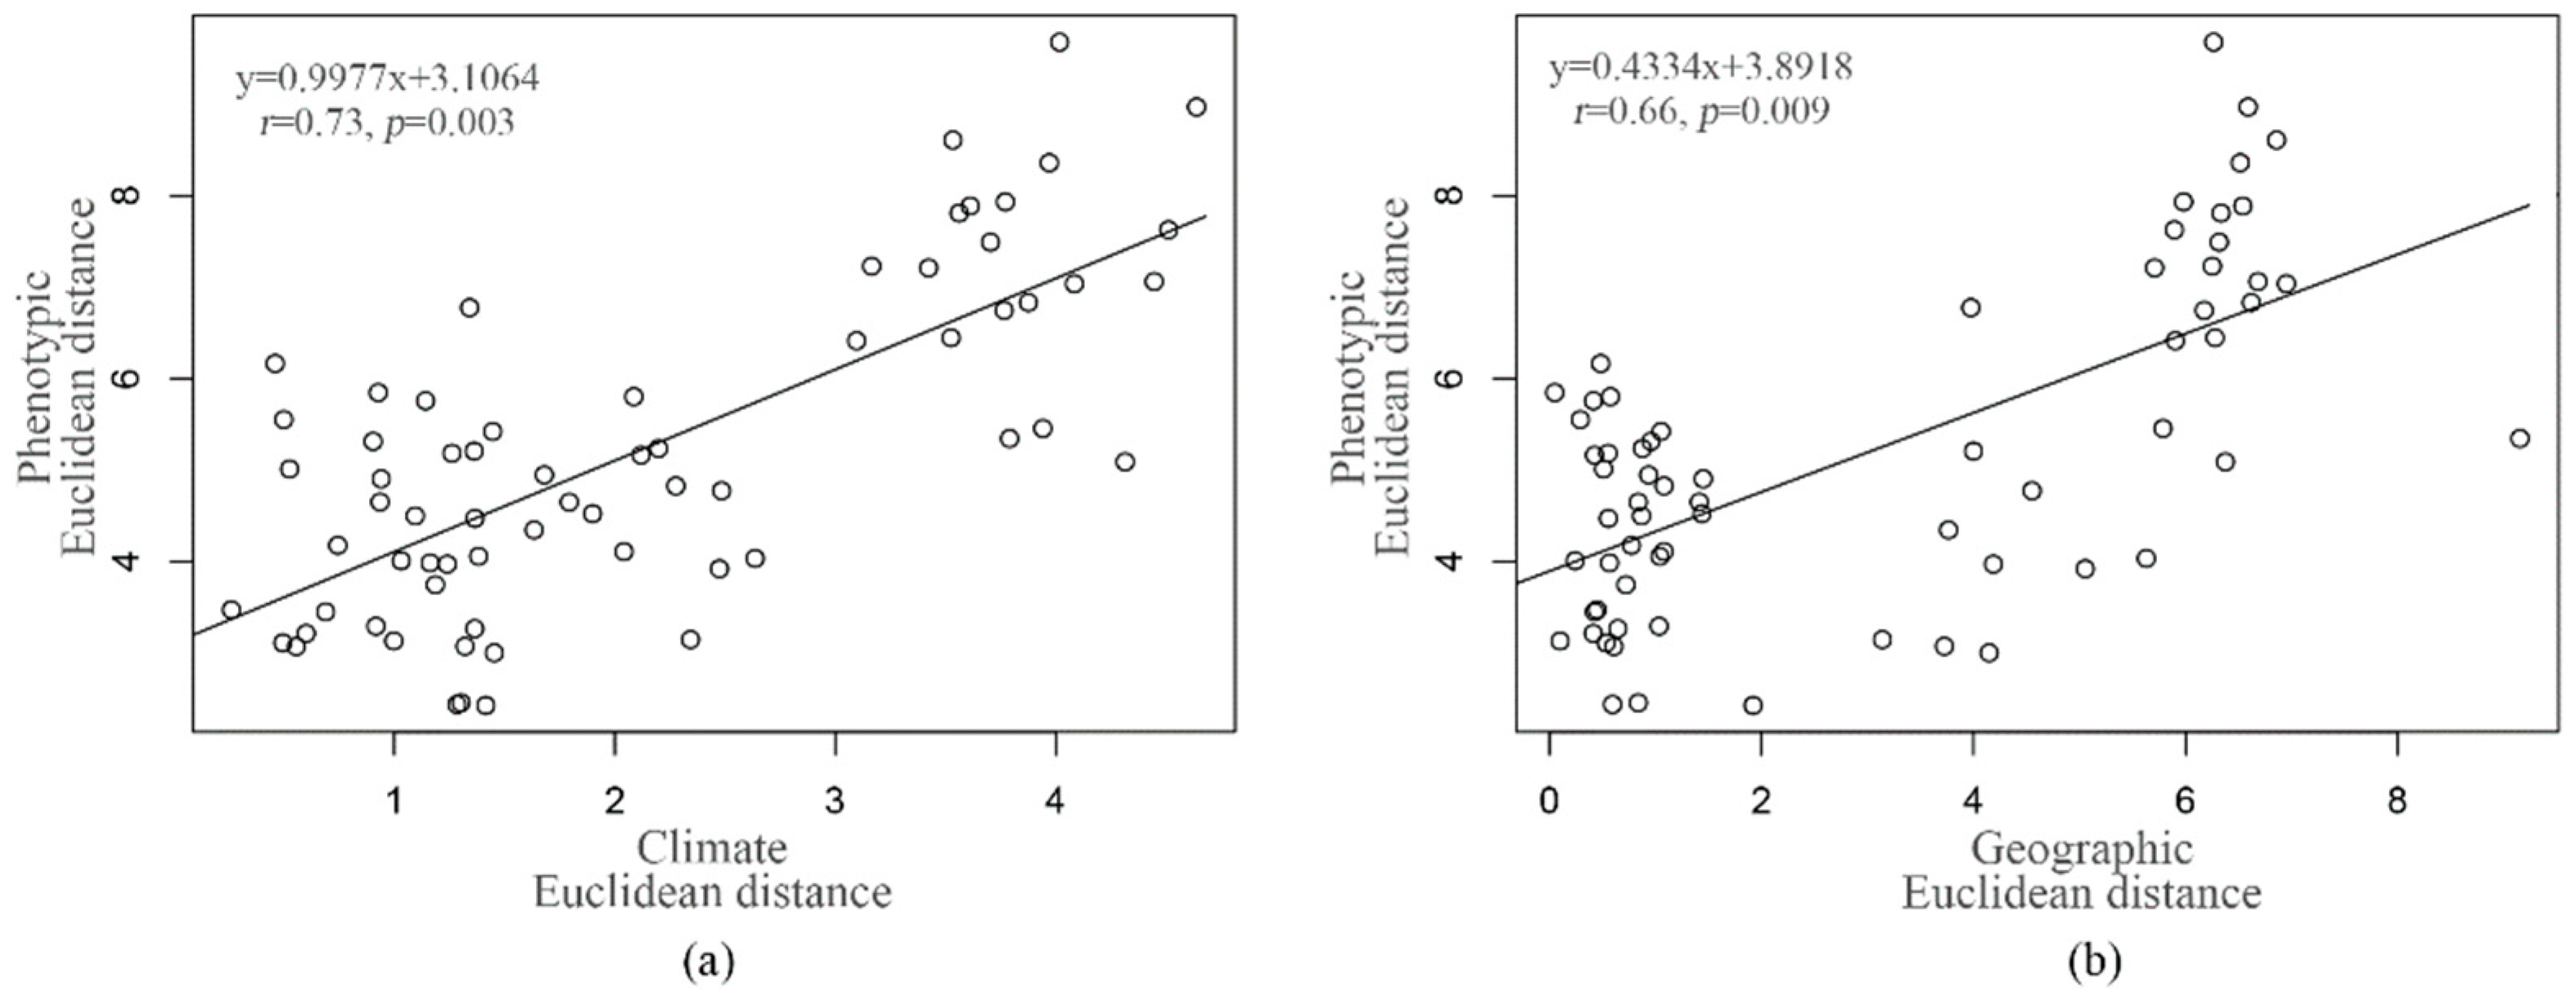
3.5. Correlations among the Morphological and Geographical or Climate Distances

The Mantel tests were performed to determine whether the observed phenotypic variance was better associated with climate than geographic distances among the studied populations. The results identified significant correlations between the phenotypic, geographical and climate distance matrices (Figure 6). Correlations were higher between phenotypic and climate distance matrices (r = 0.73, p = 0.003), and slightly smaller, but still statistically significant, correlations between phenotypic and geographical distance matrices (r = 0.66, p = 0.009). The geographic distance is highly correlated with climate distance (r = 0.90; p < 0.001), and the Partial Mantel test indicated that only the partial effect of climate was significant (Table 5).

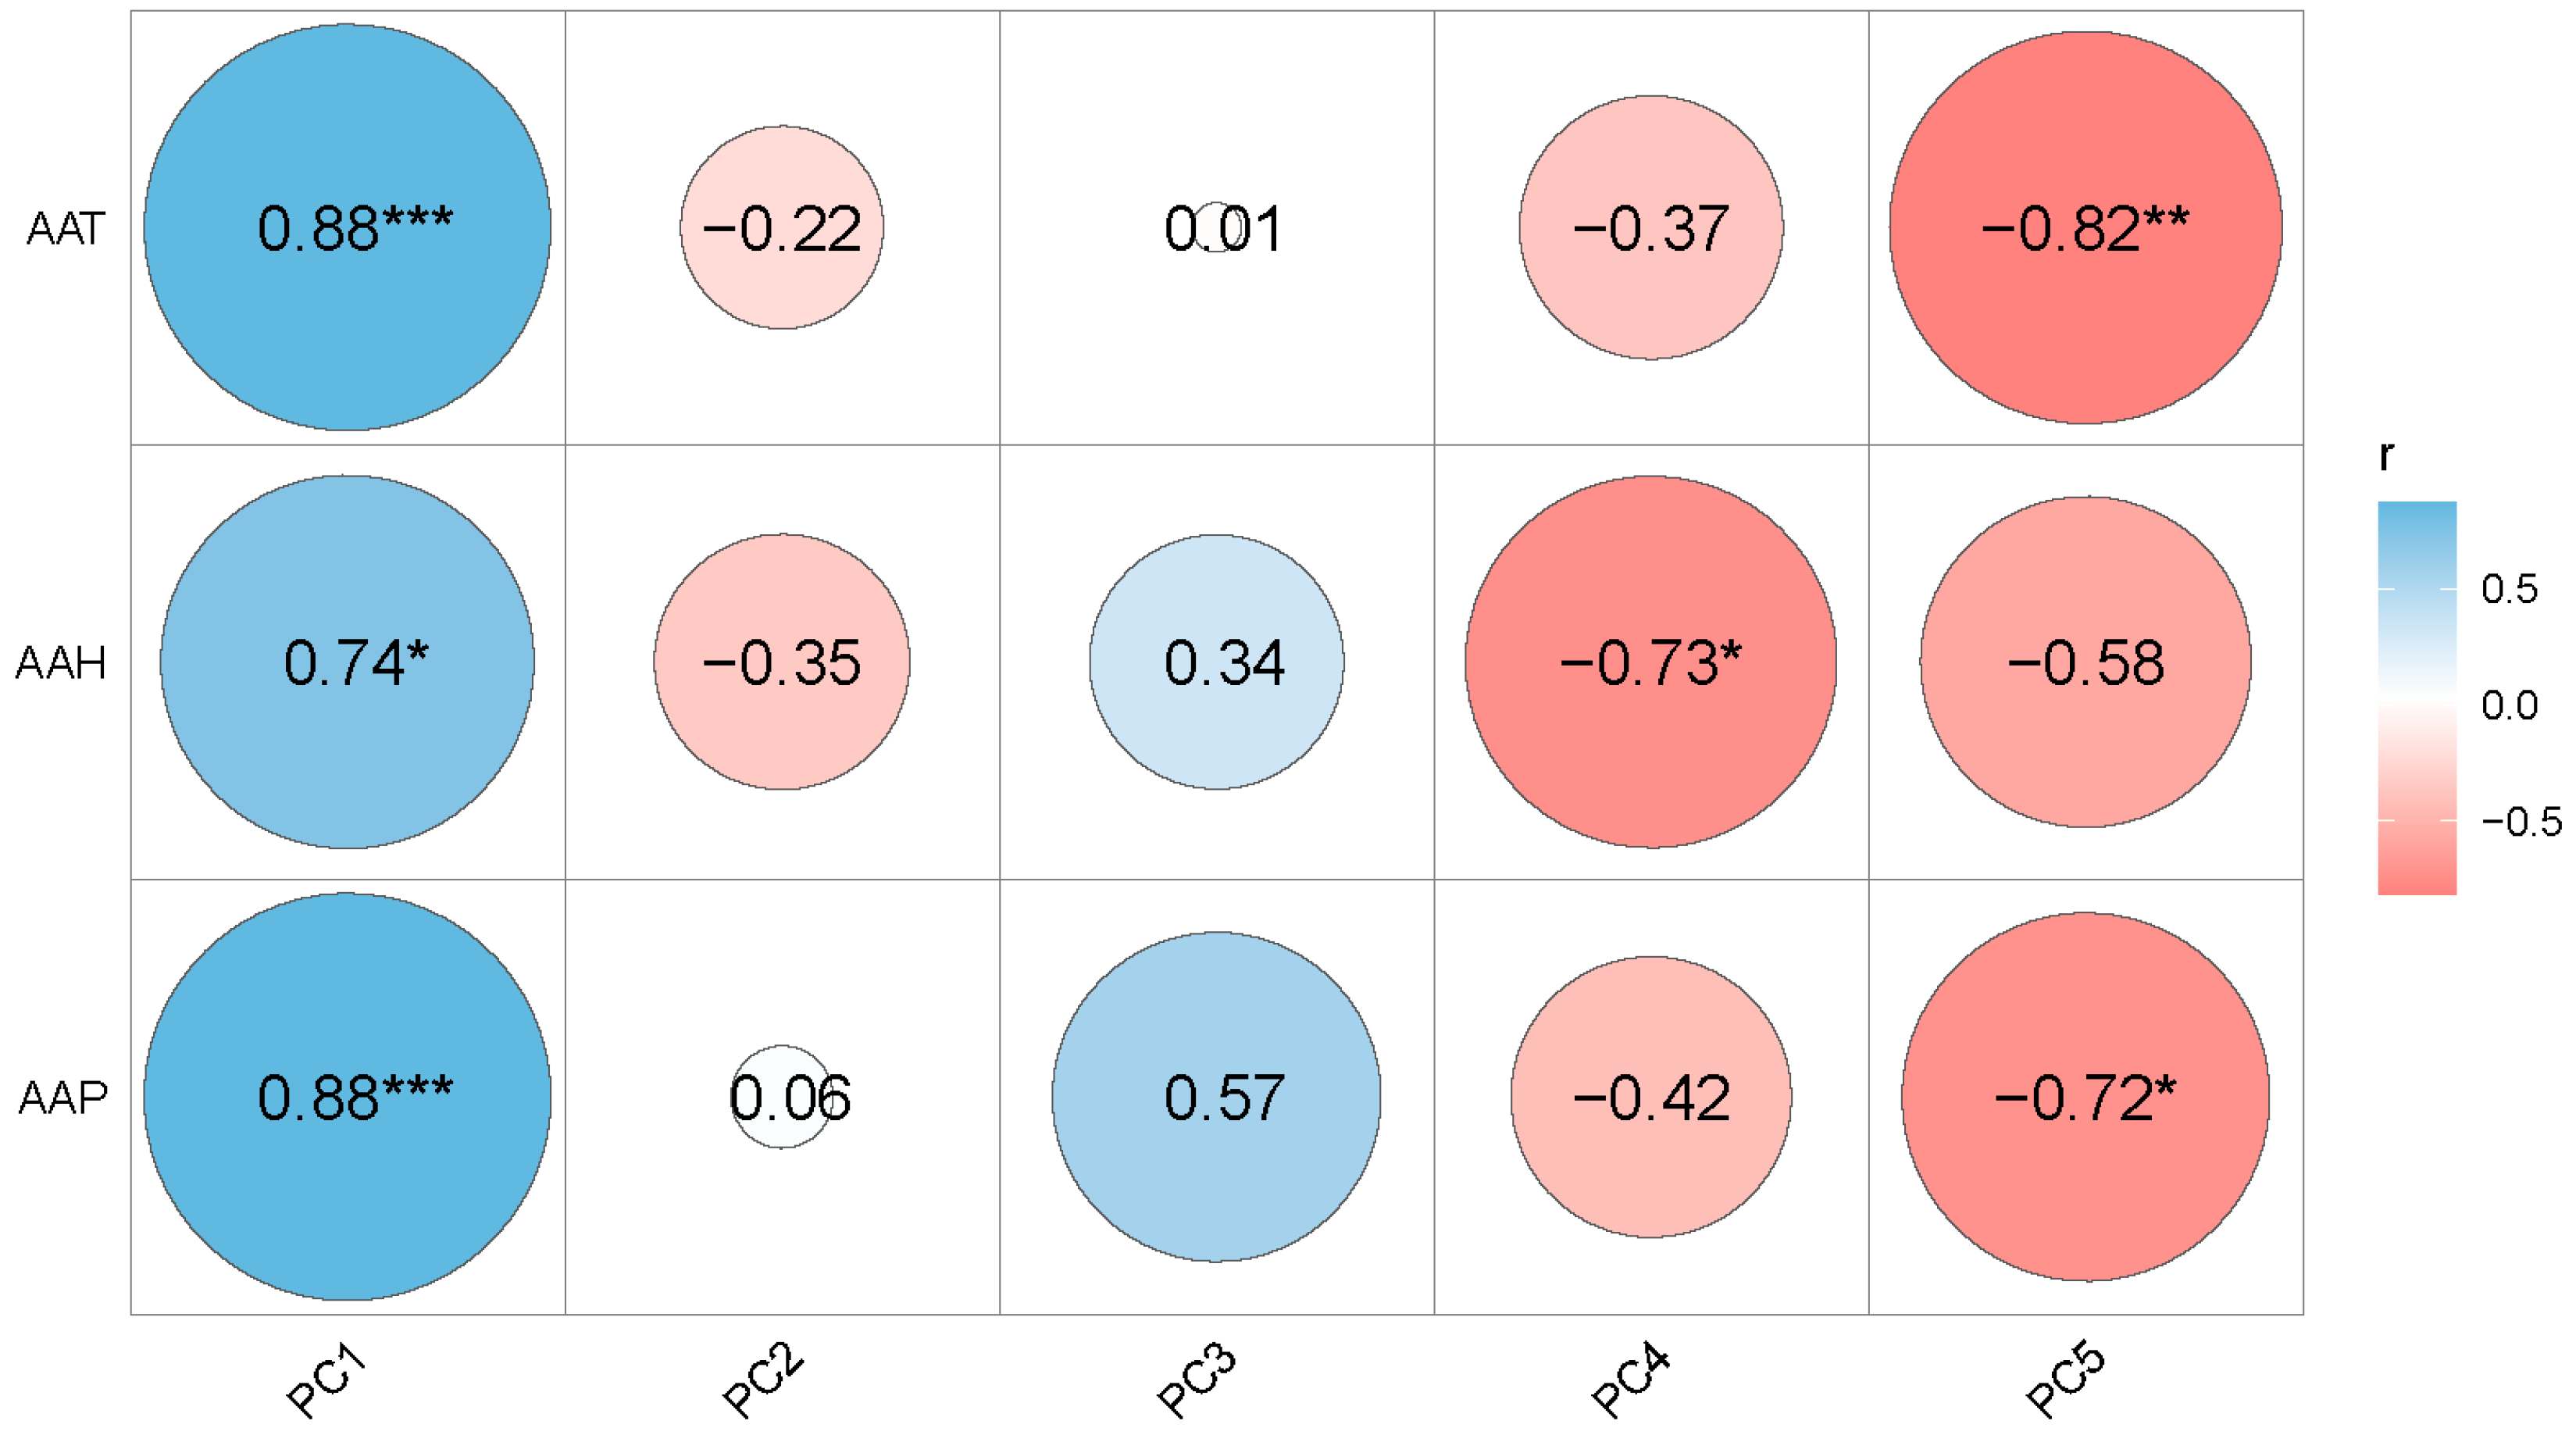
3.6. Associations among Principal Components and Climatic Factors

Figure 7 shows the correlations between all the five principal components and the climatic factors, Average Annual Temperature (AAT), Average Annual Precipitation (AAP) and Average Annual Humidity (AAH) at the population level. PC1, representing organ size, was significantly and positively correlated with the three climatic factors; PC4 was significantly and negatively correlated with AAH; PC5 was significantly and negatively correlated with both AAT and AAP. Stepwise regression was used to examine the contributions of the three climatic factors on PCs. The results showed that PC1 was mainly determined by the AAT and AAP rather than AAH (Table 6) (Figure 7). The model of the two variables explained 84.5% of the total variance in the PC1. In addition, PC3, PC4 and PC5 showed relatively good predictability with climate factors. PC3 was similar to PC1, mainly influenced by AAT and AAP, indicating that organ size and fruit shape were mainly influenced by AAP and AAH. PC4 and PC5 were affected by AAH and AAT, respectively, indicating that fruit plumpness was mainly influenced by AAH, and the traits closely related to resource utilization ability, such as LT and PL, were mainly influenced by AAT.

4. Discussion

The phenotypic variation of plants is the result of the combined action of genes and the environment over a long period of evolution [36]. The abundance of phenotypic variation may reflect, to a certain extent, its genetic diversity. Phenotyping of traits is the most direct method to survey and evaluate the diversity of forest germplasm resources, which is crucial for their reasonable breeding and conservation [34]. In this study, we comprehensively assessed the variation of 15 phenotypic traits in leaves, fruits and seeds of E. ulmoides from 10 natural populations. We also investigated the relationships between these traits and geoclimatic factors and the effects of these factors on phenotypic variation.
The coefficient of variation (CV) reflects the amount of variation discovered in E. ulmoides germplasm resources for each trait. In this study, for leaf traits, the mean CV was 29.23%, nearly twice as high as that for fruit and seed traits (15.48%). Besides their fundamental biological functions, leaves are essential for long-term adaptation, survival, and evolution, which most likely result in their most abundant variation among the traits of interest in natural populations [37,38,39]. The multi-site experiments on E. ulmoides also confirmed that leaf traits had the greatest amount of variation [40]. The mean CV of leaf traits in natural populations was much higher than those in common gardens (11.41%~17.78%) [9,26] with homogeneous environmental conditions, showing the leaf traits were more susceptible to environmental factors, although this was partly due to the difference in genetic backgrounds. For fruit and seed traits, more stable variation characteristics were observed, in agreement with previous reports of E. ulmoides [22] and other forest tree species such as Malania oleifera Chun et S.K. Lee [34]. Therefore, fruit and seed morphological traits were more reliable to perform plus tree selection for the following breeding programs. Subsequently, we will establish multi-site multi-provenance trials with open-pollinated progeny from these trees to dissect the genetic and phenotypic plasticity for these traits using pedigree or kinship information generated by molecular markers. In addition, from the prospective of protection of genetic resources, it is necessary to conduct genetic diversity evaluation in these trees with molecular techniques.
The phenotypic differentiation coefficient reflects the differentiation of the species on traits, and a higher coefficient indicates that population differentiation is more likely to occur. In the present study, we found that the phenotypic differentiation coefficients of fruit lateral diameter, seed lateral diameter and 100-fruit weight were higher than other traits. The maturation of E. ulmoides fruits and seeds reaches a plateau in close of August, then shifts towards accumulating secondary metabolite and increasing in size, with a slow increase in longitudinal diameter [41]. Our sampling was carried out from September to October, and we found that fruits from later collected populations were more mature and plumper than the earlier ones, which could partly explain most of the differentiation observed between populations for fruit lateral diameter, seed lateral diameter and 100-fruit weight. In addition, previous studies using molecular markers shown that within-population differentiation accounts for most of the total genetic variation [42,43,44], suggesting that the traits with higher phenotypic differentiation coefficients may be susceptible to environmental or developmental factors, or to inaccurate measurement. Furthermore, Mantel test results showed that the phenotypic differentiation in E. ulmoides was strongly associated with geographic distance and, in particular, climate (Figure 6 and Table 5), which was also supported by previous studies [45,46]. Additionally, the PCA and cluster analysis were consistent with the results of the Mantel test. Overall, the geographical distribution of the 15 phenotypic traits of E. ulmoides reflects, to some extent, a pattern dominated by latitudinal changes, demonstrating the influence of latitude on the traits’ distribution. With increasing latitude, temperature and precipitation decreased, and the size of leaves, fruits and seeds in E. ulmoides tended to become smaller. These results highlight the importance of considering temperature and precipitation when introducing E. ulmoides into new regions, especially in northern China.
Based on the results of this research and the current situation of indiscriminate deforestation in E. ulmoides resources, the following strategies are proposed for its plus tree selection, protection and management: (1) the trait with higher CV and lower phenotypic differentiation coefficient is more reliable to use as a selection target; (2) it is crucial to minimize human activity to preserve current resources and habitats; (3) establishing natural reserves and ex situ germplasm conservation through artificial propagation are advisable.

5. Conclusions

The leaves, fruits and seeds of natural populations of E. ulmoides were highly significantly different between and within populations, with abundant phenotypic diversity. The fruit traits were more stable than the leaf traits. Most of the phenotypic variation among trees of E. ulmoides occurred within populations. Therefore, when collecting and preserving germplasm resources, representative populations should be selected and the sample size should be increased, in order to ensure that the collected and preserved sample populations have sufficient genetic variation. In the cluster analysis, two populations of northern E. ulmoides with similar geographical environment (low temperature and dry environment) and phenotypic traits were clustered into one group, which is consistent with the objective rule that the same species has similar phenotypes in similar environments. Correlation and cluster analyses showed that geographical environment and climatic conditions were important factors influencing phenotypic variation in E. ulmoides, with mean annual temperature and mean annual precipitation being the dominant factors. Populations of E. ulmoides growing under the harsh climatic conditions of low temperature and drought had smaller leaves, fruits and seeds than other populations, but these conditions may facilitate the biosynthesis and accumulation of plant secondary metabolites. In future research, we should systematically reveal the genetic basis of the phenotypic variation among and within natural populations of E. ulmoides using common garden trials in combination with molecular biology techniques. Such information is required to advance the study of genetic diversity of E.ulmoides and the conservation, evaluation and utilization of its germplasm resources.

Author Contributions

C.T. designed the research; C.W. and M.F. conducted the research; H.G. analyzed the data; C.W. wrote the paper. All authors have read and agreed to the published version of the manuscript.

Funding

This work was funded by the National Natural Science Foundation of China (32160388).

Institutional Review Board Statement

Not applicable.

Informed Consent Statement

Not applicable.

Data Availability Statement

Not applicable.

Acknowledgments

The authors would like to thank the three reviewers for their constructive comments, which have greatly improved the article.

Conflicts of Interest

The authors declare no conflict of interest.

References

  1. Takeno, S.; Bamba, T.; Nakazawa, Y.; Fukusaki, E.; Okazawa, A.; Kobayashi, A. Quantification of trans-1,4-polyisoprene in Eucommia ulmoides by fourier transform infrared spectroscopy and pyrolysis-gas chromatography/mass spectrometry. J. Biosci. Bioeng. 2008, 105, 355–359. [Google Scholar] [CrossRef]
  2. He, X.R.; Wang, J.H.; Li, M.X.; Hao, D.J.; Yang, Y.; Zhang, C.L.; He, R.; Tao, R. Eucommia ulmoides oliv.: Ethnopharmacology, phytochemistry and pharmacology of an important traditional chinese medicine. J. Ethnopharmacol. 2014, 151, 78–92. [Google Scholar] [CrossRef]
  3. Hussain, T.; Tan, B.E.; Liu, G.; Oladele, O.A.; Rahu, N.; Tossou, M.C.; Yin, Y.L. Health-promoting properties of Eucommia ulmoides: A review. Evid. Based Complement. Alternat. Med. 2016, 2016, 5202908. [Google Scholar] [CrossRef] [Green Version]
  4. Wang, C.Y.; Tang, L.; He, J.W.; Li, J.; Wang, Y.Z. Ethnobotany, phytochemistry and pharmacological properties of Eucommia ulmoides: A review. Am. J. Chin. Med. 2019, 47, 259–300. [Google Scholar] [CrossRef]
  5. Nakazawa, Y.; Bamba, T.; Takeda, T.; Uefuji, H.; Harada, Y.; Li, X.H.; Chen, R.; Inoue, S.; Tutumi, M.; Shimizu, T.; et al. Production of eucommia-rubber from Eucommia ulmoides oliv. (hardy rubber tree). Plant Biotechnol. 2009, 26, 71–79. [Google Scholar] [CrossRef] [Green Version]
  6. Goldberg, S.D.; Zhao, Y.L.; Harrison, R.D.; Monkai, J.; Li, Y.W.; Chau, K.T.; Xu, J.C. Soil respiration in sloping rubber plantations and tropical natural forests in xishuangbanna, china. Agric. Ecosyst. Environ. 2017, 249, 237–246. [Google Scholar] [CrossRef]
  7. Wuyun, T.N.; Wang, L.; Liu, H.M.; Wang, X.W.; Zhang, L.S.; Bennetzen, J.L.; Li, T.Z.; Yang, L.R.; Liu, P.F.; Du, L.Y.; et al. The hardy rubber tree genome provides insights into the evolution of polyisoprene biosynthesis. Mol. Plant 2018, 11, 429–442. [Google Scholar] [CrossRef] [PubMed] [Green Version]
  8. Deng, P.; Wang, Y.; Hu, F.; Yu, H.; Liang, Y.; Zhang, H.; Wang, T.; Zhou, Y.; Li, Z. Phenotypic trait subdivision provides new sight into the directional improvement of Eucommia ulmoides oliver. Front. Plant Sci. 2022, 13, 832821. [Google Scholar] [CrossRef] [PubMed]
  9. Qing, J.; Meng, Y.D.; Liu, C.L.; Du, Q.X.; Du, H.Y.; Du, L.Y.; Huang, H.Y.; Li, X.J.; Wang, L. Analysis of leaf phenotypic variation and evaluation of elite individual plant in F1 progeny of Eucommia ulmoides. J. Southwest For. Univ. 2022, 42, 18–29. [Google Scholar]
  10. Zhang, K.J.; Bai, M.S.; Zhang, T.; Ma, X.H.; Gao, J.M. A study on the growth features of individuals and secondary metabolites of Eucommia ulmoides leaves. Sci. Silv. Sin. 2001, 37, 45–51. [Google Scholar]
  11. Qian, C.; Zhang, R.; Li, J.; Huang, Z.; Liu, X.; Yu, L.; Yan, L.; Fu, Y. The characteristics of habitat, functional traits and medicinal components of Eucommia ulmoides from guizhou (vol 29, pg 12629, 2022). Environ. Sci. Pollut. Res. 2022, 29, 32299–32302. [Google Scholar] [CrossRef] [PubMed]
  12. Liu, W.; Zheng, L.; Qi, D. Variation in leaf traits at different altitudes reflects the adaptive strategy of plants to environmental changes. Ecol. Evol. 2020, 10, 8166–8175. [Google Scholar] [CrossRef]
  13. Call, V.B.; Dilcher, D.L. The fossil record of Eucommia (Eucommiaceae) in north america. Am. J. Bot. 1997, 84, 798–814. [Google Scholar] [CrossRef]
  14. Geng, B.Y.; Manchester, S.R.; Lu, A.M. The first discovery of eucommia fruit fossil in china. Chin. Sci. Bull. 1999, 44, 1506–1508. [Google Scholar] [CrossRef]
  15. Wang, Y.F.; Li, C.S.; Collinson, M.E.; Lin, J.; Sun, Q.G. Eucommia (Eucommiaceae), a potential biothermometer for the reconstruction of paleoenvironments. Am. J. Bot. 2003, 90, 1–7. [Google Scholar] [CrossRef] [PubMed]
  16. Li, H.G.; Jia, H.Y.; Li, W.Z.; Du, H.Y.; Wuyun, T.N.; Liu, P.F.; Bao, W.Q. Genetic diversity and genetic structure of Eucommia ulmoides populations based on SSR markers. J. Cent. South Univ. For. Technol. 2018, 38, 79–85, 120. [Google Scholar]
  17. Du, H.Y. China Eucommia Pictorial; China Forestry Publishing House: Beijing, China, 2014. [Google Scholar]
  18. Du, H.Y.; Hu, W.Z.; Yu, R. The Report on Development of China’s Eucommia Rubber Resources and Industry (2014–2015); Social Sciences Academic Press: Beijing, China, 2015. [Google Scholar]
  19. Zhou, Z.X. Eucommia Ulmoides; Guizhou People’s Press: Guizhou, China, 1980. [Google Scholar]
  20. Liu, Z.R.; Gao, C.J.; Li, J.; Miao, Y.C.; Cui, K. Phenotypic diversity analysis and superior family selection of industrial raw material forest species-Pinus yunnanensis Franch. Forests 2022, 13, 618. [Google Scholar] [CrossRef]
  21. Edelaar, P.; Jovani, R.; Gomez-Mestre, I. Should i change or should i go? Phenotypic plasticity and matching habitat choice in the adaptation to environmental heterogeneity. Am. Nat. 2017, 190, 506–520. [Google Scholar] [CrossRef]
  22. Du, Q.X.; Liu, P.F.; Qing, J.; Du, H.Y. Genetic diversity analysis on morphology traits of Eucommia ulmoides male flowers. For. Res. 2016, 29, 670–675. [Google Scholar]
  23. Du, Q.X.; Qing, J.; Liu, P.F.; Wang, L.; Du, L.Y.; He, F.; Du, H.Y. Variation in fruit traits of Eucommia ulmoides germplasm resourcesand their comprehensive evaluation. For. Res. 2021, 34, 13–23. [Google Scholar]
  24. Zhou, Q.; Chen, G.X.; Xiong, L.Z.; Huang, M.; Liu, C.; Cai, Z.X. Diversity of samara characters of Euocmmia ulmoides in western of hunan. J. Cent. South Univ. For. Technol. 2014, 34, 14–19. [Google Scholar]
  25. Lan, J.Y.; Liu, Z.; Zhang, Q.; Pei, Z.C.; Li, B.H. A study on growth characteristics of Eucommia ulmoides oliver in different areas and the dynamic changes of main effective components in leaves. J. Agric. Univ. Hebei 2019, 42, 51–56. [Google Scholar]
  26. Wei, Y.C.; Li, Z.Q.; Li, Y.; Chang, L. Genetic analysis of morphological traits of Eucommia ulmoides Oliver’s hybrid offspring. J. Northwest Sci.-Tech. Univ. Agric. For. (Nat. Sci. Ed.) 2012, 40, 137–143. [Google Scholar]
  27. Xiao, C.H.; Zhou, T.; Jiang, W.K.; Deng, D.M.; Zhao, D.; Xiong, H.X. Analysis of genetic diversity of cultivated Eucommia ulmoides from guizhou province by phenotypic traits and SCoT markers. J. Chin. Med. Mater. 2014, 37, 1343–1349. [Google Scholar]
  28. Zheng, X.; Meng, C.; Ji, Z.; Wang, Y. Phenotypic diversity of leaves morphologic characteristics of Ulmus lamellosa natural populations in shanxi. Acta Hortic. Sin. 2013, 40, 1951–1960. [Google Scholar]
  29. Keylock, C.J. Simpson diversity and the Shannon-Wiener index as special cases of a generalized entropy. Oikos 2005, 109, 203–207. [Google Scholar] [CrossRef]
  30. R Core Team. R: A Language and Environment for Statistical Computing; R Foundation for Statistical Computing: Vienna, Austria, 2016; Available online: http://www.R-project.org/ (accessed on 25 June 2022).
  31. Koutecky, P. MorphoTools: A set of R functions for morphometric analysis. Plant Syst. Evol. 2015, 301, 1115–1121. [Google Scholar] [CrossRef]
  32. Mantel, N. Detection of disease clustering and a generalized regression approach. Cancer Res. 1967, 27, 209. [Google Scholar]
  33. Legendre, P.; Fortin, M.J. Spatial pattern and ecological analysis. Vegetatio 1989, 80, 107–138. [Google Scholar] [CrossRef]
  34. Li, H.; Wang, R.; Tian, Z.; Xu, J.; Sun, W.; Duan, R.; Fu, H.; Li, Y.; Zhang, Y.; Dong, L. Phenotypic variation and diversity in fruit, leaf, fatty acid, and their relationships to geoclimatic factors in seven natural populations of Malania oleifera Chun et S.K. Lee. Forests 2022, 13, 1733. [Google Scholar] [CrossRef]
  35. Oksanen, J.; Blanchet, F.G.; Friendly, M.; Kindt, R.; Legendre, P.; McGlinn, D.; Minchin, P.R.; O’Hara, R.B.; Simpson, G.L.; Solymos, P.; et al. Package ‘Vegan’: Community Ecology Package; Version 2.4-2. 2017. Available online: https://github.com/vegandevs/vegan (accessed on 26 January 2023).
  36. Miljkovic, D.; Stefanovic, M.; Orlovic, S.; Nedic, M.S.; Kesic, L.; Stojnic, S. Wild cherry (Prunus avium (L.) L.) leaf shape and size variations in natural populations at different elevations. Alp. Bot. 2019, 129, 163–174. [Google Scholar] [CrossRef]
  37. Deng, P.; Xie, X.C.; Long, F.Y.; Zhang, L.; Li, Y.H.; Zhao, Z.X.; Yang, S.Y.; Wang, Y.R.; Fan, R.S.; Li, Z.Q. Trait variations and probability grading index system on leaf-related traits of Eucommia ulmoides oliver germplasm. Plants 2021, 10, 2280. [Google Scholar] [CrossRef] [PubMed]
  38. Du, Q.X.; Qing, J.; Wang, L.; Liu, P.F.; He, F.; Zhu, L.L.; Du, H.Y. Variation and probability grading of main quantitative traits of fruits for Eucommia ulmoides germplasm. Bull. Bot. Res. 2019, 39, 387–394. [Google Scholar]
  39. Meng, Y.D.; Du, H.Y.; Wang, L.; Lv, G.X.; Qing, J.; He, F.; Huang, H.Y.; Du, Q.X. Diversity analysis of leaf phenotypic traits of Eucommia ulmoides germplasm resources. For. Res. 2022, 35, 103–112. [Google Scholar]
  40. Huang, H.Y.; Du, H.Y.; Wuyun, T.N.; Zhu, G.P. Establishment of genetic diversity system of Eucommia ulmoides based on SSR molecular markers. For. Res. 2013, 26, 795–799. [Google Scholar]
  41. Du, H.Y. Gutta-Percha-Content Character, Its Variance and Selection of Superior Clone Associated with Eucommia ulmoides Oliv. Ph.D. Thesis, Central South University of Forestry and Technology, Hunan, China, 2003. [Google Scholar]
  42. Li, H.G. Genetic Diversity Analysis, Core Collection Construction and Molecular Identification of Eucommia ulmoides Oliver. Ph.D. Thesis, China Academy of Forestry Sciences, Beijing, China, 2017. [Google Scholar]
  43. Wu, M. Development of Genomic SSR Makers and Genetic Diversity Evaluation of Eucommia ulmoides Oliv. Master’s Thesis, China Academy of Forestry Sciences, Beijing, China, 2014. [Google Scholar]
  44. Zhu, X.M. Genetic Diversity Analysis of Eucommia ulmoides in Anhui Province Based on ISSRs. Master’s Thesis, School of Forestry & Landscape Architecture, Anhui Agricultural University, Hefei, China, 2013. [Google Scholar]
  45. Li, Y.Q.; Reich, P.B.; Schmid, B.; Shrestha, N.; Feng, X.; Lyu, T.; Maitner, B.S.; Xu, X.T.; Li, Y.C.; Zou, D.T.; et al. Leaf size of woody dicots predicts ecosystem primary productivity. Ecol. Lett. 2020, 23, 1003–1013. [Google Scholar] [CrossRef]
  46. Wang, S.Y.; Wang, W.N.; Wang, S.Z.; Yang, L.X.; Gu, J.C. Intraspecific variations of anatomical, morphological and chemical traits in leaves and absorptive roots along climate and soil gradients: A case study with Ginkgo biloba and Eucommia Ulmoides. Plant Soil 2021, 469, 73–88. [Google Scholar] [CrossRef]
Figure 1. Locations of the ten populations sampled of E. ulmoides. Left panel: A map of China with grey indicating the range of natural populations of E. ulmoides. Right panel: The enlarged studied area, where solid black dots indicate the studied populations.
Forests 14 00462 g001
Figure 2. (A) Visual representation of sampled fruit and measured morphometric traits: FVD—Fruit vertical diameter; FHD—Fruit horizontal diameter; FLD—Fruit lateral diameter. (B) Visual representation of sampled seed and measured morphometric traits: SVD—Seed vertical diameter; SHD—Seed horizontal diameter; SLD—Seed lateral diameter. (C) Visual representation of sampled leaf and measured morphometric traits: LL—Leaf length; LW—Leaf width; PL—Petiole length.
Forests 14 00462 g002
Figure 3. Correlation analysis among 15 phenotypic traits at the tree-level. Purple and green color represent positive and negative correlation, respectively. The darker the color, the stronger the correlation (* p < 0.05; ** p < 0.01; *** p < 0.001). Phenotypic trait abbreviations are shown in Table 2.
Forests 14 00462 g003
Figure 4. Biplot of the principal component (PC) analysis based on tree means of 15 morphometric traits in 10 studied E. ulmoides populations. The PC means of the populations are shown in the figure. Acronyms of populations: P1—Cljy; P2—Clylp; P3—Clgfq; P4—Cljylc; P5—Cldx; P6—Ydtms; P7—Tyrs; P8—Hcgq; P9—Lyjjh; P10—Wxgjz.
Forests 14 00462 g004
Figure 5. Cluster relationship of the 10 E. ulmoides populations based on UPGMA method and the 15 morphological traits. The Euclidean distance was used to define the phenotypic distance between the studied populations (morphological data using population means and standardized by the Z-score method). The sampled tree number of each population and population abbreviations are shown in Table 1.
Forests 14 00462 g005
Figure 6. The relationships of the pairwise geographic (a) and climatic distances (b) with the phenotypic differences among populations.
Forests 14 00462 g006
Figure 7. Correlation analysis among climate and PCs. Blue and maroon color represent positive and negative correlation. The darker the color, the stronger the correlation (* p < 0.05; ** p < 0.01; *** p < 0.001).
Forests 14 00462 g007
Table 1. Population, sample size and geoclimatic factors for ten natural populations E. ulmoides.
PopulationSample Size (Number of Trees Sampled)Longitude
(°E, LON)
Latitude
(°N, LAT)
Altitude
(m, ALT)
Average Annual Temperature
(°C, AAT)
Average Annual Precipitation
(mm, AAP)
Average Annual Humidity
(%, AAH)
Cljy (P1)36110.7029.16212–80816.31340.475.8
Clylp (P2)14110.1729.5796–59015.61349.274.4
Clgfq (P3)8110.1829.43243–58816.41396.978.6
Cljylc (P4)19110.7729.5271–37016.61301.775.8
Cldx (P5)9110.7829.12450–77815.01430.980.2
Ydtms (P6)5110.4929.10179–62118.01411.773.4
Tyrs (P7)5111.2529.37250–25316.41431.670.8
Hcgq (P8)6106.8827.72924–97815.21059.880.5
Lyjjh (P9)7106.2633.55696–7059.6754.874.4
Wxgjz (P10)8111.3735.60468–48113.2524.965.6
Table 2. Summary statistics of the 15 morphological characters studied in the 117 trees of E. ulmoides distributed in the 10 natural populations of China.
TraitsMinMaxMeanSDCV (%)
Leaf length (LL) (mm)44.80239.80118.0228.3223.99
Leaf width (LW) (mm)21.70120.1059.9012.5620.96
Leaf thickness (LT) (mm)0.041.640.270.1349.00
Petiole length (PL) (mm)5.5038.2015.493.7824.41
Leaf perimeter (LP) (mm)59.20295.30145.1033.1022.81
Fruit vertical diameter (FVD) (mm)16.1541.3632.223.139.72
Fruit horizontal diameter (FHD) (mm)6.8719.9611.661.3911.94
Fruit lateral diameter (FLD) (mm)0.165.442.400.4619.14
Fruit stalk length (FSL) (mm)1.2610.214.851.1924.60
Fruit shape index (FSI)1.354.792.790.3111.03
Seed vertical diameter (SVD) (mm)7.5118.7413.051.4811.30
Seed horizontal diameter (SHD) (mm)1.664.602.940.3612.25
Seed lateral diameter (SLD) (mm)0.222.121.170.2420.51
Seed shape index (SSI)2.267.594.490.6514.52
100-fruit weight (FrW) (g)4.2413.428.411.6719.84
Note: SD—standard deviation; Min—minimal value; Max—maximal value; CV—coefficient of variation (%). Calculated using all the data (includes the repeated measurements within a tree).
Table 3. The proportion of variance components, population differentiation coefficients and F values of 15 traits based on all the data (includes the repeated measurements within a tree) in 10 natural populations of E. ulmoides in China.
TraitsProportion of Variance Components (%)Population Differentiation Coefficient (%)F Value
Among PopulationsAmong Trees within PopulationsWithin Trees (Residual)Among PopulationsAmong Trees within Populations
Leaf length (LL) (mm)9.8121.6668.5331.174.0 ***10.5 ***
Leaf width (LW) (mm)16.1525.3358.5238.945.0 ***13.9 ***
Leaf thickness (LT) (mm)5.8852.9441.1810.002.4 ***42.6 **
Petiole length (PL) (mm)9.3339.6950.9819.022.8 **23.4 **
Leaf perimeter (LP) (mm)19.0718.4762.4650.807.8 ***9.9 ***
Fruit vertical diameter (FVD) (mm)3.0271.1125.874.071.284.8
Fruit horizontal diameter (FHD) (mm)2.1967.0430.773.171.565.2
Fruit lateral diameter (FLD) (mm)53.7520.1626.0972.7319.9 ***24.3 ***
Fruit stalk length (FSL) (mm)10.5547.2942.1518.252.6 **34.7 **
Fruit shape index (FSI)12.3851.4336.1919.401.442.9
Seed vertical diameter (SVD) (mm)13.1761.7825.0617.572.5 ***75.8 ***
Seed horizontal diameter (SHD) (mm)3.0553.4443.515.411.438.3
Seed lateral diameter (SLD) (mm)37.1022.5840.3262.1614.3 ***17.6 ***
Seed shape index (SSI)13.4247.6238.9621.991.9 *38.4 *
100-fruit weight (FrW) (g)40.1041.4918.4149.156.7 ***7.8 ***
Mean16.6042.8040.628.26
* p < 0.05; ** p < 0.01; *** p < 0.001.
Table 4. Principal component vectors, eigenvalues, contribution rate and cumulative contribution rate of first 5 principal components based on tree means for the 15 traits.
TraitsPC1PC2PC3PC4PC5
Leaf length (LL) (mm)0.707−0.5350.238−0.1240.049
Leaf width (LW) (mm)0.717−0.5080.218−0.034−0.011
Leaf thickness (LT) (mm)0.163−0.3540.3290.488−0.491
Petiole length (PL) (mm)0.207−0.3930.1830.4630.486
Leaf perimeter (LP) (mm)0.784−0.5090.230−0.115−0.021
Fruit vertical diameter (FVD) (mm)0.5480.5580.0820.3230.416
Fruit horizontal diameter (FHD) (mm)0.6130.136−0.5080.4560.088
Fruit lateral diameter (FLD) (mm)0.7000.106−0.097−0.392−0.144
Fruit stalk length (FSL) (mm)0.5350.1900.0720.0430.214
Fruit shape index (FSI)−0.1850.3900.689−0.2060.308
Seed vertical diameter (SVD) (mm)0.5520.6610.146−0.015−0.222
Seed horizontal diameter (SHD) (mm)0.3080.116−0.727−0.026−0.009
Seed lateral diameter (SLD) (mm)0.324−0.114−0.155−0.6920.222
Seed shape index (SSI)0.2280.4670.7510.009−0.197
100-fruit weight (FrW) (g)0.7440.426−0.2010.031−0.229
Eigen value4.2952.4752.2321.4731.012
Contribution rate28.63616.50014.8779.8226.746
Cumulative Contribution rate28.63645.13660.01369.83576.581
Table 5. Effect of climate dissimilarity and geographic distance on morphological distance between populations of E. ulmoides. Partial Mantel test was used to identify the independent effects of geographic distance and climate.
Independent Effect of ClimateIndependent Effect of Geography
Morphological distancer = 0.31, p = 0.034r = 0.16, p = 0.214
Table 6. Summary of multiple-regression models for predicting population-level variation in the 15 morphological traits (PCs in Figure 7).
ModelsFit Statistics
Standardized CoefficientsR2AICRMSEp
AATAAHAAP
PC10.454 0.4590.845−18.050.36p < 0.001
PC2−0.2260.456−0.3510.246−18.510.34p = 0.219
PC3−0.330 0.4470.636−28.620.21p = 0.012
PC4 −0.49 0.477−12.710.48p = 0.016
PC5−0.453 0.626−19.880.94p = 0.003
R2 = determination coefficient; RMSE = root mean square error; AIC = Akaike information criterion.
Disclaimer/Publisher’s Note: The statements, opinions and data contained in all publications are solely those of the individual author(s) and contributor(s) and not of MDPI and/or the editor(s). MDPI and/or the editor(s) disclaim responsibility for any injury to people or property resulting from any ideas, methods, instructions or products referred to in the content.

