Abstract
Forest fires have long been a significant global problem. How to reliably accomplish the early warning and real-time monitoring of forest fires has become a pressing issue in order to limit the damage caused by forest fires. A novel technological approach for forest fire monitoring has been made possible by the quick development of wireless sensor network (WSN) technology. Currently, batteries are the primary source of power for WSNs used in forests, but frequent battery replacement will compromise the network for monitoring. As a result, the power supply is the key limit to its application in forest areas. This paper puts forward the thermoelectric conversion based on the Seebeck effect. Its notable feature is to convert heat energy into electric energy through the temperature difference between shallow soil and air. In the process of testing the device, the maximum voltage was 803.36 mV. At the same time, a power management system (PMS) for a thermoelectric conversion device was designed. The main feature of this system is that there is no need for an external control module. In the laboratory test, the minimum input power of this system was 200 mV. When the load resistance was 8 KΩ, the output power was 0.55 mW, and the maximum efficiency could reach 65.38% when the input was 500 mV, which fulfills the requirements of low cost and high reliability, providing a feasible solution for solving the energy limitation problem of WSNs in a forest area.
1. Introduction
Microelectronics, computer technology, and wireless communications advancements have accelerated the development of low power consumption sensors, making it possible to combine various functions including data gathering, data processing, and wireless transmission in a tiny volume [1]. As the number of wireless sensor network nodes (WSNs) has increased, energy restrictions have emerged as a key feature and a bottleneck [2,3]. At present, the energy of WSNs is usually provided by batteries with limited capacity or by larger external power supplies. However, the use of WSN technology in this area is severely constrained by the complicated and unpredictable environment found in forests as well as by the high cost of power supplies and the complexity of maintenance [4].
In recent years, the environment energy harvesting technology (EH) has witnessed rapid development, which offers support in supplying energy to forestry WSNs from the theoretical and technical perspective [5,6]. Compared to solar energy [7], wind energy [8], radio frequency energy [9], and vibration energy [10], the energy obtained by thermoelectric energy does not have a large energy density. However, the thermoelectric generator (TEG) based on the Seebeck effect is characterized by the stable conversion process, continuous output energy, and slow amplitude change, which coincidentally meets the needs of the sensor in working stably for a long time in a low power consumption condition [11,12]. For the floatable generating set designed by Zhang et al. [13], four TEGs were connected in series before linking to the back side of the aluminum plate, and the condensing mold of the Fresnel lens allowed the sun radiation to be concentrated on one focus. Such focus provides temperature to the hot sides for TEG, while the cold sides are taken when water flows as the coolant. When the suspension device is subjected to the sun radiation of 896.38 W/m2, a voltage of 381.03 and power output of 8.86 mW would be generated via the thermal power. Zhang et al. [14] selected the gravity heat pipe as the core heat transmission component coupled with a new type of gravity heat pipe thermoelectric energy conversion system, featuring the design of a new heat transmission cycle structure. Such a conversion system can achieve a step-up from 1057 mV to 4.4 V and an energy output of 362.56 mW. For the Z-type metal heat conduction structure designed by Datta et al. [15], the major axis was buried under the asphalt road, meanwhile, TEG was placed under the minor axis, thereby generating the temperature difference through the thermal gradient, and an electric power of 10 mW could be made for one single TEC for the experiment conducted for 8 h in a row. Lawrence et al. [16] first used the heat flow between the air and the shallow soil to achieve thermal gradient power generation. Unfortunately, they failed to monitor the corresponding characteristics of electricity in an efficient manner, but successfully predicted the output power through assumptions and calculations. Ikeda et al. [17] designed a 0.3 m thermoelectric conversion power supply device for the purpose of agricultural monitoring, which could drive the wireless microcontroller unit (MCU) with the combination with an LTC3109 commercial chip. Unfortunately, there was no discussion on the efficiency of such a system.
What is worth noticing is that the output voltage collected by the environment energy is extremely unstable because it fails to be regulated, which is not suitable for directly powering electronic circuits, so cannot be applied directly in forest fire monitoring as a power supplement. Furthermore, it usually only generates a pretty low average output power, so providing a power management system (PMS) at the post-energy harvesting stage provides is really crucial [18]. Regarding thermoelectric energy, Carlson et al. [19] collected and adopted the technology of a 130 nm complementary metal oxide semiconductor (CMOS) integrated circuit, and designed the boost converter with a minimum input voltage of 20 mV, which could digitally control the circuit in an efficient manner. In addition, the output voltage was 1 V and the maximum power of the converter was 75% by making use of the synchronous rectification technology. However, since it is necessary to start the above-mentioned circuit with the help of connecting the external battery, A. Shr et al. [20] proposed starting the circuit by using low voltage with radio frequency assistance to avoid using an external connected circuit. This design enabled the peak current to the control circuit to optimize the switching and conduction losses, which could achieve a 10 mV input voltage and 83% peak efficiency. The power management system started by only 20 mV was designed by Dias et al. [21] by using an LTC3108 commercial chip, where the output voltage for one single thermoelectric generator was 185 mV under the condition of a 7.5 K temperature difference, and an ultra-capacitor could be powered to 5.0 V through the LTC3108 step-up. A non-isolated hybrid converter was designed by Eguchi et al. [22], which combined the buck-boost converter with the negative Dickson multiplier, and the number of multiplier stages in the negative Dickson multiplier was also increased with the purpose of gaining a high voltage. Compared to the traditional DC–DC converter, the proposed converter allows for the number of switch drivers to be much smaller and the switch control much simpler. In Bertacchini et al. [23], the step up from the 250 mV input voltage to 3.3 V by using three boost converters and one charge pump, and the 170 KHz frequency generated by the differential oscillator, marks the highlight of such a circuit, which could control the switch of the post-stage boost converter to reduce the losses incurred by the logical control.
Obviously, TEG-based thermoelectric devices have been extensively researched and used. However, due to the special characteristics of forest areas (such as the shade provided by tree canopies and the prolonged periods of rain), the currently available thermoelectric devices cannot be directly used to power WSNs in forest areas. Therefore, this study notably differed from other studies:
- As the proposed thermoelectric device needs to utilize gravity heat pipes to transport heat to the ground surface, the issue of problematic power supply to WSNs in forest area was solved in this research by using the temperature differential between soil and air. The thermoelectric device’s construction differed from that of prior research as a result. A sustainable power source for environmental energy harvesting is made possible by the developed thermoelectric device, which does not need external heat dissipation powered by pumps, etc.
- Given that the proposed device’s electrical response characteristics are influenced by temperature, it is interesting that the output voltage changes in a sinusoidal pattern during long-term testing [24]. Therefore, a low-voltage self-starting power management system (PMS) was suggested in this research. A distinctive feature of the PMS is that the switching of the DC–DC converter is passively controlled by a depletion-type JFET of a start-up circuit without the need for an external MCU or PI control module (i.e., this is a battery-free power management system that is crucial for forests, since the performance of lithium batteries suffers dramatically in low-temperature, high-humidity conditions, and their utilization has the potential to pollute the forest environment.
- In order to make the output voltage more stable, a voltage regulator circuit was included in the system in an effort to prevent the over voltage from striking the circuit at some time. Finally, all of the excess energy was stored into the supercapacitor, so the energy could be released for the use of forest fire monitoring sensors when the temperature difference is relatively low or there is no temperature difference.
2. Method and Material
2.1. Description of the Thermoelectric Conversion Device
In this study, a thermoelectric conversion device was designed as shown in Figure 1. This device was buried 3.5 m into the ground and 0.2 m above the surface, and its core components consisted of eight thermoelectric generators (TG12-6-02, Marlow Industries, Dallas, TX, USA), gravity-assisted heat pipes (0.04 m diameter, 3.5 m length), and heat absorbing fins (0.05 m width, 0.25 m length). For better heat transfer, heat insulation was placed at the junction of each component to prevent heat loss. The whole working process can be roughly divided into two stages: first, the heat-absorbing end of the gravity-assisted heat pipe vaporizes the working liquid inside the pipe through the heat-absorbing fins, and the heat flow rises with the steam to the condensing end of the gravity-heat pipe to provide heat for the hot side of the TEG, after which the gas liquefies again due to the loss of heat and flows to the bottom of the heat pipe, and the two stages form a closed cycle to continuously provide heat for the hot side of the TEG. In addition, the heat sink was added to enhance the contact area between the cold side of the TEG and the air to realize the increase in the system output energy.
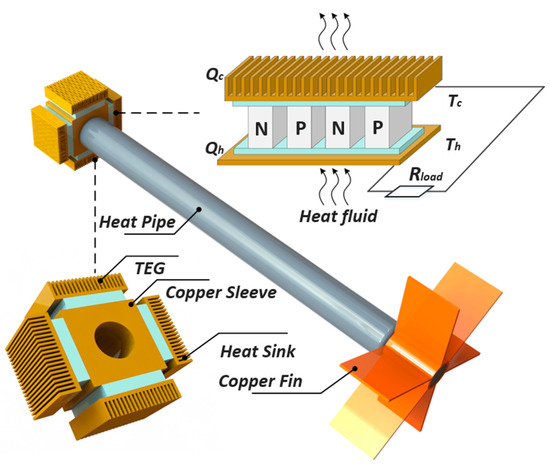
Figure 1.
Details of the proposed thermoelectric conversion device.
The internal structure of TEG consists of multiple pairs of semiconductor PN junctions connected in series, and each pair of PN junctions can form a thermocouple. When there is a temperature gradient in the thermocouple, the carriers at the hot end will move to the cold end, forming an electric potential. Therefore, TEG is the core device of the thermoelectric conversion device, and its performance determines the main electrical output characteristics of the whole thermoelectric device. As shown in Figure 1, Qh, Qc, Th, and Tc are the heat flow and temperature at the hot and cold sides of the TEG, respectively. The current loop Ite is generated after connecting the load resistor Rload, where the entire TEG generation system produces the Seebeck effect, the Peltier effect, and the Joule heat. The heat flow through the hot end and cold sides of a thermocouple can be expressed respectively as:
The αte is the Seebeck coefficient; Rte is the thermocouple internal resistance; and λte is the thermal conductivity of the TEG. Assuming that there are n thermocouples on a TEG, the output power can be expressed as Pte = n(Qh − Qc) = n[αteI(Th − Tc) − I2Rte]. The voltametric characteristics of the thermocouple device are also one of the indicators of the post-stage power management system (PMS), and according to the Seebeck effect, the output voltage of the TEG is:
At this point, it is known that the current generated in the TEG and external circuit is:
The equivalent model of thermoelectric can be viewed as a DC power supply composed of a series connection with a resistor, when the Rload is equal to the TEG internal resistance Rte, the output efficiency reaches the maximum [16], according to Equations (3) and (4), and at this time, the maximum output power Pte_MAX and efficiency ηte_MAX are:
2.2. Description of the Power Management System
The TEG is often at the microwatt to milliwatt level due to its own small temperature gradient, and its terminal voltage is not a stable value, so a PMS must be connected to the back end of the thermoelectric conversion device in order to provide stable power to the forestry WSNs [25,26,27]. There are published micro-energy power systems based on discrete components [28], integrated circuits [29], and commercial chip-based power systems [30], but for the practical application requirements of the shallow soil–air temperature difference power system designed in this paper, often the design cost is not only greatly increased due to some extraneous performance, but also does not take into account the low input voltage of this thermoelectric conversion device, which can no longer afford problems such as the power consumption of external driving elements. In order to satisfy the drive of its own transistors as well as the ultra-low input boost, this study designed a 200 mV ultra-low voltage start-up PMS based on the designed shallow soil–air temperature difference power generation device. As shown in Figure 2, when the output voltage of the TEG rose to 200 mV, the start-up circuit turned on and provided pulses to the transistor switches of the DC–DC converter, and as the output voltage of the converter increased, a low-voltage differential linear regulator was added at the end to fix the final output at 1.5 V~5 V.
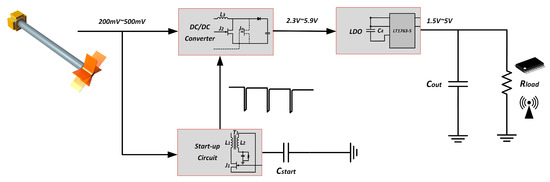
Figure 2.
Block diagram of the proposed power management system.
2.2.1. Start-Up Circuit
The start-up circuit is key to the PMS both to accomplish an ultra-low input start-up and to provide oscillation for the back-stage DC–DC converter. In order to achieve ultra-low input, the threshold voltage of the switching transistors must be as small as possible. As a junction field effect transistor (JFET), J1, when there is no voltage difference between the gate and the source, the JFET has no blocking effect on the current of the main circuit, and only when a suitable negative voltage is applied between the gate and source of J1, it will shut down the path of the main circuit so that there is no current flowing between the drain and source of J1. This feature is feasible for self-driven ultra-low input voltage boost circuits, because using this method, the circuit can be turned on first with ultra-low power consumption, and then the drive signal generated by this feedback method can be used to turn off the depletion transistor.
As shown in Figure 2, when TEG is not yet turned on, J1 is in a conduction state because it is a depletion FET, but the drain-source voltage of J1 is zero, so there is no current flow. When the input voltage becomes a stable DC voltage, as J1 is in the on state, there is current flowing on the primary side of the transformer L1, and the drain voltage of J1 gradually rises; at this time, that is, the voltage across the primary side of the transformer L1 gradually decreases, and the voltage induced in the secondary side of the transformer L2 also gradually decreases, which leads to the secondary inductance coil L2 induced current being zero. At this time, the gate capacitor of the JFET begins to reverse discharge, which will cause a reduction in the gate voltage, further leading to a reduction in the current flowing through the JFET, that is, the primary inductance coil current is reduced, and accelerates the discharge rate of the capacitor, the formation of positive feedback, and ultimately the JFET switches off quickly. After a few cycles, the circuit oscillation gradually stabilized. The resonant frequency at this point is about fw = {2π[(L1 + KmL2)*Cgs)]0.5}−1, where Km is the coupling coefficient of the transformer. The transformer selected for this design was LPR6235-752SML (Coilcraft, Cary, IL, USA), which has a coupling degree of 0.98 between the first and secondary coils, and assumes that the thermal resistance Rs is ignored and that there is no magnetic loss during operation. Due to the low input voltage, it was assumed that J1 had been operating in the linear region, at which time the drain stage currents Ids and Vgs are given as:
where IDSS is the zero gate voltage drain current; Vgs(off) is the gate-source cutoff voltage; β is the damping factor; and ω0 is the self-pulse. The second-order function coefficients β and ω0 are derived from Equations (7) and (8):
where m is the turns ratio. Since Equation (9) cannot be solved by conventional mathematical methods, Jordan et al. [31] proposed to start from defining the oscillation condition only, and since B is a monotonic function about Vgs, assumed that Δ = β2-ω02, satisfying the condition Δ < 0, β < 0. Although the variables are still contained in Δ, β at this point, consider the moment when the circuit is at t = t(0−) when it is just starting. Through the transistor’s own characteristics, Vgs ≈ 0. Therefore, two oscillation conditions are derived:
where Vte(oc) is the open-circuit voltage of the TEG, and the coupling model of the TEG output to the oscillation conditions of the start-up circuit is established by Equations (3), (13) and (14). Since the turns ratio m is often much larger than 1, Equation (12) can be simplified to:
where Vte_min is the critical condition under which the start-up circuit can oscillate, and the simplified Equation (16) shows that Vte_min is only related to the zero gate voltage drain current, the TEG internal resistance, the gate source cutoff voltage, and the turns ratio. When the TEG and transformer are selected, the internal resistance Rte and the turns ratio are a constant value. The shallow soil–air temperature differential power generation device designed in this study was analyzed after long-term data monitoring of the output characteristics of the thermoelectric device, and the minimum input voltage of the startup circuit was set at 200 mV according to the JFET datasheet, after a compromise between IDSS and Vgs(off).
2.2.2. DC–DC Converter
The main part of the PMS was selected from the conventional DC–DC converter structure, and the input voltage was directly supplied by the TEG. It is worth noting that the most important feature of this design is that there is no need for energy-consuming modules such as MCU to control the switching of the transistors, and the transistor J2 is controlled by the oscillating pulse generated by the start-up circuit. The charging time is Ton, the ratio of the on-time relative to the total period is called duty cycle D = Ton/T, and the discharge time is Toff = (1 − D)T. According to the volt-second balance principle, it is known that the steady state at this point in the charging phase and the discharge phase of the inductor current changes in equal amounts, resulting in a voltage conversion rate:
As can be seen from Equation (17), when Vte is a constant value, the smaller the D, the greater the voltage gain M. The DC–DC converter will inevitably generate switching losses Psw and conduction losses Pcond due to factors such as switching on-resistance, which affects the overall circuit efficiency.
where λJFET and CJFET are the power consumption factor and gate capacitance of the switching transistor J2, respectively, and it can be seen that the higher the fw of the converter, the larger the Psw of the converter. The larger the gate capacitance of J2, the larger the Psw of the Boost converter. From the point of view of switching losses only, reducing the switching frequency and the size of the switching transistor can reduce the switching losses. As shown in Figure 3, the duty cycle of the gate voltage VCTRL of the switch J2 is large. Although reducing the switching frequency and the size of the switch can reduce the switching losses, this design gives priority to the ultra-low voltage input and increases the voltage conversion ratio M. Moreover, since the control signal VCTRL generated by the start-up circuit is not a theoretical square wave, J2 also has a drain level current ID and source drain voltage VDS at the moment the switch closure generates the switching loss Pcond, which is seen as Ploss = Psw + Pcond. The related losses are discussed in Section 3.2.
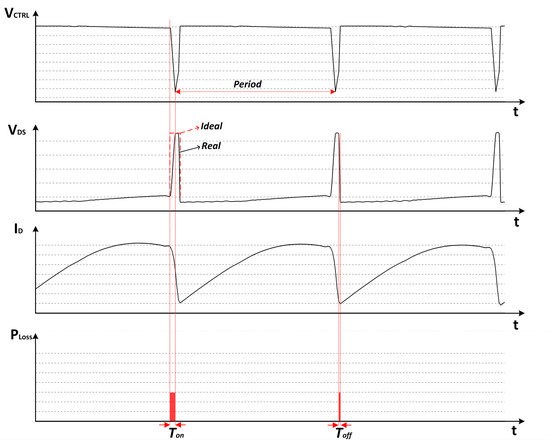
Figure 3.
Waveforms refer to the start-up circuit and power loss of J2.
2.2.3. LDO
A low dropout linear regulator (LDO) circuit based on the LT1763 chip was connected to the back end of the PMS for two main reasons. First, the LT1763 operates with a quiescent current of only 30 μA. The output voltage of 1.5 V~5 V was supplied to the AD–DA converters, MCU, wireless sensor network nodes, and other devices when the input voltage was 2.5 V~5 V. The ESR of the output capacitor affects the stability. To avoid oscillation, the output capacitor Cout = 3.3 μF and the ESR maximum value 3 Ω. The output capacitor affects the transient response, which can reduce the peak deviation and improve the transient response. The output capacitor between the OUT and GND pins takes the value 10 μF, and the bypass capacitor C4 between the OUT and BYP pins can provide a low-frequency noise pole to reduce the output noise. In addition, the bypass capacitor C4 can increase the RMS value of the output capacitance to further accelerate the transient response, and its value is taken as the change in-phase with the change in the bypass capacitor C4. Second, the input voltage Vte will change with the temperature difference because the output voltage VDC_OUT of the DC–DC converter is relatively unstable, as this design was designed for wireless sensor node power supply, the fluctuation of unstable supply will damage the application equipment in practical applications.
3. Result and Discussion
3.1. Performance of the Thermoelectric Conversion Device Based on Shallow Soil-to-Air Temperature Difference
To verify the performance of the thermoelectric conversion device, test platforms were constructed in northeast China (45°14′ N/126°12′ E). As shown in Figure 4, the shallow soil–air thermoelectric power generation system, which was buried 3.5 m underground and about 0.2 m above the ground surface, was used to measure the temperature of the heat-absorbing fin at the heat-absorbing end of the gravity-assisted heat pipe Tunder (at 3.5 m underground), the temperature of the hot end of the TEG, Tte, and the air temperature, Tair. Meanwhile, the electrical output characteristics such as open-circuit voltage Vte(oc) and short-circuit current Ite(sc) of thermoelectric power generation system were measured. The TP1608 data collector (TOPRIE, Shenzhen, China) and the power management system were placed in a waterproof box on top of the thermoelectric conversion device to prepare for the subsequent power supply of the wireless sensor nodes and other functions.
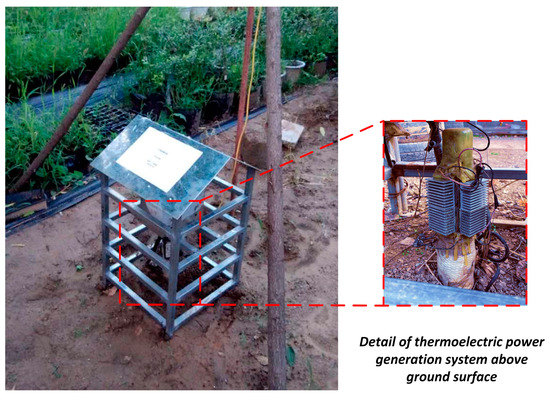
Figure 4.
Images of the thermoelectric conversion device prototype.
In this paper, selected temperatures and output open-circuit voltages at various locations of the shallow soil–air thermoelectric power generation system for January 2022. As shown in Figure 5, the temperature at 3.5 m below ground did not fluctuate much and almost showed a horizontal line. Since the TEG is exposed to the air through the heat dissipation fins, the hot end of the TEG was still subject to some fluctuation by the change in air temperature, and the change was kept between 0 °C and 3 °C. Meanwhile, the temperature of the hot end of the TEG also had a temperature difference of 1 °C~2 °C from the temperature of the heat absorbing fins at 3.5 m underground, which was caused by the heat loss in the process of heat transfer by the gravity-assisted heat pipe. It is worth noting here that the output open circuit voltage Vte(oc) of the thermoelectric power generation system is the critical design indicator for the power management system as the input parameter of the back stage power management system according to Equation (12). As shown in Figure 5, the maximum input voltage could reach 803.36 mV as Vte(oc) was greater than 200 mV most of the time. Based on Equations (12) and (15), parameters such as switching transistor IDSS and Vgs(off) can be determined from the manual, thus the transformer turns ratio L1/L2 = N1/N2 can be identified.
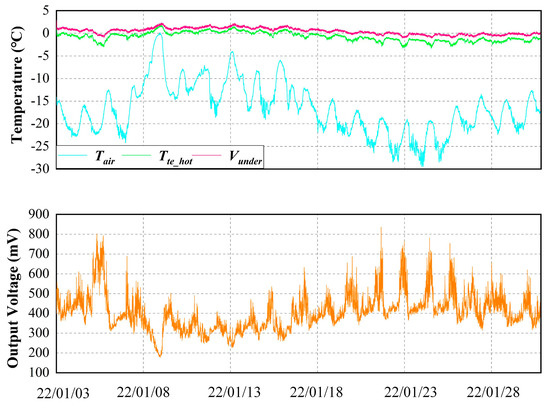
Figure 5.
Thermoelectric conversion device’s temporal profile of the temperature and output voltage.
To better measure the electrical output characteristics of the designed thermoelectric converter, variable load resistance was connected to its output and gradually increased from 0 Ω to 120 Ω. Theoretically, the output power should reach its maximum value when the external load resistance matches the internal resistance for the thermoelectric power generation system, but due to the special internal structure of the TEG (PN junction), its internal resistance also varies with the temperature. In this process, the side effect will always exist—the potential difference ∆V generated by the Seebeck effect and the external load resistance Rload form a complete circuit and thus generate a current Ite, which generates Joule heat QJ = Ite2Rte, and the change in the external load will generate irreversible Joule heat and thus change. The change in external load generates irreversible Joule heat and thus changes the temperature of the hot and cold ends of the thermoelectric module. As shown in Figure 6, the temperature change caused by the change in resistance is represented by ∆T. According to Equation (3) and Figure 6a, the increase in the output voltage Vte was obvious with the increase in ∆T, while the output current Ite decreased with the increase in the load resistance. Figure 6b presents the output power and system efficiency of the thermoelectric conversion system with the increase in temperature difference, which first increased more rapidly and then gradually decreased. As the designed system was a series output of eight thermoelectric modules, using Equations (4) and (5), with the increase in the load resistance Rload, it gradually approached the internal resistance Rte of the eight TEGs in series and the maximum value of the system output power appeared around Rload = 36 Ω, which was slightly lower than the internal resistance of the eight TEGs in series. It should be noted that the efficiency of the whole thermoelectric conversion system was extremely low, which is because there is a certain heat loss when the heat absorbing fins send the absorbed heat to the hot end of the TEG through the gravity-assisted heat pipe, which is related to both the gravity-assisted heat pipe technique and the heat insulation measures in the equipment design. In addition, the efficiency of TEG which is the core part of the whole thermoelectric system has been a bottleneck in its development [32,33,34]. Therefore, it leads to the low efficiency of the whole thermoelectric conversion equipment.
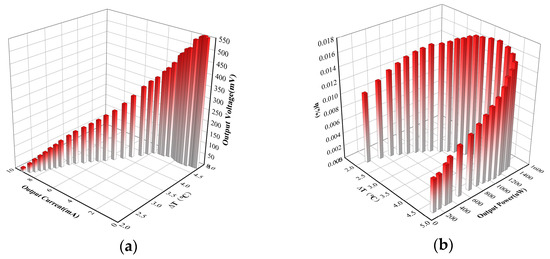
Figure 6.
Output characteristics of the thermoelectric devices: (a) output voltage and current as a function of load resistance; (b) output power and efficiency versus temperature difference.
3.2. Performance of the Power Generation Device Based on Shallow Soil–Air Temperature Difference
Due to the uniqueness of the utilization environment and the expense, this research employed a totally discrete component structure. To evaluate the effectiveness of the power management system under various input voltage scenarios, a basic thermoelectric conversion system was constructed in the lab, and the output voltage Vte of the thermoelectric device was modified by adjusting the temperature difference. In this study, a junction type field effect transistor (JFET) was used as the switching transistor. The proposed power management system is depicted in Figure 7. The JFET has a simpler manufacturing process than the MOSFET (the additional metal oxide layer raises the overall cost), which makes it less expensive. Additionally, the ideal switching transistor for ultra-low voltage self-start should be infinitesimally close to zero VGS(off) and have the largest possible zero gate voltage drain current IDSS, but because the aforementioned requirements are incompatible with each other due to the drain-source resistance RDS(on) = |VGS(off)|/2IDSS, we ultimately decided to use J201 as the switching transistor. In theory, the amplification of the voltage depends on the ratio of the transformer’s primary inductor L1 to the secondary inductor L2. Furthermore, as the inductance value increases, the size of the circuit inevitably increases, and the larger the inductor, the greater the loss to the circuit as a whole, thus reducing the efficiency, so the commercial coupling inductor LPR6235-752SML was selected from the considerations of boost ratio, size, and loss.
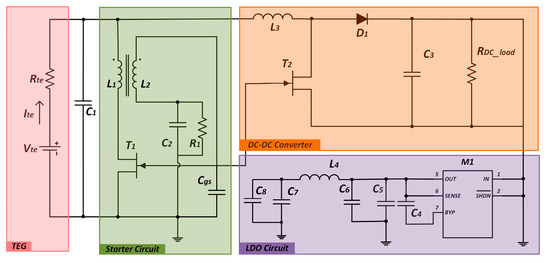
Figure 7.
Circuit diagram of the complete power management system.
The laboratory experiment of the thermoelectric conversion device focused on testing the performance of the power management system under different temperature differences. In this study, the relationship between the key index of the power management circuit (i.e., the output power PDC_OUT of the DC–DC converter) and the input voltage Vte was tested first. As shown in Figure 8, with a stable input voltage Vte, the output power PDC_OUT increased rapidly first as the load resistance RDC_load reached a maximum value and then decreased slowly. This is due to the gradual equalization of the converter internal resistance Rin and load resistance RDC_load, which makes the system catch up to the maximum power point. The maximum output power point varies at different input voltages Vte, and varies roughly between 4 KΩ and 8 KΩ. The designed DC–DC converter achieved a maximum output power of 0.55 mW at the lowest input voltage Vte = 200 mV and load resistance RDC_load = 8 KΩ, compared to 8.17 mW at the input voltage Vte = 500 mV.
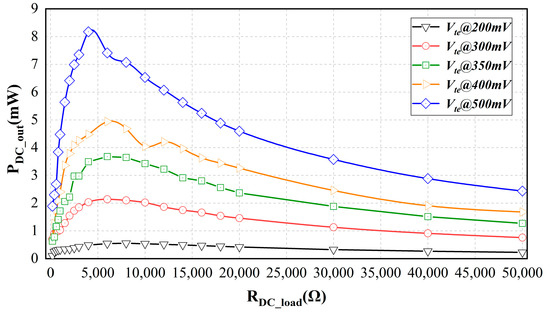
Figure 8.
Output power of the DC–DC converter under different loads and input voltage.
As shown in Figure 9, the maximum power point of the DC–DC converter was measured to vary in the range of 4 KΩ to 8 KΩ, while the relationship between different input voltages Vte and converter output voltage VDC_out was measured and the trend of the boost ratio M with the growth of the input voltage Vte was calculated by Equation (16). The input voltage and output voltage were linear at different load resistances, and the measured value was almost always the same as the simulated value, with a maximum error of 6.94%. This type of error is mainly because the threshold voltage of different transistors in the circuit will change with the use of time, leading to a change in the on-state current. The relationship between the voltage gain M under different load resistance RDC_load is shown in Figure 9. When the input resistance was lower than 350 mV, the relationship was linear, but with the increase in input voltage Vte and load resistance RDC_load, the voltage gain began to decline, and it can be seen that the voltage gain as an indicator to design the power management system is not a case where the larger the input, the better. Therefore, it is necessary to have a compromise input voltage, load resistance, and efficiency.
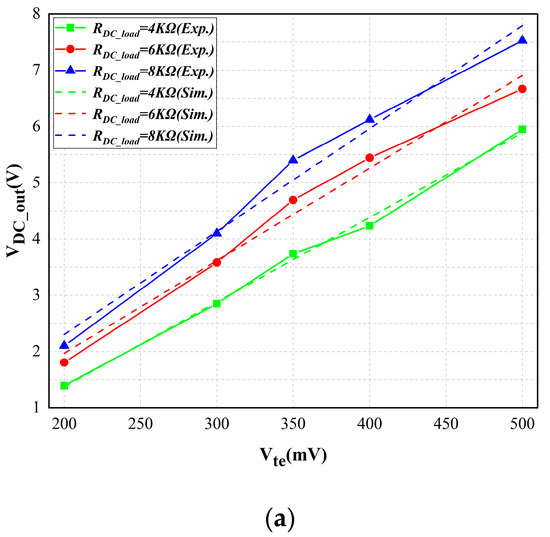
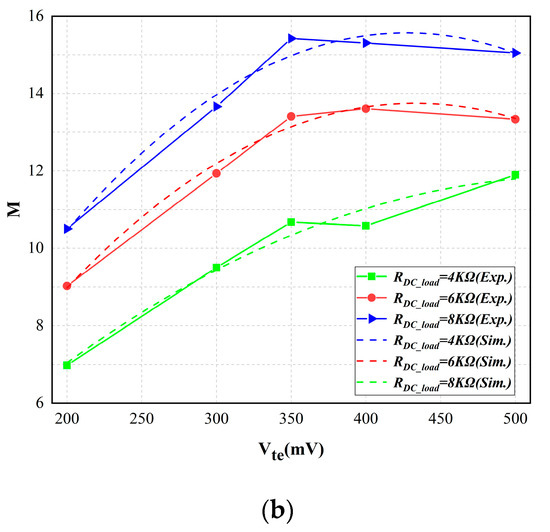
Figure 9.
Output characteristics of PMS at different input voltages: (a) output voltage; (b) voltage gain.
The most distinctive feature of the PMS mentioned in this design is that during the ultra-low voltage start-up process, there is no need to use an external energy supply to control the switching closure of the DC–DC converter’s switching transistors, but the negative pulse oscillation generated by the start-up circuit is used to achieve this. When transistor J1 is turned off, at this moment, inductor L3 is in the state of charging, and energy is transferred from input capacitor C1 to the inductor. When switching transistor J1 is turned on, the inductor energy is transferred to output capacitor Cout through J2 because the direction of the inductor current cannot change abruptly. In this process, the converter output voltage VDC_out rises gradually and finally becomes stable. As shown in Figure 10a, it can be seen that the duty cycle of the control waveform of the switching transistor gate J1 is large, which can guarantee that the output voltage is much higher than the input voltage. However, different duty cycles imply different energy losses. The circuit designed in this study is an energy conversion circuit, and there are various losses in the conversion process. The switching loss and conduction loss are caused by the gate parasitic capacitance of the switching transistor and the current flow through the non-ideal components, respectively. Equation (18) can be expressed as Pcond = (Wt1 + Wt2)·fw, where Wt1, Wt2 are the inductor current IL3 working in different two stages of the turn-on (off) loss, so from Equation (17) and Pcond = (Wt1 + Wt2)·fw, it can be seen that the loss of the system is related to fW, and the percentage of each average loss at different frequencies is shown in Figure 10b. The loss of the system increases with frequency, and when the frequency approximates 3 KHz, the maximum conduction loss can account for 35.27% of the overall power. The essential reason for the JFET transistor switching loss is that the voltage and current overlap zone exists because the JFET turn-on and turn-off are not instantaneous, as discussed in Section 2.2. Therefore, using soft switching technology or selecting relatively small RDS(on) switching transistors can effectively reduce the system losses and thus improve the overall efficiency.
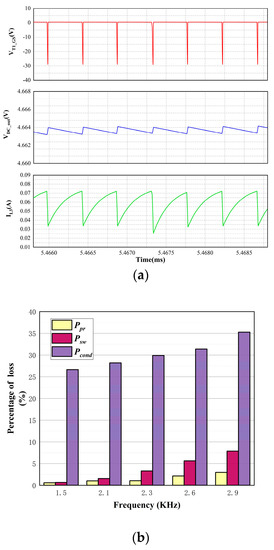
Figure 10.
Duty cycle and loss distribution of the power management system: (a) measured waveform obtained during the steady-state phase, Ch1 corresponds to VJ1_GS, Ch2 to VDC_out, and Ch3 to IL3; (b) power loss distribution.
The circuit in the laboratory was tested by connecting four TEG (Rte ≈ 20 Ω) in series. The corresponding input power Pte and output power PDC_out were obtained by varying the load resistance RDC_load when the input voltage was fixed, resulting in η = PDC_out/Pte. As shown in Figure 11, the overall efficiency of the power management system first increased with the increase in the input voltage, which was most obvious when the Vte increased from 200 mV to 300 mV. However, with the increase in Vte, the efficiency of the power management system no longer increased obviously and then finally decreased slowly with the increase in load resistance. The output efficiency of this design was 27.628% at the lowest input voltage of 200 mV, and the highest efficiency could reach 65.38% at the input of 500 mV.
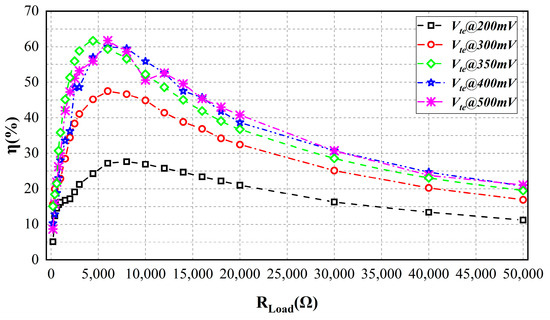
Figure 11.
Efficiency of DC–DC converter under different load and input voltage.
The working process of the power management system is shown in Figure 12. When the external input voltage was 200 mV, the startup circuit started to work and began to provide oscillation pulses for the DC–DC converter, and the switching transistor T2 of the DC–DC converter allowed the inductor L3 and the capacitor Cout to keep converting energy through the non-stop switching closure. In the meantime, the converter output voltage VDC_out was continuously increased. At about 36 ms, the LDO circuit connected to Cout started to work and VLDO_out was raised with the increase of VDC_out. At around 133 ms, the LDO circuit entered the regulator state, and VLDO_out gradually dropped to 1.5 V and finally stabilized. Since the LT1763 series chips provide internal protection circuits including reverse battery protection, current limit, thermal limit, and reverse current protection. These devices can provide fixed output voltages from 1.5 V to 5 V, and the final regulated voltage depends on the needs of the application (details are omitted here for the sake of brevity).
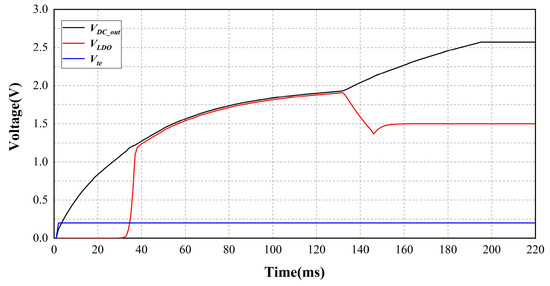
Figure 12.
The overall process of the power conversion system from the 200 mV start-up and boost to stable output.
3.3. Power Supplement for Fire Monitoring System (FMS)
As shown in Figure 13, a power supply system for forest fire monitoring was constructed in the lab, and since the heat source was a digitally controllable electric heating plate, the temperature of the hot end could be adjusted in accordance with the needs of the experiment. The output of the thermoelectric conversion module was connected to the input of the PMS, and the temperature of the hot and cold sides of the TEGs and the output voltage were measured using the same T-type thermocouple as the outdoor thermoelectric conversion device, and the working status of the sensors was monitored using an oscilloscope. The whole experimental process can be described as follows. When the temperature of the digital electric heating plate rises, the two sides of the TEG begin to form a thermal gradient. The simple temperature conversion device begins to generate power, and when the output voltage is higher than 200 mV, the start-up circuit of the PMS control of the DC–DC converter switch transistor starts working. When the PMS output voltage rises to 3.3 V, the fire monitoring system enters the work standby status. The FMS is capable of detecting the smoke concentration in the environment and has an alarm function as an instrument. The most basic components of this alarm system should include a signal acquisition analog-to-digital conversion circuit, microcontroller control circuit, character display circuit, sound and light alarm circuit, and safety protection circuit, and other components, with a display alarm status (blue LED and buzzer). A smoke detection alarm with an STM32 microcontroller as the control core, the choice of MQ-2 semiconductor gas smoke sensor to collect smoke concentration information, and peripheral circuitry formed a smoke alarm system. As shown in Figure 13, when the flame detection system detects smoke, the MCU makes one of the I/O ports an output to drive the buzzer (the other one lights the blue LED), and through simple programming to make the I/O port output high level for 250 ms and low level for 250 ms, it can realize the cycle of 500 ms and control the buzzer to alarm at a frequency of 2 Hz, which provides a foundation where the energy harvesting and PMS can replace power supply modules such as batteries and extend the service life of micro-power loads such as fire monitoring sensors.
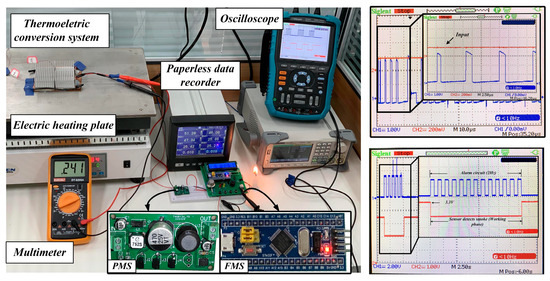
Figure 13.
Power management system interfaced with the thermoelectric device and supplying a fire monitoring system (FMS).
4. Conclusions
This paper primarily constructed a power management system for a shallow soil–air thermoelectric generation device based on previous work [35]. This device produced significant efficiency, feasibility, and cost-related advancements in the overall thermoelectric conversion. The following are the key findings and conclusions:
- (a)
- We propose, for the first time, the use of a thermoelectric conversion device powered for a forest fire monitoring sensor. As seen in the data collection from the shallow soil–air thermoelectric power system over the course of one month, the average voltage was 404.75 mV and the maximum voltage was 803.36 mV, which is sufficient drive to establish conditions for future load circuits and power supply for forestry WSNs.
- (b)
- The efficiency of shallow soil–air thermoelectric power generation systems is currently low due to equipment thermal loss during heat transfer, low power density, and low efficiency of the core device TEG. In the future, we plan to employ a conductor with a higher thermal conductivity than copper such as endothermic fins and increase the length and breadth of the gravity heat pipe to reduce the heat transfer loss. Furthermore, the heat sink at the cold side of the TEG can be strengthened to improve the temperature differential between the two sides.
- (c)
- A power management system was developed in conjunction with a soil–air thermoelectric power generating device that could automatically start at very low temperatures and also supply the pulse oscillation for the DC–DC converter. The power management system may increase from as low as 200 mV. The efficiency was 27.68% under conditions of 8 KΩ load resistance. With an increase in the input voltage, the maximum efficiency of this power management system could reach 65.38% when the input voltage was 500 mV.
- (d)
- There are still issues with the power management system proposed in this study to harvest thermal energy in a forest environment. The addition of the maximum power point tracking in our future work will significantly increase the system’s efficiency as well as focus on lowering the power loss and expanding the input range.
Author Contributions
Conceptualization, W.L.; Methodology, L.G.; Software, L.G.; Validation, L.G., W.L. and D.X.; Formal analysis, Y.Z.; Investigation, Y.Z.; Resources, W.L.; Data curation, W.L.; Writing—review and editing, L.G.; Visualization, W.L.; Supervision, D.X.; Project administration, W.L. All authors have read and agreed to the published version of the manuscript.
Funding
This work was supported in part by the National Natural Science Foundation of China under grant 31670716 and in part by the Outstanding Graduate Mentor Team Foundation of Beijing Forestry University under grant YJSY-DSTD2022009.
Institutional Review Board Statement
Not applicable.
Informed Consent Statement
Not applicable.
Data Availability Statement
Test methods and data are available from the authors upon request.
Acknowledgments
We sincerely appreciate the anonymous reviewers for their useful comments and detailed suggestions for this manuscript.
Conflicts of Interest
The authors declare no conflict of interest.
References
- Stojčev, M.K.; Kosanović, M.R.; Golubović, L.R. Power Management and Energy Harvesting Techniques for Wireless Sensor Nodes. In Proceedings of the 2009 9th International Conference on Telecommunication in Modern Satellite, Cable, and Broadcasting Services, Nis, Serbia, 7–9 October 2009; pp. 65–72. [Google Scholar] [CrossRef]
- Wan, Q.; Teh, Y.-K.; Gao, Y.; Mok, P.K.T. Analysis and Design of a Thermoelectric Energy Harvesting System With Reconfigurable Array of Thermoelectric Generators for IoT Applications. IEEE Trans. Circuits Syst. I Regul. Pap. 2017, 64, 2346–2358. [Google Scholar] [CrossRef]
- Milić, D.; Prijić, A.; Vračar, L.; Prijić, Z. Characterization of commercial thermoelectric modules for application in energy harvesting wireless sensor nodes. Appl. Therm. Eng. 2017, 121, 74–82. [Google Scholar] [CrossRef]
- Azevedo, B.F.; Brito, T.; Lima, J.; Pereira, A.I. Optimum sensors allocation for a forest fires monitoring system. Forests 2021, 12, 453. [Google Scholar] [CrossRef]
- Newell, D.; Duffy, M. Review of Power Conversion and Energy Management for Low-Power, Low-Voltage Energy Harvesting Powered Wireless Sensors. IEEE Trans. Power Electron. 2019, 34, 9794–9805. [Google Scholar] [CrossRef]
- Shaikh, F.K.; Zeadally, S. Energy harvesting in wireless sensor networks: A comprehensive review. Renew. Sustain. Energy Rev. 2016, 55, 1041–1054. [Google Scholar] [CrossRef]
- Atheaya, D.; Tiwari, A.; Tiwari, G. Exergy analysis of photovoltaic thermal (PVT) compound parabolic concentrator (CPC) for constant collection temperature mode. Sol. Energy 2016, 135, 222–231. [Google Scholar] [CrossRef]
- Nurmanova, V.; Bagheri, M.; Phung, T.; Panda, S.K. Feasibility study on wind energy harvesting system implementation in moving trains. Electr. Eng. 2017, 100, 1837–1845. [Google Scholar] [CrossRef]
- Kuhn, V.; Lahuec, C.; Seguin, F.; Person, C. A Multi-Band Stacked RF Energy Harvester with RF-to-DC Efficiency up to 84%. IEEE Trans. Microw. Theory Tech. 2015, 63, 1768–1778. [Google Scholar] [CrossRef]
- Sugisawa, T.; Igarashi, H. Properties of chaotic vibration energy harvester: Comparison of numerical results with experiments. Int. J. Numer. Model. Electron. Net. Dev. Fields 2017, 30, e2205. [Google Scholar] [CrossRef]
- Verma, G.; Sharma, V. A Novel Thermoelectric energy harvester for Wireless Sensor Network Application. IEEE Trans. Ind. Electron. 2018, 66, 3530–3538. [Google Scholar] [CrossRef]
- Chen, J.; Zuo, L.; Wu, Y.; Klein, J. Modeling, experiments and optimization of an on-pipe thermoelectric generator. Energy Convers. Manag. 2016, 122, 298–309. [Google Scholar] [CrossRef]
- Zhang, Y.; Zhang, Z.; Wu, Y.; Ga, L.; Xu, D.; Li, W. Research on a floating thermoelectric power generator for use in wetland monitoring. PLoS ONE 2020, 15, e0232331. [Google Scholar] [CrossRef] [PubMed]
- Zhang, Z.; Li, W.; Kan, J.; Xu, D. Theoretical and experimental analysis of a solar thermoelectric power generation device based on gravity-assisted heat pipes and solar irradiation. Energy Convers. Manag. 2016, 127, 301–311. [Google Scholar] [CrossRef]
- Datta, U.; Dessouky, S.; Papagiannakis, A.T. Harvesting Thermoelectric Energy from Asphalt Pavements. Transp. Res. Rec. J. Transp. Res. Board 2017, 2628, 12–22. [Google Scholar] [CrossRef]
- Lawrence, E.E.; Snyder, G.J. A study of heat sink performance in air and soil for use in a thermoelectric energy harvesting device. In Proceedings of the Twenty-First International Conference on Thermoelectrics, Long Beach, CA, USA, 29 August 2002; pp. 446–449. [Google Scholar] [CrossRef]
- Ikeda, N.; Shigeta, R.; Shiomi, J.; Kawahara, Y. Soil-Monitoring Sensor Powered by Temperature Difference between Air and Shallow Underground Soil. Proc. ACM Interact. Mob. Wearable Ubiquitous Technol. 2020, 4, 1–22. [Google Scholar] [CrossRef]
- Xia, C.; Zhang, D.; Pedrycz, W.; Fan, K.; Guo, Y. Human Body Heat Based Thermoelectric Harvester with Ultra-Low Input Power Management System for Wireless Sensors Powering. Energies 2019, 12, 3942. [Google Scholar] [CrossRef]
- Carlson, E.J.; Strunz, K.; Otis, B.P. A 20 mV Input Boost Converter with Efficient Digital Control for Thermoelectric Energy Harvesting. IEEE J. Solid-State Circuits 2010, 45, 741–750. [Google Scholar] [CrossRef]
- Shrivastava, A.; Roberts, N.E.; Khan, O.U.; Wentzloff, D.D.; Calhoun, B.H. A 10 mV-Input Boost Converter with Inductor Peak Current Control and Zero Detection for Thermoelectric and Solar Energy Harvesting with 220 mV Cold-Start and 14.5 dBm, 915 MHz RF Kick-Start. IEEE J. Solid-State Circuits 2015, 50, 1820–1832. [Google Scholar] [CrossRef]
- Dias, P.C.; Morais, F.J.O.; de Morais França, M.B.; Ferreira, E.C.; Cabot, A.; Siqueira Dias, J.A. Autonomous Multisensor System Powered by a Solar Thermoelectric Energy Harvester with Ultralow-Power Management Circuit. IEEE Trans. Instrum. Meas. 2015, 64, 2918–2925. [Google Scholar] [CrossRef]
- Eguchi, K.; Nakashima, D.; Do, W.; Ishibashi, T.; Asadi, F. Thermoelectric energy harvesting using a single inductor DC/DC converter employing a negative Dickson multiplier. Energy Rep. 2022, 8, 691–698. [Google Scholar] [CrossRef]
- Bertacchini, A.; Scorcioni, S.; Cori, M.; Larcher, L.; Pavan, P. 250 mV Input Boost Converter for Low Power Applications. In Proceedings of the 2010 IEEE International Symposium on Industrial Electronics, Bari, Italy, 4–7 July 2010; pp. 533–538. [Google Scholar] [CrossRef]
- Maixner, M.R.; Stevens, J.W. Assessment of near-surface ground temperature profiles for optimal placement of a thermoelectric device. Energy Convers. Manag. 2009, 50, 2361–2365. [Google Scholar] [CrossRef]
- Lossec, M.; Multon, B.; Ben Ahmed, H.; Goupil, C. Thermoelectric generator placed on the human body: System modeling and energy conversion improvements. Eur. Phys. J. Appl. Phys. 2010, 52, 11103. [Google Scholar] [CrossRef]
- Leoni, A.; Ulisse, I.; Pantoli, L.; Errico, V.; Ricci, M.; Orengo, G.; Giannini, F.; Saggio, G. Energy harvesting optimization for built-in power replacement of electronic multisensory architecture. AEU—Int. J. Electron. Commun. 2019, 107, 170–176. [Google Scholar] [CrossRef]
- Surducan, V.; Surducan, E.; Gutt, R. Harvesting and conversion of the environmental electromagnetic pollution into electrical energy by novel rectenna array coupled with resonant micro-converter. Energy 2020, 211, 118645. [Google Scholar] [CrossRef]
- Camarda, A.; Romani, A.; Macrelli, E.; Tartagni, M. A 32 mV/69 mV input voltage booster based on a piezoelectric transformer for energy harvesting applications. Sens. Actuators A Phys. 2015, 232, 341–352. [Google Scholar] [CrossRef]
- Ma, Y.; Zou, Y.; Zhang, S.; Fan, X. A 50 mV Fully-Integrated Self-Startup Circuit for Thermal Energy Harvesting. J. Circuits Syst. Comput. 2017, 26, 1750196. [Google Scholar] [CrossRef]
- Prijic, A.; Vracar, L.; Vuckovic, D.; Milic, D.; Prijic, Z. Thermal Energy Harvesting Wireless Sensor Node in Aluminum Core PCB Technology. IEEE Sens. J. 2015, 15, 337–345. [Google Scholar] [CrossRef]
- Jordan, D.; Smith, P. Nonlinear Ordinary Differential Equations: An Introduction for Scientists and Engineers, 4th ed.; OUP Oxford: Oxford, UK, 2007; p. 531. [Google Scholar]
- Chen, L.; Gong, J.; Sun, F.; Wu, C. Effect of heat transfer on the performance of thermoelectric generators. Int. J. Therm. Sci. 2002, 41, 95–99. [Google Scholar] [CrossRef]
- Gou, X.; Xiao, H.; Yang, S. Modeling, experimental study and optimization on low-temperature waste heat thermoelectric generator system. Appl. Energy 2010, 87, 3131–3136. [Google Scholar] [CrossRef]
- Chen, W.-H.; Wang, C.-C.; Hung, C.-I.; Yang, C.-C.; Juang, R.-C. Modeling and simulation for the design of thermal-concentrated solar thermoelectric generator. Energy 2014, 64, 287–297. [Google Scholar] [CrossRef]
- Ga, L.; Huang, S.; Zhang, Y.; Xu, D.; Li, W. Thermal resistances model for a soil-to-air thermoelectric generator device. Case Stud. Therm. Eng. 2022, 39, 102475. [Google Scholar] [CrossRef]
Disclaimer/Publisher’s Note: The statements, opinions and data contained in all publications are solely those of the individual author(s) and contributor(s) and not of MDPI and/or the editor(s). MDPI and/or the editor(s) disclaim responsibility for any injury to people or property resulting from any ideas, methods, instructions or products referred to in the content. |
© 2023 by the authors. Licensee MDPI, Basel, Switzerland. This article is an open access article distributed under the terms and conditions of the Creative Commons Attribution (CC BY) license (https://creativecommons.org/licenses/by/4.0/).