Abstract
Predicting the suitable habitat of plants under climate change has become a trending research topic in recent years. Juniperus tibetica Komarov (Cupressales: Cupressaceae) is a unique and vulnerable species on the Qinghai–Tibet Plateau (QTP) and the highest timberline in the Northern Hemisphere. The prediction of the suitable habitat of J. tibetica will be beneficial for understanding the ecosystem of the QTP. In the present study, variations in the distribution pattern of the suitable habitats (DPSH) of J. tibetica on the QTP were investigated by MaxEnt and GIS spatial analysis based on 288 distribution records and 8 environmental factors. The environmentally abnormal areas and environmental factors determining the DPSH along with climate change were analyzed, and the most suitable climate models were evaluated. The results show that the suitable habitat of J. tibetica will migrate to higher-elevation and -latitude areas in the future. Precipitation was the most important factor affecting current suitable habitats and limiting future ones, followed by temperature. By comparing the integrality of suitable habitat under different climate models, it was suggested that the HadGEM2-ES (RCP2.6) and BCC-CSM1.1 (RCP8.5) climate models were the best for predicting the DPSH of J. tibetica. This study revealed the response of the suitable habitat of J. tibetica relative to climate change at a large scale and provides a theoretical basis for the scientific management and conservation of J. tibetica resources on the QTP.
1. Introduction
According to the Sixth Assessment Report (AR6) of the IPCC, the global average surface temperature from 2011 to 2020 has risen by 1.09 °C compared with that before the Industrial Revolution [1]. Climate warming increases the risk of plant extinctions and dramatically affects the diversity of species in high-elevation ecosystems [2]. Known as “the world’s third pole” and the “Roof of the World”, plant ecosystems on the Qinghai–Tibet Plateau (QTP) are particularly sensitive to climate change. Since the 1980s, the temperature increase rate ranged from 0.16 to 0.67 °C per decade, and the annual precipitation increased by about 30 mm on the QTP [3]. Climate change on the QTP caused variations related to the growth status and distribution of alpine vegetation, such as the decrease in the area of alpine meadows, alpine steppes spreading to the northwest, and the increase in mortality of semi-arid forests on the northeastern margin, and the growing season of plants now starts earlier and ends later on the QTP [4,5,6]. Therefore, the botanic distribution patterns of suitable habitats (DPSH) on the QTP in response to climate change attract widespread attention.
For predicting the DPSH of plants under climate change, species distribution models (SDMs) have been widely applied [7]. Frequently used SDMs include the Maximum Entropy Model (MaxEnt), Genetic Algorithm for Rule-Set Prediction (GARP), BIOCLIM, Generalized Linear Model (GLM), Generalized Additive Model (GAM), etc. Among them, MaxEnt, which utilizes the environmental factors associated with the distribution points to calculate the distribution of species, requires fewer sample points to make predictions and has the highest predictive power and higher accuracies [8,9]. Currently, MaxEnt is applied in many fields: for example, the prevention and control of invasive species [10], the protection of endangered species [11], the management of pests and diseases [12] and the prediction of the risk of infectious diseases [13]. Combining geographic information technology, MaxEnt can predict the suitable habitat of plants and obtain spatial distributions [14,15]. Pearson et al. [16] studied the suitable habitat of leaf-tailed geckos (Gekkonidae: Reptilia) and found that the success rate of using MaxEnt was 1.5 times higher than GARP with a low sample size. Roura-Pascual et al. [17] compared the predictive effects of GLM, GAM, GARP and MaxEnt on the DPSH of Argentine ants (Hymenoptera: Formicidae) and observed that MaxEnt achieved the highest values in model performance.
The application of MaxEnt obtained diverse results in predicting the suitable habitat of plants on the QTP under climate change [18]. It was found that the area of the suitable habitat of Chinese caterpillar fungus, Ophiocordyceps sinensis (Berk.) (Hypocreales: Ophiocordycipitaceae), reduced on the QTP [19]. The results of predicting the distribution of Elymus sibiricus L. (Poales: Poaceae) show that suitable habitat areas first experienced shrinking, then expanded, and finally contracted in four periods [20]. The projection of MaxEnt suggested that the suitable habitat of Bryoerythrophyllum sp. and Didymodon sp. (Pottiales: Pottiaceae) moved to higher elevations and latitudes under future climate scenarios, and they would move further in 2070 than in 2050 [21]. Similarly, the elevation of the suitable habitat of Sinopodophyllum hexandrum (Royle) T.S. Ying (Ranunculales: Berberidaceae) also rose, while the range and centroid of the suitable habitat eventually migrated westward to higher elevations in the mountains on the inner QTP [22]. Furthermore, many studies analyzed the environmental factors affecting the distribution of the suitable habitat of plants on the QTP using MaxEnt [23,24,25]. It was shown that the precipitation of the warmest quarter and annual mean temperature were the most important environmental factors for the distribution of suitable habitats of nine Chinese non-food bioenergy plants on the QTP [24]. The precipitation of the warmest quarter, precipitation of the wettest quarter and annual precipitation were the primary factors governing the distribution of Stipa purpurea Graseb. (Poales: Poaceae) [25].
The plant diversity of the QTP includes 837 plant species belonging to 279 genera from 65 families [26], and most research studies on these focused on Asteraceae, Poaceae, Pinaceae and Cupressaceae. Juniperus tibetica Komarov (Cupressales: Cupressaceae) is a plant of the Cupressaceae and Juniper genus. It is an endemic constructive tree of the QTP [27,28], and it exhibits the characteristics of cold tolerance and barren tolerance; it was listed as a vulnerable species in the International Union for Conservation of Nature (IUCN)’s Red List. Moreover, J. tibetica forms the highest timberline, which was a remarkable ecotone and the best place to monitor and study climate change on the QTP in the northern hemisphere [29,30]. On the other hand, J. tibetica is self-pollinated and either monoecious or dioecious. In the early morning of the end of April at a temperature of about 2.23 °C and a humidity of about 90.5%, the pollen of J. tibetica detached and was found to rise to the top of the tree, and then along the slope of the mountain [31]. The fruit of J. tibetica matures in two years, and each cone contains a single seed. Juniper woodland is the preferred habitat of eared pheasant species that are keen to live in sites where they can easily forage and help disperse pollen. Therefore, the seeds of Juniper woodland can be widely dispersed via the droppings of eared pheasant species [32]. These characteristics give J. tibetica the potential for extensive migration in the future and can be used as a basis for estimating future variations in suitable habitats and the migration rate of J. tibetica. Therefore, climate change affected both the internal structure of the species at the individual level and the progression of the timberline. Studying the relationship between the individual physiological activities of J. tibetica and climate conditions is of great significance for analyzing the response of the highest timberline relative to climate change.
Previously, few studies have been conducted on the same genus of J. tibetica. Salvà-Catarineu et al. [33] forecasted that the number of suitable habitats of Juniperus species, i.e., Juniperus hoenicea, Juniperus turbinata and Juniperus canariensis (Cupressales: Cupressaceae), may decrease by 30% to 90%, 30% to 50% and 30% to 60% in 2070, respectively. Naudiyal et al. [34] pointed out that climate factors had the most significant impact on the distribution of Juniperus species, and once the value of factors exceeded a specific threshold, the habitat suitability declined. Kumar et al. [35,36] observed that Juniperus macropoda (Cupressales: Cupressaceae) was recorded at elevations of 3000–4260 m and would move upward at a rate of 3.91 m per year. Considering the specificity and the importance to the community structure and environment of J. tibetica as the highest timberline and constructive species, we previously studied the DPSH and the main environmental factors affecting the suitable habitat of J. tibetica under climate change based on the research of the same genus. On the basis of a previous study, we hypothesized a decrease in the suitable habitat of J. tibetica and migration toward higher elevations and latitudes, and we considered that the factors affecting the DPSH were climate factors.
In the present study, the suitable habitats of J. tibetica on the QTP were predicted by using the MaxEnt model under the last glacial maximum (LGM), current and future climate scenarios based on the environmental data and the records data. The aims are as follows: (1) to predict the distribution and migration trend of the suitable habitat of J. tibetica on the QTP under different climate conditions; (2) to obtain the key environmental factors affecting the distribution of a suitable habitat in the current climate; (3) to predict the regions with abnormal environments in the process of climate change and the key environmental factors that cause the abnormity; and (4) to evaluate the suitable climate model of QTP. The results may provide a reliable basis for formulating the responding mechanism of J. tibetica during climate change on the QTP.
2. Materials and Methods
2.1. Species Distribution Point Records
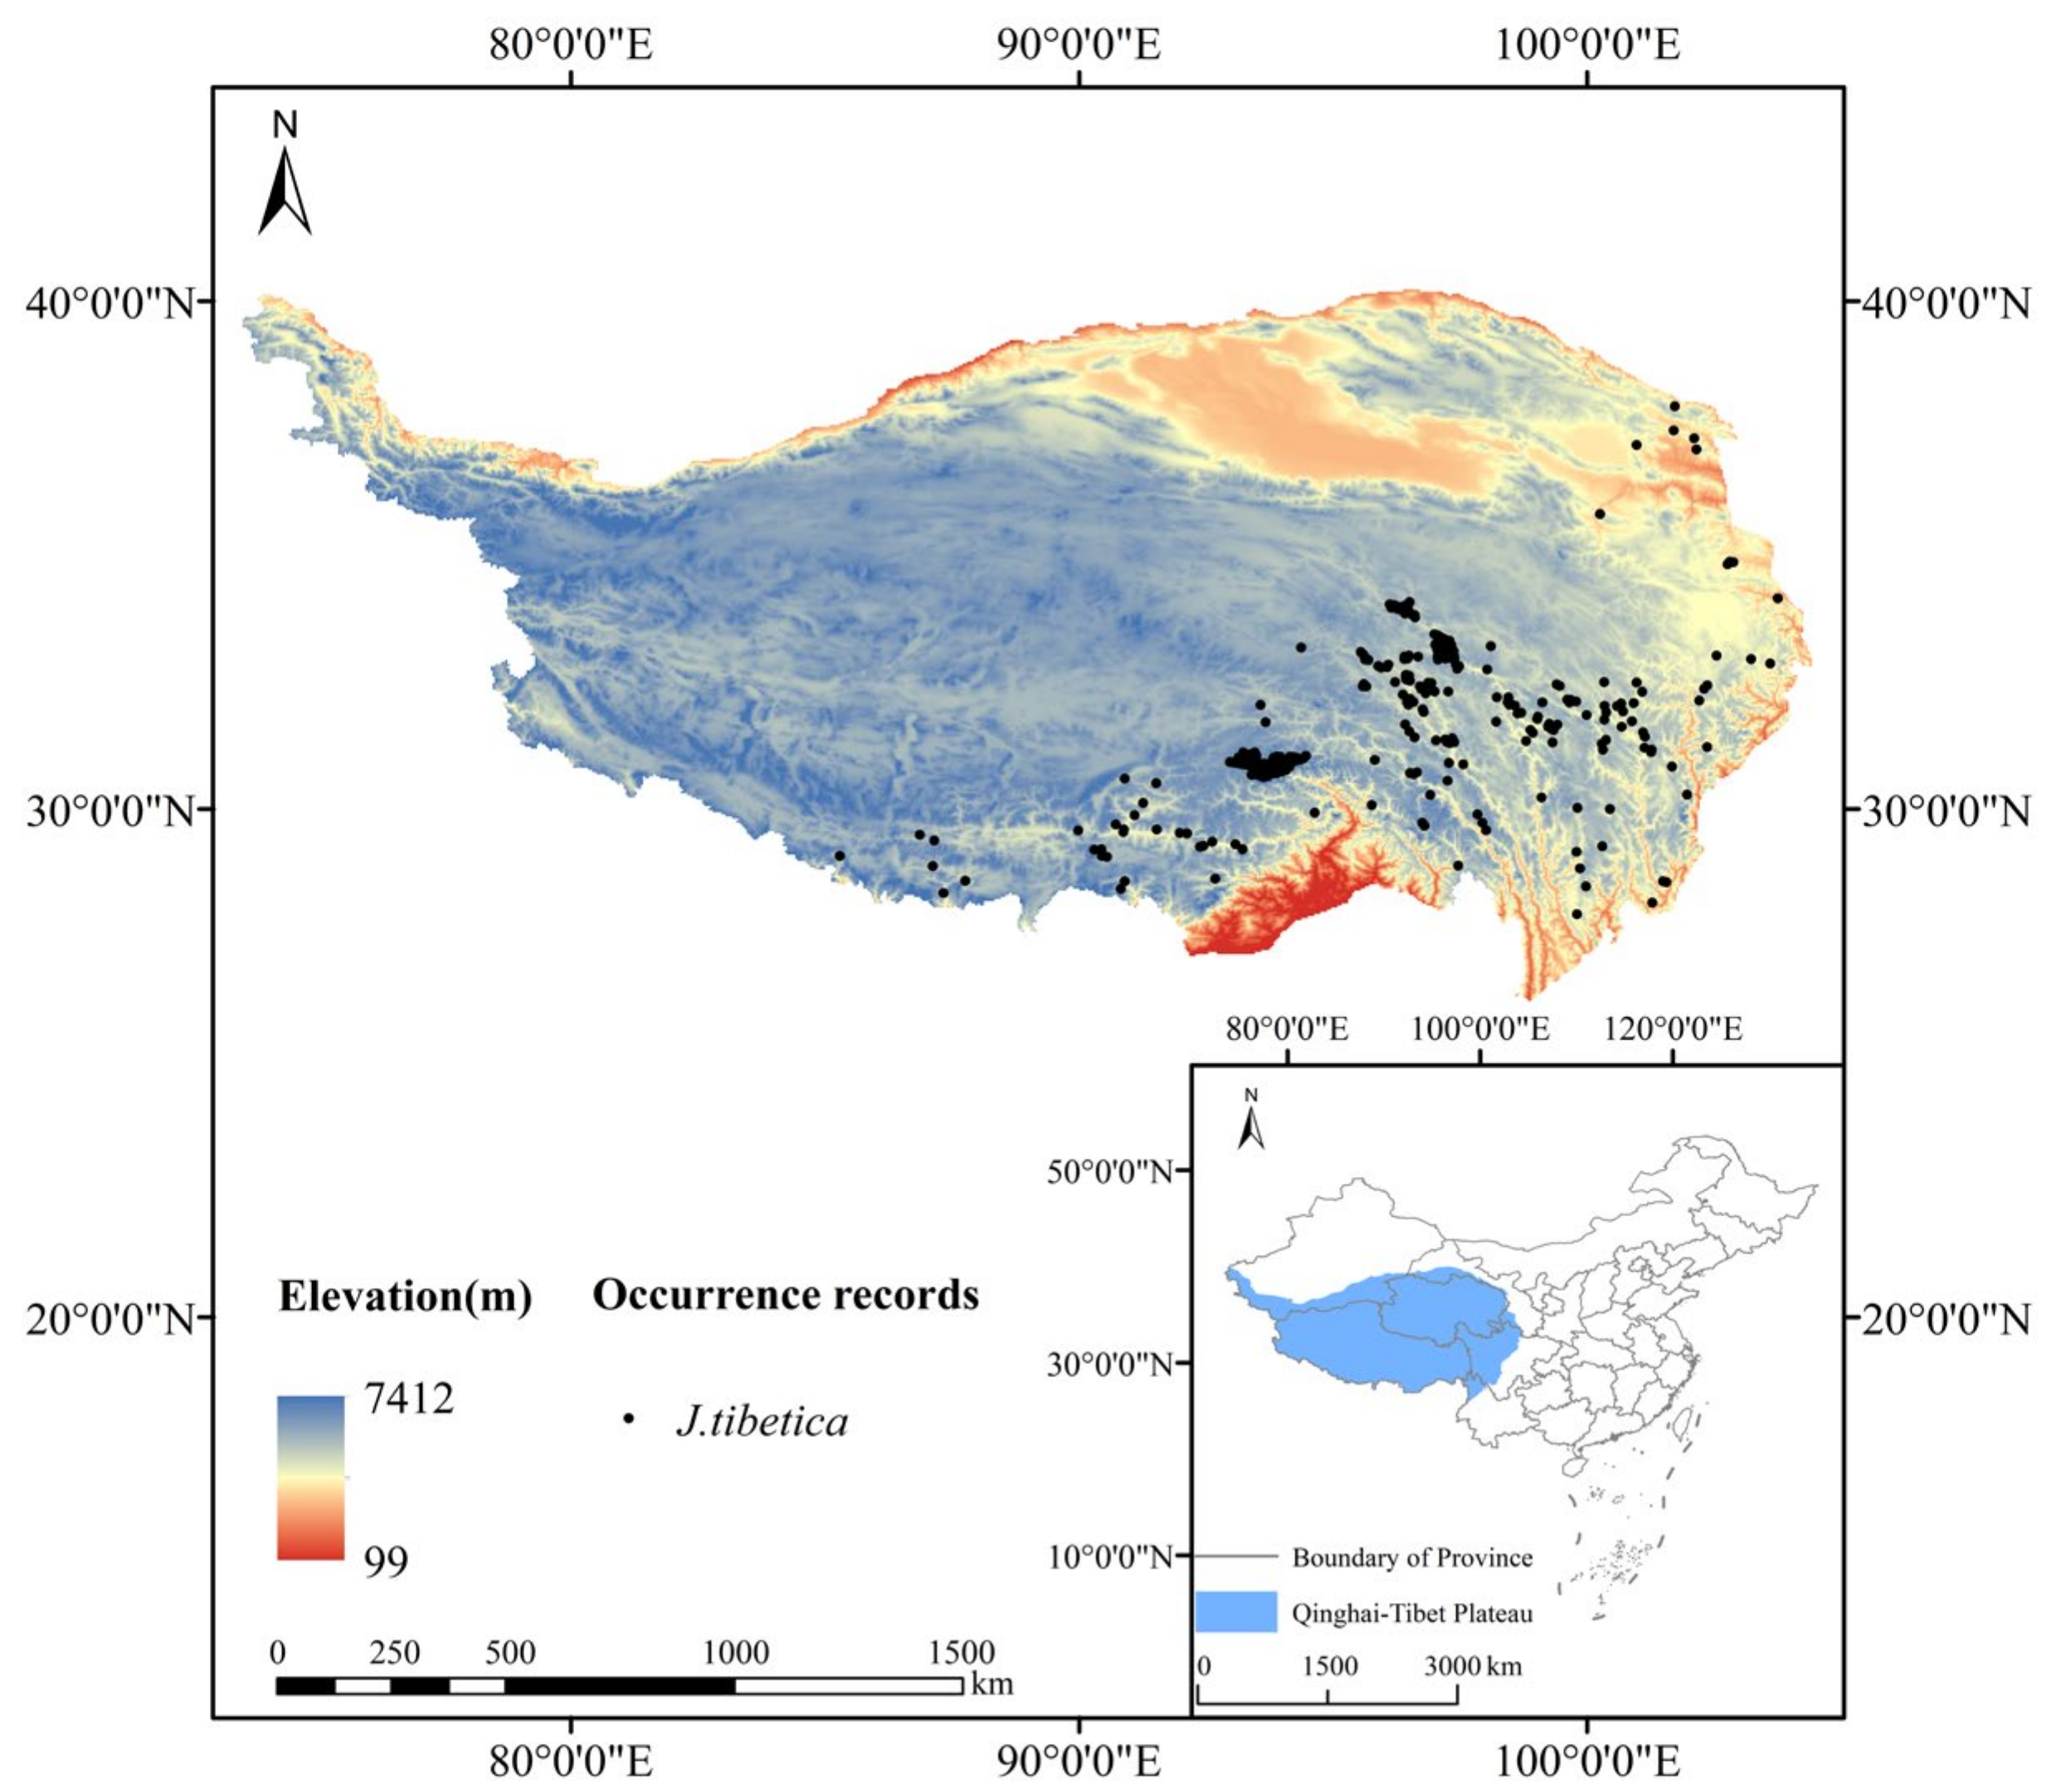
The distribution data of J. tibetica on the QTP were obtained from the Vegetation of China and its Geographical Pattern-Illustration of the Vegetation Map of the People’s Republic of China (1:1000000) published by Geological Publishing House, Global Biodiversity Information Facility (GBIF: https://www.gbif.org (accessed on 4 April 2022)) and Chinese Virtual Herbarium (CVH: https://www.cvh.ac.cn (accessed on 10 April 2022)). The SDM toolboxes of ArcGIS (10.8 ESRI, Redlands, CA, USA) were used to set buffer zones with a grid size of 5 km × 5 km (2.5’) after eliminating invalid, repeated and cultivated data. Only one distribution point was reserved in each grid. In total, 288 effective distribution points were obtained for modeling, as shown in Figure 1.
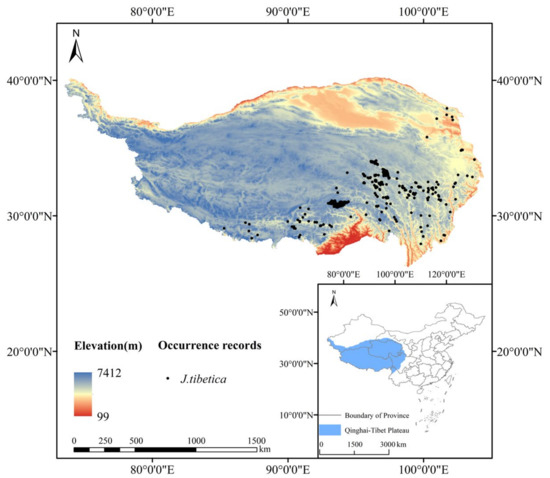
Figure 1.
Distribution points of J. tibetica on the QTP.
2.2. Collection of Environmental Data
The LGM, current and future climate data (including 19 bioclimatic variables in each scenario) and elevation data were downloaded from WorldClim (http://www.worldclim.org (accessed on 22 April 2022)) with a spatial resolution of 2.5’. Three future climate models—BCC-CSM1.1, CCSM4 and HADGEM2-ES—were selected for research to avoid the uncertainty caused by a single climate model. Bioclimatic variables for two GHG concentration paths (RCP2.6 and RCP8.5) in 2070 were collected. Slope and Aspect data were extracted by surface analysis tools in ArcGIS10.8. Data on provincial boundaries were obtained from the Chinese Resources and Environmental Sciences and Data Center (http://www.resdc.cn (accessed on 5 May 2022)). The boundary data of the QTP were obtained from the National Tibetan Plateau Data Center (http://www.data.tpdc.ac.cn (accessed on 23 April 2022)). Soil factor data were obtained from the Harmonized World Soil Database (http://www.iiasa.ac.at/web/home/research/researchPrograms/water/HWSD.html (accessed on 13 May 2022)) with a spatial resolution of 2.5’. A total of 28 environmental factors (19 bioclimatic factors, 3 terrain factors and 6 soil factors) were selected to simulate the DPSH of J. tibetica (Table 1).

Table 1.
Implication of environment variables used in the MaxEnt.
2.3. Selecting of Environmental Factors
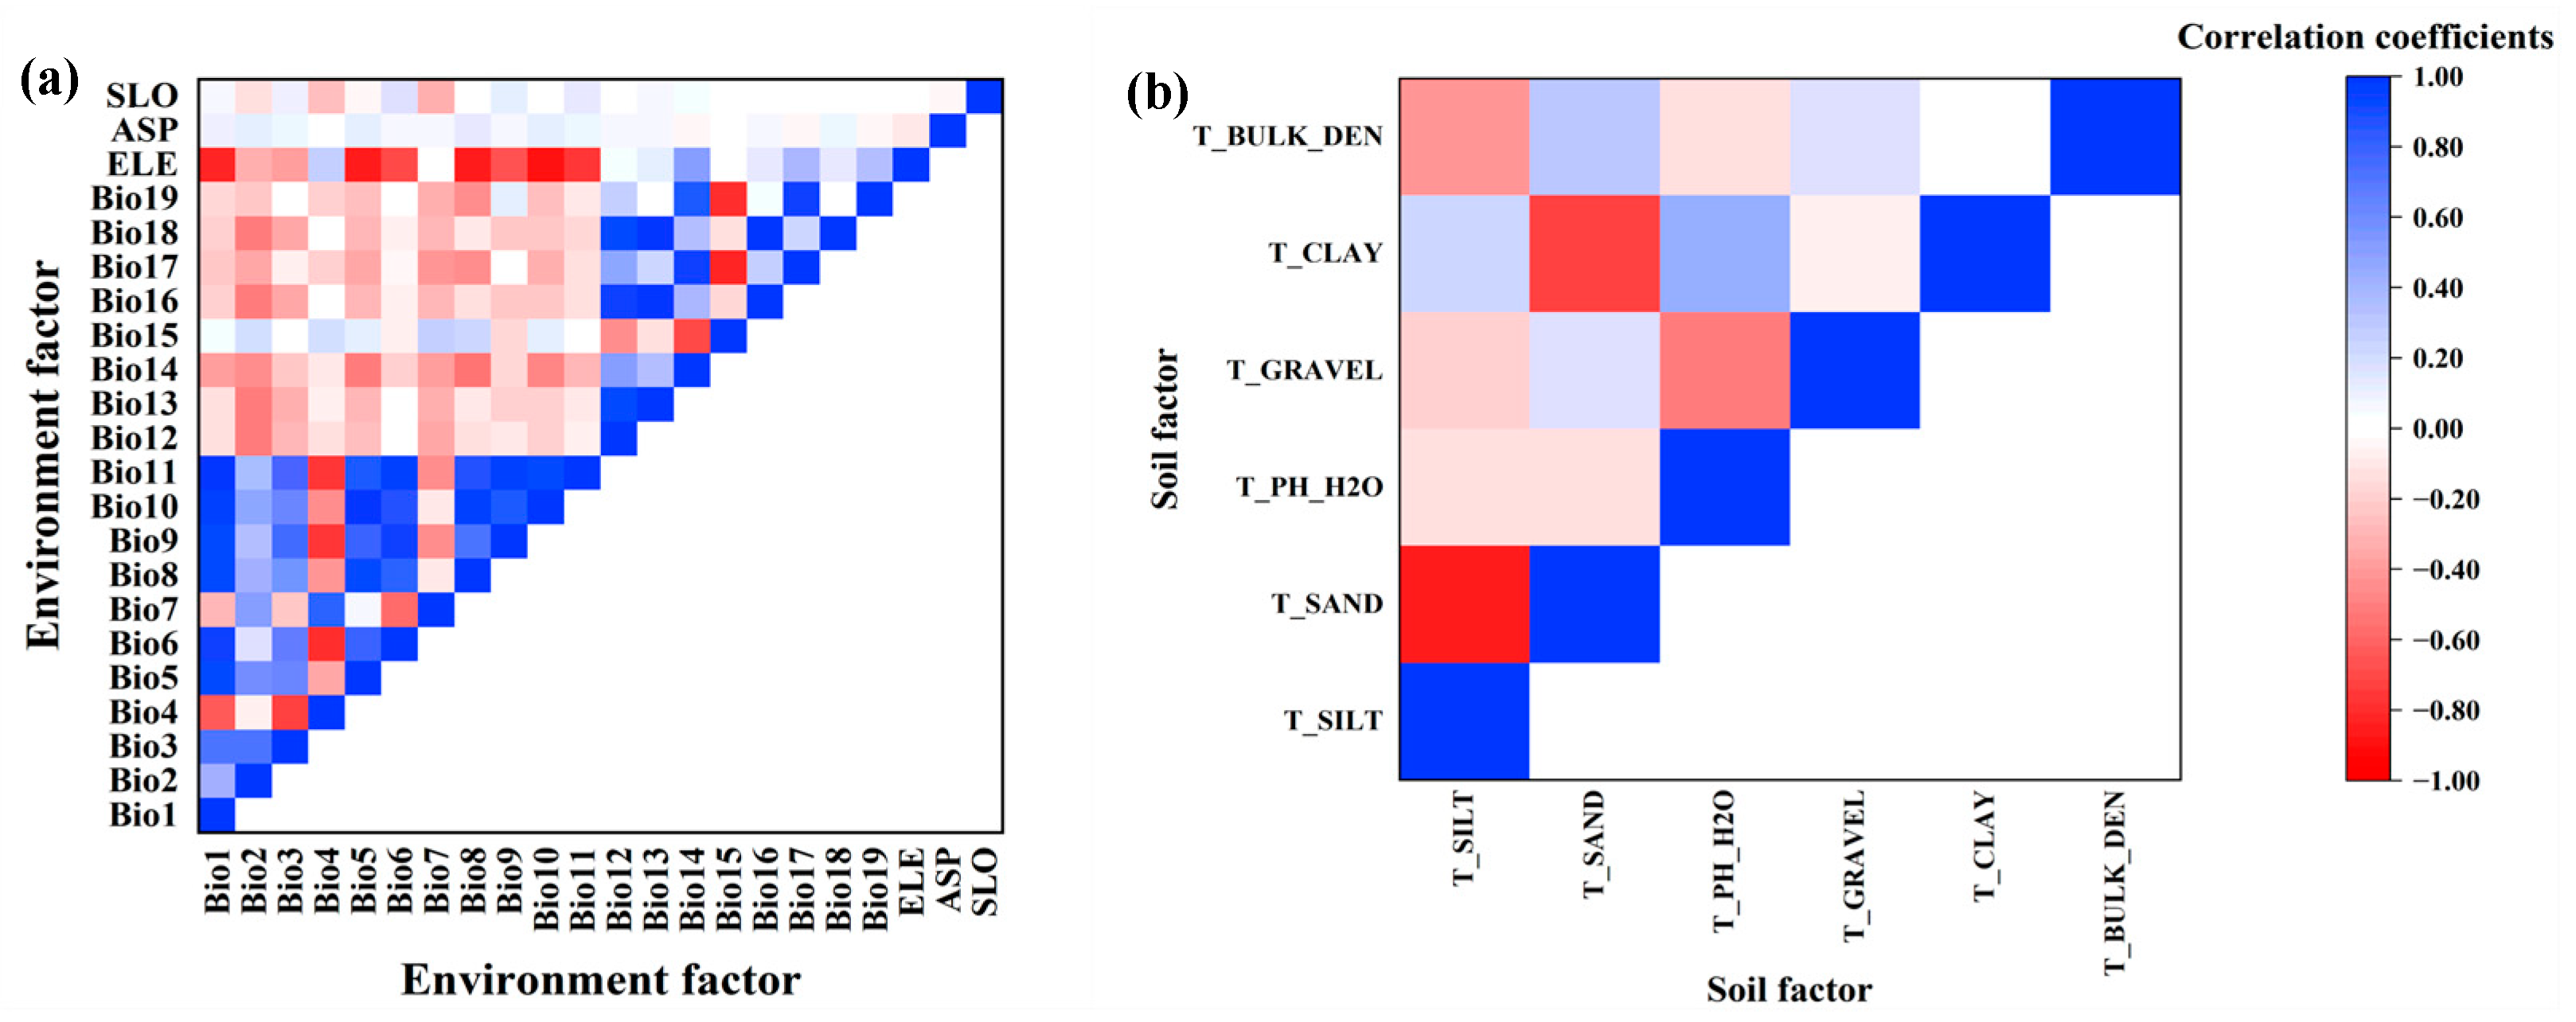
In order to avoid overfitting the model results due to strong correlations and collinearity among factors, Statistical Product and Service Solutions (SPSS 23, IBM, Armonk, NY, USA) and Stata (Stata 16, StataCorp LLC, Lakeway Dr, College Station, TX, USA) were used for the Pearson correlation coefficient test and variance inflation factor (VIF) analysis (Figure 2). When the correlation coefficient of the two factors was greater than 0.8, only one factor was selected, which was closely related to species distribution and can easily be explained by the model [37]. Factors with a VIF of less than 10 were selected among the remaining factors, referring to the study of Ranjitkar et al. [38], who suggested that there was no multicollinearity problem when the value of VIF between factors was less than 10. The values of VIF are shown in Table 2. Finally, four bioclimatic factors (annual mean temperature, annual precipitation, precipitation of driest month, precipitation seasonality), two terrain factors (elevation, aspect) and two soil factors (topsoil pH and topsoil gravel content) were selected for modeling.
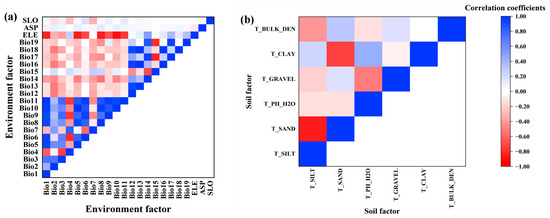
Figure 2.
Correlation of 28 environmental factors. (a) Correlation of environment factors; (b) Correlation of soil factors.

Table 2.
Variance inflation factor of eight factors.
2.4. Simulation and Evaluation of the Model
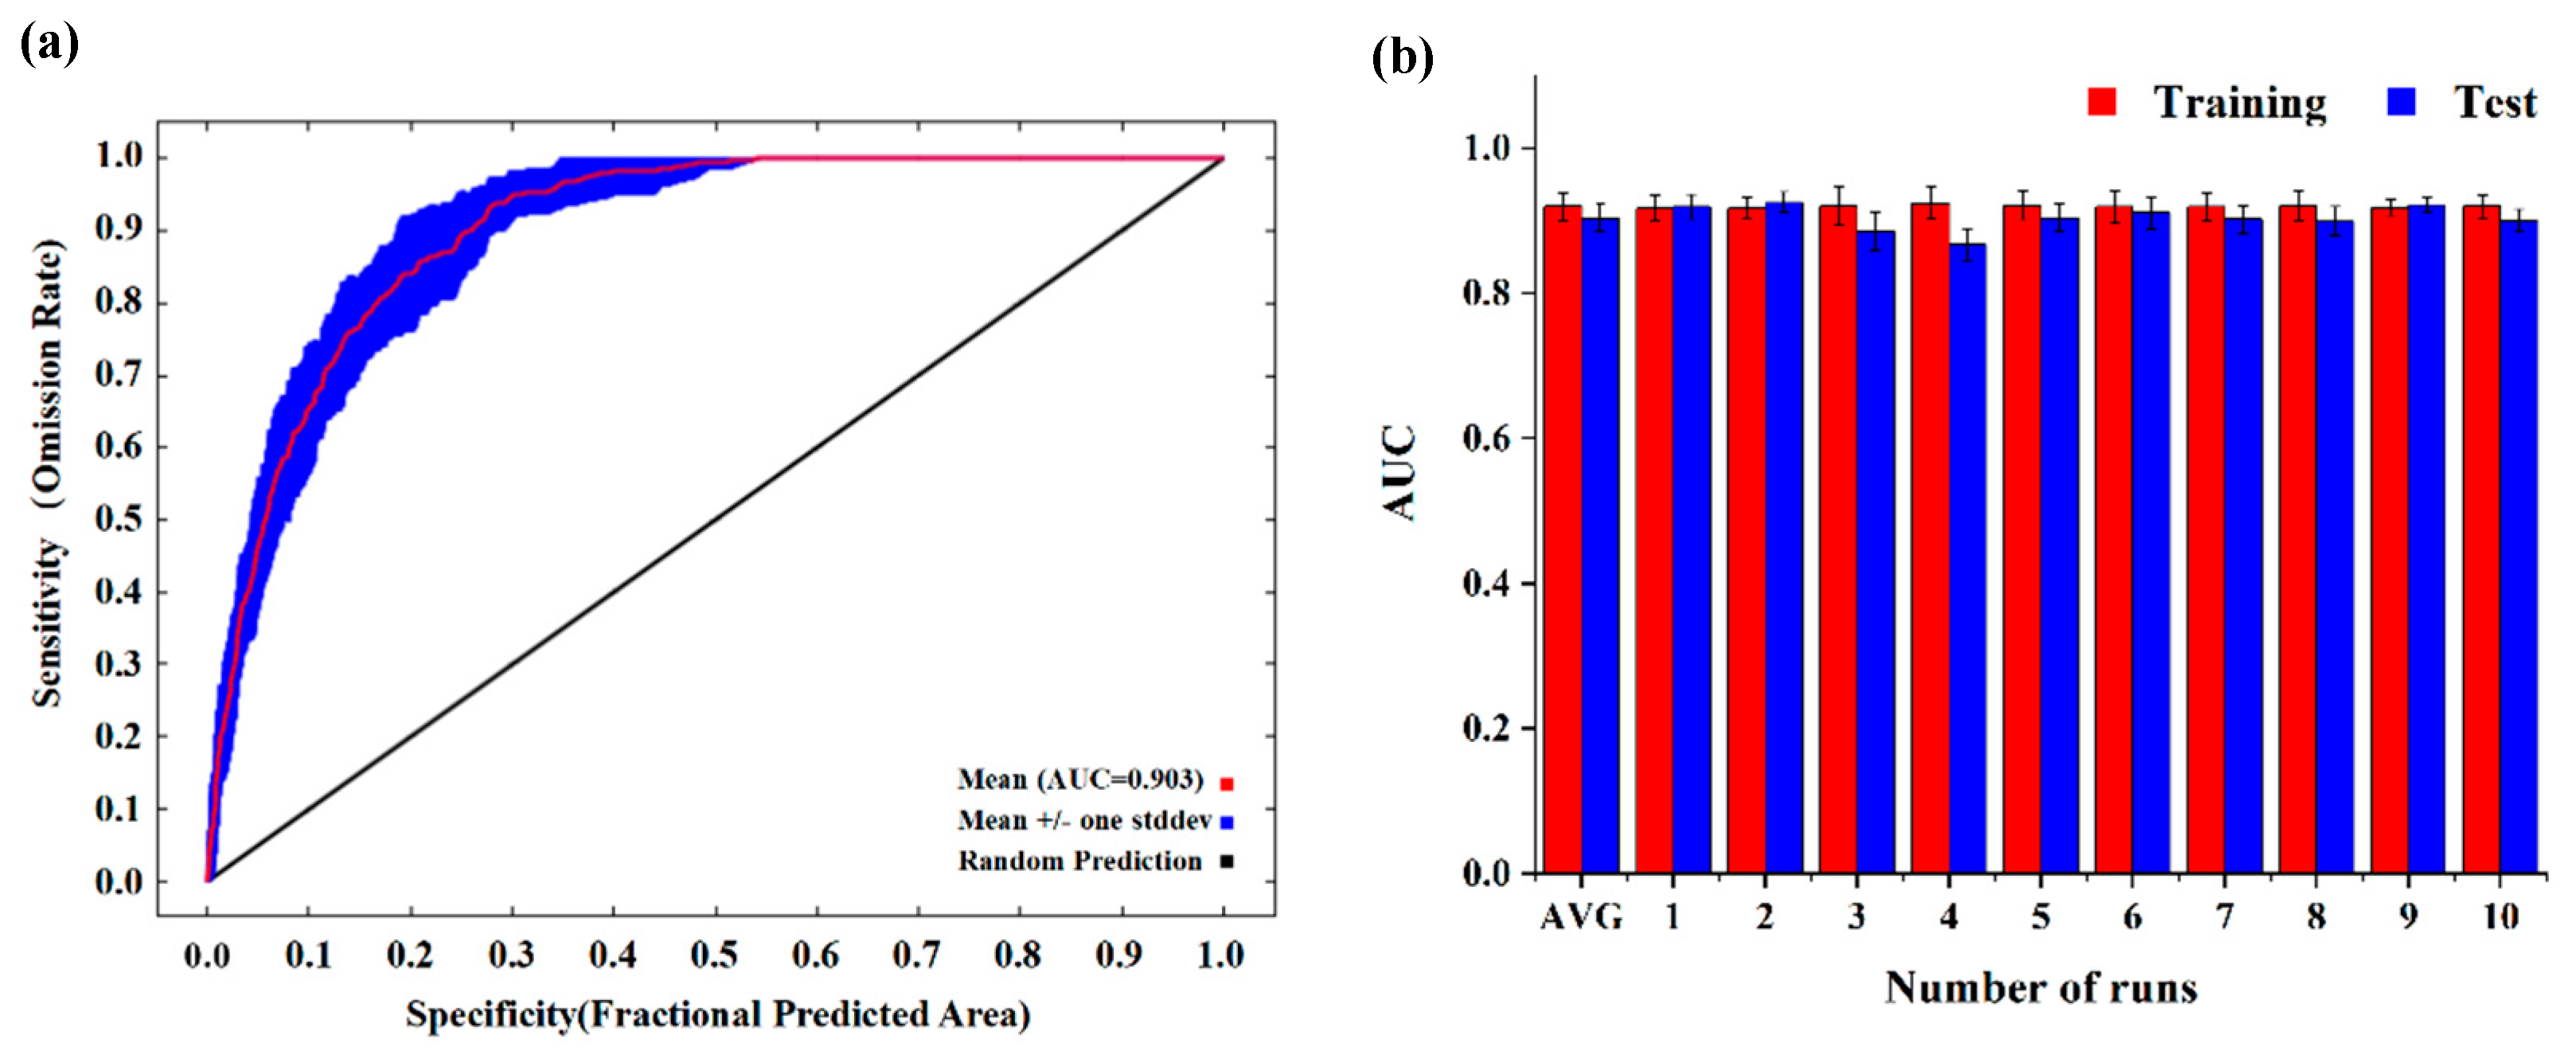
The distribution point data of J. tibetica in CSV format and environmental factor data in ASCII format were imported into MaxEnt (3.4.4, MIT, Central Park, NY, USA). A value of 75% of distribution point data was randomly selected as a training set for building the model, with the remaining 25% used as a test set for verification. The results were output after being repeated 10 times, and the output format was Logistic. The accuracy of the results was evaluated according to the value of the area under the receiver operating characteristic curve (AUC). The value of AUC ranges from 0 to 1, and the higher the value, the better the outcome of the model predictions [39]. The AUC obtained after 10-fold cross validation by MaxEnt was used to test the model accuracy. The results show that the average training value of AUC and the average test value of AUC were 0.9197 ± 0.002 and 0.9035 ± 0.018, respectively (Figure 3), indicating that the simulated results of the model were suitable and can predict the suitable habitat of J. tibetica accurately and stably.
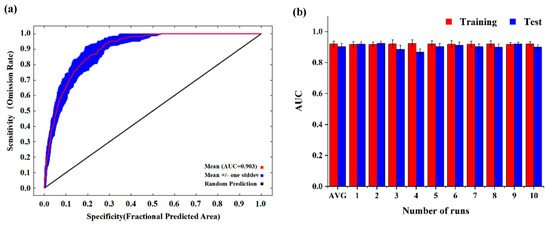
Figure 3.
Receiver operator characteristic (ROC) curve and model testing and training AUC values based on 10-times cross validation. (a) ROC curve; (b) Testing and training AUC values based on 10-times cross validation.
MaxEnt obtained a layer with a continuous probability (P) of 0–1, which could be used to determine the habitat suitability of plants in the study area [40]. Using tools for reclassification in ArcGIS, the maximum test sensitivity plus specificity threshold (MTSPS) was used as a boundary to divide the suitable habitat into four levels: unsuitable habitat, P ≤ MTSPS; marginally suitable habitat, MTSPS < P ≤ 0.4; moderately suitable habitat, 0.4 < P ≤ 0.6; and highly suitable habitat, P > 0.6 [41].
2.5. Standard Deviation Elliptic Analysis
The standard deviation ellipse (SDE) method is a spatial statistical method that can accurately describe the spatial distribution characteristics of elements and has been widely applied in the field of ecology [42]. This method can output a standard deviation ellipse, the coordinates of the centroid, the length of the long and short axes as well as the rotation angle of the ellipse. The length of the long and short axes indicated the extent to which the DPSH deviated from the centroid in the main and sub-trend. Oblateness was equal to the difference between the long and short axes divided by the long axes, revealing the spatial distribution of suitable habitats [43]. The rotation angle can be regarded as the angle between true north and the long axes.
2.6. Multivariate Environmental Similarity Surface (MESS) and the Most Dissimilar (MoD) Variable Analysis
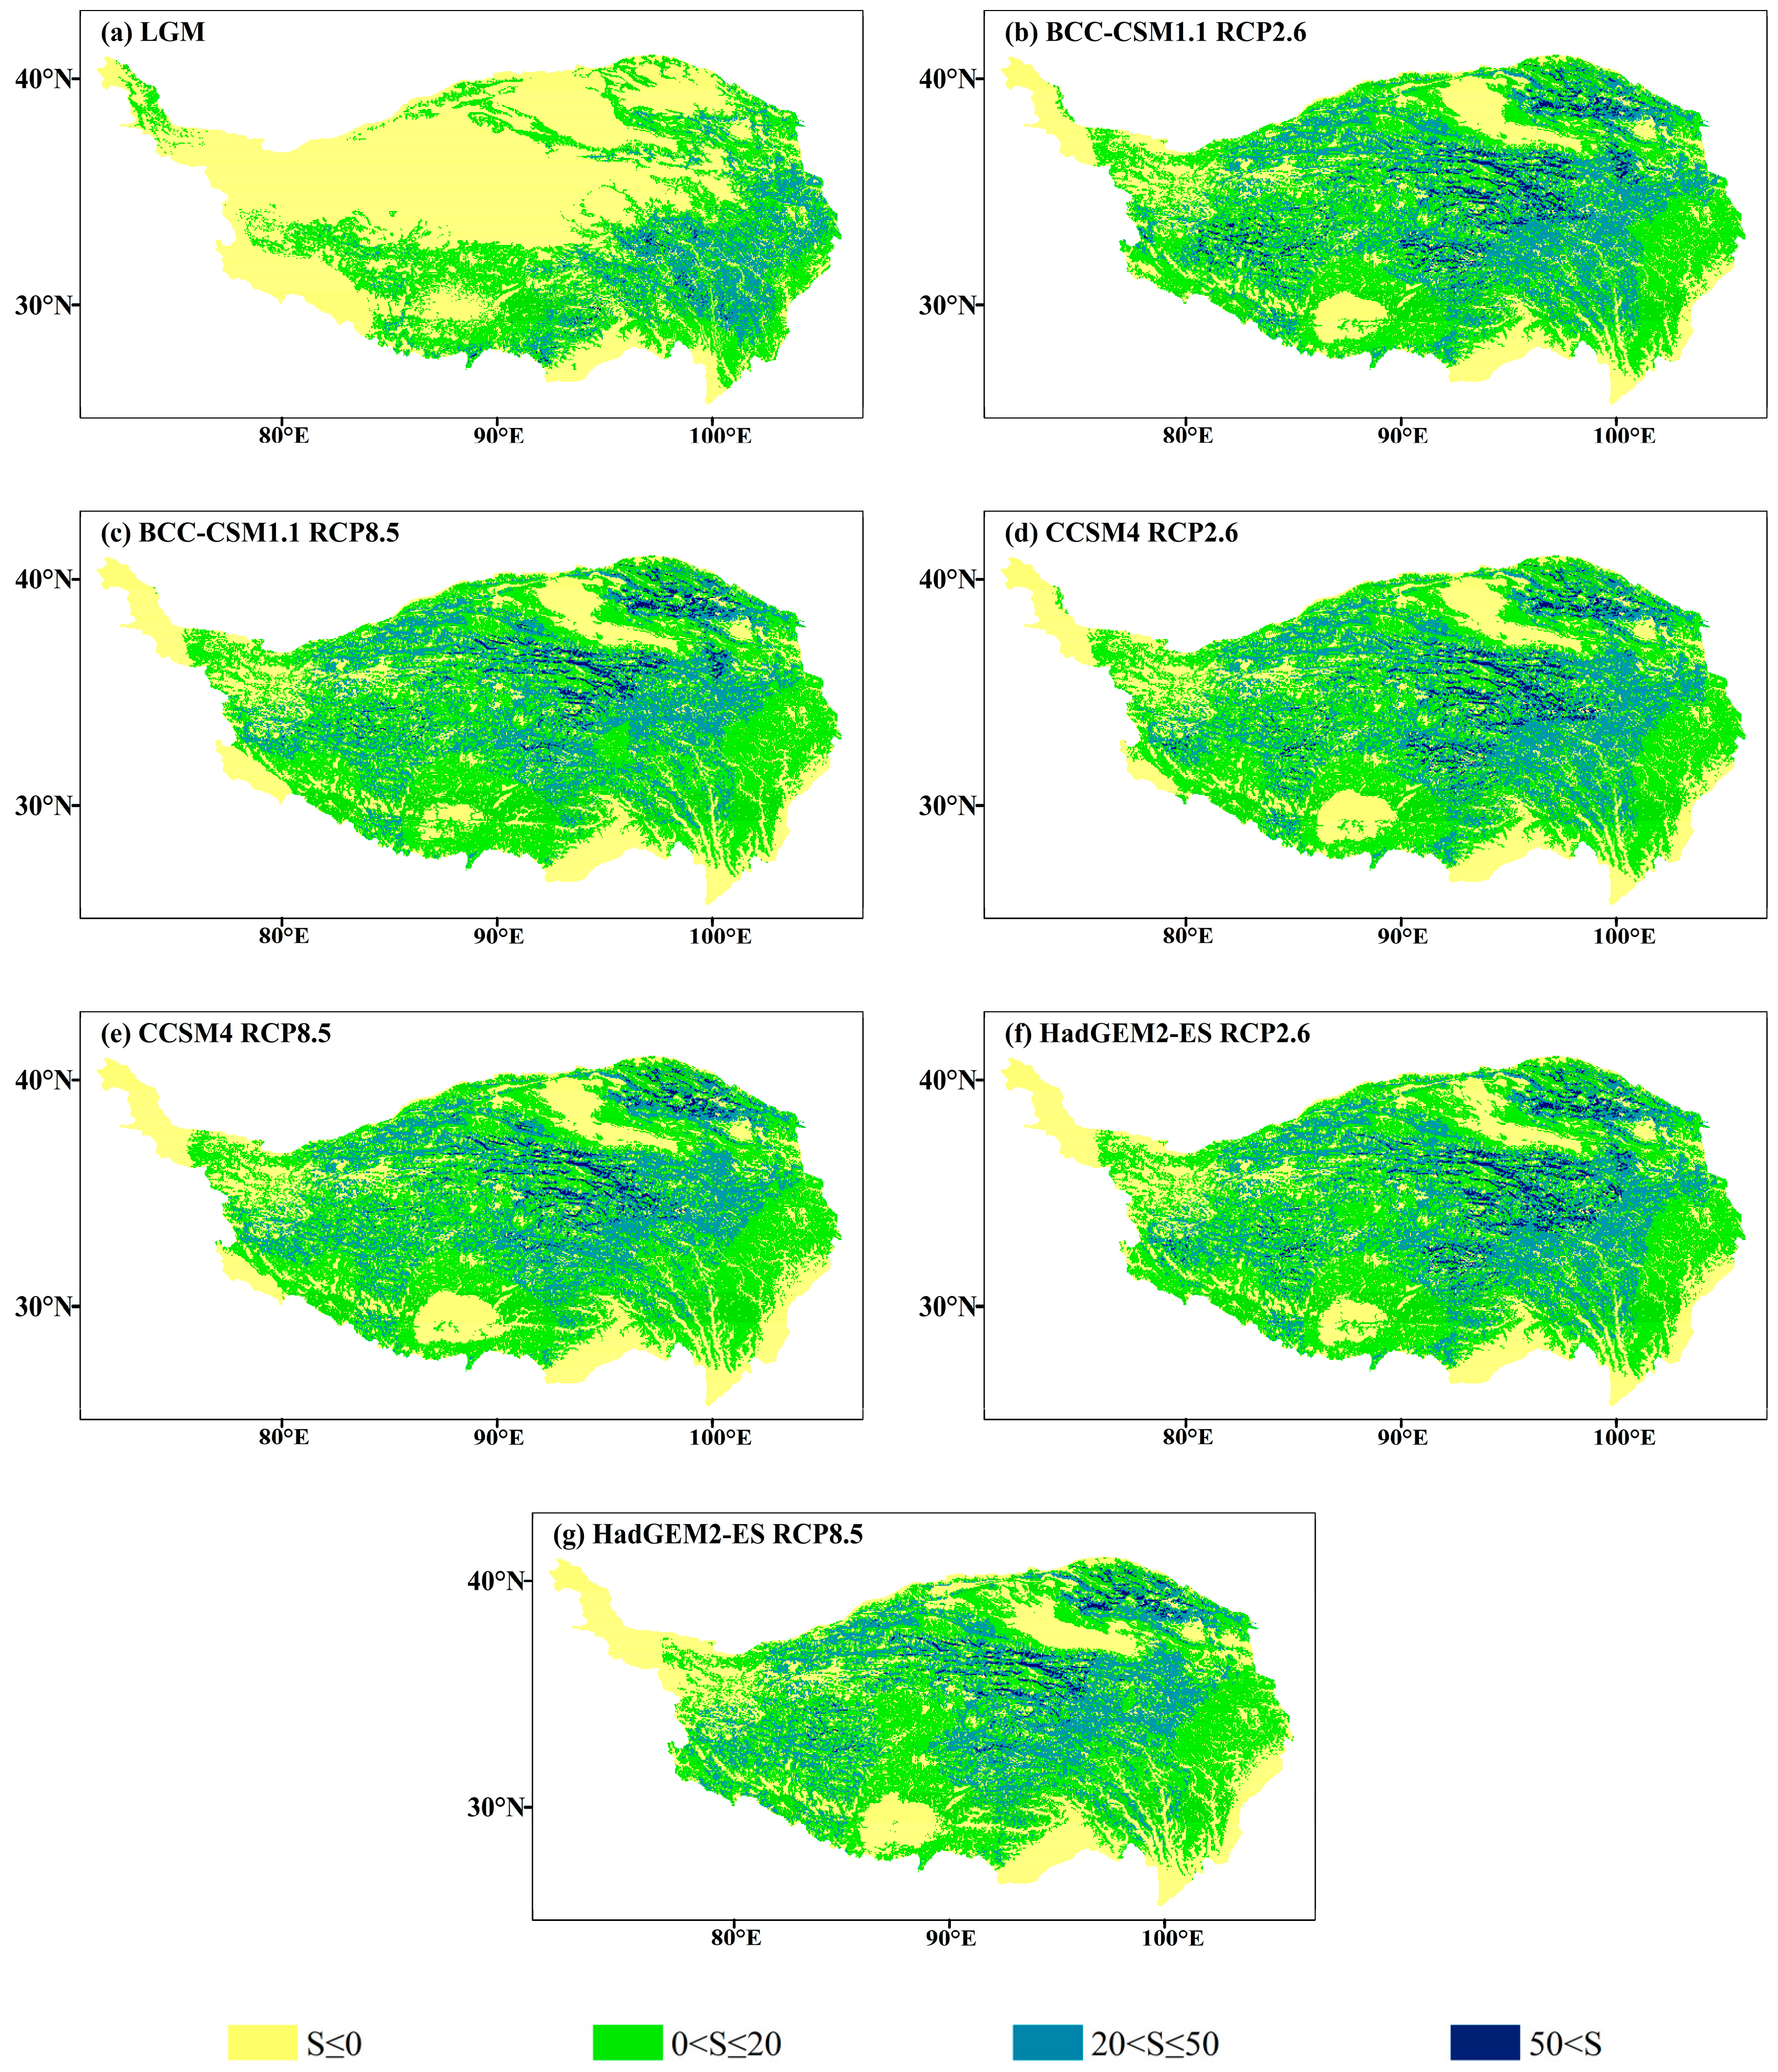
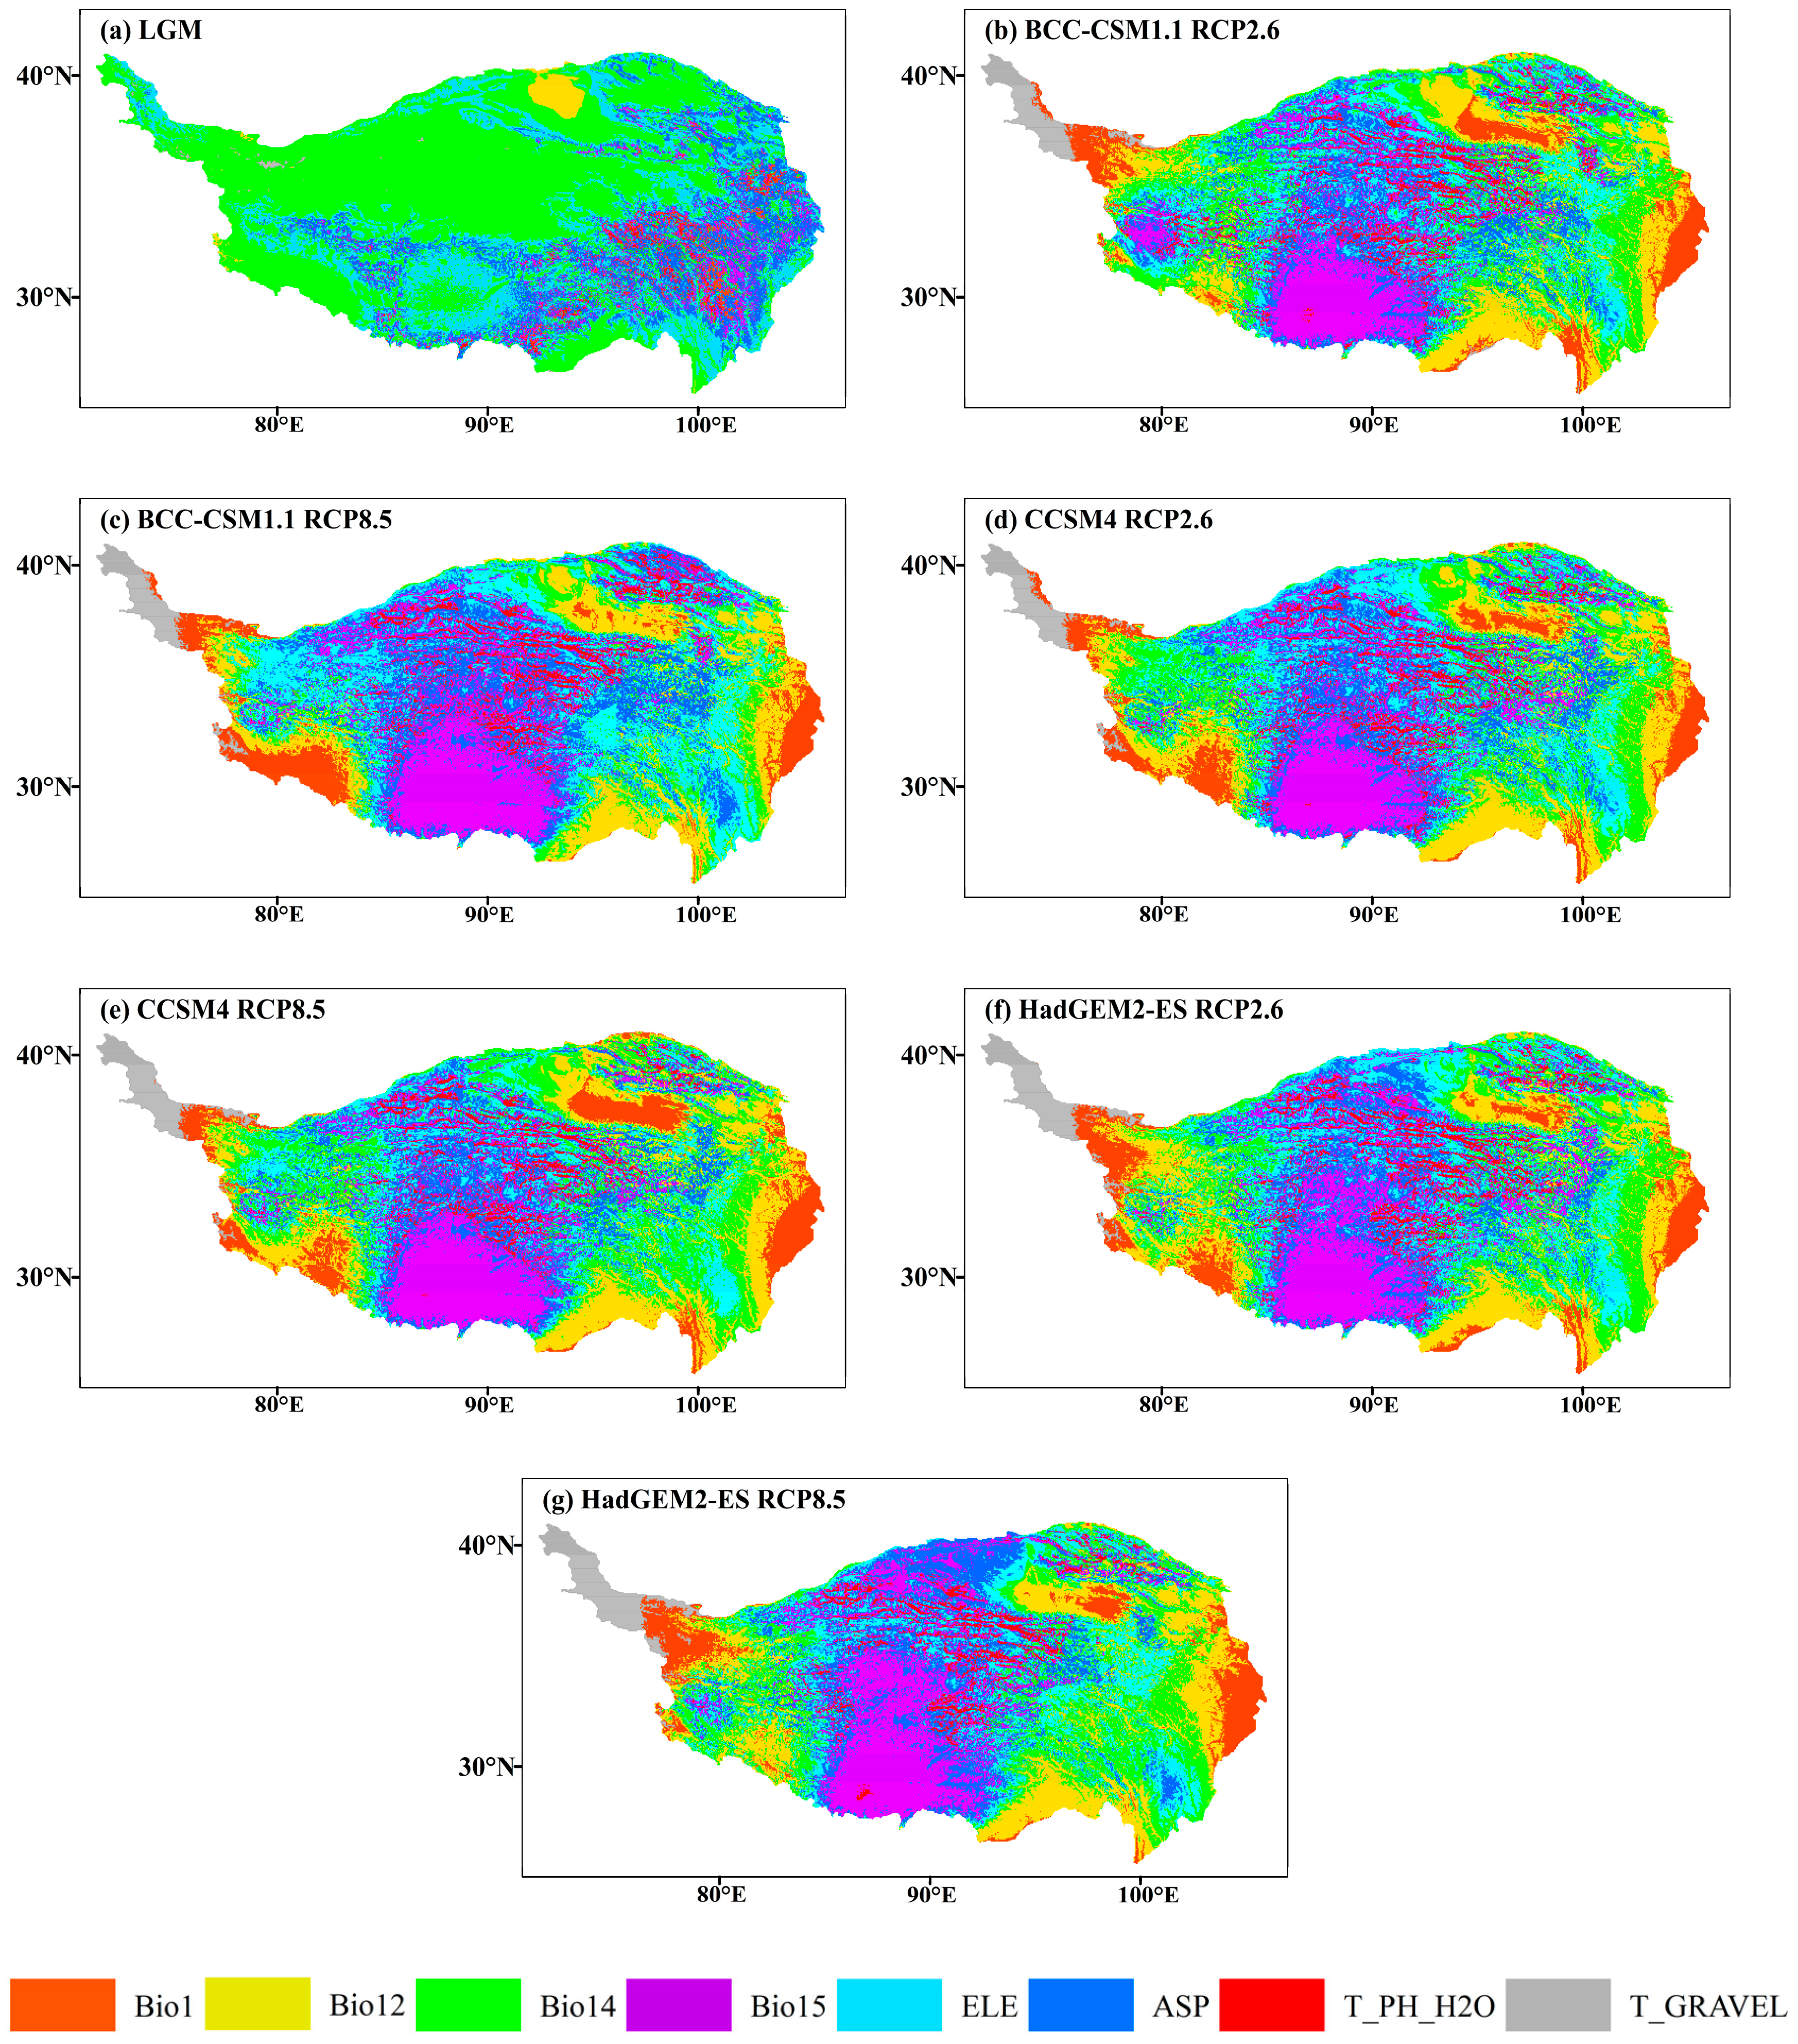
The MESS and MoD were used to analyze the abnormal fluctuation of the future climate and the environmental factors causing the abnormal climate in the current suitable habitat. The MESS was used to study the similarity (S) between different climatic conditions and current climatic conditions, with a maximum value of S as 100. S < 0 indicating that the climate of the region was abnormal, and at least one environmental factor was not within the reference range. Meanwhile, the smaller S was, the more abnormal the climate was. When S > 0, a larger S indicated that the climate of the region was more normal. When S = 100, there was no difference in climatic conditions [44,45]. The MoD was the environmental factor with the lowest similarity in a region, which was an important factor leading to the migration of suitable habitats in this region. The above operations can be performed in the “density. tools. Novel” tool in the maxent. jar file.
3. Results
3.1. Environmental Factors Affecting the DPSH of J. tibetica
Eight environmental factors were used for predicting the DPSH of J. tibetica, and the parameters of variables are shown in Table 3. The cumulative percent contribution (PC) and permutation importance (PI) of Bio1, Bio12 and Bio15 were 83.8779% and 77.0908%, respectively. The regularization training gain (RTG), test gain (TG) and AUC were then assessed. When only a single factor was used for model simulation, Bio12 obtained the highest RTG, TG and AUC, followed by Bio14 and Bio15. When simulated with the remaining variables other than a certain factor, Bio12 obtained the highest RTG, TG and AUC, followed by Bio1 and Bio15. To sum up, the leading factors affecting the current suitable habitat of J. tibetica were temperature factor (annual average temperature) and precipitation factor (annual precipitation, precipitation of driest month and precipitation seasonality).

Table 3.
The contribution rate and value of gain of climatic variables.
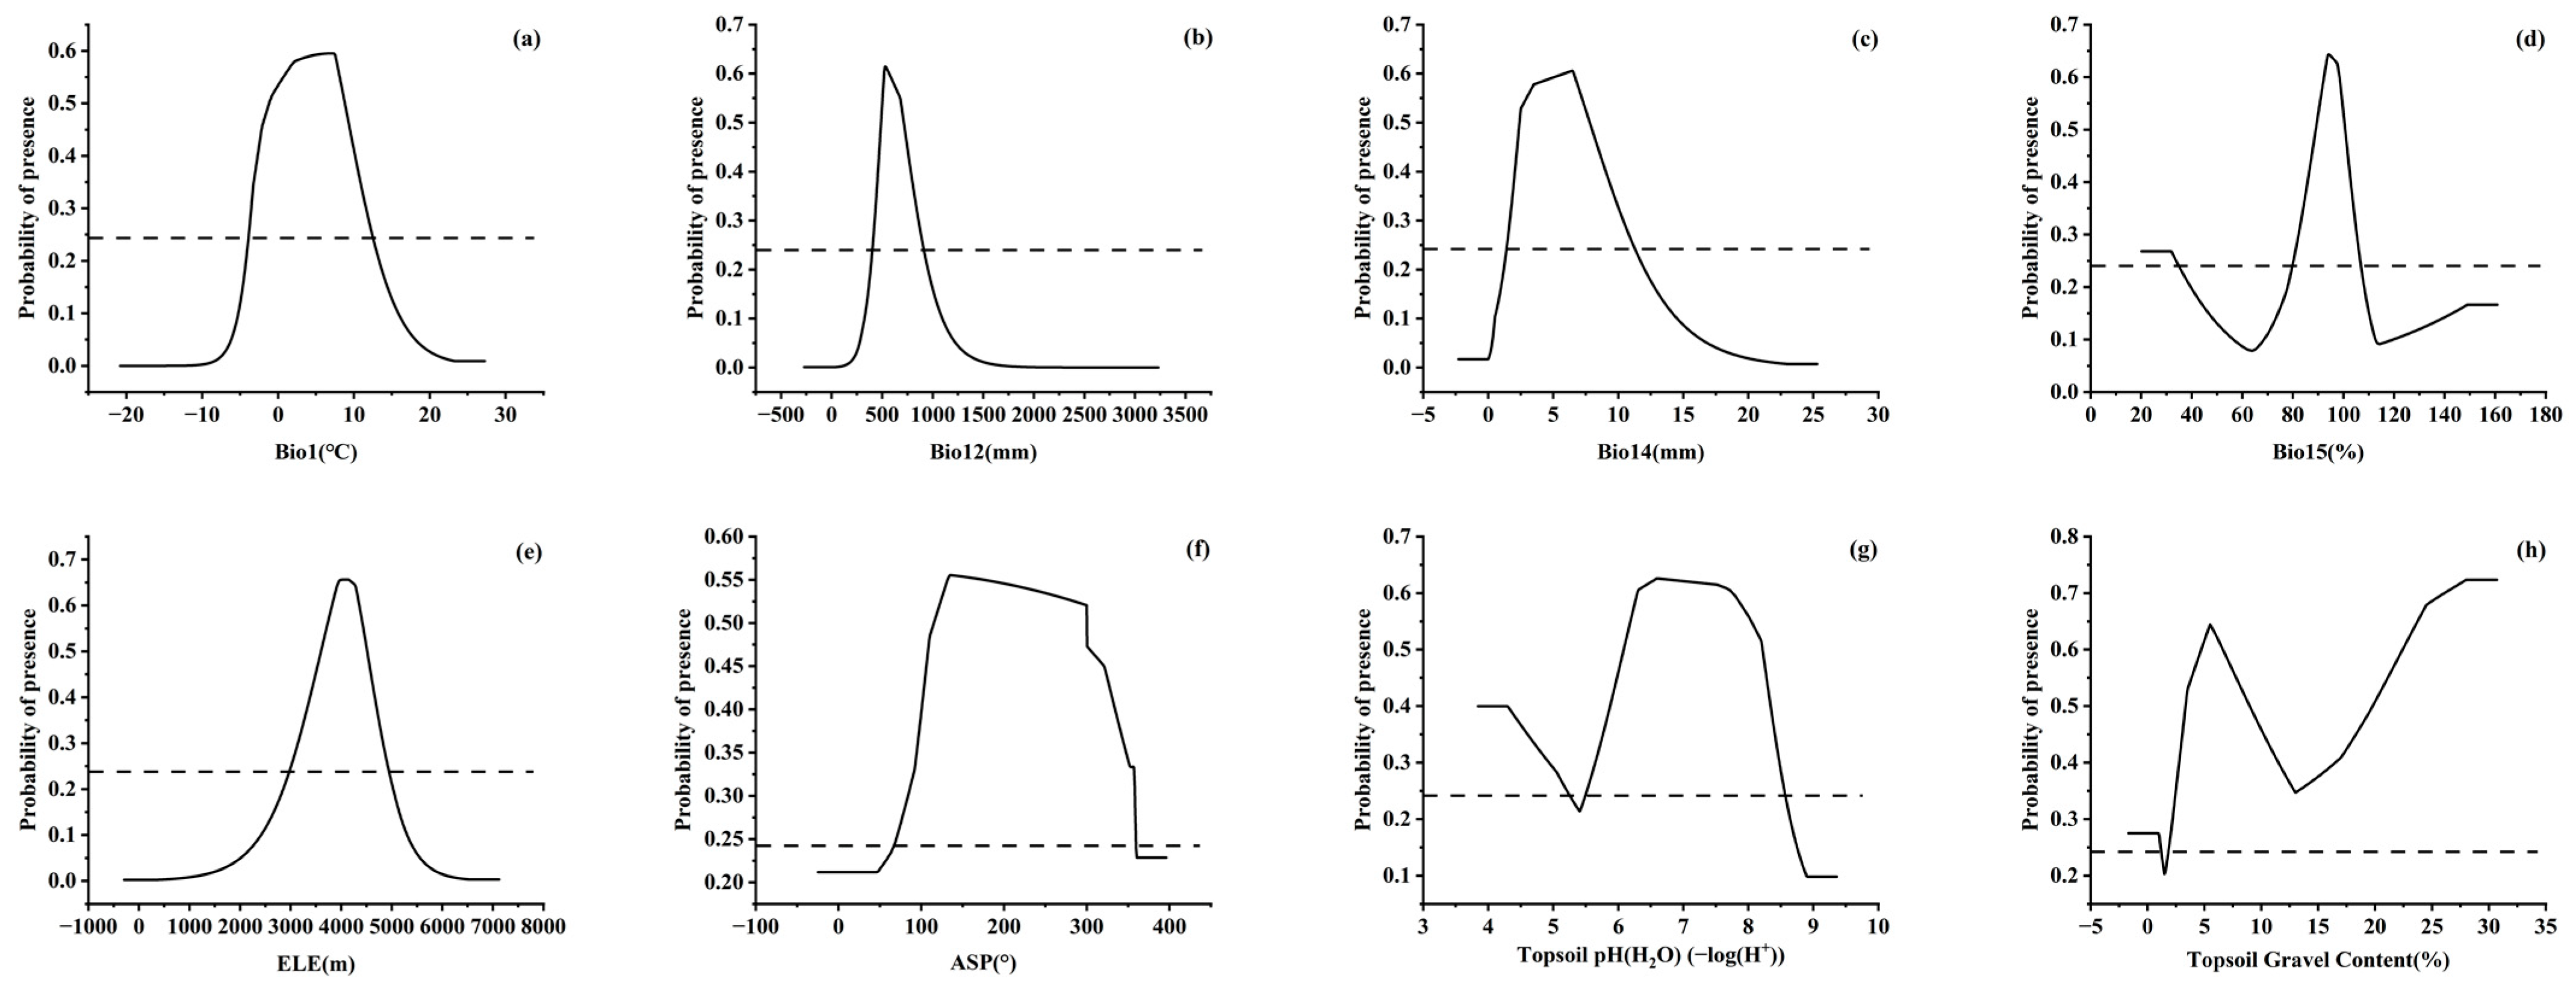
In order to visually explain the influence of each factor on the DPSH, the MaxEnt model gave the response curve between environmental factors and the distribution probability (Figure 4). Aidoo et al. [41] indicated that when the distribution probability was larger than MTSPS, the value of environmental factors was suitable for the growth of species. Therefore, MTSPS was used as the threshold to classify the range of environmental factors suitable for the distribution of J. tibetica. The range of annual mean temperature suitable for the growth of J. tibetica was from −3.9 °C to 12.4 °C, and the optimum value was 7 °C. The range of annual precipitation and the precipitation of the driest month suitable for growth were 406.9–901.1 mm (optimal at 526.1 mm) and 1.5–11.2 mm (optimal at 6.5 mm), respectively. The precipitation seasonality suitable for growth was 80.2%–106.6% with the optimum value at 94.1%. The suitable elevation range for growth was 3005.4–4919.7 m when the most suitable elevation was 4073.8 m. The suitable aspect range was 72.6–359.6°, and the best was 135.3°. The suitable topsoil pH and gravel content were both located in two ranges. For the topsoil’s pH, the suitable ranges were 3.8–5.2 and 5.5–8.6, and the optimum value was 6.6. The suitable topsoil gravel content was 0%–1.2% and 1.9%–30.7% with the optimum values at 5.5%.
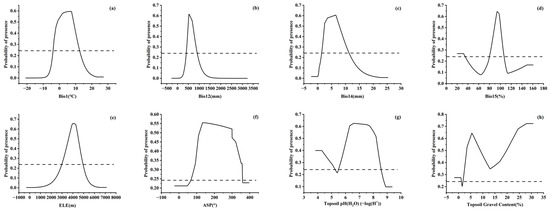
Figure 4.
Response curves of probability of presence for J. tibetica. (a) Response curve of Bio1; (b) response curve of Bio12; (c) response curve of Bio14; (d) response curve of Bio15; (e) response curve of ELE; (f) response curve of ASP; (g) response curve of Topsoil pH (H2O); (h) response curve of Topsoil Gravel Content.
3.2. DPSH of J. tibetica under Three Climatic Conditions
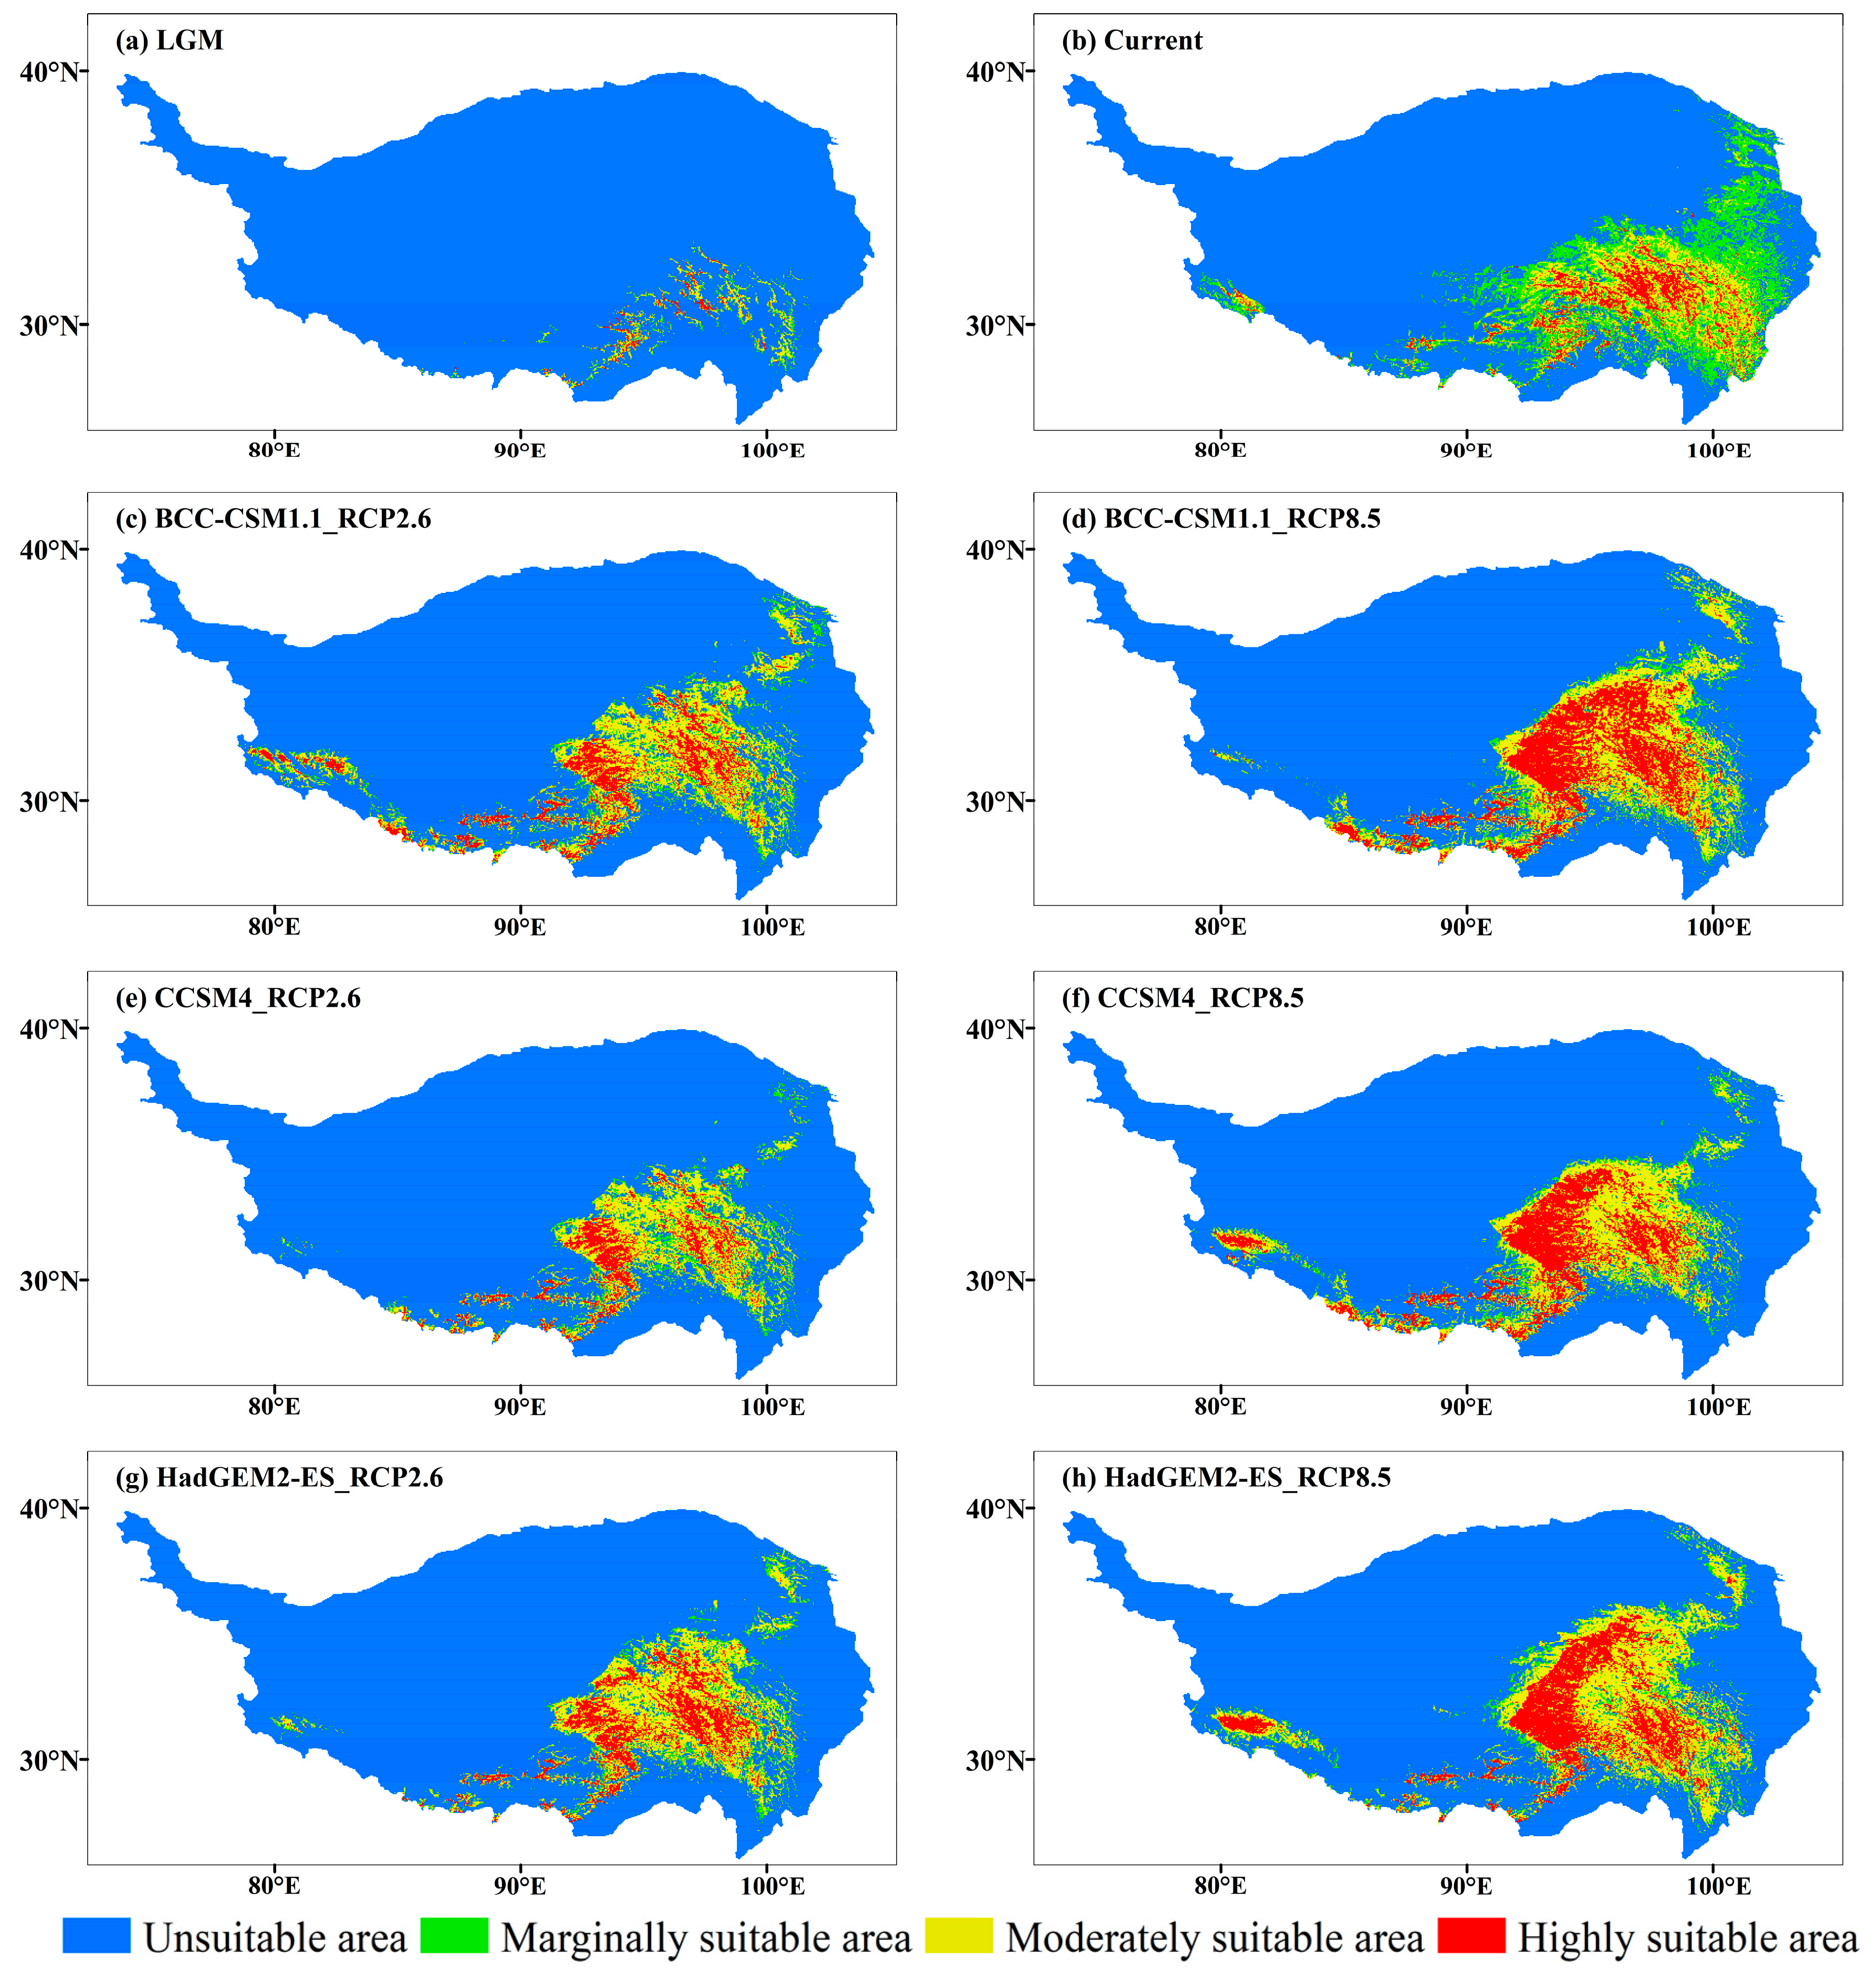
The suitable habitat of J. tibetica in the current climate was very wide and mostly nestled among the mountains and around rivers on the QTP. Highly suitable habitats were mainly distributed in Yarlung Zangbo River Basin, northeast of Tibet and west of Sichuan (Figure 5). Table 4 shows the area of suitable habitats for each grade. The distribution ratio of 288 distribution points of J. tibetica in different suitable habitats was as follows: 44.4% in highly suitable habitats, 31.9% in moderately suitable habitats, 17% in marginally suitable habitats and 6.5% in unsuitable habitats; this indicates that the current suitable habitat simulated by MaxEnt can cover these distribution points. The mean climate fitness of the 288 record points was 0.545, while the maximum was 0.906 (in the TongTian River Basin) and the minimum was 0.038 (in the middle reaches of Yarlung Zangbo River).
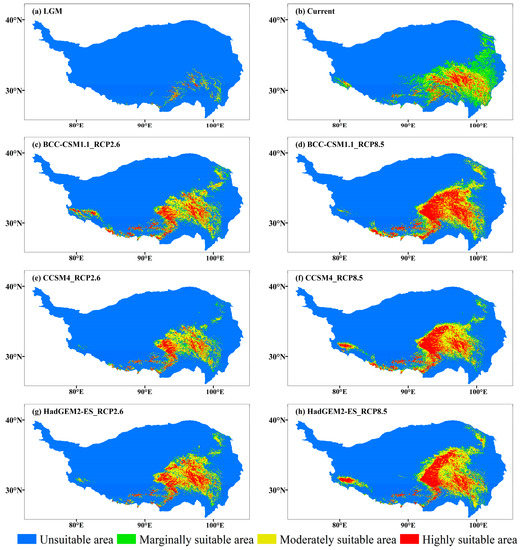
Figure 5.
The suitable habitat of J. tibetica under different climate scenarios. (a) Suitable habitat during the LGM; (b) Current suitable habitat; (c) Suitable habitat for the BCC-CSM1.1 (RCP2.6) in 2070; (d) Suitable habitat for the BCC-CSM1.1 (RCP8.5) climate scenario in 2070; (e) Suitable habitat for the CCSM4 (RCP2.6) in 2070; (f) Suitable habitat for the CCSM4 (RCP8.5) in 2070; (g) Suitable habitat for the HadGEM2-ES (RCP2.6) in 2070; (h) Suitable habitat for the HadGEM2-ES (RCP8.5) in 2070.

Table 4.
Area of suitable habitat of J. tibetica in different periods (×104 km2).
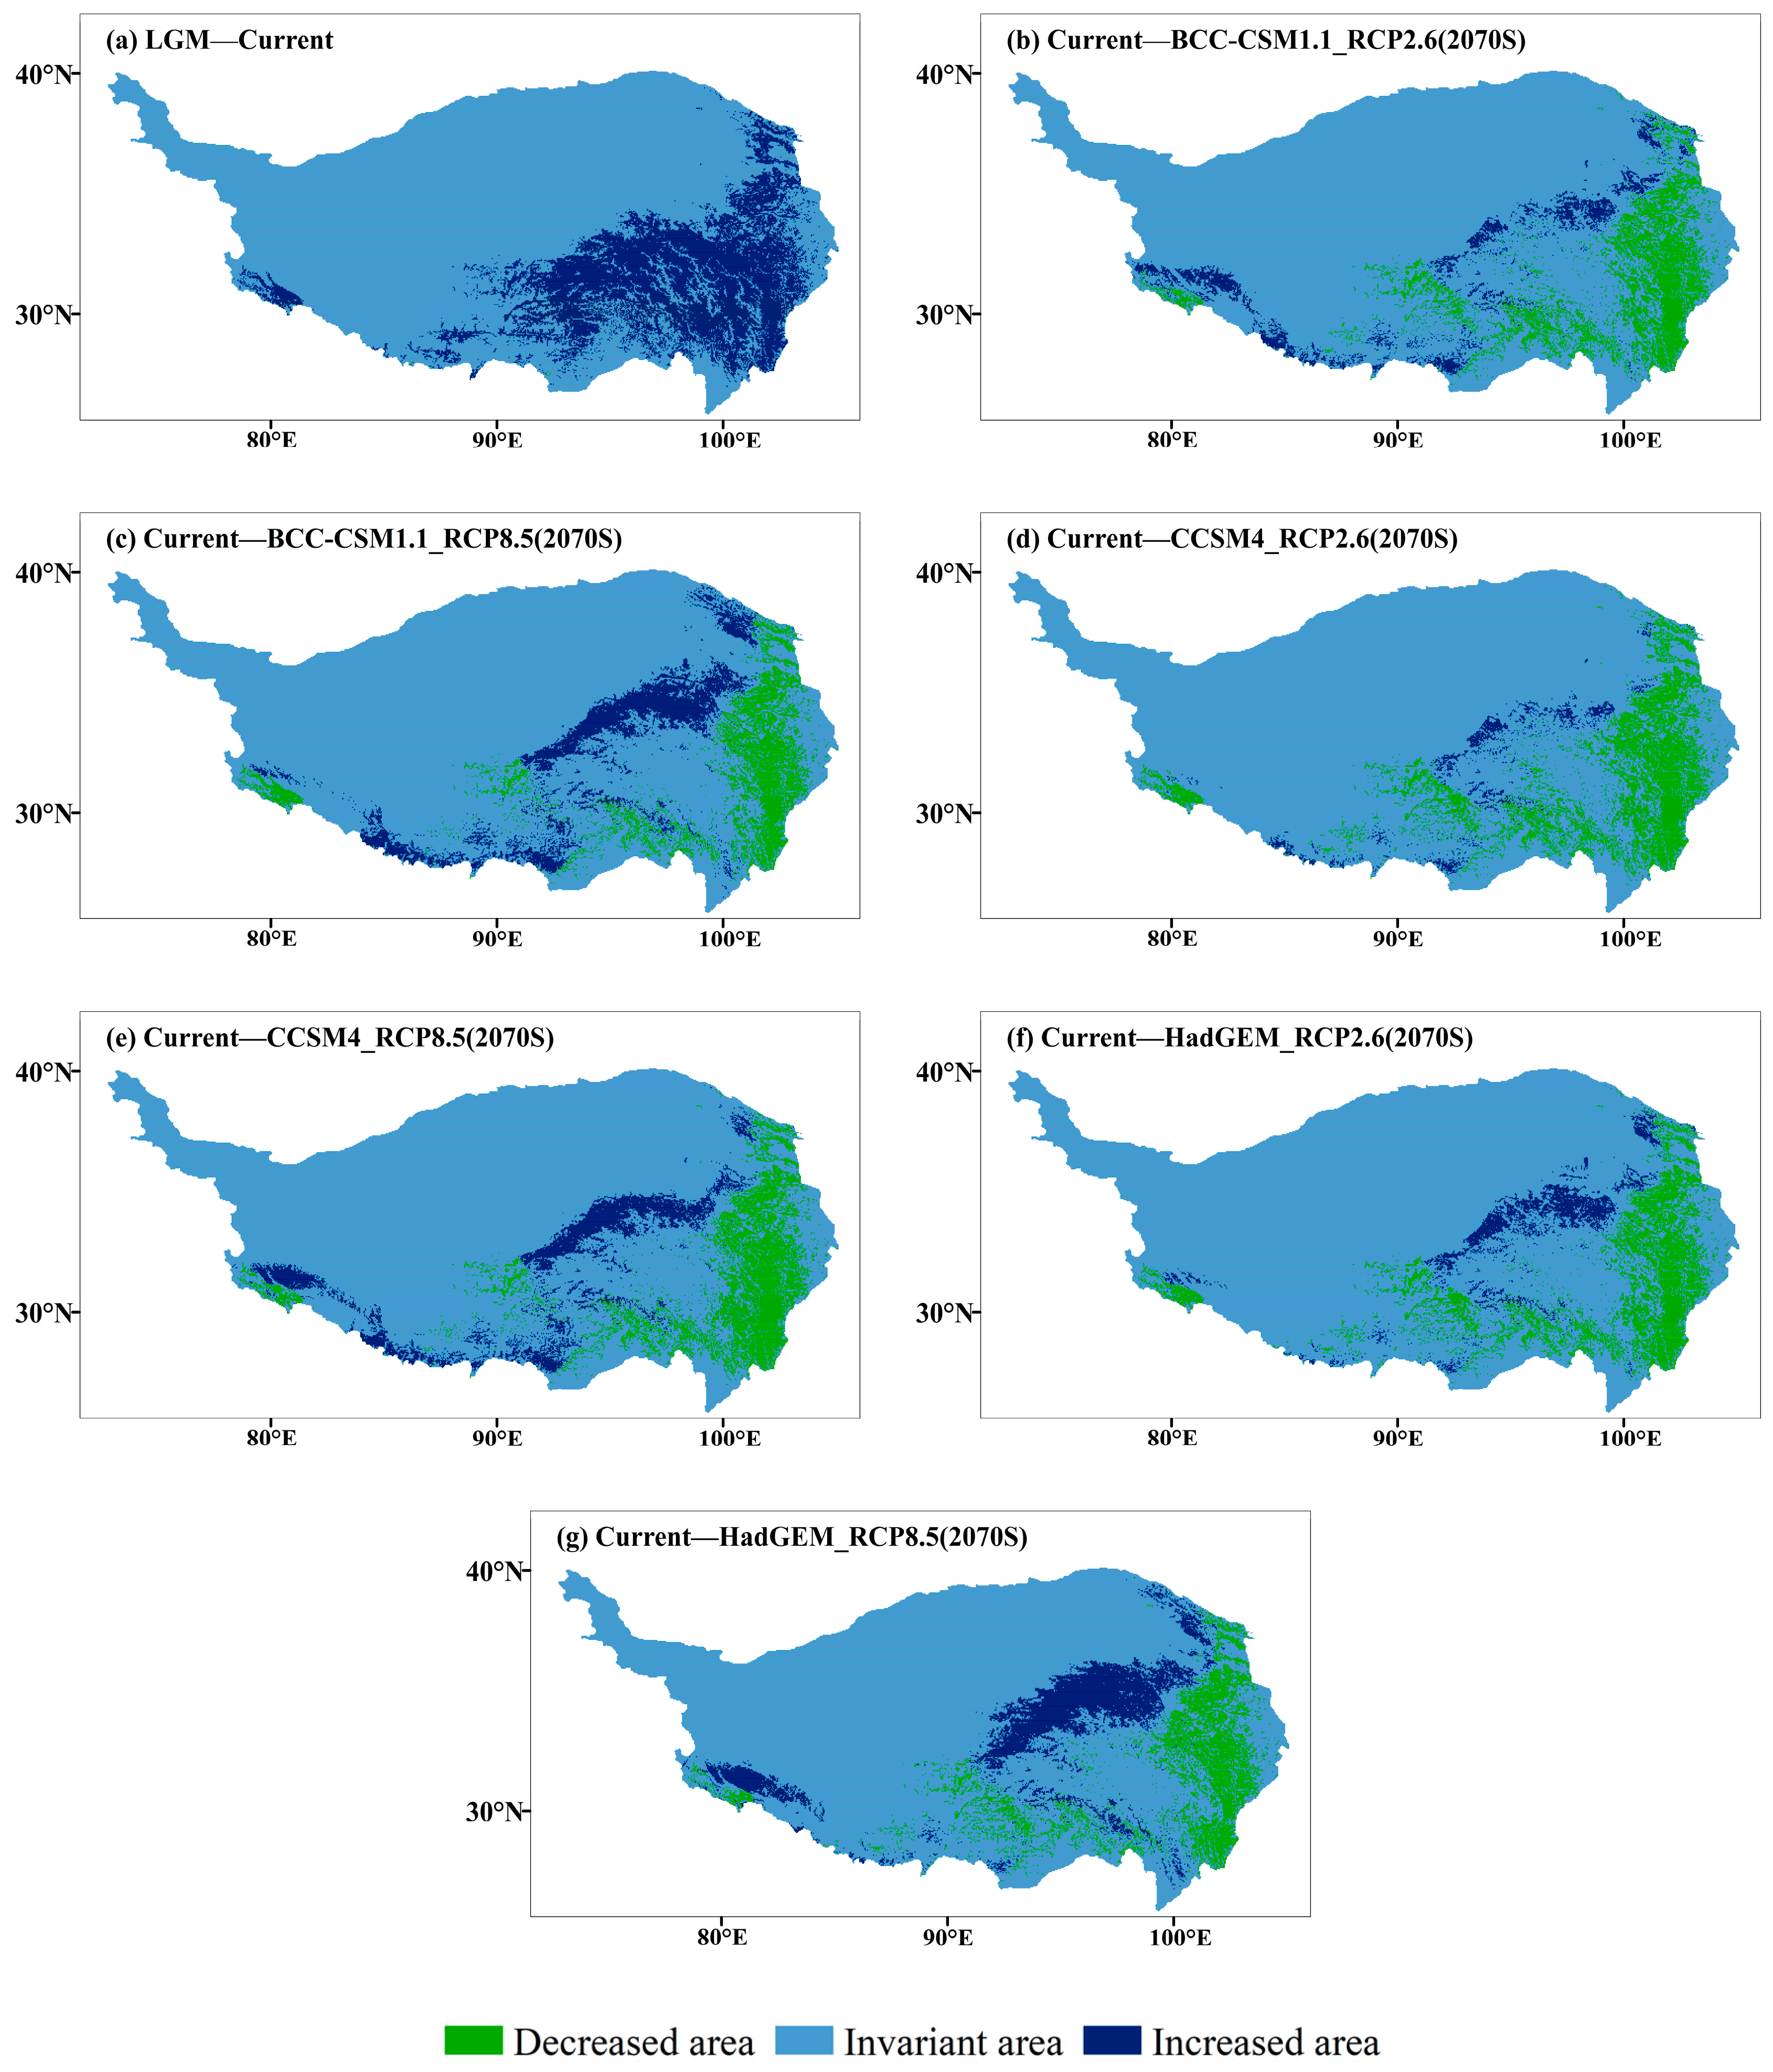
During the LGM, the suitable habitats of J. tibetica were few and fragmented and were mainly located in the lower reaches of Yarlung Zangbo River, northeast Tibet and the border of Tibet and Sichuan (Figure 5). From the LGM to the current time, the area of the suitable habitat for J. tibetica expanded greatly. The new areas were mainly in the southeastern part of the QTP and the western tip of the Himalayas (Figure 6).
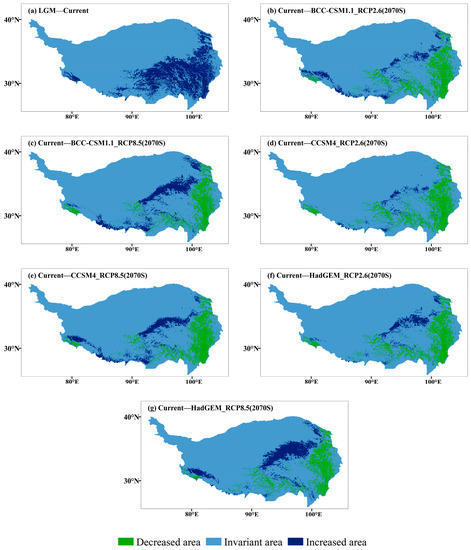
Figure 6.
Changes of suitable habitat J. tibetica under different climate scenarios. (a) Differences between current and LGM modelled suitable habitat, including areas decreased and increased since the LGM; (b) Differences between BCC-CSM1.1 (RCP2.6) and current modelled suitable habitat; (c) Differences between BCC-CSM1.1 (RCP8.5) and current modelled suitable habitat; (d) Differences between CCSM4 (RCP2.6) and current modelled suitable habitat; (e) Differences between CCSM4 (RCP8.5) and current modelled suitable habitat; (f) Differences between HadGEM2-ES (RCP2.6) and current modelled suitable habitat; (g) Differences between HadGEM2-ES (RCP8.5) and current modelled suitable habitat.
In the 2070 RCP2.6 climate scenario, the simulation results of three climate models show that the highly suitable habitats are distributed along the border of Tibet, Qinghai and Sichuan, the southern part of Qinghai Plateau, the lower sides of Yarlung Zangbo River, the two sides of Nyenchen Tangula Mountain and the vicinity of the Himalaya Mountains. In the 2070 RCP8.5 climate scenario, the highly suitable habitats were distributed in the southern Tibetan Valley, northeastern Tibet, western Sichuan, southern and northern Qinghai and the hinterlands (Figure 5). Compared with the current distribution, except for HadGEM2-ES (RCP8.5), the results of the other climate models indicated that the total area of suitable habitat of J. tibetica will be reduced in 2070. When climate models BCC-CSM1.1 (RCP2.6), HadGEM2-ES (RCP2.6), BCC-CSM1.1 (RCP8.5) and CCSM4 (RCP8.5) were used for simulation, the area of moderately and highly suitable habitat increased, while the area of not suitable habitats decreased. Under the simulation of CCSM4 (RCP2.6), the area of marginally and highly suitable habitats decreased, while the area of moderately suitable habitats increased. Under the simulation of HadGEM2-ES (RCP8.5), the area of moderately and highly suitable habitats was enhanced, while the area of marginally suitable habitats reduced. The change in suitable habitat is shown in Table 5. In general, in future climate conditions, the degraded area of suitable habitats simulated under different climate scenarios will be located in the eastern areas of the QTP, the central and eastern parts of Tibet and the western end of the Himalayas. The increased area of suitable habitats will be located in the southern Qilian Mountains, southern Qinghai, northeastern Tibet and around the Himalayan and Kailas Range (Figure 6).

Table 5.
Suitable habitat of J. tibetica in different periods (×104 km2).
The analysis of the suitable habitats of J. tibetica for the three periods in Figure 5 reveals that 99.42% of the suitable habitats (marginally, moderately and highly suitable habitat) during the LGM period became the current suitable habitat, indicating that J. tibetica can survive in these areas for a long period of time. Moreover, 82.25%–88.01%, 81.27%–82.34% and 82.28%–83.78% of these areas became suitable habitats, as simulated by BCC-CSM1.1, CCSM4 and HadGEM2-ES, respectively. These results show that the suitable habitat during the LGM period will be maintained in the future to a large extent. These areas were located in the northern part of the Great Bend of the Yarlung Zangbo River, the Lancang River and the northeastern part of the Nyenchen Tangula Mountain, where potentially important refugia and important nature reserves for J. tibetica are located.
3.3. Temporal and Spatial Evolution of the Suitable Habitat of J. tibetica
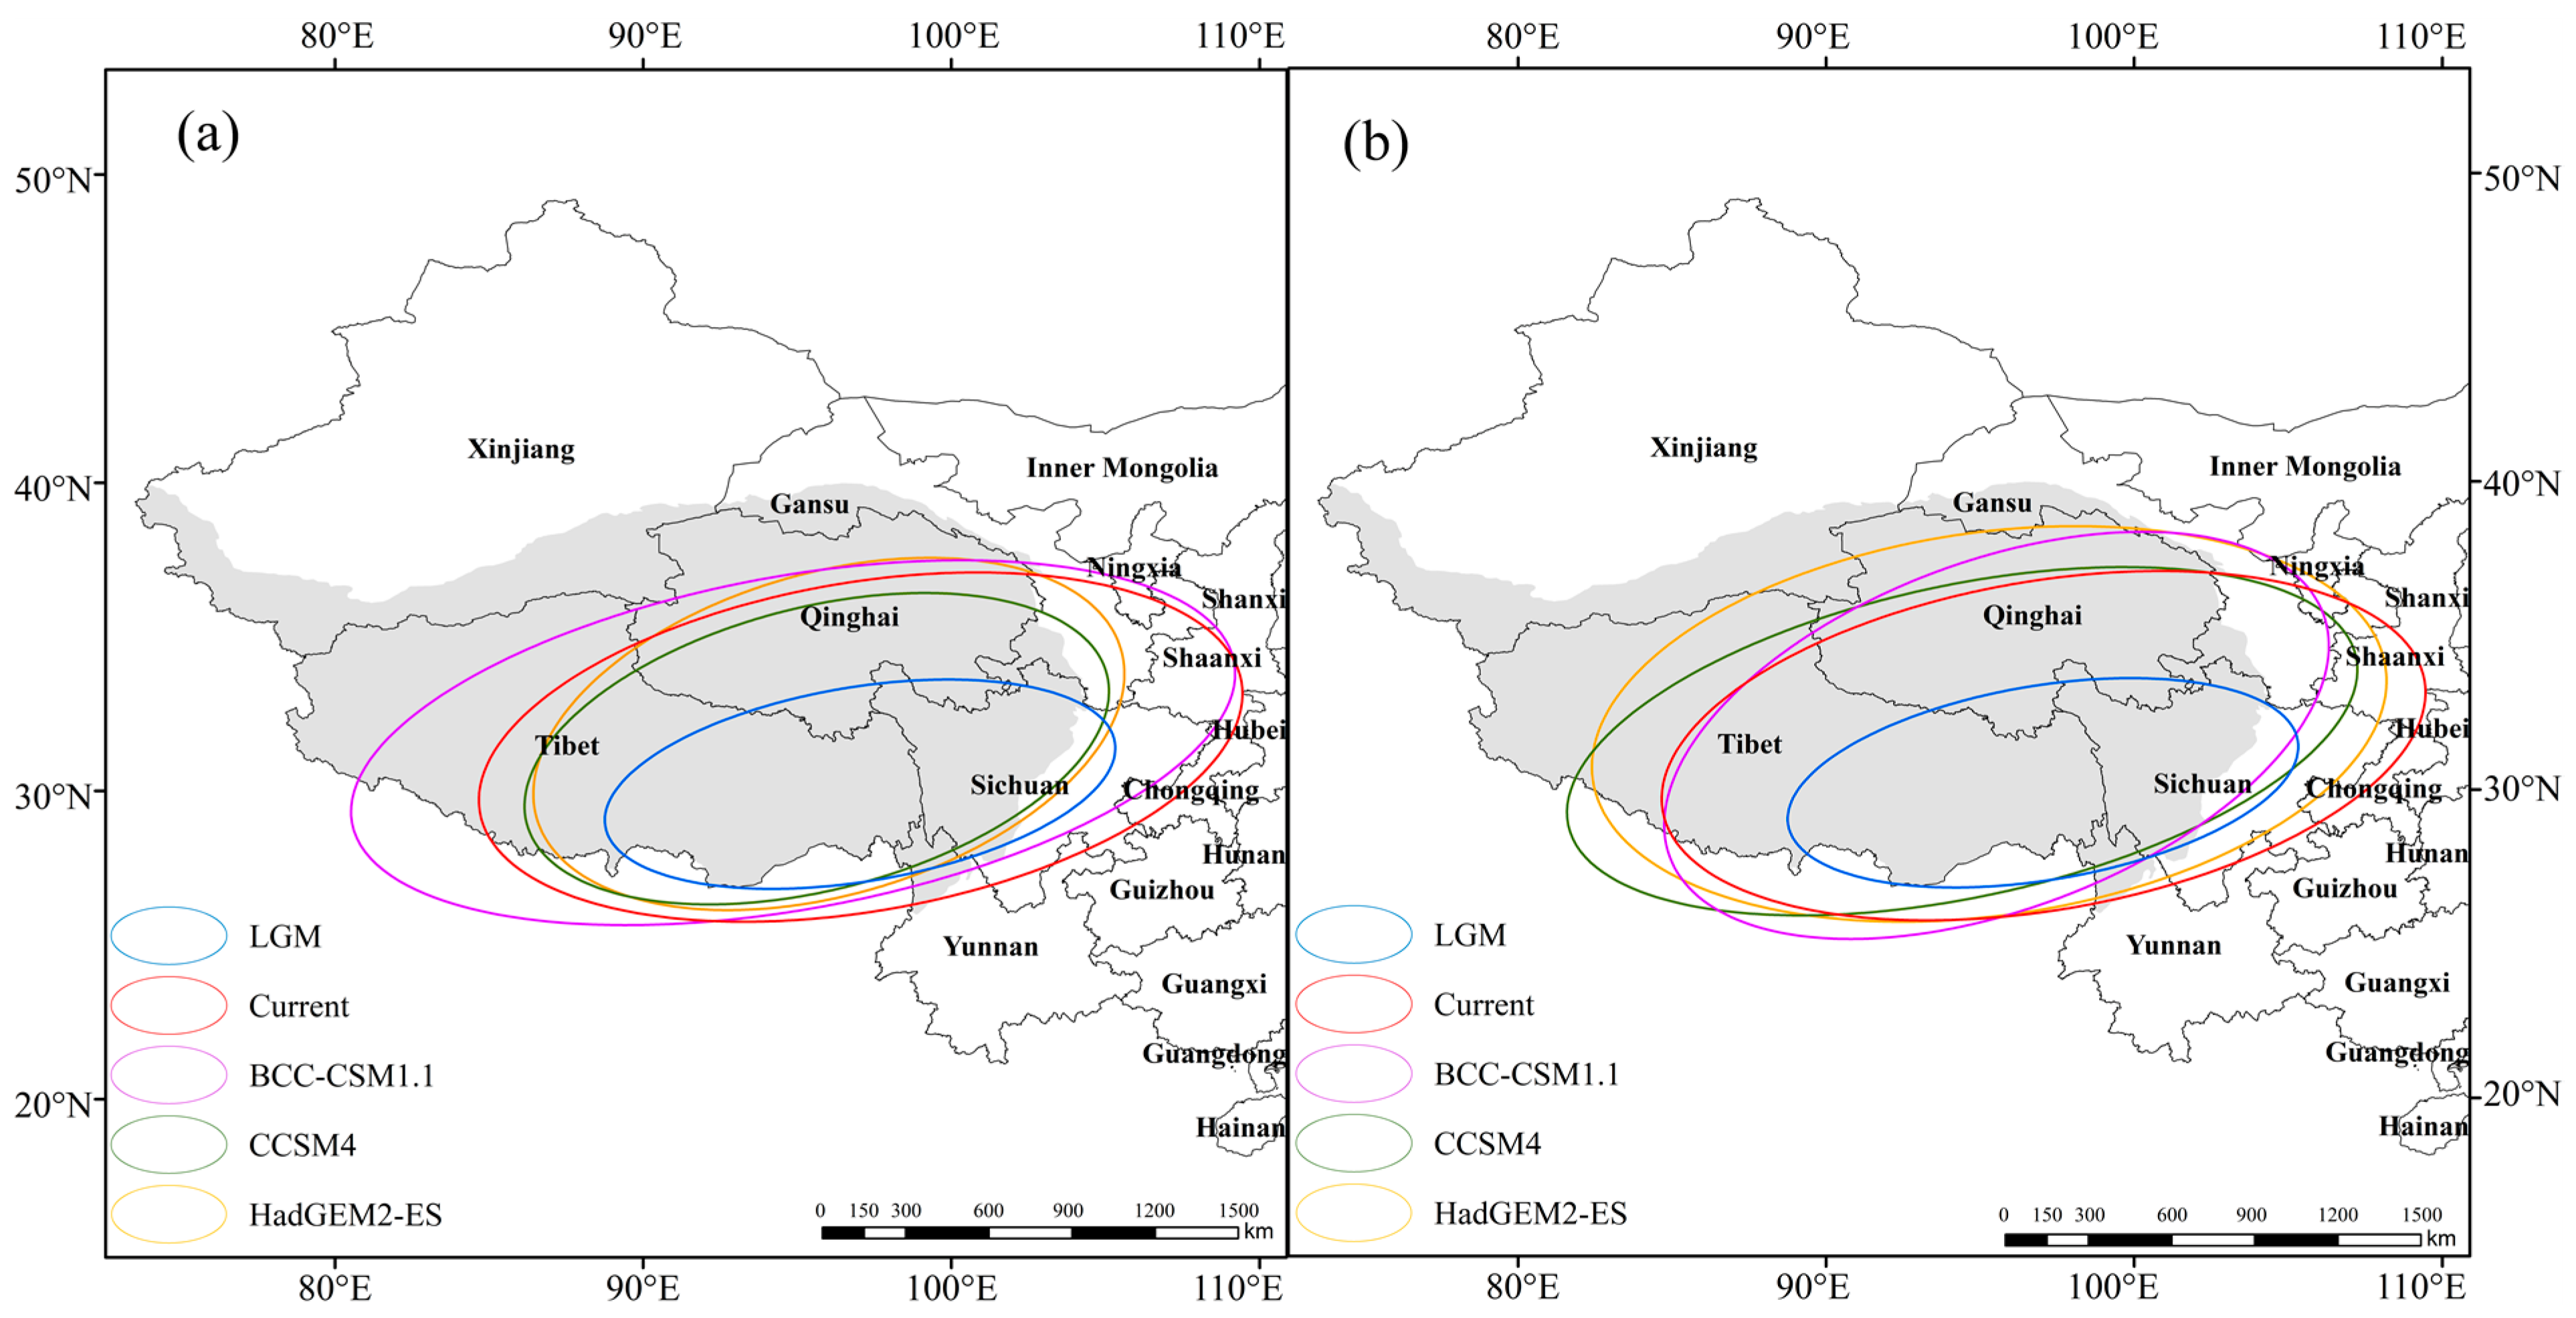
In order to reveal the spatial evolution trend of J. tibetica, SDE, the spatial statistical tool of ArcGIS, was used to calculate the parameters of the standard deviation ellipse of the suitable habitat of J. tibetica during different periods (Table 6). Afterward, the distribution ellipse of suitable habitats is shown in Figure 7. According to the length of the long and short axes and the rotation angle, there was an obvious directional distribution trend on the QTP. The distribution of suitable habitats in each period shows a spatial pattern of “northeast-southwest”.

Table 6.
The parameters of the standard deviation ellipse (SDE) of the suitable habitat of J. tibetica in different periods.
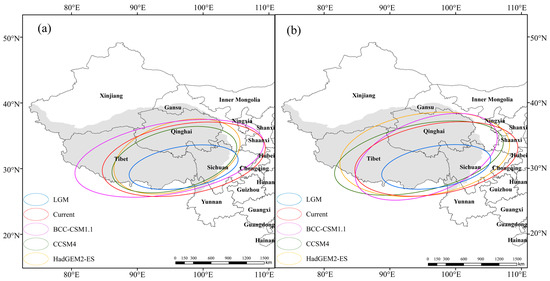
Figure 7.
The distribution ellipses of suitable habitat of J. tibetica in different periods. (a) RCP2.6 Climate scenarios; (b) RCP2.6 Climate scenarios.
According to the variations in the long and short axes of the distribution ellipse, compared with the current climate, the dispersion degree of the DPSH under the BCC-CSM1.1 (RCP2.6) and HadGEM2-ES (RCP8.5) climate models was incremental, while it decreased under the LGM, CCSM4 (RCP2.6) and HADGEM2-ES (RCP2.6) climate models. The dispersion degree under the BCC-CSM1.1 (RCP8.5) climate model reduced in the main trend and enhanced in the sub-trend. However, the dispersion degree under the CCSM4 (RCP8.5) climate model was the opposite of BCC-CSM1.1 (RCP8.5). In addition to HadGEM2-ES (RCP8.5), the rotation angle of other climate models decreased to different degrees compared with that of the current climate, indicating that the suitable habitat of J. tibetica would move northwestward in the future.
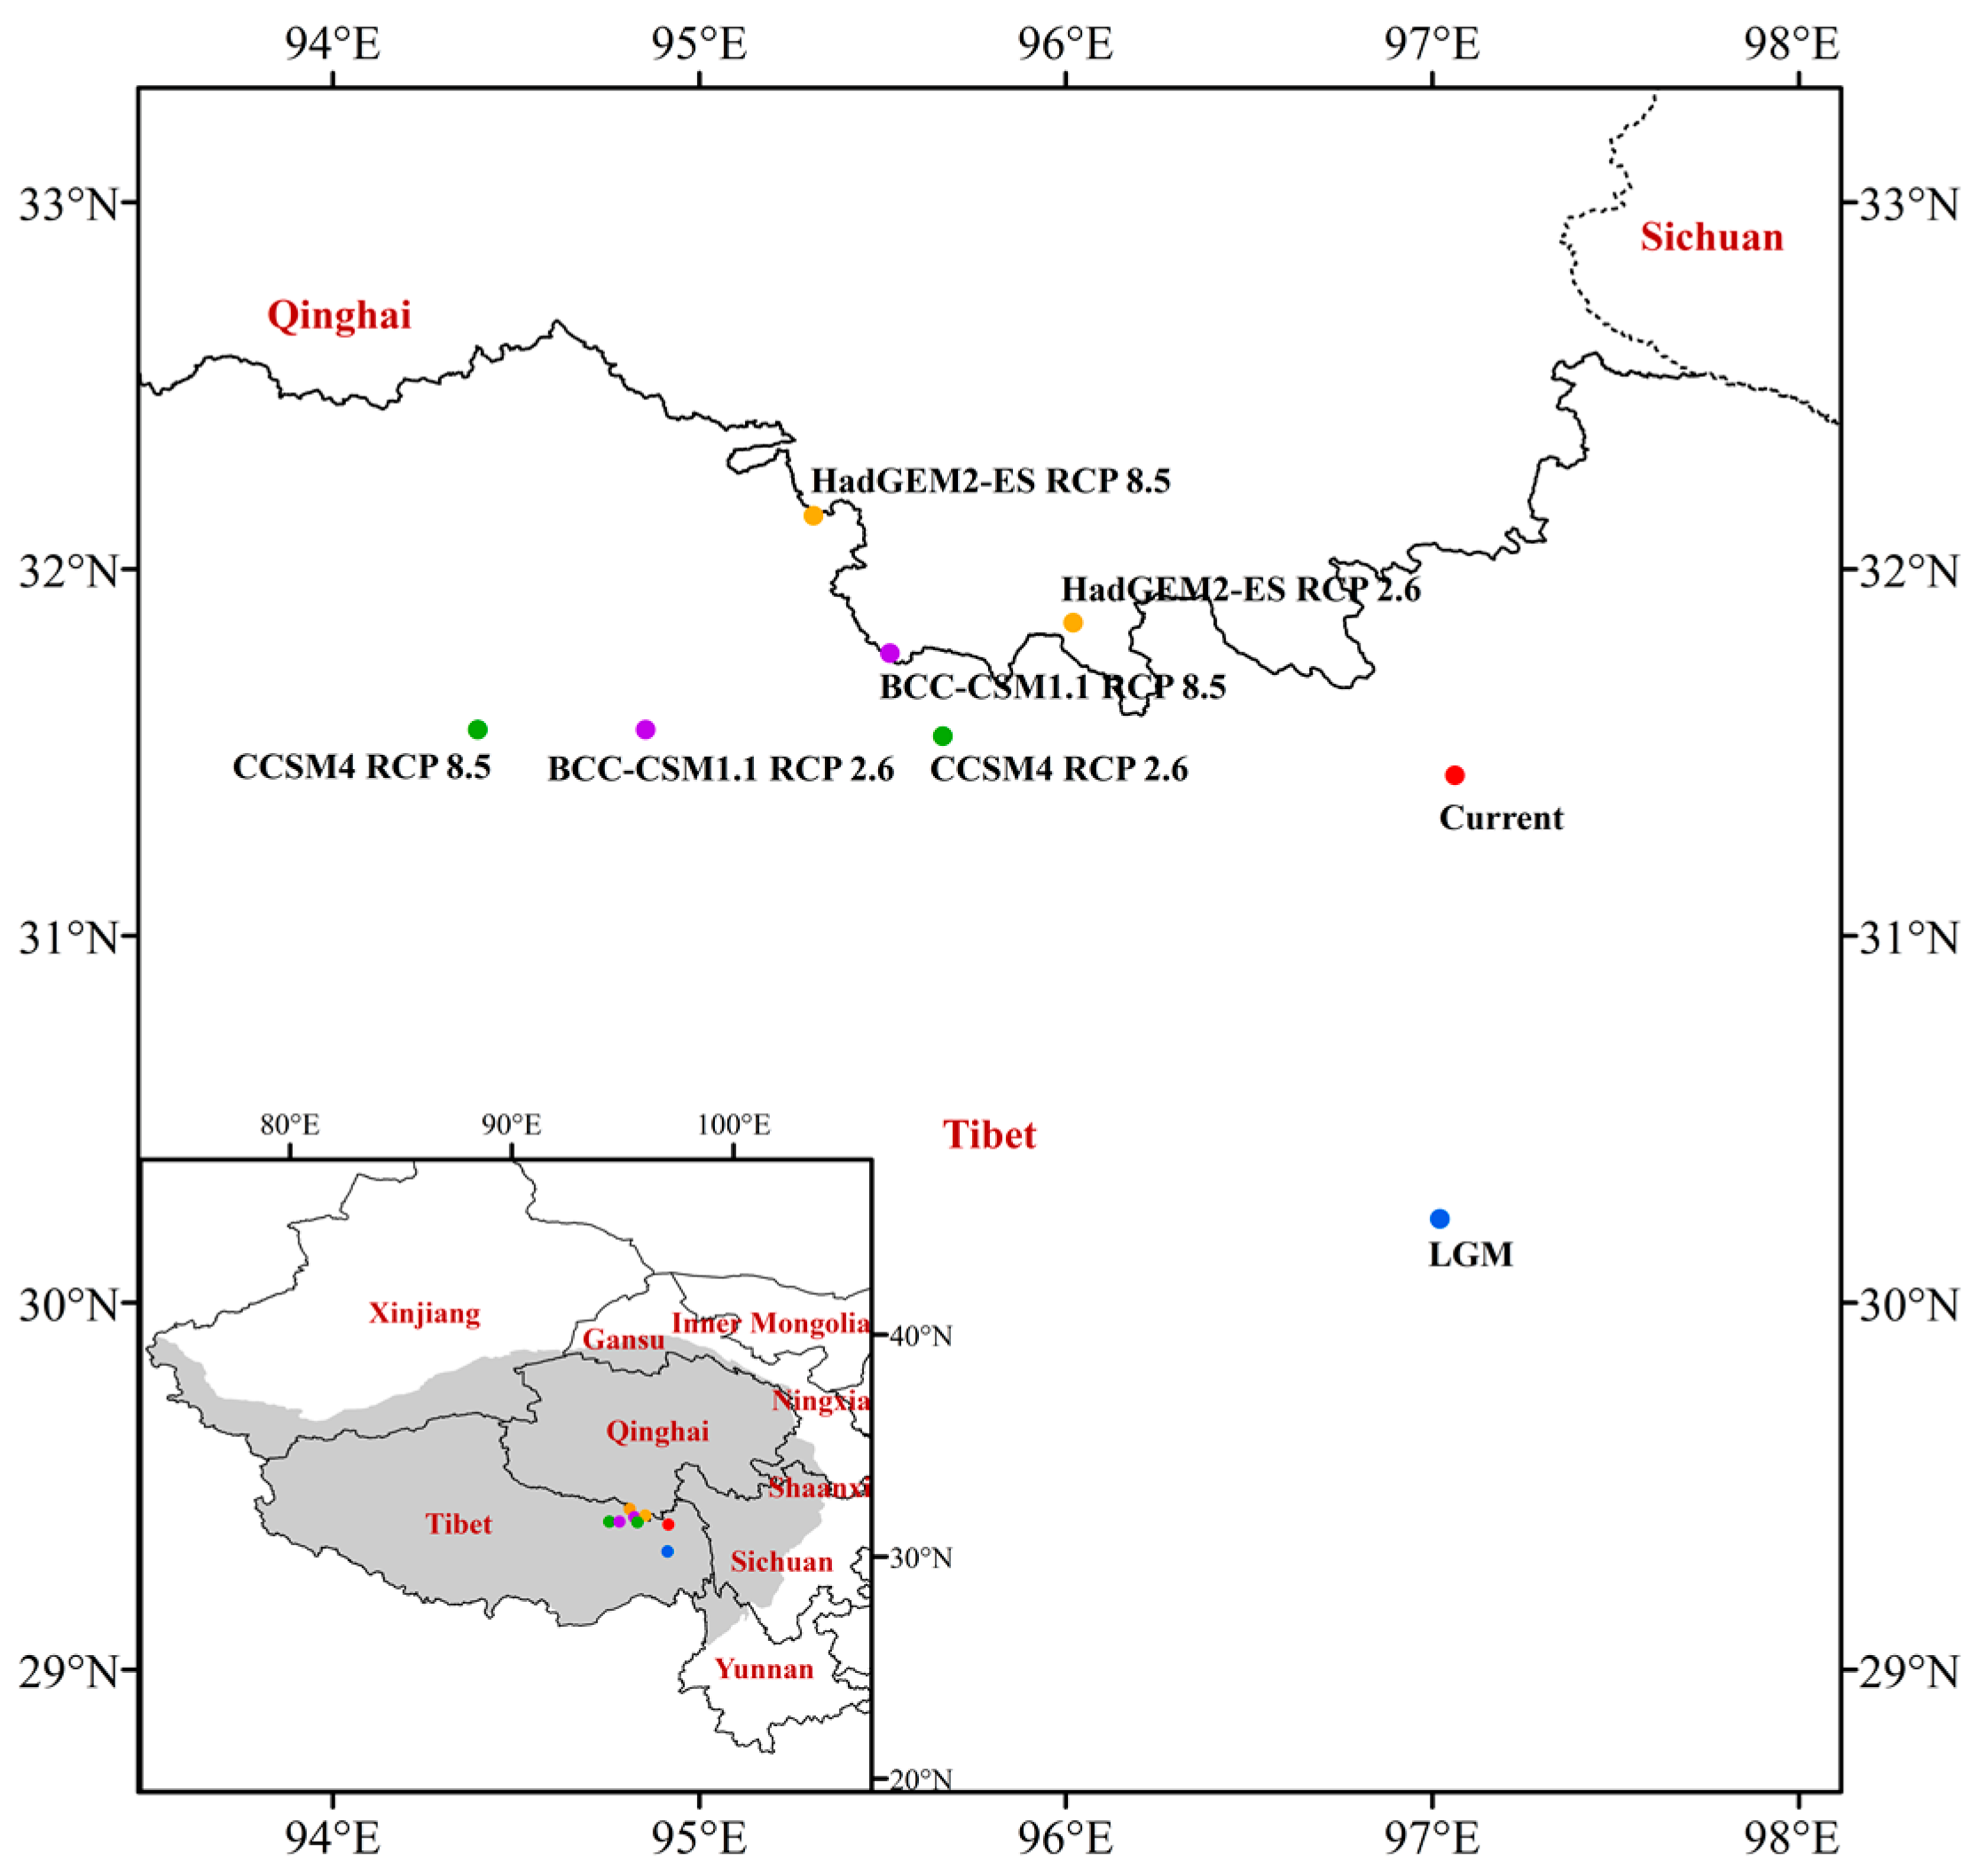
As observed from the results of the centroid of the suitable habitat (Figure 8), the centroid of J. tibetica in the LGM was located in Basu County (Changdu City, Tibet, 97.04° E 30.22° N). From the LGM to the current, the centroid migrated northward to Karuo District (Changdu City, Tibet, 97.06° E 31.42° N). In the future RCP2.6 scenario, the centroid of the BCC-CSM1.1, CCSM4 and HaDGEM2-ES climate models will be located in Dingqing County (Changdu City, Tibet, 94.86° E 31.57° N), Dingqing County (Changdu City, Tibet, 95.63° E 31.54° N) and Nangqian County (Yushu Tibetan Autonomous Prefecture, Qinghai, 96.03° E 31.85° N), respectively. In the future RCP8.5 scenario, the centroid will be located in Nangqian County (Yushu Tibetan Autonomous Prefecture, Qinghai, 95.53° E 31.76° N), Sog County (Nagqu City, Tibet, 94.42° E 31.57° N) and Dingqing County (Changdu City, Tibet, 95.29° E 32.13° N). From current to the future periods, the centroid of the suitable habitat migrated to higher latitudes as a whole.
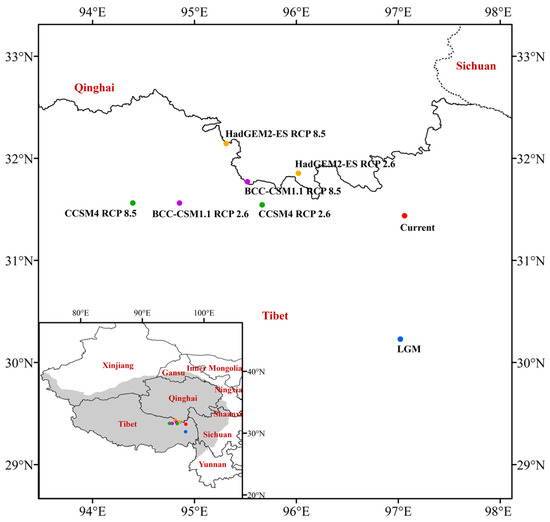
Figure 8.
The centroid of the suitable habitat of J. tibetica under different climate scenarios.
3.4. Regions of Environmental Anomalies Caused by Climate Change
The MESS and the MoD variables between different climatic scenarios and current climate conditions are shown in Figure 9 and Figure 10. The average multivariate similarities of LGM, BCC-CSM1.1 (RCP2.6 and RCP8.5), CCSM4 (RCP2.6 and RCP8.5) and HadGEM2-ES (RCP2.6 and RCP8.5) were 15.13, 15.48, 12.11, 15.64, 11.39, 15.72 and 10.87, respectively. The results show that the degree of climate anomalies of the RCP8.5 scenarios was extremely high, and the HadGEM2-ES climate model possessed the highest degree of anomaly.
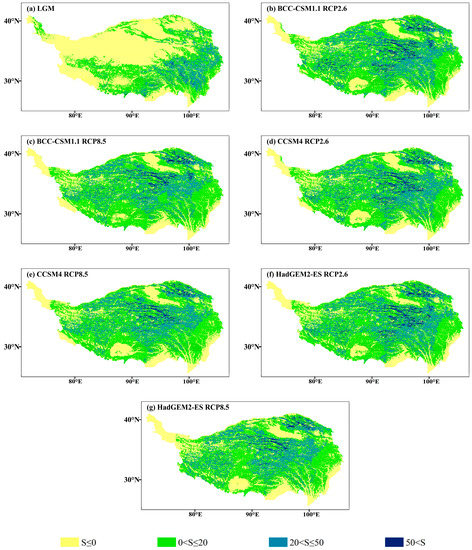
Figure 9.
Multivariate environmental similarity surface (MESS) for J. tibetica during different periods. (a) MESS for the LGM; (b) MESS for the BCC-CSM1.1 (RCP2.6); (c) MESS for the BCC-CSM1.1 (RCP8.5); (d) MESS for the CCSM4 (RCP2.6); (e) MESS for the CCSM4 (RCP8.5); (f) MESS for the HadGEM2-ES (RCP2.6); (g) MESS for the HadGEM2-ES (RCP8.5).
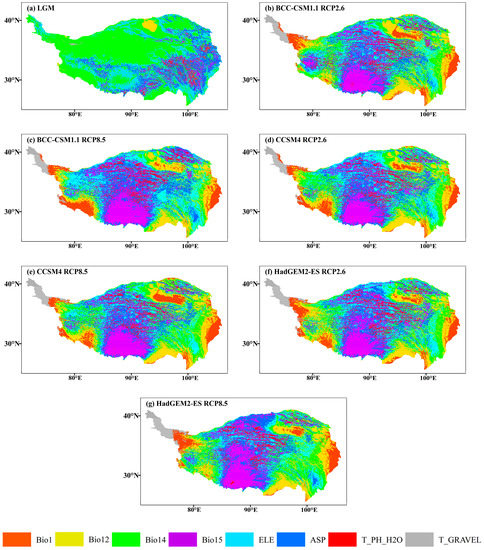
Figure 10.
The most dissimilar (MoD) variable analysis for J. tibetica during different periods. (a) MoD for the LGM; (b) MoD for the BCC-CSM1.1 (RCP2.6); (c) MoD for the BCC-CSM1.1 (RCP8.5); (d) MoD for the CCSM4 (RCP2.6); (e) MoD for the CCSM4 (RCP8.5); (f) MoD for the HadGEM2-ES (RCP2.6); (g) MoD for the HadGEM2-ES (RCP8.5).
The area of abnormal climate (S ≤ 0) in the LGM mainly occurred in the north–central and western end of the current suitable habitat, and the MoD variable was the precipitation of the driest month. In 2070, the area of abnormal climate (S ≤ 0) will appear at the southeastern margin and western end of the current suitable habitat (the MoD variables were annual mean temperature, annual precipitation and the precipitation of the driest month) and part of the middle reaches of the Yarlung Zangbo River (the MoD variable was precipitation seasonality). Meanwhile, few climate anomaly zones were on the southern edge of the current suitable habitat (the MoD variable was annual precipitation).
4. Discussion
4.1. Correlations between Climatic Factors and DPSH of J. tibetica
The distribution of J. tibetica was positively correlated to precipitation from February to July on the QTP [46]. It was also correlated with the temperature in May and June as well as the annual minimum temperature [46,47,48]. The prediction results of the present research show that precipitation (annual precipitation, coefficient of variation of precipitation and driest monthly precipitation) was the main climatic factor for the DPSH. The total contribution rate of precipitation factors was 78.3%, while the contribution rate of temperature factors was only 7.2%. It was concluded that precipitation played an important role in restricting the DPSH of J. tibetica. The results of this study visually revealed the relationship between suitable habitat and climate factors on a large scale. Moreover, MaxEnt had a model evaluation value of 0.903 on the large scale. In contrast, most previous studies were conducted on a small scale where temperature and precipitation were often taken into account to study their influence on the growth of trees. Only a few studies show that precipitation was the primary climatic factor that determined the distribution of the suitable habitat of Juniperus species on a large scale [34]. In addition to temperature and precipitation, elevation also affected the distribution of J. tibetica. The most suitable elevation range for the growth of J. tibetica was predicted at around 3005–4920 m. This result can be supported by the study of ancient trees, e.g., some ancient native J. tibetica were mostly distributed in the area with an elevation of 3700–4100 m [49].
According to the analysis of the MESS and MoD variables, the climate of the RCP8.5 scenario in 2070 is anomalous. Precipitation of the driest month and the annual precipitation were the MoD variables with the most frequent occurrences in the climate anomaly regions. The annual mean temperature, annual precipitation and driest monthly precipitation became the MoD variables in western Tibet and the southeastern edge of QTP, and annual precipitation became the MoD variable in southern QTP. Compared to current climatic conditions, the precipitation in these areas will increase, and the suitability of habitats will generally reduce, indicating that the increase in precipitation caused by global warming in the future will not be favorable to the growth of J. tibetica. The response curves of precipitation factors also show that when annual precipitation exceeded the optimum value of 526.1 mm and the driest monthly precipitation exceeded the optimum value of 6.5 mm, the suitability of habitats will decrease with the continuous increase in precipitation. This is because the Juniperus species evolved in an arid environment and preferred to grow in places with low rainfall [50]. High precipitation was not suitable for its growth and development.
4.2. Response of DPSH of J. tibetica to Climate Change and the Selection of Climate Model
The results of the prediction show that during the LGM there were few suitable habitats of J. tibetica on the QTP, which was zonal and close to mountains in the southeast part of the QTP. Previous research studies show that during the LGM, only subtropical forests existed in the southeastern part of the QTP [51]. Influenced by the quaternary ice age, mixed forests arose in the southern mountains on the QTP [52]. During the ice age, special environments such as mountains became sanctuaries for plants and animals [53,54]. According to previous research studies [51,52,53,54], both with respect to space and geographical locations, the validity of the suitable habitat predicted by this study could be verified.
The modern suitable habitats of J. tibetica in eastern Tibet and western Sichuan that are predicted in this study were highly consistent with the suitable habitat of Juniperus species in a previous study [55]. The suitable habitats in this study were distinctly zonally distributed. The highly suitable habitats of J. tibetica were concentrated in the central and eastern part of the QTP along the river banks and between mountains, which were particularly suitable for the growth of J. tibetica [56]. It was suitable for planting high-quality wood and would be a stable constructive species in the future. The marginally suitable habitat was mainly distributed in the south–central and eastern parts of the QTP. A study observed that Megastigmus sabinae Xu et He (Hymenoptera: Torymidae), a worldwide pest, has been found in central Tibet [57]. This pest ate the seeds of J. tibetica, rendering tree growth difficult. Therefore, the large-scale planting of J. tibetica is not recommended in marginally suitable habitats. This study provided a reference for rationally planting J. tibetica in the current climate.
Research studies suggested that the suitable habitat of some plants on the QTP shrunk in the background of global warming [58,59], and their growth was inhibited [5]. This study shows that the total area of the suitable habitat of J. tibetica will reduce under the other climate models, with the exception of HadGEM2-ES (RCP8.5). It was in line with a previous study showing that the habitat area of Juniperus species would decrease between 2050 and 2080 [34]. The possible reason was that with the increase in temperature by 2 °C due to global warming in the future, precipitation will increase by 0%–20% [60]. In general, higher precipitation is beneficial for seedling emergence [61]. However, J. tibetica has poor water resistance, and excessive precipitation destroys the water balance in the soil, creates an anaerobic environment, reduces the respiratory rate of the root system and inhibits the internal metabolism, thus limiting the growth of J. tibetica [62].
In the future, plants will move to higher latitudes and elevations under global warming [63]. Under future climate scenarios, the suitable habitat of J. tibetica in the southern part of the QTP will move northward as a whole, and the suitable habitat in the central and eastern parts of the QTP will expand northwest. The centroid of the suitable habitat will migrate to higher elevation and latitude areas in the northwest direction. According to LGM, elevation increased at a rate of 5.81–17.73 m, and latitude increased at a rate of 0.0025–0.0148° per year. The pollen dispersal of J. tibetica occurred upward along mountain slopes, which was consistent with our prediction that suitable habitats will migrate to higher elevations in the context of future climate change. Moreover, the seeds of J. tibetica can reach higher elevations above the timberline via bird droppings; thus, there is a high probability that suitable habitats will keep pace with the rate of climate change in the future [64]. However, there is no study on the spreading rate of seeds and pollens. Therefore, the numerical comparisons of the spreading rate and the rate of climate change require further research.
The combination of the results of multiple climate models is capable of reducing the drawbacks of a single climate model. The selection of suitable climate models can optimize the prediction of suitable habitats. In this study, the total suitable habitat area under the HadGEM2-ES climate model RCP8.5 scenario increased compared to the current one. Although the growth of trees will accelerate, their lifespan will become short [65,66]. This climate scenario is not favorable for the sustainable and healthy growth of J. tibetica. In other climate scenarios, although the total area of suitable habitats decreased, except for the highly suitable habitat in the CCSM4 (RCP2.6) scenario, the moderately and highly suitable habitats in other climate scenarios show an uptrend. According to the dispersion (main trend) of the DPSH, the dispersion will be augmented under the BCC-CSM1.1 (RCP2.6), CCSM4 (RCP8.5) and HadGEM2-ES (RCP8.5) scenarios, while they will be reduced under BCC-CSM1.1 (RCP8.5), CCSM4 (RCP2.6) and HadGEM2-ES (RCP2.6) scenarios. In the study involving the performance evaluation of the model using Leaf Area Index (LAI), it was pointed out that the HadGEM2-ES and BCC-CSM1.1 models demonstrated the best expressiveness of vegetation dynamics, which were the best models representing the characteristics of the vegetation on the QTP [67]. On the whole, the HadGEM2-ES (RCP2.6) and BCC-CSM1.1 (RCP8.5) climate models were suitable for predicting the suitable habitat of J. tibetica on the QTP in the future.
4.3. Implications
In response to climate change, the DPSH of plants will alter [23,55], and the species diversity of plant communities will be reduced on the QTP. The results show that the suitable habitat of J. tibetica will decrease in the future. As the forest community with the richest plant diversity in the herb layer, the reduction in the suitable habitat of J. tibetica indicated that the plant diversity of the J. tibetica community will also decrease. This will render the local ecosystem gradually fragmented. The results of the present study provide a basis for studying and conserving herbaceous diversity under J. tibetica, and this is of great theoretical and practical significance for biodiversity conservation and the maintenance of ecosystem health.
Our study also implies that there will be a change in the pattern of timberline in the context of global warming. Previous studies studied the relationship between the elevation of the timberline and climate, and the studies observed that the response of timberline to climate change resulted in different trends, such as increasing, no change or decreasing trends [68,69,70,71]. As the highest timberline, J. tibetica will migrate to higher elevations in the future. This result provides further support that the timberline will be elevated on the QTP [30]. This research will help future research studies that will investigate the relevant response mechanisms of the migration trend of the timberline relative to climate change.
5. Conclusions
This study discussed the response of the DPSH of J. tibetica to climate change on the QTP using MaxEnt. The result revealed that precipitation was the key environmental factor for the DPSH of J. tibetica under current climate conditions on a large scale, and it is also the main factor restricting the DPSH in the future, followed by temperature. The suitable habitat for J. tibetica will gradually decrease, and it is expected that it will migrate to higher latitudes and elevation areas in northwest China under climate change. After comparing three climate models, HadGEM2-ES (RCP2.6) and BCC-CSM1.1 (RCP8.5) were the most suitable climate models for researching the DPSH. Furthermore, the effects of climate warming on the diversity of species and changes in the timberline in the J. tibetica community were discussed. The results provide references for the protection and growth monitoring of J. tibetica resources and the conservation of plant diversity on the QTP.
Author Contributions
Conceptualization, H.Z. and T.H.; methodology, B.Z.; software, B.Z.; writing—original draft preparation, H.Z., B.Z., T.H. and Y.T.; writing—review and editing, T.H., Y.T. and B.Z.; visualization, B.Z.; supervision, H.Z. and T.H.; funding acquisition, H.Z.; Data curation, H.C. and J.Y.; project administration, T.H. All authors have read and agreed to the published version of the manuscript.
Funding
This research was funded by the National Science and Technology Major Project for Water Pollution Control and Treatment (2017ZX07101002).
Data Availability Statement
All data are reported in this manuscript.
Conflicts of Interest
The authors declare no conflict of interest.
References
- IPCC 2022. Climate Change 2022: Mitigation of Climate Change, the Working Group III Contribution; Sixth Assessment Report; IPCC: Geneva, Switzerland, 2022. [Google Scholar]
- Klein, J.A.; Harte, J.; Zhao, X.Q. Experimental warming causes large and rapid species loss, dampened by simulated grazing, on the Tibetan Plateau. Ecol. Lett. 2004, 7, 1170–1179. [Google Scholar] [CrossRef]
- Kuang, X.; Jiao, J. Review on climate change on the Tibetan Plateau during the last half century. J. Geophys. Res. Atmos. 2016, 121, 3979–4007. [Google Scholar] [CrossRef]
- Gao, Q.; Guo, Y.; Xu, H.; Ganjurjav, H.; Li, Y.; Wan, Y.; Qin, X.; Ma, X.; Liu, S. Climate change and its impacts on vegetation distribution and net primary productivity of the alpine ecosystem in the Qinghai-Tibetan Plateau. Sci. Total Environ. 2016, 554, 34–41. [Google Scholar] [CrossRef] [PubMed]
- Liang, E.; Leuschner, C.; Dulamsuren, C.; Wagner, B.; Hauck, M. Global warming-related tree growth decline and mortality on the north-eastern Tibetan plateau. Clim. Chang. 2016, 134, 163–176. [Google Scholar] [CrossRef]
- Yang, B.; He, M.; Shishov, V.; Tychkov, I.; Vaganov, V.; Rossi, S.; Ljungqvist, F.C.; Bräuning, A.; GrieBinger, J. New perspective on spring vegetation phenology and global climate change based on Tibetan Plateau tree-ring data. Proc. Natl. Acad. Sci. USA 2017, 114, 6966–6971. [Google Scholar] [CrossRef]
- Xu, Z.; Peng, H.; Peng, S. The development and evaluation of species distribution models. Acta Ecol. Sin. 2015, 35, 558–567. [Google Scholar]
- Peterson, A.T.; Papes, M.; Eaton, M. Transferability and model evaluation in ecological niche modeling: A comparison of GARP and Maxent. Ecography 2007, 30, 550–560. [Google Scholar] [CrossRef]
- Xing, D.; Hao, Z. The principle of maximum entropy and its applications in ecology. Biodivers. Sci. 2011, 19, 295–302. [Google Scholar]
- Zhang, Y.; Tang, J.; Ren, G.; Wang, X. Global potential distribution prediction of Xanthium italicum based on Maxent model. Sci. Rep. 2021, 11, 16545. [Google Scholar] [CrossRef]
- Sun, X.; Long, Z.; Jia, J. A multi-scale Maxent approach to model habitat suitability for the giant pandas in the Qionglai mountain, China. Glob. Ecol. Conserv. 2021, 30, 1766. [Google Scholar] [CrossRef]
- Wan, J.; Qi, G.; Ma, J.; Ren, Y.; Wang, R.; McKirdy, S. Predicting the potential geographic distribution of Bactrocera bryoniae and Bactrocera neohumeralis (Diptera: Tephritidae) in China using MaxEnt ecological niche modeling. J. Integr. Agric. 2020, 19, 2072–2082. [Google Scholar] [CrossRef]
- Shao, W.; Jiang, F.; Huang, L.; Wang, X. Risk Assessment of Canine Distemper in the Distribution Area of Giant Panda in Sichuan, Shaanxi and Gansu Provinces, China. J. Risk Anal. Crisis Response 2017, 7, 225–229. [Google Scholar] [CrossRef]
- Guevara, L.; Gerstner, B.E.; Kass, J.M.; Anderson, R.P. Toward ecologically realistic predictions of species distributions: A cross-time example from tropical montane cloud forests. Glob. Chang. Biol. 2018, 24, 1511–1522. [Google Scholar] [CrossRef] [PubMed]
- Russell, J.; Zonneveld, V.M.; Dawson, I.K.; Booth, A.; Waugh, R.; Steffenson, B. Genetic Diversity and Ecological Niche Modelling of Wild Barley: Refugia, Large-Scale Post-LGM Range Expansion and Limited Mid-Future Climate Threats? PLoS ONE 2014, 9, e86021. [Google Scholar] [CrossRef]
- Pearson, R.G.; Raxworthy, C.J.; Nakamura, M.; Peterson, A.T. Predicting species distributions from small numbers of occurrence records: A test case using cryptic geckos in Madagascar. J. Biogeogr. 2007, 34, 102–117. [Google Scholar] [CrossRef]
- Roura-Pascual, N.; Brotons, L.; Peterson, A.T.; Thuiller, W. Consensual predictions of potential distributional areas for invasive species: A case study of Argentine ants in the Iberian Peninsula. Biol. Invasions 2009, 11, 1017–1031. [Google Scholar] [CrossRef]
- Cao, X.; Wang, J.; Zhang, X. Simulation of the potential distribution patterns of Picea crassifolia in climate change scenarios based on the maximum entropy (Maxent) model. Acta Ecol. Sin. 2019, 39, 5232–5240. [Google Scholar]
- Wei, Y.; Zhang, L.; Wang, J.; Wang, W.; Niyati, N.; Guo, Y.; Wang, X. Chinese caterpillar fungus (Ophiocordyceps sinensis) in China: Current distribution, trading, and futures under climate change and overexploitation. Sci. Total Environ. 2021, 755, 142548. [Google Scholar] [CrossRef]
- Han, M.; Bai, Q.; Sun, S.; Yan, J.; Zhang, C.; Zhang, C.; Zhang, J.; You, M.; Li, D.; Yan, X. Simulation of Elymus sibiricus L. Distribution in Tibetan Plateau Based on MaxEnt Model. Acta Agrestia Sin. 2021, 29, 374–382. [Google Scholar]
- Kou, J.; Wang, T.; Yu, F.; Sun, Y.; Feng, C.; Shao, X. The moss genus Didymodon as an indicator of climate change on the Tibetan Plateau. Ecol. Indic. 2020, 113, 106204. [Google Scholar] [CrossRef]
- Guo, Y.; Wei, H.; Lu, C.; Zhang, H.; Guo, W. Predictions of potential geographical distribution of Sinopodophyllum hexandrum under climate change. Chin. J. Plant Ecol. 2014, 38, 249–261. [Google Scholar]
- Hu, Z.; Guo, K.; Jin, S.; Pan, H. The influence of climatic changes on distribution pattern of six typical Kobresia species in Tibetan Plateau based on MaxEnt model and geographic information system. Theor. Appl. Climatol. 2019, 135, 375–390. [Google Scholar] [CrossRef]
- Wang, W.; Tang, X.; Zhu, Q.; Pan, K.; Hu, Q.; He, M.; Li, J. Predicting the Impacts of Climate Change on the Potential Distribution of Major Native Non-Food Bioenergy Plants in China. PLoS ONE 2014, 9, e111587. [Google Scholar] [CrossRef] [PubMed]
- Hu, Z.; Zhang, Y.; Yu, H. Simulation of Stipa purpurea distribution pattern on Tibetan Plateau based on MaxEnt model and GIS. J. Appl. Ecol. 2015, 26, 505–511. [Google Scholar]
- Jin, Y.; Wang, H.; Wei, L.; Hou, Y.; Hu, J.; Wu, K.; Xia, H.; Xia, J.; Zhou, B.; Li, K.; et al. A plot-based dataset of plant community on the Qingzang Plateau. Chin. J. Plant Ecol. 2022, 46, 846–854. [Google Scholar] [CrossRef]
- Zhu, Q.; Ning, P.; Hou, L.; Hao, J.; Hu, Y. Characteristics of Juniperus community types in the Three-River-Source Region. Chin. J. Plant Ecol. 2022, 46, 114–122. [Google Scholar]
- Miao, J.; Tso, S.; Li, J.; Xie, S.; Mao, K. The complete chloroplast genome of Juniperus tibetica (Cupressaceae), the conifer that occupies the highest known treeline in the Northern Hemisphere. Mitochondrial DNA Part B 2019, 4, 609–611. [Google Scholar] [CrossRef]
- Georg, M.; Sabine, M.; Jonas, V.; Sonam, C.; Duo, L. Highest treeline in the northern hemisphere found in southern Tibet. Mt. Res. Dev. 2007, 27, 169–173. [Google Scholar]
- Shi, P.; Ning, W.; Rawat, G.S. The Distribution Patterns of Timberline and Its Response to Climate Change in the Himalayas. J. Resour. Ecol. 2020, 11, 342–348. [Google Scholar]
- Wang, X. Study on Pollination Characteristics of Sabina tibetica (in Chinese). J. Gansu For. Sci. Technol. 2020, 45, 14–16. [Google Scholar]
- Lu, X.; Zheng, G. Habitat selection and use by a hybrid of white and Tibetan eared pheasants in eastern Tibet during the post-incubation period. Can. J. Zool. 2001, 79, 319–324. [Google Scholar] [CrossRef]
- Salvà-Catarineu, M.; Romo, A.; Mazur, M.; Zielińska, M.; Minissale, P.; Dönmez, A.A.; Boratyńska, K.; Boratyński, A. Past, present, and future geographic range of the relict Mediterranean and Macaronesian Juniperus phoenicea complex. Ecol. Evol. 2021, 11, 5075–5095. [Google Scholar] [CrossRef]
- Naudiyal, N.; Wang, J.; Ning, W.; Gaire, N.P.; Shi, P.; Wei, Y.; He, J.; Shi, N. Potential distribution of Abies, Picea, and Juniperus species in the sub-alpine forest of Minjiang headwater region under current and future climate scenarios and its implications on ecosystem services supply. Ecol. Indic. 2021, 121, 107131. [Google Scholar] [CrossRef]
- Kumar, D.; Bhardwaj, D.R.; Thakur, C.L.; Sharma, P.; Ayele, G.T. Vegetation Shift of Juniperus macropoda Boisser Forest in Response to Climate Change in North-Western Himalayas, India. Forests 2022, 13, 2088. [Google Scholar] [CrossRef]
- Kumar, D.; Bhardwaj, D.R.; Sharma, P.; Bharti; Sankhyan, N.; Al-Ansari, N.; Linh, N.T.T. Population Dynamics of Juniperus macropoda Bossier Forest Ecosystem in Relation to Soil Physico-Chemical Characteristics in the Cold Desert of North-Western Himalaya. Forests 2022, 13, 1624. [Google Scholar] [CrossRef]
- Cao, B.; Bai, C.; Zhang, L.; Li, G.; Mao, M. Modeling habitat distribution of Cornus officinalis with Maxent modeling and fuzzy logics in China. J. Plant Ecol. 2016, 9, 742–751. [Google Scholar] [CrossRef]
- Ranjitkar, S.; Xu, J.; Shresthac, K.K.; Kindt, R. Ensemble forecast of climate suitability for the Trans-Himalayan Nyctaginaceae species. Ecol. Model. 2014, 282, 18–24. [Google Scholar] [CrossRef]
- Ward, D.F. Modelling the potential geographic distribution of invasive ant species in New Zealand. Biol. Invasions 2007, 9, 723–735. [Google Scholar] [CrossRef]
- Lu, S.; Yin, X.; Wei, Q.; Zhang, C.; Ma, D.; Liu, X. The geographical distribution response of plant functional types to climate change in southwestern China. Acta Ecol. Sin. 2020, 40, 310–324. [Google Scholar]
- Aidoo, O.F.; Souza, P.G.C.; Silva, R.S.D.; Santana, P.A., Jr.; Picanço, M.C.; Kyerematen, R.; Sètamou, M.; Ekesi, S.; Borgemeister, C. Climate-induced range shifts of invasive species (Diaphorina citri Kuwayama). Pest Manag. Sci. 2022, 78, 2534–2549. [Google Scholar] [CrossRef]
- Xu, J.; Zhao, Y.; Zhong, K.; Zhang, F.; Liu, X.; Sun, C. Measuring spatio-temporal dynamics of impervious surface in Guangzhou, China, from 1988 to 2015, using time-series Landsat imagery. Sci. Total Environ. 2018, 627, 264–281. [Google Scholar] [CrossRef] [PubMed]
- Wong, D.W.S. Several Fundamentals in Implementing Spatial Statistics in GIS:Using Centrographic Measures as Examples. Geogr. Inf. Sci. 1999, 5, 163–174. [Google Scholar] [CrossRef]
- Li, Y.; Zhang, X.; Fang, Y. Responses of the distribution pattern of Quercus chenii to climate change following the Last Glacial Maximum. Chin. J. Plant Ecol. 2016, 40, 1164–1178. [Google Scholar]
- Elith, J.; Kearney, M.; Phillips, S. The art of modelling range-shifting species. Methods Ecol. Evol. 2010, 1, 330–342. [Google Scholar] [CrossRef]
- Li, T.; Li, J. A 564-year annual minimum temperature reconstruction for the east central Tibetan Plateau from tree rings. Glob. Planet. Chang. 2017, 157, 165–173. [Google Scholar] [CrossRef]
- Shi, X.; Qin, N.; Zhu, H.; Shao, X.; Wang, Q.; Zhu, X. May–June mean maximum temperature change during 1360–2005 as reconstructed by tree rings of Sabina tibetica in Zaduo, Qinghai Province. Chin. Sci. Bull. 2010, 55, 3023–3029. [Google Scholar] [CrossRef]
- Zhu, H.; Shao, X.; Yin, Z.; Huang, L. Early summer temperature reconstruction in the eastern Tibetan plateau since ad 1440 using tree-ring width of Sabina tibetica. Theor. Appl. Climatol. 2011, 106, 45–53. [Google Scholar] [CrossRef]
- Zhao, L.; Yang, K.; Luo, Y. The temporal and spatial distribution of Chinese old trees and its analysis. IOP Conf. Ser. Earth Environ. Sci. 2021, 658, 012010. [Google Scholar] [CrossRef]
- Mao, K.; Hao, G.; Liu, J.; Adams, R.P.; Milne, R.I. Diversification and biogeography of Juniperus (Cupressaceae): Variable diversification rates and multiple intercontinental dispersals. New Phytol. 2010, 188, 254–272. [Google Scholar] [CrossRef]
- Qin, F.; Zhao, Y.; Cao, X. Biome reconstruction on the Tibetan Plateau since the Last Glacial Maximum using a machine learning method. Sci. China Earth Sci. 2022, 65, 518–535. [Google Scholar] [CrossRef]
- Han, J.; Cai, M.; Shao, Z. Vegetation and climate change since the late glacial period on the southern Tibetan Plateau. Palaeogeogr. Palaeoclimatol. Palaeoecol. 2021, 572, 110403. [Google Scholar] [CrossRef]
- Brown, S.C.; Wigley, T.M.L.; Otto-Bliesner, B.L.; Rahbek, C.; Fordham, D.A. Persistent Quaternary climate refugia are hospices for biodiversity in the Anthropocene. Nat. Clim. Chang. 2020, 10, 244–248. [Google Scholar] [CrossRef]
- Hofmann, S. Population genetic structure and geographic differentiation in the hot spring snake Thermophis baileyi (Serpentes, Colubridae): Indications for glacial refuges in southern-central Tibet. Mol. Phylogenet. Evol. 2012, 63, 396–406. [Google Scholar] [CrossRef]
- Dakhil, M.A.; Xiong, Q.L.; Farahat, E.A.; Zhang, L.; Pan, K.; Pandey, B.; Olatunjia, O.A.; Tariqa, A.; Wu, X.; Zhang, A.; et al. Past and future climatic indicators for distribution patterns and conservation planning of temperate coniferous forests in southwestern China. Ecol. Indic. 2019, 107, 105559. [Google Scholar] [CrossRef]
- He, M.; Yang, B.; Bräuning, A. Tree growth–climate relationships of Juniperus tibetica along an altitudinal gradient on the southern Tibetan Plateau. Trees 2013, 27, 429–439. [Google Scholar] [CrossRef]
- Xu, L.; Zhao, J.; Zhao, T.; Wu, P.; Pan, Y.; Xiong, Z. Harm and biological characteristics of Megastigmus sabinae in Qamdo, Tibet (in Chinese). For. Pest Dis. 2020, 39, 27–29. [Google Scholar]
- Rana, S.K.; Rana, H.K.; Luo, D.; Sun, H. Estimating climate-induced ‘Nowhere to go’ range shifts of the Himalayan Incarvillea Juss. using multi-model median ensemble species distribution models. Ecol. Indic. 2021, 121, 107127. [Google Scholar] [CrossRef]
- Lamsal, P.; Kumar, L.; Aryal, A.; Atreya, K. Invasive alien plant species dynamics in the Himalayan region under climate change. Ambio 2018, 47, 697–710. [Google Scholar] [CrossRef]
- Fu, Y.; Jiang, D. Climate Change over China with a 2 °C Global Warming. Chin. J. Atmos. Sci. 2011, 9, 14982. [Google Scholar]
- Petrie, M.D.; Wildeman, A.M.; Bradford, J.B.; Hubbard, R.M.; Lauenroth, W.K. A review of precipitation and temperature control on seedling emergence and establishment for ponderosa and lodgepole pine forest regeneration. For. Ecol. Manag. 2016, 361, 328–338. [Google Scholar] [CrossRef]
- Hopkins, F.; Gonzalez-Meler, M.A.; Flower, C.E.; Lynch, D.J.; Czimczik, C.; Tang, J.; Subke, J.A. Ecosystem-level controls on root-rhizosphere respiration. New Phytol. 2013, 199, 339–351. [Google Scholar] [CrossRef]
- Parmesan, C.; Yohe, G. A globally coherent fingerprint of climate change impacts across natural systems. Nature 2003, 421, 37–42. [Google Scholar] [CrossRef]
- Lazarus, E.D.; McGill, B.J. Pushing the Pace of Tree Species Migration. PLoS ONE 2014, 9, e105380. [Google Scholar] [CrossRef]
- Brienen, R.J.W.; Caldwell, L.; Duchesne, L.; Voelker, S.; Barichivich, J.; Baliva, M.; Ceccantini, G.; Di Filippo, A.; Helama, S.; Locosselli, G.M.; et al. Forest carbon sink neutralized by pervasive growth-lifespan trade-offs. Nat. Commun. 2020, 11, 4241. [Google Scholar] [CrossRef]
- Bertrand, R.; Lenoir, J.; Piedallu, C.; Riofrío-Dillon, G.; de Ruffray, P.; Vidal, C.; Pierrat, J.C.; Gégout, J.C. Changes in plant community composition lag behind climate warming in lowland forests. Nature 2011, 479, 517–520. [Google Scholar] [CrossRef]
- Bao, Y.; Gao, Y.; Lu, S. Evaluation of CMIP5 Earth System Models in Reproducing Leaf Area Index and Vegetation Cover over the Tibetan Plateau. J. Meteorol. Res. 2014, 28, 1041–1060. [Google Scholar] [CrossRef]
- Payette, S. Contrasted dynamics of northern Labrador tree lines caused by climate change and migrational lag. Ecology 2007, 88, 770–780. [Google Scholar] [CrossRef] [PubMed]
- Kullman, L.; Oberg, L. Post-Little Ice Age tree line rise and climate warming in the Swedish Scandes: A landscape ecological perspective. J. Ecol. 2009, 97, 415–429. [Google Scholar] [CrossRef]
- Liang, E.; Wang, Y.; Eckstein, D.; Luo, T. Little change in the fir tree-line position on the southeastern Tibetan Plateau after 200 years of warming. New Phytol. 2011, 190, 760–769. [Google Scholar] [CrossRef] [PubMed]
- Harsch, M.A.; Hulme, P.E.; McGlone, M.S.; Duncan, R.P. Are treelines advancing? A global meta-analysis of treeline response to climate warming. Ecol. Lett. 2009, 12, 1040–1049. [Google Scholar] [PubMed]
Disclaimer/Publisher’s Note: The statements, opinions and data contained in all publications are solely those of the individual author(s) and contributor(s) and not of MDPI and/or the editor(s). MDPI and/or the editor(s) disclaim responsibility for any injury to people or property resulting from any ideas, methods, instructions or products referred to in the content. |
© 2023 by the authors. Licensee MDPI, Basel, Switzerland. This article is an open access article distributed under the terms and conditions of the Creative Commons Attribution (CC BY) license (https://creativecommons.org/licenses/by/4.0/).

