Article

Impacts of Different Reforestation Methods on Fungal Community and Nutrient Content in an Ex-Tea Plantation

1
College of Forestry, Fujian Agriculture and Forestry University, Fuzhou 350002, China
2
Fujian Academy of Forestry, Fuzhou 350002, China
3
College of Ecology and Resources Engineering, Wuyi University, Nanping 354500, China
*
Authors to whom correspondence should be addressed.
Forests 2023, 14(2), 432; https://doi.org/10.3390/f14020432
Submission received: 20 December 2022 / Revised: 16 February 2023 / Accepted: 16 February 2023 / Published: 20 February 2023
(This article belongs to the Special Issue Detection and Mitigation of Forest Degradation and Fragmentation)

Abstract

:
Long-term monocultures of tea and the excessive use of chemical fertilizer lead to the degradation of soil quality. Improving the soil quality of ex-tea plantations through vegetation restoration is an important task. However, the changes in soil nutrients, fungal communities, and the effects of microorganisms on soil nutrients after reforestation remain unclear. Therefore, in this study, we aimed to explore the effects of Pinus and Chinese fir on soil nutrients and fungal communities in ex-tea plantation areas that were subjected to the reforestation modes of pure forest and mixed forest by measuring soil chemical properties and ITS rRNA gene sequences. The results showed that (1) after reforestation, the relative normalized difference vegetation index (NDVI) of the Mixed forest, Mixed Pine and Mixed Fir areas increased (p < 0.05) compared to that of pure forest; (2) the soil organic carbon (SOC), total nitrogen (TN), and N:P ratios of the mixed forest increased by an average of 54%, 90%, and 299% (p < 0.05) compared to pure forest, whereas the total phosphorus (TP) and available potassium (AK) decreased by an average of 39% and 89% (p < 0.05); and (3) there was no significant difference in the diversity of the fungal communities of the pure and mixed forests, but the fungal phyla Mucoromycota, Glomeromycota, and Rozellomycota were significantly different in the pure and mixed forests. This differing microbial composition led to a significant increase (p < 0.05) in symbiotrophs (ecotomycorhizal, ericoid mycorhizal) in the mixed forest, which was negatively correlated with the soil TP and positively correlated with the TN and the N:P ratio. In addition, there was also a significant decrease (p < 0.05) in complex nutrient types (ectomycorrhizal-fungal parasite-plant saprotroph-wood saprotroph), which were negatively correlated with the SOC and TN, and arbuscular mycorrhizas, which were positively correlated with the TP. Our results show that the chemical properties of soils and the structure of the fungal communities changed significantly due to the reforestation of Chinese fir and Pinus, and the mixed forest mode of reforestation was more conducive to improving the soil quality; therefore, a mixed forest of Chinese fir and Pinus can be used to improve degraded soils in ex-tea planting areas.

1. Introduction

As the world’s largest tea producer [1], China accounted for 55% (2.2 million hectares) and 41% (2.5 million tons) of the world’s total tea area and production in 2017 [2]. The tea planting area of Fujian, in south-east China, reached 207,100 hectares, ranking fifth in China, whereas its tea production reached 395,000 tons, ranking first in China [3]. With the increasing demand for tea, the area of monoculture tea plantations has increased [4,5]. However, long-term tea monocultures may cause changes in the soil structure (i.e., soil compaction) and soil nutrients (i.e., the degradation of soils’ physicochemical properties and imbalances in soil nutrients), and tea farmers promote the growth and quality of tea by applying chemical fertilizers [6]. However, excessive fertilization has led to environmental pollution, soil acidification [7], declines in microbial diversity and beneficial microorganisms in tea plantations [8], and increasingly severe water and soil losses, which have also restricted the economic benefits of tea plantations [9]. The soil’s microbial functional diversity is extremely sensitive to changes in the soil microenvironment, whereas fungi seem to be more sensitive than bacteria to plant changes [10,11]. Soil fungal species in forests play an important role in soil functions, the decomposition of organic matter, and plant nutrient cycling [12]. Therefore, it is important to study the responses of fungal community activities and functions to forest change.
In general, conservation tillage (i.e., farming measures, methods, and systems) and biological measures (i.e., vegetation restoration) are used to alleviate these environmental problems [13]. For example, proper management with organic fertilizer replacement can effectively reduce soil problems in tea plantations and improve tea production and quality [14]. Changing the method of fertilization promotes the formation of organic matter in the soil surface layer of a tea garden and improves the yield and quality of the tea [15]. Importantly, the quality of the tea can be improved by reducing nitrogen fertilizer application and intercropping tea and soybeans [16]. Affected by its complex geological structure, Anxi county has a high degree of fragmentation (leading to soil erosion). In addition, the local residents have reclaimed low-quality tea gardens with a large number of steep slopes for the development of the tea industry, but they have not paid attention to the protection of the environment, which has resulted in serious water erosion [17]. Conservation tillage measures are insufficient to improve some areas with relatively fragile environments. An effective way to improve the environment is vegetation restoration, which has both ecological and economic benefits [18]. Therefore, in order to cope with the problem of soil degradation caused by tea planting, the local government has implemented the policy of returning tea plantations to forests.
The tree species is the crucial factor affecting the quality of reforestation, and tree species that grow quickly, survive well and are easy to obtain are suitable choices [19]. In recent years, high-throughput phenotyping using unmanned aerial vehicles (UAVs) equipped with multiple sensors for close-range remote sensing has become a promising technology to overcome these limitations [20,21]. Among satellite remote-sensing tools, the spectral vegetation index is widely used to monitor vegetation [22], and acquiring multi spectral vegetation index data with UAV technology has become a valuable tool in monitoring and measuring vegetation growth and coverage. The normalized difference vegetation index (NDVI) accurately reflects the photosynthetic intensity, metabolic intensity, greenness and the seasonal and annual changes of vegetation, as well as representing the growth status, biomass, coverage and other important indicators of plants [23]. Chinese fir (Cunninghamia lanceolata (Lamb. Hook.)) is a fast-growing subtropical evergreen coniferous tree species, and it is also used for timber production in southern China as a primary species [24,25]. Pinus massoniana L. is a fast-growing species that has a strong resilience to low-quality soils, and thus it has been widely planted in degraded areas in China [26]. Previous studies have reported that transplanting Pinus and Chinese fir into degraded soil restored the stability of the soil functions and improved the soil’s physicochemical properties [27,28]. The artificial forests in Anxi county are predominantly coniferous forests composed of Chinese fir and Pinus massoniana. Under the continuous policy and with guarantees of financial input, breeding programs of the main forested tree species and a stable source of seedlings have been achieved in Fujian for forestry production and development [29].
Studies have assessed the positive ecological benefits (i.e., increased forest cover, improved forest quality, the slowing of forest decline and improved forest ecosystem services) brought by the implementation of returning tea plantations to forests [18]; However, in regions with fragile environments, the effects of reforestation on the soil’s chemical properties, the soil’s fungal diversity and abundance and the community’s composition and functional diversity have not been well investigated after the implementation of this policy. Therefore, we studied the pure and mixed forest in an ex-tea plantation area to understand the changes in the forest soil nutrients, the soil fungal community and the associated linkages. The goals of this study were to (1) clarify the impact of pure and mixed forest on the soil nutrient contents in an ex-tea plantation area; and (2) explore the effects of afforestation methods on fungal diversity and community composition and functions, as well as to clarify the relationships between the changes in the soil chemical properties and fungal communities.

2. Materials and Methods

2.1. Study Area

The study was carried out on the Fengtian state-owned forest farm in Anxi county (25°16′–25°20′ N, 118°1′–118°57′ E), Fujian, China (Figure 1), which contains sample plots that used to be tea plantations, and exhibits a typical subtropical monsoon climate. It is characterized by abundant rainfall in summer, with an average annual precipitation of 1800 mm. The annual average temperature is 19.5 °C, with an extreme minimum temperature of 0 °C and an extreme maximum temperature of 37 °C. The altitude ranges from 500 m to 650 m. The soil is yellow-red soil developed from granite parent rock. The depth of the solum is up to 60 cm.

2.2. Experimental Design and Soil Sampling

Three plots of pure and mixed forest (Fir: pure C.lanceolata forest, Pine: pure Pinus forest, Mixed: mixed forest of C.lanceolata and Pinus) were set up (Table 1), and two 20 m × 20 m sampling points were established in each plot. The distances between selected points were maintained between 6 m and 10 m. There were no other tree species in the pure forest, and the proportions of the mixed forests were 5:5. The stand ages were 24–27 years. The land use history of each forest was determined based on the management records of Fengtian state-owned forest farm. Forests have been re-established in the area since the 1990s and this site was previously used as tea plantations. Thinning and tending had been conducted at the initial stage of afforestation, and no artificial interference occurred thereafter. All of the selected plots were located on slopes with similar angles (around 25°–30°) and elevations (around 550 to 650 m) to reduce the effects of the slope angle and elevation on the soil properties.
The soil profile survey method and stratified sampling were used to collect the soil samples. First, the litter and humus layers were removed, trees with similar diameters at breast height (DBH) were selected and the rhizosphere soil attached to the root surfaces was collected [30]. Soil samples from three trees near five points were mixed, and the samples from the same site in each plot were mixed into six composite samples [31]. In total, 18 composite samples were collected. Approximately 2 g of fresh soil was placed in sterile centrifuge tubes, transported in dry ice and stored at −80 °C. The other part was air-dried in a cool place for the analysis of the soil’s chemical properties.

2.3. Unmanned Aerial Vehicle Image Acquisition and Processing

We used a DJI Phantom 4 drone (DJI, Shengzhen, China) as a flight platform, which was equipped with a multispectral camera (DJI, Shengzhen, China). The camera system consisted of six lenses that could capture blue, green, red, red edge, near-infrared (NIR), and visible (RGB) parts of the spectrum. The drone was flown 150 m above the ground, capturing images with an 85% overlap and 85% side lap. The images were acquired on October 20, 2020 from 12:00 to 14:00 to ensure that the multispectral camera captured the maximum sunlight required for the elimination of reflections and shadows [32]. Specific information about the DJI Phantom 4 Multispectral drone is available online: https://www.dji.com/cn/p4-multispectral/specs (accessed on 3 February, 2023).
DJI Terra version 3.0.0 (https://www.dji.com/cn/downloads/softwares/dji-terra (accessed on 3 February, 2023)) software was used to splice the images obtained during each flight mission. In total, 264 (Fir), 462 (Pine) and 444 (Mixed) images were collected, and three orthophotos of the different plantation types were generated by importing the images into the DJI Terra software. The 2-D multispectral template was selected as the reconstruction type, and the WGS-84 coordinate system and the high-definition parameters were selected [33]. We calculated the normalized difference vegetation index (NDVI) using ArcGis (version 10.6.1) and following the calculation formula [34]:
NDVI = ((NIR − Red))/((NIR + Red)).

2.4. Analysis of Soil Chemical Properties

The soil samples were sieved through a 0.149 mm mesh sieve, and 200 mg of soil was used for soil organic carbon (SOC) and total nitrogen (TN) analyses, which were conducted using the dry combustion method in a CN elemental analyzer (Vario MAX, Elementar, Frankfurt, Germany) [28]. After wet digestion of 100 mg of soil using HNO3-HClO4, the total phosphorus (TP), Ca, Fe, Na, Mg and Al contents were analyzed via inductively coupled plasma atomic emission spectrometry (ICP-OES, PerkinElmer, Waltham, MA, USA). The available K (AK) was measured following the methods of Hou et al. [28].

2.5. Soil Fungal DNA Extraction and Sequencing

The soil deoxyribonucleic acid (DNA) was extracted from 0.6 g of fresh soil using an E.Z.N.A.® soil DNA Kit (Omega Bio-Tek, Norcross, GA, USA) according to the manufacturer’s instructions. The DNA quantity and quality were determined using a NanoDrop 2000 spectrophotometer (Thermo Scientific, Waltham, MA, USA). The DNA quality and purity were determined via electrophoresis on 1% agarose gel, and the extracted DNA was stored at −80 °C before use.
The internal transcribed spacer 1 (ITS1) region of the fungal ribosomal ribonucleic acid (rRNA) gene was analyzed using the primers ITS1 (5′-CTTGGTCATTTAGAGGAAGTAA-3′) and ITS2 (5′-TGCGTTCTTCATCGATGC-3′) [35]. Polymerase chain reaction (PCR) amplification was conducted in a 25 μL reaction system containing 30 ng of DNA template, 12.5 μL of 2 × Taq Plus Master Mix (Vazyme Biotech Co., Ltd., Nanjing, China), 1 μL of 5 μM forward and reverse primers, 3 μL of 2 ng/μL bovine serum albumin (BSA, New England Biolabs, Ipswich, MA, USA), and ddH2O. The PCR amplification was performed as follows: predenaturation at 94 °C for 5 min; 34 cycles of denaturation at 94 °C for 30 s, renaturation at 55 °C for 30 s, extension at 72 °C for 60 s and a final extension at 72 °C for 7 min. The PCR products were tested using 1% agarose gel and were purified using the Agencourt AMPure XP system (Beckman Coulter Commercial Enterprise Co., Ltd., Beijing, China). High-throughput sequencing of the ITS was performed using the Illumina MiSeq PE300 sequencing platform at Allwegene Company (Beijing, China).
The ITS gene sequences were clustered using QIIME (version 1.8.0) software [36]. Vsearch (version 2.7.1) software was used to perform quality filtering and pruning, noise removal (error correction), end-to-end reading and merging, mosaic removal and classification assignments.

2.6. Statistical Analysis

Soil fungal community alpha diversity (Chao1 and Shannon indexes) and beta diversity were analyzed using the QIIME platform. FUNGuild v1.0 [37] was used to determine the functional groups of fungi, and fungi identified as the complex trophic type were included in the category of “complex nutrient type”, whereas symbiotic fungi continued to be subdivided into three different types and fungal functional groups that accounted for a very small proportion after statistical analyes were also included in the category of “others”. One-way analysis of variance (ANOVA) based on Duncan’s test (p < 0.05) was performed to test the differences in the soil chemical properties, fungal diversity and fungal functional communities. The statistical analyses were conducted using SPSS Software (version 19.0, IBM, Chicago, IL, USA). The “vegan” R package [38] was used to conduct redundancy analysis (RDA) to investigate the relationship between the dominant fungi and the soil’s chemical properties. The corr.test function in the R package “psych” [39] was used to conduct Pearson’s correlation analysis between the fungal functional groups and soil chemical properties and the “circle” R package [40] was used to map the correlations. The analyses were performed in R 4.2.1 software.

3. Results

3.1. NDVI under Different Planting Modes

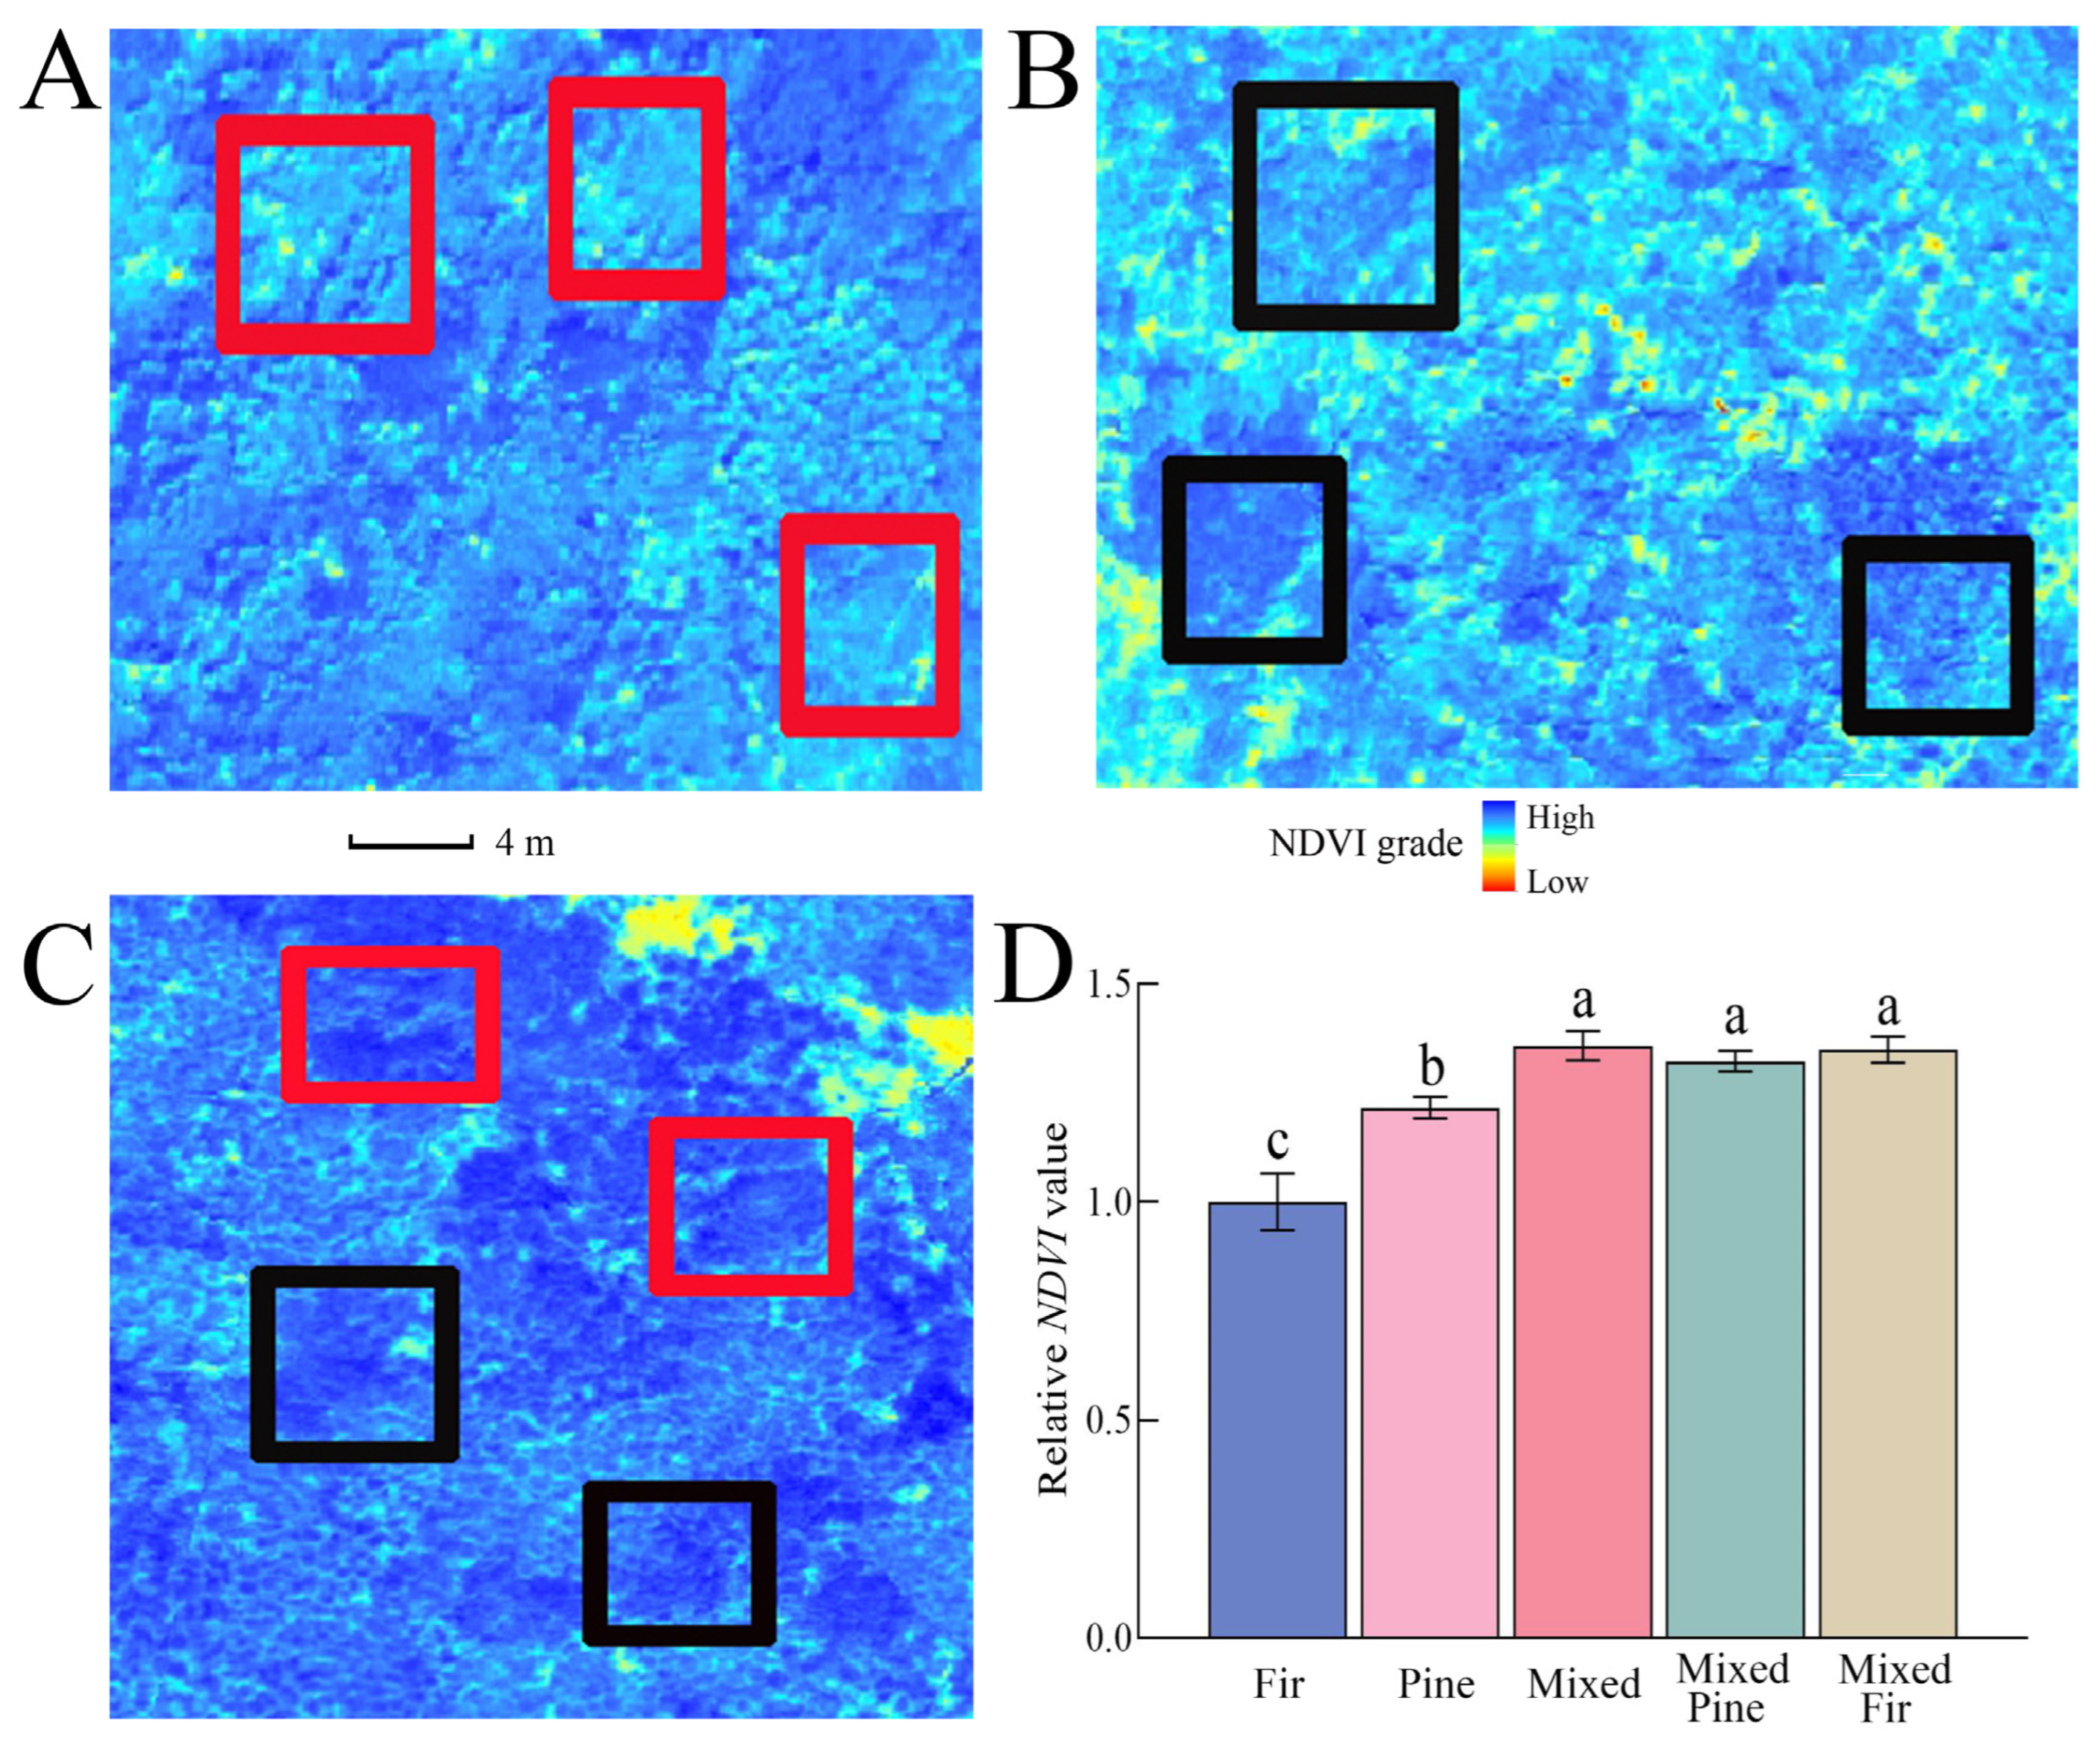
The analysis of variance showed that the relative NDVI values of the pure forest and mixed forest were significantly different (Figure 2). Compared with the pure forests (Fir (Figure 2A), Pine (Figure 2B)), the relative NDVI value of the mixed forest (Figure 2C) was higher (p < 0.05), with a range of 1.32–1.39. In addition, the relative NDVI values of the Mixed Pine and Mixed Fir in mixed forests were also significantly higher (p < 0.05) than those of the Fir and Pine, with the maximum values of 1.36 (Mixed Pine) and 1.39 (Mixed Fir) (Figure 2D). The results showed that compared with the pure forest, the mixed forest showed a significantly (p < 0.05) altered state of plant growth.

3.2. Soil Chemical Properties

The chemical properties of the soils were significantly different under different afforestation models (Table 2). Compared with the fir forest, the contents of SOC and TN and the N:P ratio of the mixed forest were higher, with increases of 53%, 90% and 299% (p < 0.05), whereas the soil’s TP and C:N ratio were an average of 51% and 20% lower (p < 0.05). The soil SOC, TN and C:N ratio of the Fir and Pine areas were not significantly different, but the soil TP and AK of the Pine area were 39% and 89% lower (p < 0.05), on average, and the soil N:P ratio was 74% higher (p < 0.05). In addition, compared with the chemical properties of the tea garden in the same area, the contents of SOC and TN after afforestation were higher, but the contents of TP and AK were decreased. Concerning the soil’s element contents, soil Ca and Al decreased significantly (p < 0.05) from the Fir and Pine areas to the Mixed area, and the soil Fe of the Mixed area was significantly decreased compared with that of the Fir area, but the soils’ Na and Mg contents were not significantly different (Table S1).

3.3. Diversity and Structure of Fungal Communities in Different Forests

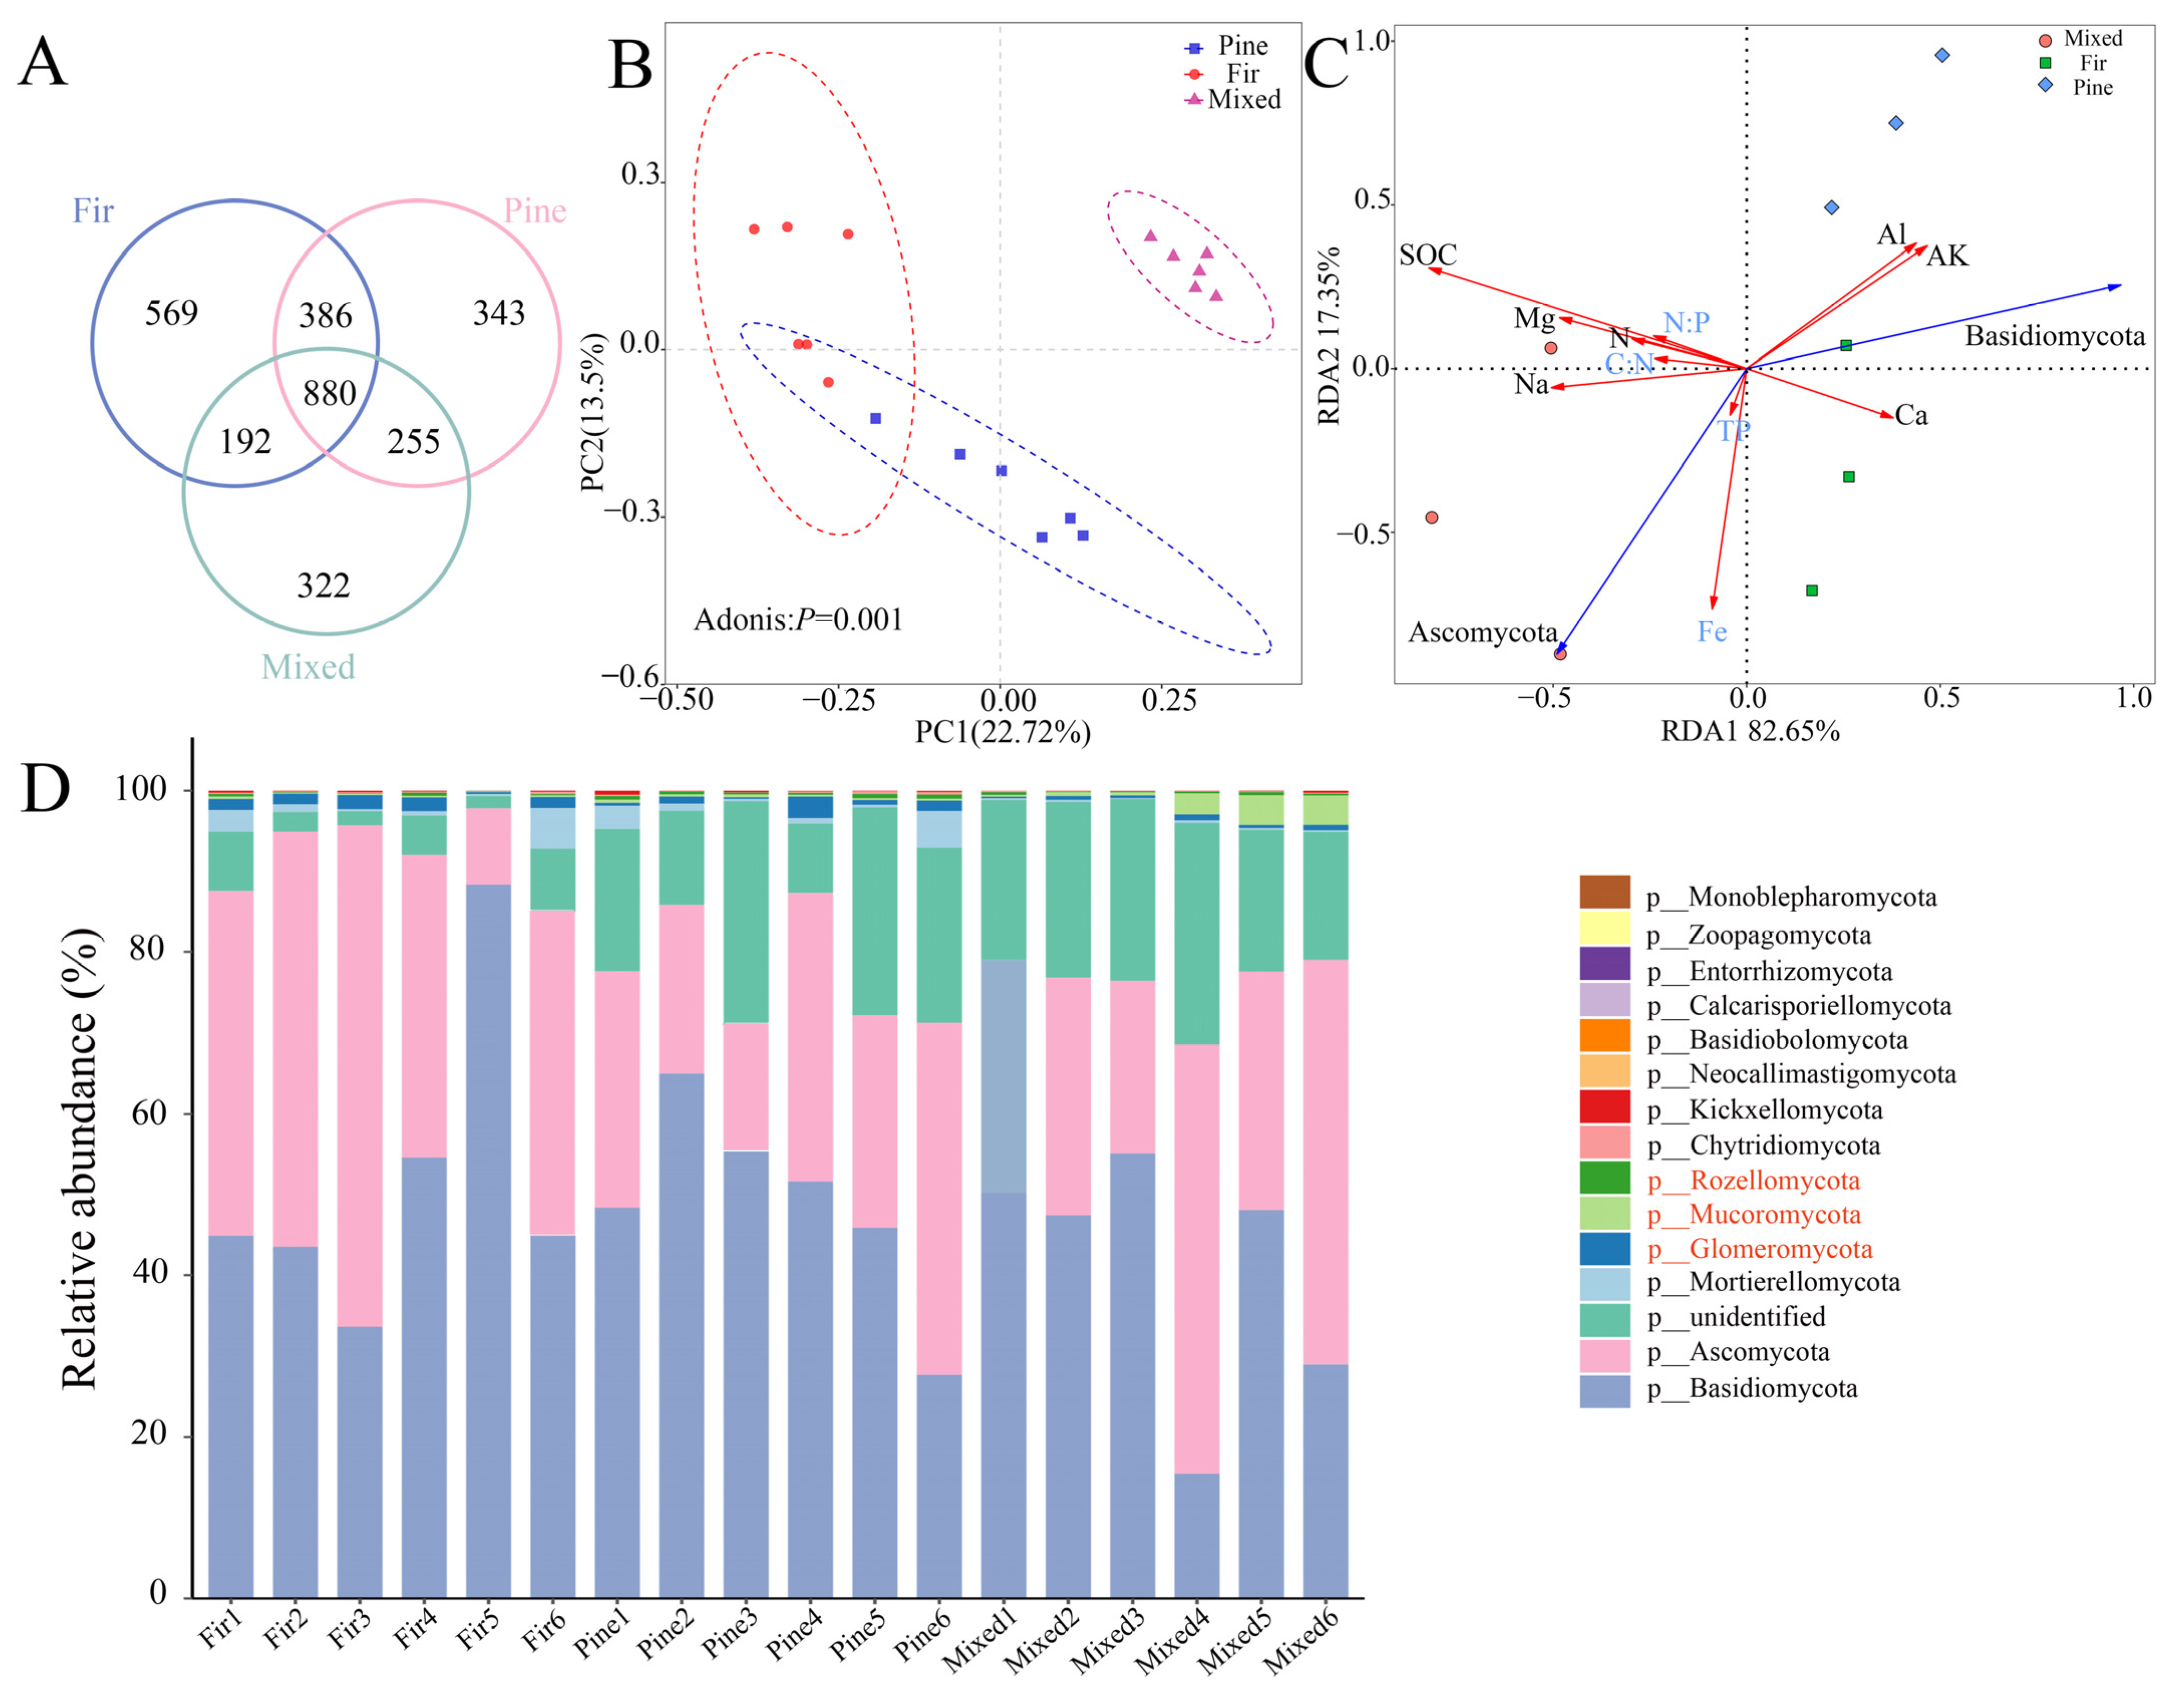
We compared the fungal communities in the pure forest and mixed forest (Figure 3). In total, 1,424,967 clean reads were sequenced. The associated fungi belonged to 14 phyla, 42 classes, 124 orders, 253 families, 513 genera and 782 species. There were 569, 343 and 322 specific operational taxonomic units (OTUs) in the fungal communities from the Fir, Pine, and Mixed areas, respectively, and 880 OTUs were shared by the three different types of forest (Figure 3A).
The Fir communities had the greatest Chao 1 diversity (Figure S1), whereas the fungal communities from the Mixed forest had the greatest Shannon diversity index (Figure S1). However, there were no differences in diversity between the pure and mixed forests. Principal coordinate analysis (PCoA) with unweighted unique fraction metric (UniFrac) distances clearly distinguished the Mixed communities from the Fir and Pine communities (Figure 3B), indicating that the structures of the microbial communities in the pure and mixed forest were significantly different.
The fungal community in the Mixed forest was clearly different from those in the Fir and Pine forests (Figure 3C). Soil chemical properties were used as environmental variables, and dominant fungal communities were used as response variables. The soil’s C:N ratio (p = 0.017, R2 = 0.74), Fe content (p = 0.034, R2 = 0.67), N:P ratio (p = 0.037, R2 = 0.68), and TP content (p = 0.049, R2 = 0.66) were positively correlated with Ascomycota and negatively correlated with Basidiomycota.
The read abundance was used as a measure of the taxon abundance within the species. Fourteen known fungal phyla were identified in the three different types of forest (Figure 3D). The fungal community compositions of the three different forest types were similar. Basidiomycota (51.7%) and Ascomycota (40.5%) were the most abundant fungal phyla, together accounting for more than 90% of the fungal community’s read abundance. However, the relative abundance of Glomeromomycota, Mucoromomycota, and Rozellomycota was less than 2%, but their relative abundance was significantly (p < 0.05) different when comparing the pure forest and the mixed forest.
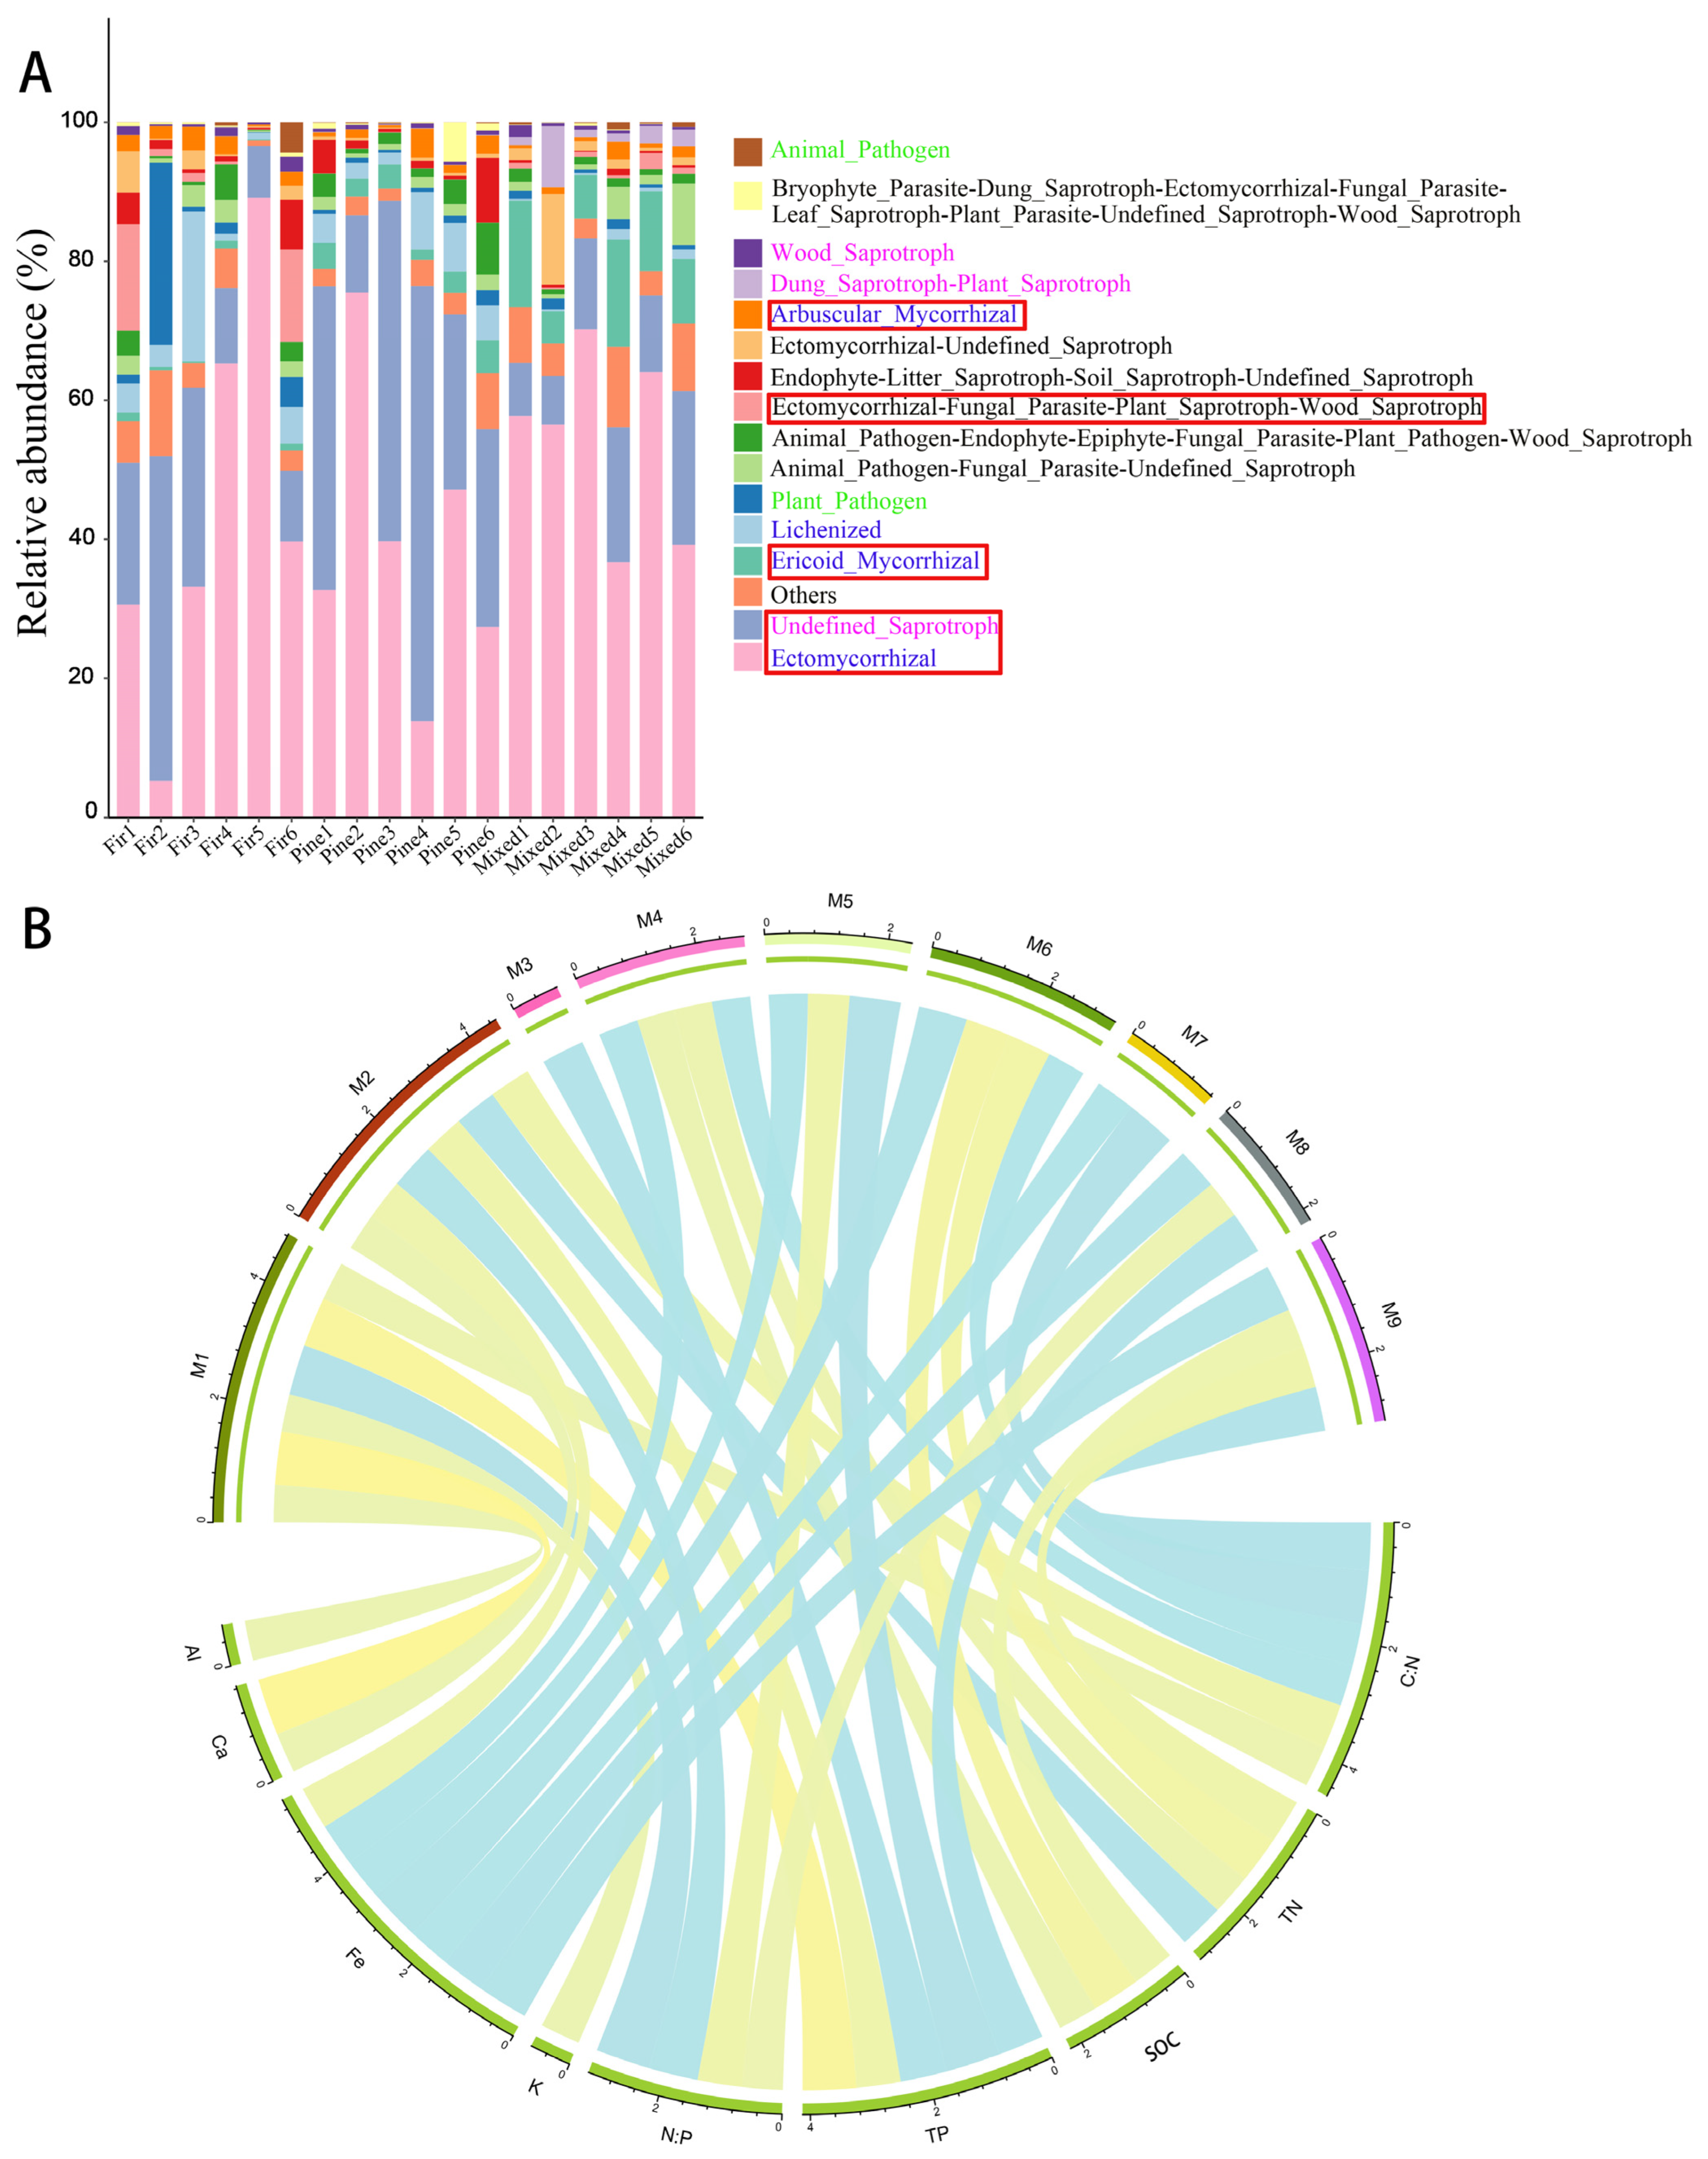
A total of 2497 OTUs were found in all samples, and the FunGuild database allocated 54.9% of the OTUs (1617 OTUs) to 14 fungal guilds based on four trophic modes: symbiotrophs, saprotrophs, pathotrophs and complex nutrient types (Figure 4A). Some fungal functional groups exhibited significant changes, specifically, the symboitrophs (ecotomycorrhiza and ericoid mycorrhiza) were more abundant in the mixed forest than in the pure forest (p < 0.05), whereas the arbuscular mycorrhiza (symboitrophs) (p < 0.05) and the complex nutrient types (ectomycorrhizal-fungal parasite-plant saprotroph-wood saprotroph) (p < 0.05) were more abundant in the pure forest than the mixed forest (Figure 4A).

3.4. Correlations between Fungal Community Composition and Soil Chemical Properties

We carried out a correlation analysis between fungal guilds and soil chemical properties (Figure 4B, Table S2). The relationship between functional groups with significant differences (Figure 4A) and soil chemical properties was as follows: the ectomycorrhizal group (symbiotrophs, 220 OTUs) was negatively correlated with the C:N ratio and the K and Al contents, significantly negatively correlated with the TP and Ca contents and significantly positively correlated with the N:P ratio. The ericoid mycorrhizal group (symbiotrophs, 36 OTUs) was negatively correlated with the C:N ratio and the TP, Fe and Ca contents; positively correlated with the TN content; and significantly positively correlated with the N:P ratio. The ectomycorrhizal-fungal parasite-plant saprotroph-wood saprotroph group (complex nutrient types, 14 OTUs) exhibited a positive correlation with the C:N ratio and Fe content, a negative correlation with the TN and SOC contents and a significant negative correlation with the SOC and Fe contents. The arbuscular mycorrhizal group (symbiotrophs, 133 OTUs) exhibited a positive correlation with the TP and Fe contents and a negative correlation with the N:P ratio.

4. Discussion

Our results revealed that the soil chemical properties of mixed forest (mixed forest of C. lanceolata and Pinus) were significantly different from those of the pure forest. This was specifically exemplified by the higher SOC, TN and N:P ratios of the mixed forest. In addition, the structure of the fungal community of the mixed forest was significantly different from that of the pure forest, with a clear separation between the mixed forest (Mixed) and pure forest (Fir and Pine).

4.1. Variations in Soil Chemical Properties

Compared with the Fir forest area, the soil SOC, TN and N:P ratios of the Mixed forest area were significantly higher, whereas the soil C:N ratio, TP, Ca, Fe and Al values were significantly lower. Compared with the Pine, the N:P ratio of the Mixed forest was significantly higher and the TP, AK, Ca and Al contents were significantly lower. These results are consistent with those of previous studies, compared with pure forests, as the reforestation of mixed tree species is usually accompanied by the accumulation of litterfall [42]. The adaptation of the microbial community to the litterfall promotes the decomposition of the litter relatively quickly [28], thus resulting in an increase in the soil’s C and nutrient contents and an improvement in the soil quality compared to monospecies plantations [43]. In addition, the soils’ stoichiometric ratios were significantly changed by the mixed afforestation, and the C:N ratio of the Mixed forest was significantly lower than that of the Fir forest, indicating that the mixed forest helped to accelerate the mineralization rate of the organic matter [44]. The N:P ratio of the soil reflects the N saturation and is used to define the threshold of the soil’s nutrient limitation [45,46]. In this study, the N:P ratios of the soil were lower than the global (13.1) and Chinese averages (5.2) [47], but the N:P ratio of the mixed plantation was significantly higher than those of the pure plantations. Compared to the pure forests, the TP of the mixed forest was significantly lower. This may be because the mixed forest had greater soil microbial activity due to the larger amount of litter, which accelerated the biological transformation and release of soil phosphorus [48]. However, the mixed tree species did not exhibit higher element contents, and the Ca, Fe and Al contents of this area were significantly lower. These elements are only slowly released during the litter decomposition process [49]. This may be why the soil mineral elements in the mixed forest were not significantly higher. These results show that the mixed forest significantly improved the soil chemical properties compared to the pure forests after returning the tea garden to forest land. However, our research only explored the relationship between soil chemical properties and fungi. Due to differences in the genetic characteristics [50] and nutrient utilization strategies [51] of forest trees, and differences in forest roots and exudates [52], their mechanism of influence on soil nutrient changes needs to be further studied.

4.2. Variations in Fungal Diversity, Community Composition, and Functional Community

The fungal community structures of the Fir and Pine forests were clearly significantly different from that of the Mixed forests (Figure 3B), but there were no significant differences in the fungal alpha diversities (Figure S1). A similar phenomenon was observed in a mixed forest of Chinese fir and Phoebe bournei and in a mixed forest of Picea asperata and Sabina chinensis, in which the alpha diversities of the soil fungal communities were not significantly different but the beta diversities were significantly different [53,54]. A previous study reported that changes in the microbial community structure do not necessarily lead to changes in the species richness or diversity [55]. Compared with the species composition, the species richness has a smaller response to changes in environmental factors (i.e., vegetation type, pH and soil texture), which may occur in some lower taxa [56].
Most of the fungal phyla in this study belonged to Basidiomycota and Ascomycota, which is consistent with the geographical distribution of global soil fungi. These two dominant fungal phyla contain cellulolytic enzymes [57], which are the main degraders of cellulosic organic matter and play important roles in C transformation and nutrient cycling [58]. Studies on soil microbial communities in coniferous forests of different successional stages have found that the abundance of Ascomycota decreases with the accumulation of soil nutrients [59]. It has been found that the relative abundance of Ascomycota decreases due to the changes in vegetation, which accelerates the native SOC decomposition process [60]. A study of soil microbial communities in five different types of habitat found that Ascomycota and Basidiomycota exhibited a significant correlation with SOC content [61]. These relationships may explain why the two dominant fungal phyla in our study were correlated with the C:N ratio, N:P ratio and TP content (Figure 3C). Although ecosystem functions are mostly affected by the dominant taxa, some rare taxa communities may still become key species in regulating ecosystem functions in the environment [62]. Our results show that the relative abundance of Mucoromomycota, Glomeromomycota and Rozellomycota was less than 2%, but there was a significant difference between the pure and mixed forests (Figure 3D). A study has shown that Mucoromomycota, Glomeromomycota and Rozellomycota are positively correlated with the TN, TP, total organic carbon (TOC) and AK contents [24]. In this study, Mucoromomycota and Rozellomycota were more abundant in the Mixed forest, whereas Glomeromomycota was more abundant in the Fir and Pine forests.
In this study, the fungal community structure was mainly characterized by a single guild type (symbiotrophs, saprotrophs and pathotrophs), followed by the complex guild types (pathotrophs-saprotrophs-symbiotrophs, saprotrophs-symbiotrophs and pathotrophs-saprotrophs). Our results show that there were strong correlations between the fungal community structure and the soil nutrients in the pure and mixed forests, indicating that these single guilds play a role in promoting nutrient acquisition. Moreover, some of the symbiotrophs were significantly different in the Pine and Fir forests compared to the Mixed forests. The change in the mycorrhizal fungi was found to be due to the N and P contents of the soil nutrients in a previous study [63]. In this study, correlation analysis revealed that there were significant correlations between the TN, TP and mycorrhizal fungal abundance, and the TN content was significantly higher in the Mixed forest, whereas the TP content was significantly lower.
In this study, the different microbes Mucoromomycota, Glomeromomycota and Rozellomycota were characterized by fast growth and high metabolic activity [64]. These fungi included mycorrhizal fungi and had the function of phosphorus metabolism. They can provide up to 90% of the phosphorus and nitrogen for plants and were also found to enhance the dissolution and absorption of phosphate in the soil [65,66]. In agricultural research, a large number of microbial inoculants have been used to improve soil fertility, crop yields and quality [67], but fewer studies have been conducted in forests. Although the non-cultivation technology of microorganisms enables us to quickly and accurately identify the microbes in the environment, the feasibility of cultivating these different microorganisms in the laboratory is still challenging due to the complexity of the background environment. This makes it more difficult for these different microbes to be directly applied in forests. Therefore, the question of how to develop and utilize these microorganisms to improve the soil quality in tea planting areas is a topic worthy of our attention in the future.

5. Conclusions

Our results showed that in areas of former tea plantations that had were returning to forest land, the mixed forest areas had significantly higher soil SOC, TN and N:P ratios than those of the pure forest areas, as well as lower soil TP, AK, C:N ratios and mineral nutrient contents. In addition, the relative abundances and diversities of the soil fungal communities were not significantly different but the fungal community structures were significant different between pure forest and mixed forest. The soil chemical properties, fungal communities and functional groups in the mixed forest were significantly different compared to those in the pure forest in this ex-tea plantation area. Differential microbial (Mucoromycota, Glomeromycota, Rozellomycota) and microbial community functions (ectomycorhizal, ericoid mycorhizal, ectomycorhizal-fungal parasite-plant saprotroph-wood saprotrophy, arbuscular mycorhizal) showed significant differences between pure forest and mixed forest areas, which were closely related to soil chemical properties.
This study demonstrates that soils’ chemical properties and fungal communities can be altered by establishing a mixed forest of Chinese fir and Pinus in an ex-tea plantation area. Our study only evaluated the soil chemical properties and microorganisms, which is not sufficient. Future research should consider more environmental factors and evaluate the ecological benefits derived from the forest structure (i.e., tree height, DBH, biomass).

Supplementary Materials

The following supporting information can be downloaded at: https://www.mdpi.com/article/10.3390/f14020432/s1, Figure S1: The richness (Chao 1 index) and diversity (Shannon index) at the OUT level; Table S1: Content of soil mineral elements in different forest types; Table S2: The correlation between OTUs of fungal functional guilds and soil chemical properties.

Author Contributions

A.L. carried out the writing and original draft preparation; A.L. and X.W. performed the experiments and collected the data; A.L., W.Y. and Y.L. analyzed the data; S.S., J.S. and C.W. conceived of the project; J.S., C.W. and H.F. reviewed and edited the article. All authors have read and agreed to the published version of the manuscript.

Funding

This work was funded by the National Natural Science Foundation of China (No.42071132).

Data Availability Statement

Not applicable.

Conflicts of Interest

The authors declare no conflict of interest.

References

  1. Manawasinghe, I.S.; Jayawardena, R.S.; Li, H.L.; Zhou, Y.Y.; Zhang, W.; Phillips, A.J.L.; Wanasinghe, D.N.; Dissanayake, A.J.; Li, X.H.; Li, Y.H.; et al. Microfungi associated with Camellia sinensis: A case study of leaf and shoot necrosis on tea in Fujian, China. Mycosphere 2021, 12, 430–518. [Google Scholar] [CrossRef]
  2. UNFAO. The Food and Agriculture Organization Corporate Statistical Database (FAOSTAT); Food and Agriculture Organization of the United Nations (UNFAO): Rome, Italy, 2019. [Google Scholar]
  3. Bureau of Statistics. Fujian Statistical Yearbook 2019; Bureau of Statistics of Fujian Province: Fuzhou, China, 2019. [Google Scholar]
  4. Guo, L.; Du, Z.H.; Wang, Z.; Lin, Z.; Guo, Y.L.; Chen, M.J. Location affects fatty acid composition in Camellia sinensis cv Tieguanyin fresh leaves. J. Food Sci. Technol. 2020, 57, 96–101. [Google Scholar] [CrossRef] [PubMed]
  5. Musial, C.; Kuban-Jankowska, A.; Gorska-Ponikowska, M. Beneficial properties of green tea catechins. Int. J. Mol. Sci. 2020, 21, 1744. [Google Scholar] [CrossRef] [Green Version]
  6. Zhang, G.L.; Chu, X.B.; Zhu, H.Y.; Zou, D.S.; Li, L.C.; Du, L.S. The response of soil nutrients and microbial community structures in long-term tea plantations and diverse agroforestry intercropping systems. Sustainability 2021, 13, 7799. [Google Scholar] [CrossRef]
  7. Gao, S.L.; Hu, S.S.; He, P.; Feng, K.; Pan, R.Y.; Zhang, S.A.; Guo, B.; Lee, T.C.; Lin, J.K. Effects of reducing chemical fertilizer on the quality components of Tieguanyin tea leaves. IOP Conf. Ser. Earth Environ. Sci. 2020, 559, 012020. [Google Scholar] [CrossRef]
  8. Li, Y.C.; Li, Z.W.; Arafat, Y.; Lin, W.W.; Jiang, Y.H.; Weng, B.Q.; Lin, W.X. Characterizing rhizosphere microbial communities in long-term monoculture tea orchards by fatty acid profiles and substrate utilization. Eur. J. Soil Biol. 2017, 81, 48–54. [Google Scholar] [CrossRef]
  9. Li, N.; Zhang, D.; Li, L.W.; Zhang, Y.L. Mapping the spatial distribution of tea plantations using high-spatiotemporal-resolution imagery in northern Zhejiang, China. Forests 2019, 10, 856. [Google Scholar] [CrossRef] [Green Version]
  10. Heinemeyer, A.; Fitter, A.H. Impact of temperature on the arbuscular mycorrhizal (AM) symbiosis: Growth responses of the host plant and its AM fungal partner. J. Exp. Bot. 2004, 55, 525–534. [Google Scholar] [CrossRef] [Green Version]
  11. Nagati, M.; Roy, M.; Sophie, M.; Richard, F.; Annie, D.; Gardes, M.; Bergeron, Y. Impact of local forest composition on soil fungal communities in a mixed boreal forest. Plant Soil 2018, 432, 345–357. [Google Scholar] [CrossRef]
  12. Dighton, J. Fungi in Ecosystem Processes; CRC Press: New York, NY, USA, 2018; pp. 21–77. [Google Scholar]
  13. He, J.Y.; Jiang, X.H.; Lei, Y.X.; Cai, W.J.; Zhang, J.J. Temporal and spatial variation and driving forces of soil erosion on the Loess Plateau before and after the implementation of the Grain-for-Green project: A case study in the Yanhe river basin, China. Int. J. Environ. Res. Publish Health 2022, 19, 8446. [Google Scholar] [CrossRef]
  14. Xie, S.W.; Feng, H.X.; Yang, F.; Zhao, Z.D.; Hu, X.D.; Wei, C.Y.; Liang, T.; Li, H.T.; Geng, Y.B. Does dual reduction in chemical fertilizer and pesticides improve nutrient loss and tea yield and quality? A pilot study in a green tea garden in Shaoxing, Zhejiang Province, China. Environ. Sci. Pollut. Res. Int. 2019, 26, 2464–2476. [Google Scholar] [CrossRef]
  15. Dong, M.F.; Kai, F.; Peng, L.; Xiao, C.W. Ecological no-tillage technology of sloping tea garden in China. J. Korean Tea Soc. 2015, 21, 67–71. [Google Scholar]
  16. Duan, Y.; Shang, X.W.; Liu, G.D.; Zou, Z.W.; Zhu, X.J.; Ma, Y.C.; Li, F.; Fang, W.P. The effects of tea plants-soybean intercropping on the secondary metabolites of tea plants by metabolomics analysis. BMC Plant Biol. 2021, 21, 482. [Google Scholar] [CrossRef] [PubMed]
  17. Deng, Y.S.; Xia, D.; Cai, C.F.; Ding, S.W. Effects of land uses on soil physic-chemical properties and erodibility in collapsing-gully alluvial fan of Anxi County, China. J. Integr. Agric. 2016, 15, 1863–1873. [Google Scholar] [CrossRef] [Green Version]
  18. Chang, Y.X.; Zou, T.H.; Yoshino, K.H.; Luo, S.Z.; Zhou, S.G. Ecological policy benefit valuation based on public feedback: Forest ecosystem services in Wuyishan nature reserve, China. Sci. Total Environ. 2019, 673, 622–630. [Google Scholar] [CrossRef]
  19. Nunes, S.; Gastauer, M.; Cavalcante, R.B.L.; Ramos, S.J.; Caldeira, C.F.; Silva, D.; Rodrigues, R.R.; Salomão, R.; Oliveira, M.; Souza-Filho, P.W.M.; et al. Challenges and opportunities for large-scale reforestation in the Eastern Amazon using native species. For. Ecol. Manag. 2020, 466, 118120. [Google Scholar] [CrossRef]
  20. Yang, G.J.; Liu, J.G.; Zhao, C.J.; Li, Z.H.; Huang, Y.B.; Yu, H.Y.; Xu, B.; Yang, X.D.; Zhu, D.M.; Zhang, X.Y.; et al. Unmanned aerial vehicle remote sensing for field-based crop phenotyping: Current status and perspectives. Front. Plant Sci. 2017, 8, 1111. [Google Scholar] [CrossRef] [Green Version]
  21. Araus, J.L.; Cairns, J.E. Field high-throughput phenotyping: The new crop breeding frontier. Trends Plant Sci. 2014, 19, 52–61. [Google Scholar] [CrossRef]
  22. Huete, A.R. Vegetation indices, remote sensing and forest monitoring. Geogr. Compass 2012, 6, 513–532. [Google Scholar] [CrossRef]
  23. Tucker, C.J.; Fung, I.Y.; Keeling, C.D.; Gammon, R.H. Relationship between atmospheric CO2 variations and a satellite-derived vegetation index. Nature 1986, 319, 195–199. [Google Scholar] [CrossRef]
  24. Xu, H.D.; Yu, M.K.; Cheng, X.R. Abundant fungal and rare bacterial taxa jointly reveal soil nutrient cycling and multifunctionality in uneven-aged mixed plantations. Ecol Indic. 2021, 129, 107932. [Google Scholar] [CrossRef]
  25. Zou, X.D.; Liang, A.J.; Wu, B.Z.; Su, J.; Zheng, R.H.; Li, J. UAV-based high-throughput approach for fast growing Cunninghamia lanceolata (Lamb.) cultivar screening by machine learning. Forests 2019, 10, 815. [Google Scholar] [CrossRef] [Green Version]
  26. Ashfaq, A.; Majid, H.; Saqib, A.; Kashif, A.; Muhammad, M.W.; Zamir, A.; Arshad, A.; Moazzam, N.S.; Bilal, A.; Harrison, M.T.; et al. Ecological stoichiometry in Pinus massoniana L. plantation: Increasing nutrient limitation in a 48-year chronosequence. Forests 2022, 13, 469. [Google Scholar]
  27. Zhang, B.; Wang, H.L.; Yao, S.H.; Bi, L.D. Litter quantity confers soil functional resilience through mediating soil biophysical habitat and microbial community structure on an eroded bare land restored with mono Pinus massoniana. Soil Biol. Biochem. 2013, 57, 556–567. [Google Scholar] [CrossRef]
  28. Hou, X.L.; Han, H.; Mulualem, T.; Cai, L.P.; Meng, F.R.; Liu, A.Q.; Ma, X.Q. Changes in soil physico-chemical properties following vegetation restoration mediate bacterial community composition and diversity in Changting, China. Ecol. Eng. 2019, 138, 171–179. [Google Scholar] [CrossRef]
  29. Cao, S.; Hu, R.Y.; Wu, X.L.; Sun, Y.H.; Wu, B.; Duan, H.J.; Lin, H.Z.; Wu, M.J.; Fang, L.M.; Yu, X.L.; et al. Two chemical mutagens modulate the seed germination, growth, and phenotypic characteristics of Chinese fir (Cunninghamia lanceolata). J. For. Res. 2021, 32, 2077–2085. [Google Scholar] [CrossRef]
  30. Wang, Y.Z.; Jiao, P.Y.; Guo, W.; Du, D.J.; Hu, Y.L.; Tan, X.; Liu, X. Changes in bulk and rhizosphere soil microbial diversity and composition along an age gradient of Chinese fir (Cunninghamia lanceolata) plantations in subtropical China. Front. Microbiol. 2022, 12, 777862. [Google Scholar] [CrossRef]
  31. Bao, T.; Deng, S.L.; Yu, K.Y.; Li, W.Y.; Dong, A.R. Metagenomic insights into seasonal variations in the soil microbial community and function in a Larix gmelinii forest of Mohe, China. J. For. Res. 2021, 32, 371–383. [Google Scholar] [CrossRef]
  32. Tao, X.Y.; Li, Y.J.; Yan, W.Q.; Wang, M.J.; Tan, Z.F.; Jiang, J.M.; Luan, Q.F. Heritable variation in tree growth and needle vegetation indices of slash pine (Pinus elliottii) using unmanned aerial vehicles (UAVs). Ind. Crops Prod. 2021, 173, 114073. [Google Scholar] [CrossRef]
  33. Wu, B.Z.; Liang, A.J.; Zhang, H.F.; Zhu, T.F.; Zou, Z.Y.; Yang, D.M.; Tang, W.Y.; Li, J.; Su, J. Application of conventional UAV-based high-throughput object detection to the early diagnosis of pine wilt disease by deep learning. For. Ecol. Manag. 2021, 486, 118986. [Google Scholar] [CrossRef]
  34. Li, X.Y.; Zhu, W.Q.; Xie, Z.Y.; Zhan, P.; Huang, X.; Sun, L.X.; Duan, Z. Assessing the effects of time interpolation of NDVI composites on phenology trend estimation. Remote Sens. 2021, 13, 5018. [Google Scholar] [CrossRef]
  35. Cai, S.P.; Jia, J.Y.; He, C.Y.; Zeng, L.Q.; Fang, Y.; Qiu, G.W.; Lan, X.; Su, J.; He, X.Y. Multi-omics of pine wood nematode pathogenicity associated with culturable associated microbiota through an artificial assembly approach. Front. Plant Sci. 2022, 12, 798539. [Google Scholar] [CrossRef] [PubMed]
  36. Caporaso, J.G.; Kuczynski, J.; Stombaugh, J.; Bittinger, K.; Bushman, F.D.; Costello, E.K.; Fierer, N.; Peña, A.G.; Goodrich, J.K.; Gordon, J.I.; et al. QIIME allows analysis of high-throughput community sequencing data. Nat. Methods 2010, 7, 335–336. [Google Scholar] [CrossRef] [PubMed] [Green Version]
  37. Nguyen, N.H.; Song, Z.W.; Bates, S.T.; Branco, S.; Tedersoo, L.; Menke, J.; Schilling, J.S.; Kennedy, P.G. FUNGuild: An open annotation tool for parsing fungal community datasets by ecological guild. Fungal Ecol. 2016, 20, 241–248. [Google Scholar] [CrossRef]
  38. Oksanen, J.; Simpson, G.L.; Blanchet, F.G.; Kindt, R.; Legendre, P.; Minchin, P.R.; O’Hara, R.B.; Solymos, P.; Stevens, M.H.H.; Szoecs, E.; et al. Vegan: Community Ecology Package (R Package Version 2.6-4). 2022. Available online: https://CRAN.R-project.org/package=vegan (accessed on 3 February 2023).
  39. Revelle, W. Psych: Procedures for Psychological, Psychometric, and Personality Research (R package version 2.2.9); Northwestern University: Evanston, IL, USA, 2022; Available online: https://CRAN.R-project.org/package=psych (accessed on 3 February 2023).
  40. Schratz, P.; Joseph, M.; Gelfand, S. Circle: R Client Package for Circle CI (R package version 0.7.2). 2022. Available online: https://CRAN.R-project.org/package=circle (accessed on 3 February 2023).
  41. Xu, P.; Yang, L.Y.; Liu, M.C.; Peng, F. Soil Characteristics and Nutrients in Different Tea Garden Types in Fujian Province, China. J. Resour Ecol. 2014, 5, 356–363. [Google Scholar]
  42. González, I.; Sixto, H.; Rodríguez-Soalleiro, R.; Oliveira, N. Nutrient contribution of litterfall in a short rotation plantation of pure or mixed plots of Populus alba L. and Robinia pseudoacacia L. Forests 2020, 11, 1133. [Google Scholar] [CrossRef]
  43. Zhang, W.W.; Liu, W.; He, S.W.; Chen, Q.C.; Han, J.G.; Zhang, Q.F. Mixed plantations of Metasequoia glyptostroboides and Bischofia polycarpa change soil fungal and archaeal communities and enhance soil phosphorus availability in Shanghai, China. Ecol. Evol. 2021, 11, 7239–7249. [Google Scholar] [CrossRef] [PubMed]
  44. Wu, X.; Niu, Y.B.; Xun, M.Y.; Jin, J.Y.; Tang, Y.K.; Chen, Y.M. Soil carbon, nitrogen, and phosphorus storages and their stoichiometry due to mixed afforestation with Hippophae rhamnoides in the Loess Hilly Region, China. Forests 2021, 12, 1718. [Google Scholar] [CrossRef]
  45. Feudis, M.D.; Cardelli, V.; Massaccesi, L.; Lagomarsino, A.; Fornasier, F.; Westphalen, D.J.; Cocco, S.; Corti, G.; Alberto Agnelli, A. Influence of altitude on biochemical properties of European beech (Fagus sylvatica L.) forest soils. Forests 2017, 8, 213. [Google Scholar] [CrossRef] [Green Version]
  46. Tessier, J.T.; Raynal, D.J. Vernal nitrogen and phosphorus retention by forest understory vegetation and soil microbes. Plant Soil 2003, 256, 443–453. [Google Scholar] [CrossRef]
  47. Tian, H.Q.; Chen, G.S.; Zhang, C.; Jerry, M.M.; Charles, A.S.H. Pattern and variation of C:N:P ratios in China’s soils: A synthesis of observational data. Biogeochemistry 2010, 98, 139–151. [Google Scholar] [CrossRef]
  48. Hu, Y.L.; Wang, S.L.; Zeng, D.H. Effects of single Chinese fir and mixed leaf litters on soil chemical, microbial properties and soil enzyme activities. Plant Soil 2006, 282, 379–386. [Google Scholar] [CrossRef]
  49. Versini, A.; Mareschal, L.; Matsoumbou, T.; Zeller, B.; Ranger, J.; Laclau, J.P. Effects of litter manipulation in a tropical Eucalyptus plantation on leaching of mineral nutrients, dissolved organic nitrogen and dissolved organic carbon. Geoderma 2014, 233, 426–436. [Google Scholar] [CrossRef]
  50. Ali, J.; Jewel, Z.A.; Mahender, A.; Anandan, A.; Hernandez, J.; Li, Z. Molecular Genetics and Breeding for Nutrient Use Efficiency in Rice. Int. J. Mol. Sci. 2018, 19, 1762. [Google Scholar] [CrossRef] [PubMed] [Green Version]
  51. Wu, H.L.; Xiang, W.H.; Ouyang, S.A.; Xiao, W.F.; Li, S.G.; Chen, L.; Lei, P.F.; Deng, X.W.; Zeng, Y.L.; Zeng, L.X.; et al. Tree growth rate and soil nutrient status determine the shift in nutrient-use strategy of Chinese fir plantations along a chronosequence. For. Ecol. Manag. 2020, 460, 117896. [Google Scholar] [CrossRef]
  52. Liu, B.T.; Han, F.; Ning, P.; Li, H.B.; Rengel, Z. Root traits and soil nutrient and carbon availability drive soil microbial diversity and composition in a northern temperate forest. Plant Soil 2022, 479, 281–299. [Google Scholar] [CrossRef]
  53. Ding, K.; Zhang, Y.T.; Kim, Y.; Tong, Z.K.; Zhang, J.H. The introduction of Phoebe bournei into Cunninghamia lanceolata monoculture plantations increased microbial network complexity and shifted keystone taxa. For. Ecol. Manag. 2022, 509, 120072. [Google Scholar] [CrossRef]
  54. Chen, K.Y.; Hu, L.; Wang, C.T.; Yang, W.G.; Zi, H.B.; Lerdau, M. Herbaceous plants influence bacterial communities, while shrubs influence fungal communities in subalpine coniferous forests. For. Ecol. Manag. 2021, 500, 119656. [Google Scholar] [CrossRef]
  55. Hartmann, M.; Widmer, F. Community structure analyses are more sensitive to differences in soil bacterial communities than anonymous diversity indices. Appl. Environ. Microb. 2006, 72, 7804–7812. [Google Scholar] [CrossRef] [Green Version]
  56. Li, T.; Li, Y.Z.; Shi, Z.; Wang, S.N.; Wang, Z.T.; Liu, Y.; Wen, X.X.; Mo, F.; Han, J.; Liao, Y.C. Crop development has more influence on shaping rhizobacteria of wheat than tillage practice and crop rotation pattern in an arid agroecosystem. Appl. Soil Ecol. 2021, 165, 104016. [Google Scholar] [CrossRef]
  57. Bastida, F.; Hernández, T.; Albaladejo, J.; García, C. Phylogenetic and functional changes in the microbial community of long-term restored soils under semiarid climate. Soil Biol. Biochem. 2013, 65, 12–21. [Google Scholar] [CrossRef]
  58. Bahadori, M.; Wang, J.T.; Shen, J.P.; Lewis, S.; Rezaei Rashti, M.; Chen, C.R. Soil organic matter and geochemical characteristics shape microbial community composition and structure across different land uses in an Australian wet tropical catchment. Land Degrad Dev. 2022, 33, 817–831. [Google Scholar] [CrossRef]
  59. Shang, R.G.; Li, S.F.; Huang, X.B.; Liu, W.D.; Lang, X.D.; Su, J.R. Effects of soil properties and plant diversity on soil microbial community composition and diversity during secondary succession. Forests 2021, 12, 805. [Google Scholar] [CrossRef]
  60. Cheng, H.T.; Zhou, X.H.; Dong, R.S.; Wang, X.M.; Liu, G.D.; Li, Q.F. Priming of soil organic carbon mineralization and its temperature sensitivity in response to vegetation restoration in a karst area of Southwest China. Sci. Total Environ. 2022, 851, 158400. [Google Scholar] [CrossRef] [PubMed]
  61. Hu, L.N.; Li, Q.; Yan, J.H.; Liu, C.; Zhong, J.X. Vegetation restoration facilitates belowground microbial network complexity and recalcitrant soil organic carbon storage in southwest China karst region. Sci. Total Environ. 2022, 820, 153137. [Google Scholar] [CrossRef] [PubMed]
  62. Zhang, Z.F.; Pan, Y.P.; Liu, Y.; Li, M. High-level diversity of basal fungal lineages and the control of fungal community assembly by stochastic processes in mangrove sediments. Appl. Environ. Microb. 2021, 87, e00928-21. [Google Scholar] [CrossRef] [PubMed]
  63. Zhang, M.M.; Wang, N.; Zhang, J.Y.; Hu, Y.B.; Cai, D.J.; Guo, J.H.; Wu, D.; Sun, G.Y. Soil physicochemical properties and the rhizosphere soil fungal community in a mulberry (Morus alba L.)/alfalfa (Medicago sativa L.) intercropping system. Forests 2019, 10, 167. [Google Scholar] [CrossRef] [Green Version]
  64. Dzurendova, S.; Zimmermann, B.; Tafintseva, V.; Kohler, A.; Ekeberg, D.; Shapaval, V. The influence of phosphorus source and the nature of nitrogen substrate on the biomass production and lipid accumulation in oleaginous Mucoromycota fungi. Appl. Microbiol. Biot. 2020, 104, 8065–8076. [Google Scholar] [CrossRef]
  65. Smith, S.E.; Read, D. Mycorrhizal Symbiosis, 3rd ed.; Academic Press: New York, NY, USA, 2008; pp. 145–187. [Google Scholar]
  66. Mensah, J.A.; Koch, A.M.; Antunes, P.M.; Kiers, E.T.; Hart, M.; Heike, B. High functional diversity within species of arbuscular mycorrhizal fungi is associated with differences in phosphate and nitrogen uptake and fungal phosphate metabolism. Mycorrhiza 2015, 25, 533–546. [Google Scholar] [CrossRef]
  67. Koskey, G.; Mburu, S.W.; Awino, R.; Njeru, E.M.; Maingi, J.M. Potential use of beneficial microorganisms for soil amelioration, phytopathogen biocontrol, and sustainable crop production in smallholder agroecosystems. Front. Sustain. Food Syst. 2021, 5, 606306. [Google Scholar] [CrossRef]
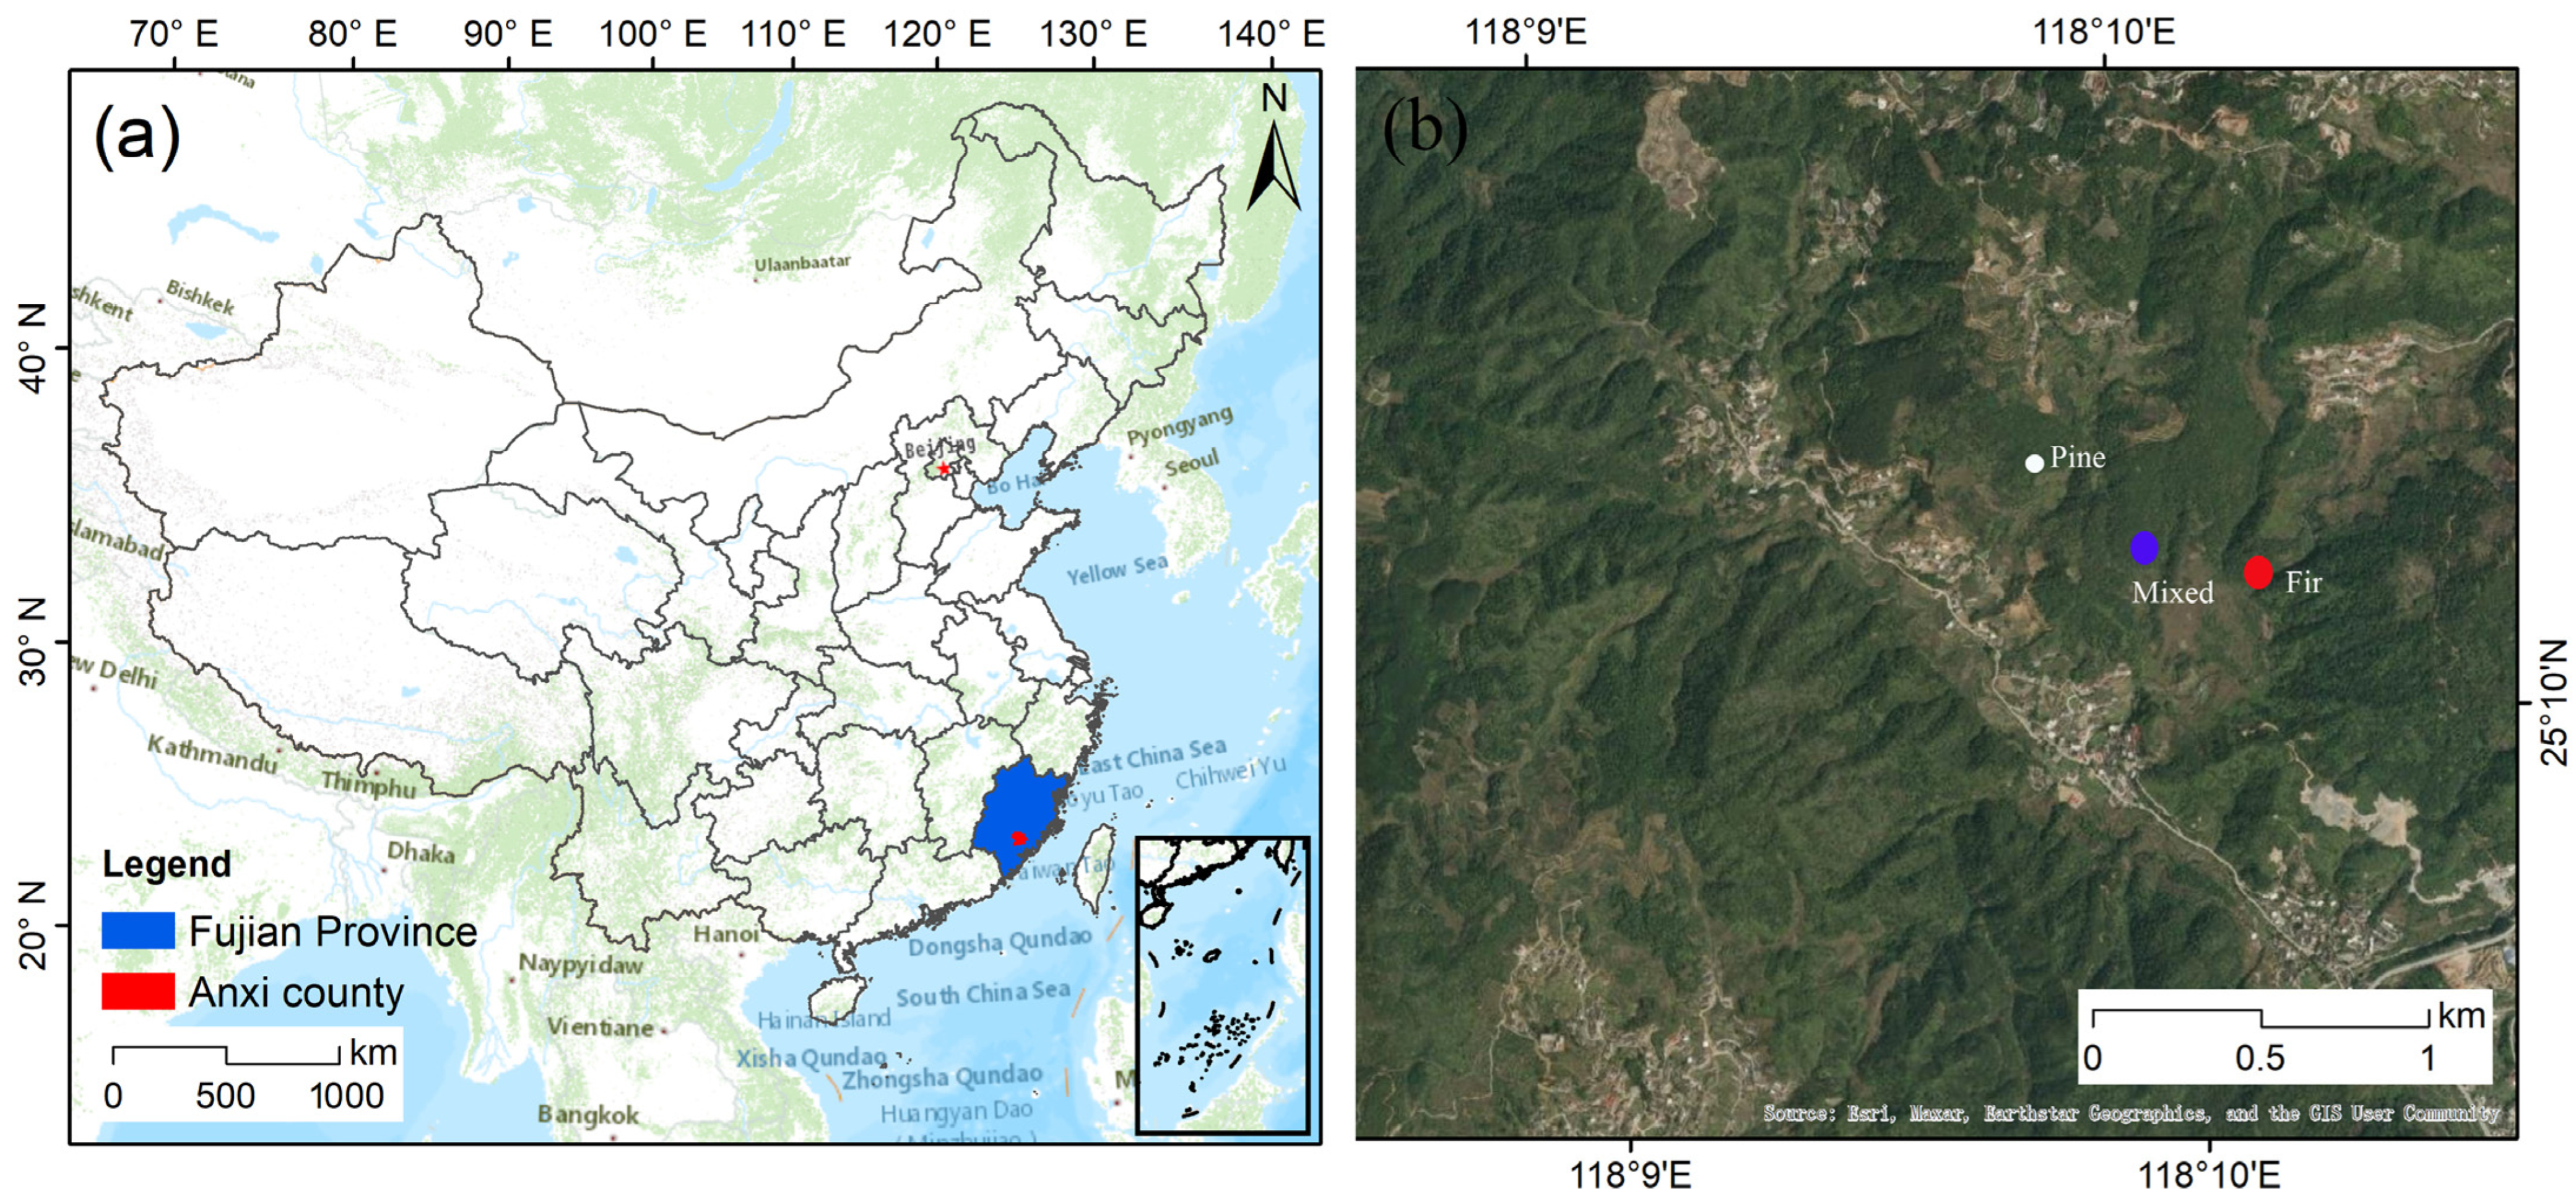
Figure 1. Study site map (a) and layout of sampling plots (b). Fir, pure C.lanceolata forest; Pine, pure Pinus forest; Mixed, mixed forest of C. lanceolata and Pinus.
Forests 14 00432 g001
Figure 2. Experimental plots and vegetation indexes of pure forest and mixed forest, (A): Fir, pure C. lanceolata forest; (B): Pine, pure Pinus forest; (C): Mixed, mixed forest of C. lanceolata and Pinus; (D): relative normalized difference vegetation index (NDVI) value; the NDVI values are mean values of these selected rectangles, different letters (a–c) indicate significant differences at the 0.05 level; Mied Fir: C. lanceolata in Mixed; Mixed Pine: Pinus in Mixed. The red rectangles denote Chinese fir and the black rectangles denote Pinus.
Forests 14 00432 g002
Figure 3. Diversity and composition of soil fungi in pure and mixed forest. (A) Venn diagram of fungal OTU numbers, (B) principal coordinate analysis (PCoA) ordination of soil fungi, (C) redundancy analysis (RDA) of the fungal community structure and soil chemical properties. The red and blue arrows indicate soil chemical properties and the two most abundant fungal phyla, respectively. Soil chemical properties depicted in blue exhibited a significant correlation with fungal communities (p < 0.05). (D) Variations in the taxonomic composition of fungal communities at the phylum level; red text represents significant differences at the 0.05 level. SOC: soil organic carbon; TN: total nitrogen; C:N: C:N ratio; N:P: N:P ratio; TP: total phosphorus; AK: available potassium.
Forests 14 00432 g003
Figure 4. Fungal functional guilds and their correlation with soil chemistry. (A) The relative read abundance of annotated fungal functional guilds in pure and mixed forest. The guilds with a relative read abundance of <1% were combined and grouped as others; letters in blue are symbiotrophs, purple are saprotrophs, green are pathotrophs, black are complex nutrient types and the red rectangles represent significant differences at the 0.05 level. (B) Correlation between OTUs of fungal functional guilds and soil chemical properties (p < 0.05). Blue and yellow represent positive and negative differences between samples. M1: Ectomycorrhizal; M2: Ericoid mycorrhizal; M3: Lichenized; M4: Plant pathogen; M5: Animal pathogen-fungal parasite-undefined saprotroph; M6: Ectomycorrhizal-fungal parasite-plant saprotroph-wood saprotroph; M7: Endophyte-litter Saprotroph-soil saprotroph-undefined saprotroph; M8: Arbuscular mycorrhizal; M9: Wood saprotroph; SOC: soil organic carbon; TN: total nitrogen; C:N: C:N ratio; N:P: N:P ratio; TP: total phosphorus; K: available potassium (AK).
Forests 14 00432 g004
Table 1. Basic conditions of the experimental forest stand.
Forest TypeTree SpeciesStand
Age (years)
Elevation/mAverage DBH (cm)Average Tree Height (m)Density (ha−1)
FirCunninghamia lanceolata2750019.613.61604
PinePinus massoniana2355512.914.21689
MixedPinus massoniana
Cunninghamia lanceolata
2465025.317.01868
Elevation is above sea level; DBH: diameter at breast height; Fir: pure C.lanceolata forest; Pine: pure Pinus forest; Mixed: mixed forest of C. lanceolata and Pinus.
Table 2. Content of macroelements in soils of different forest types.
SOC (g kg−1)TN (g kg−1)C:N RatioN:P RatioTP (g kg−1)AK (mg kg−1)
Fir11.8 ± 3.11 b0.87 ± 0.32 b13.9 ± 1.48 a1.87 ± 0.46 b0.46 ± 0.05 a0.10 ± 0.02 ab
Pine19.2 ± 1.90 a1.54 ± 0.06 a12.4 ± 1.13 ab4.28 ± 0.34 b0.36 ± 0.04 b0.15 ± 0.07 a
Mixed18.1 ± 3.83 a1.64 ± 0.44 a11.2 ± 1.02 b7.46 ± 2.07 a0.22 ± 0.03 c0.04 ± 0.03 b
TG1 [17]13.331.0//0.60.18
TG2 [41]6.3–11.40.18–0.57//0.15–0.27/
Values are means ± standard error and means followed by different letters in the same column significantly different at the 0.05 level. Fir: pure C. lanceolata forest; Pine: pure Pinus forest; Mixed: mixed forest of C. lanceolata and Pinus; TG1: tea garden; TG2: non-ecological tea garden. SOC: soil organic carbon; TN: total nitrogen; TP: total phosphorus; AK: available potassium.
Disclaimer/Publisher’s Note: The statements, opinions and data contained in all publications are solely those of the individual author(s) and contributor(s) and not of MDPI and/or the editor(s). MDPI and/or the editor(s) disclaim responsibility for any injury to people or property resulting from any ideas, methods, instructions or products referred to in the content.